Article

Density Estimation by Drilling Resistance Technique to Determine the Dynamic Modulus of Elasticity of Wooden Members in Historic Structures

1
CNR IBE, Institute of BioEconomy, 50019 Sesto Fiorentino, Italy
2
Department of Forest and Wood Science, Stellenbosch University, Stellenbosch 7599, South Africa
*
Author to whom correspondence should be addressed.
Forests 2023, 14(6), 1107; https://doi.org/10.3390/f14061107
Submission received: 12 April 2023 / Revised: 11 May 2023 / Accepted: 24 May 2023 / Published: 26 May 2023
(This article belongs to the Special Issue Wood as Cultural Heritage Material)

Abstract

:
(1) The assessment of the mechanical properties of old timber is essential for the proper maintenance of wooden structures. (2) Among the non-destructive properties, the dynamic modulus of elasticity is one of the best predictors of the mechanical characteristics of the members, but it requires the determination of wood density to be determined. (3) Thus, wood density was estimated by drilling resistance measurements, developing species-specific prediction equations for silver fir, chestnut and poplar. (4) The estimated density was combined with the stress wave velocity propagating longitudinally through the wooden piece, and the dynamic modulus of elasticity was calculated. (5) Medium-high coefficient determinations (R2 from 0.79 to 0.94) were found for density estimation, and medium coefficient determinations (R2 from 0.53 to 0.60) were found for the estimation of the static modulus of elasticity using the dynamic modulus.

1. Introduction

The assessment of the mechanical properties of wooden elements is a crucial step for the correct conservation of existing ancient timber structures [1]. An underestimation would lead to useless substitutions, which could even be negative from an art-historical point of view; an overestimation may not guarantee structural safety.
Clearly, such an assessment should be conducted non-destructively, and the performance of the material should be estimated as accurately as possible. To this aim, several techniques could be applied, from a visual inspection of the strength-reducing defects of the timber (visual strength grading) to the measurement of properties that, visually, are not easily detectable by means of non-destructive (NDT) or semi-destructive instruments (SDT) [2]. A combination of several techniques is not only feasible but also advisable [3].
One of the properties that can be measured non-destructively, which is highly correlated with the strength and stiffness of wood, is the dynamic modulus of elasticity (MOE) [4]. It is calculated by combining the density of the timber piece and the velocity of a sound or stress wave that propagates through the material longitudinally or transversally to the grain direction. These two variables (density and velocity) are therefore necessary.
The easiest and most direct way to measure the density of a timber piece is to weigh it and to calculate its volume from a geometry survey. The density will be the ratio of weight to volume. Unfortunately, this is not possible in existing structures, for which density needs to be estimated. To this aim, several techniques have been tested and proposed, including, e.g., core drilling, screw withdrawal, needle penetration resistance and the analysis of the residue of a conventional drill [5,6,7]. According to the cited literature, these methods have been proven to be suitable for estimating the density of the wooden elements in situ but still require the extraction of material (coring was found to be the best method, and, of course, the bigger the core, the higher the correlation with the density) or only evaluate a relatively superficial area of the beam (needle penetration or screw withdrawal).
On the contrary, the resistance drilling method consists of the drilling of a small-diameter rotating needle into the timber, registering the energy consumption due to the resistance to the penetration. The lower the energy required and the resistance of material, the lower its density or consistency. Usually, the hole resulting from the penetration does not exceed 3 mm in diameter, for it is considered invasive but non-destructive. Moreover, it can easily sample the whole cross-section (most of the instruments can drill up to 40 cm in depth).
The drilling resistance technique is widely used and generally recognized as effective to assess localized damages and degraded areas inside a timber element. The effect of biodegradation by rot fungi on drilling resistance has been studied in the past [8], and recent attempts have assessed the superficial degradation of wood due to boring insects [9].
In general, drilling resistance is largely accepted as a qualitative and local test method, usually for degradation detection [10]. Nevertheless, many authors have proposed and tested it to quantitatively estimate wood density both on standing trees as an important trait for breeding and clonal selection [11,12,13,14] and on solid wood members [15].
Keeping to the subject of load-bearing wooden structures, typically, the aim was to predict the mechanical properties of the timber elements directly from the density estimation (this being usually correlated with the mechanical characteristics) [16] or by predicting the mechanical performance directly from the resistance to the drilling [17,18,19,20].
The main objection to this approach, in addition to the fact that it has only been verified on small-clear specimens, is that drillings are local measurements that do not take into consideration the totality of the element, global defects or characteristics [20]. A density estimation of the whole timber element could be improved by increasing the number of drillings in different positions along its length, as demonstrated for other local test methods [6], while a global assessment of the mechanical quality of the beam can be given by the velocity of the stress wave propagating through it. This property also results from the strength-reducing defects of the timber, and it can be measured on site [21].
The aim of this work is, therefore, to estimate the density of the wooden element by means of drilling resistance measurements as an essential step to be combined with the velocity of a stress wave, which propagates through the wood fibers, and, thus, to derive the dynamic MOE, which is an effective predictor of the mechanical properties of the beam. The experimental campaign was performed on full-size timber elements, and the estimation was compared with the laboratory-measured dynamic MOE and the static MOE. Some suggestions for the practical applications of this procedure in situ are given as well, and the interval of prediction is reported too.

2. Materials and Methods

2.1. Material

The experimental work was conducted on 19 silver fir (Abies alba Mill.), 6 sweet chestnut (Castanea sativa Mill.) and 3 poplar (Populus spp.) elements. They constituted the wooden material used in a late-nineteenth-century roof located in central Italy that was dismantled for restoration. The beams had a rectangular cross-section with dimensions ranging from 170 × 180 mm2 to 290 × 300 mm2, and the total length varied from 4000 to 6700 mm. Still, the geometry was rather irregular due both to the presence of wane and to the uneven woodworking.

2.2. Non-Destructive Measurements

2.2.1. Drilling Resistance

An IML-RESI PD400 (IML Instrumenta Mechanik Labor System GmbH, Wiesloch, Germany) equipped with center-spiked tip drill bits was used for the drilling resistance measurements.
Three to five cross-sections were marked in each beam: two at the ends, one at mid-length and two in between the middle and the end. The cross-sections were always at equal distance, so to divide the length in equal parts. In correspondence with each of the sections, two orthogonal drillings were made, one horizontally and the other vertically, starting from the center of one face of the beam and ending outside the opposite face (Figure 1).
During the whole survey, the settings of the instrument were kept constant: the feed rate was set to 1000 mm/minute. and the rotational speed was set to 2500 rotations per minute. Attention was paid to always using bits with optimal sharpening to prevent wear from affecting the drilling resistance measurements [22].

2.2.2. Dynamic Modulus of Elasticity

The time (time of flight, ToF) needed for the longitudinal propagation of a sound wave between two sensors (transmitter and receiving) was measured by Microsecond Timer (Fakopp, Sopron, Hungary). The wave was generated by a hammer (impact-induced). For each timber element, nine measurements were registered: four with the sensors placed in the lateral surfaces with an inclination of 45° and five in the two ends (end-to-end) (Figure 2).
The velocity of the stress wave was calculated by dividing the distance between the sensors and the time of the wave propagation.
At the same time, the natural frequency of vibration in the longitudinal direction was measured by means of an industrial device, which was certified as a strength grading machine (ViSCAN portable by MiCROTEC, Bressanone, Italy). The beams were placed on supports, and a percussion provided the excitation necessary to cause vibration; the natural frequency of vibration was measured by a non-contact laser interferometer. The weight and dimensions of each element were also measured, and the velocity of the stress wave was calculated by multiplying the frequency by two times the length of the piece.
The dynamic MOE was then calculated as follows:
E d y n = ρ   v 2
where ρ was the density determined either by drilling resistance (estimated as described in the following) or calculated as the weight-to-volume ratio of the entire beam; v was the stress wave velocity measured either by the Microsecond Timer or ViSCAN machine. The volume of each beam was calculated by approximating the five cross-sections measured (see drilling resistance measurements) to irregular octagons [24] and, afterwards, modeling 3D solid merging flat faces between the cross-sections [23].

2.3. Destructive Tests

Four-point bending tests (Figure 3) were carried out in accordance with the European standard EN 408 [25] in order to measure the local static MOE. The timber elements were simply supported over a span of 18 times the nominal depth at mid-span, and the load was applied symmetrically at two-thirds of the total span. For only two elements of insufficient length, the external thirds were 4.5 and 5 times the nominal depth. The central third was always 6 times the nominal depth.
The local deformation was measured in the middle third, at the center of a gauge that had a length of 5 times the nominal depth, in the neutral axis on both sides of the timber piece, and the mean of the two measures was used to calculate the MOE (Equation (2)):
E = a l 1 2 F 16 I w
where a is the distance between the load point and the nearest support, l1 is the central gauge length, ∆F is the applied load increment, I is the second moment of area of the mid-span cross-section, and ∆w is the deformation increment.
After testing, specimens (50 mm long) of the full cross-section were cut corresponding with the drilling resistance measurements. The specimens were measured for thickness, weighed and scanned at high resolution. The area of the cross-section was then measured on the scanned image, and the wood density of each specimen was calculated (weight-to-volume ratio).
In the same way the scanned image of the full cross-section cut from the mid-span of the bending test was imported in Autodesk® AutoCAD (Version 2018, San Rafael, CA, USA) to determine the second moment of area of the real section to be used in Equation (2) [24].
Finally, the small specimens were dried to constant mass at a temperature of 103 ± 2 °C and weighed to calculate the moisture content as the percentage of water mass on the oven-dried mass of the test piece.

2.4. Data Analysis

Drilling resistance data were downloaded from the instrument using PD-Tools PRO software (Version 2020, IML Instrumenta Mechanik Labor GmbH, Wiesloch, Germany) and further processed. Drilling resistance consists of the energy consumption required by the tool to drill the wood, recorded every 0.1 mm of drilling depth and reported in percentage values.
The linear regression analysis was performed with the wood density of the cross-section specimens as the dependent variable and the mean of the drilling resistance values obtained in the two orthogonal drilling per specimen as the independent variable. The coefficient of determination, the confidence interval and the prediction interval (p = 0.05) were all calculated.
Linear relationships were also calculated between dynamic and static MOE.

3. Results and Discussions

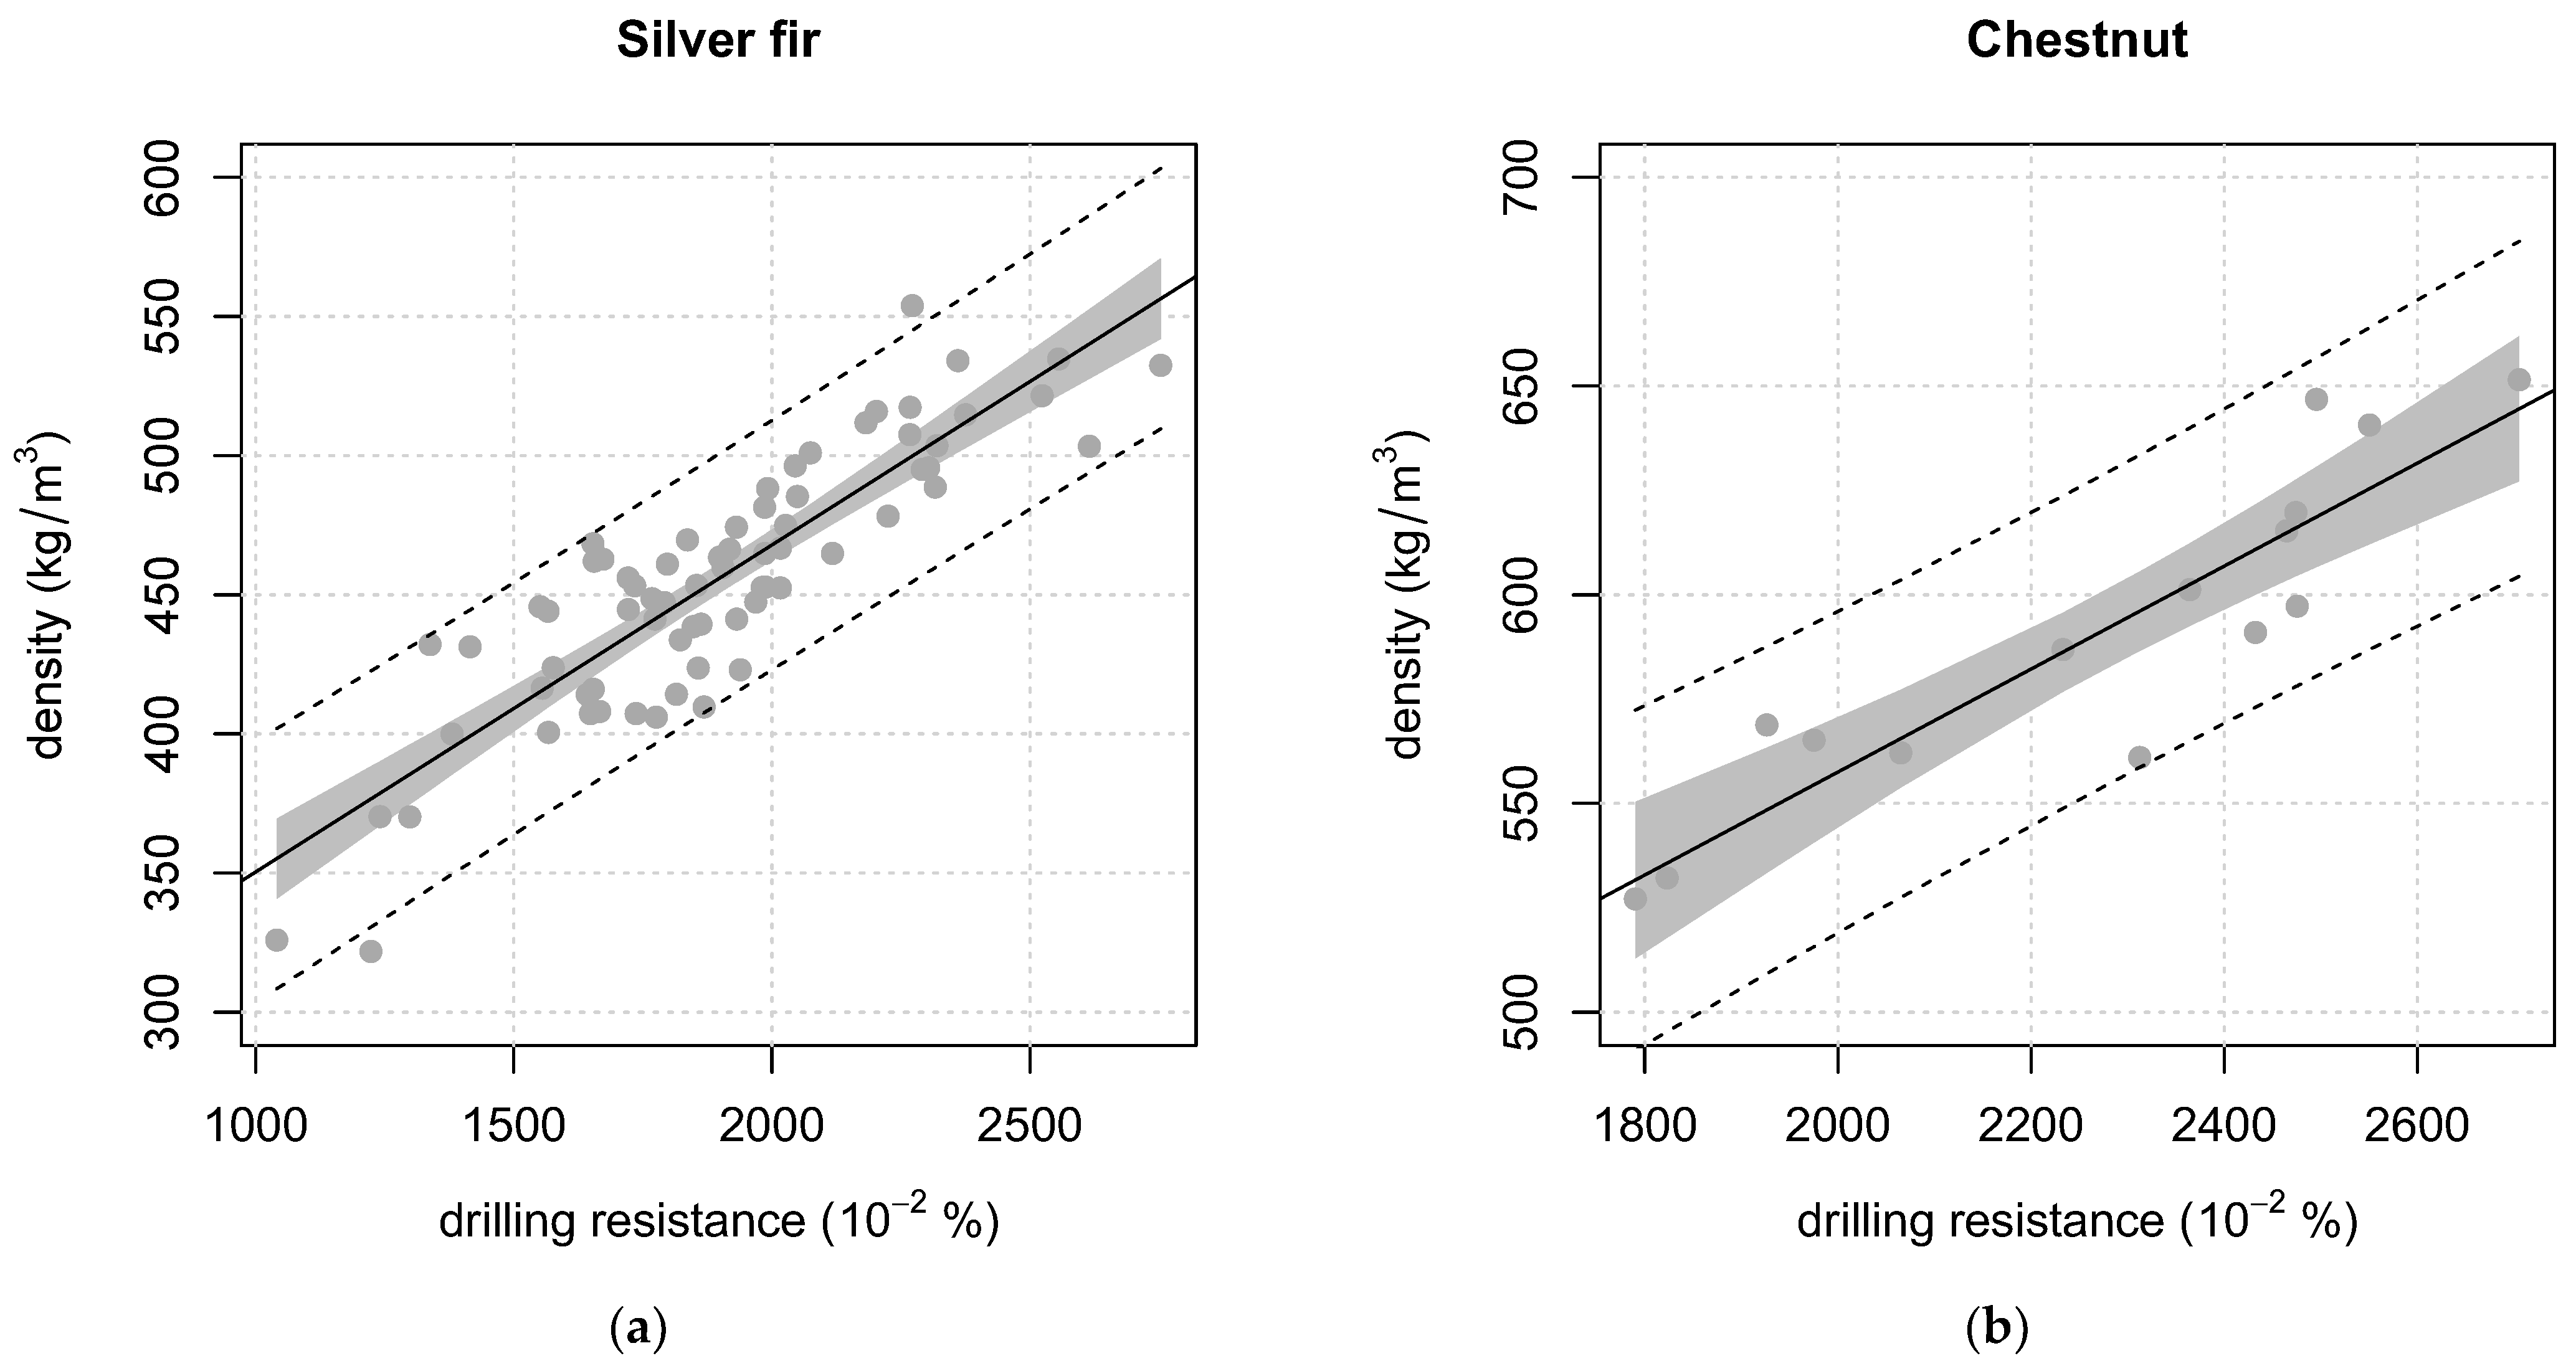
3.1. Density Estimation

The density values of the full cross-section specimens cut after destructive tests are reported in Table 1. The wood moisture content of the beams at the time of the tests was 11.2 ± 0.7, which was close to the reference values of 12%, so no correction for moisture content was performed on the experimental data.
Overall, fir showed an average density of 454 kg/m3 with a coefficient of variation of 8%, chestnut showed an average density of 584 kg/m3 with a 7% variation, and poplar showed an average density of 448 kg/m3 with a 9% variation. The values were very similar to those observed for newly sawn material of the same species sampled in Italy: 580 kg/m3 for chestnut and 440 kg/m3 for silver fir, with very similar coefficients of variation (8%) [26,27]. For poplar, the comparison is more difficult because, at times, reference data are available mostly for cultivated clones, which might be likely to have a lower density [28].
Table 1 reports the data for a single element (results of three to five measurements for each piece), highlighting the variability inside the beams, which is sometimes as high as between elements.
In Table 2 and Figure 4, the results of the linear regression analysis between wood density (response variable) and drilling resistance (predictor) are shown. The analysis was conducted separately for the three species.
The equations of fir and chestnut had the same coefficients but different intercepts, whereas the equation of poplar differed completely from the other two. It is therefore recommended to use the species-specific model to obtain reliable results.
The coefficients of determination were medium-high, and the interval of prediction, for all three species, was very close to the range of variation of the intra-element density (Table 1).
A comparison with the literature is extremely difficult because of the very high specificity of each study. A different drilling instrument could have been used, as well as different feed rates or rotational speed setups, which would have returned different results in the same way a different drill bit might have. Finally, the most of the studies focused on small clear specimens and different timber species [3,10,16,29,30].
For the same reason, other authors warned against the use of equations reported in the literature and proposed the sampling of a small core (2 cm deep) to “calibrate” the drilling measurement [31]. As a drawback, this procedure still requires the extraction of material, and, often, the external surfaces of an old timber member could not be representative of the inner material because of insect degradation. However, this last approach should be considered for future development, as well as the use of equations built on the same species and with the same operational parameters (instrument, operational setup and drill bit).
Generally, the coefficients of determination reported in the previous studies were medium-high, like those for the present experiment, leading to a promising development of the drilling technique as a useful instrument to predict timber density.
Other factors to be taken into account but that do not affect the present study are the friction during drilling [32] and the moisture content [33]. The first will result in higher resistance values with the increase in the drilling depth; therefore, it should be considered (and corrected if noted), particularly with high density timber or high moisture content values. This phenomenon was not observed in the present sampling.
Lastly, the effect of the moisture on drilling resistance is different when moving below or above the fiber saturation point. Thus, the prediction of wood density could be modeled differently in these two stages [34].

3.2. Calculation of the Dynamic Modulus of Elasticity

The values of the wave velocity obtained end-to-end and on the lateral faces are reported in Table 3. Unfortunately, the measurements for two chestnut members were not available, so they were excluded from the following analysis.
As a first observation, the two measuring points (end-to-end and lateral faces) agreed satisfactorily: the end-to-end velocity was on average 3% higher than the face velocity. A similar ratio between the two methods was reported previously in pine [35,36] and spruce [37].
Looking at the variability of the measurements, the coefficients of variation were low: they were, on average, 1.6% for the face velocity and 1.5% for the end-to-end velocity (Table 3). The values detected for elements C1 and C2 were an exception (underlined in Table 3). For C1, the greatest variation was given by the lower velocity registered on one face, where the presence of a top rupture was observed. Similarly, in C2, a lower velocity was measured on two consecutive faces due to the presence of rot fungi decay. In both elements, by repeating the sonic tests on these faces but excluding the extremity in question, the velocity values and the CVs return to medium levels (CV = 2.75%), which is a possible indication of the localized influence of damages in reducing the speed of the mechanical wave when they are located in the path of the sound wave.
All the above observations are meaningful to the practical applicability of the technique in situ, in which the ends are typically hidden and the lateral faces are the only accessible surfaces to perform the test. In our experiment, the lateral velocity was measured on all four faces of each element, this scenario being the optimal procedure. Obviously, on site, one or more faces could be hardly accessible; however, it is recommended to measure as many faces as possible, particularly if the members have a large cross-section, due to the relatively limited depth reached by the probes.
The lateral face velocity was combined with the density estimated from the drilling resistance according to the models described in the previous paragraph (Table 2) to calculate the dynamic MOE (Equation (1)). Then, it was compared with the dynamic MOE obtained by the frequency of vibration measured by a certified grading machine (ViSCAN) and the density as the result of the entire beam weight-to-volume ratio. The relationship is shown in Figure 5a.
Overall, the two techniques were in good agreement with each other, with a coefficient of determination of 0.83. The velocity measured by the Microsecond Timer was on average 6% higher than the ViSCAN velocity.
A similar analysis was conducted with the static modulus of elasticity (Figure 5, right). The goodness of prediction lowered (R2 = 0.53), but it was comparable with that reported for the newly sawn [26] and old timber [38].
In particular, the mechanical properties of hardwoods are more difficult to predict if compared to softwood, and this is particularly true for chestnut [39,40]. Indeed, when calculating the linear regression only for silver fir, the coefficient of determination rose to 0.60. Very similar coefficients were reported previously for spruce and fir elements dismantled from existing buildings in central Italy [4,41].
Regarding the stiffness values, on average, the dynamic MOE determined by the Microsecond Timer was 40% higher than the static MOE. On the other hand, the dynamic MOE measured by the natural frequency of vibration (ViSCAN) was about 10% higher than the static modulus.
The beams under study were characterized by degradation due to insect attacks in the external part of the section (from 5 to 20 mm depth), as described in previous publications involving the same experimental material [9,24]. Considering the ToF measurements, they most likely involve only part of the cross-section area; i.e., going beyond the degraded external area, they give information primarily on internal sound material, thus overestimating the characteristics of the whole beam. The frequency, on the other hand, returns a measurement that reflects the average characteristics of the cross-section.
In this sense, Degl’Innocenti et al. [23] modeled bending behavior by applying the theory on a composite beam made of two materials with different mechanical properties (the internal sound material and the external degraded material). In that study, a reduction factor equal to 5 was suggested to cautiously estimate the characteristics of degraded wood from the properties of the sound material. By applying this theory in the calculation of the static modulus, an average ratio between the dynamic MOE by ToF and the static MOE equal to approximately 1.18 was obtained. The overestimation of the ToF technique, therefore, is reduced if the cross-section is not calculated as entirely sound wood, thus supporting the hypothesis that the evaluation by the instrument is roughly circumscribed to the area reached by the sensors.

4. Conclusions

The estimation of wood density by means of the drilling resistance technique gave more than satisfactory results: the developed equations allow the prediction of density from the drilling measurements with a prediction interval that falls within its range of variability inside the single timber element.
According to these results, the drilling resistance technique is very promising and makes it possible to predict density in situ without the need to remove material from the members. Furthermore, with relatively little effort, it can give a better estimate by increasing the number of measurements distributed along the length of the element. However, as a drawback, the equations given here were based on relatively few specimens, especially for chestnut and poplar; therefore, their use should be considered with caution, and their applicability to different timber elements should be tested.
In the same way, great care must be taken to standardize the instrument settings for the development of the equations (rotational speed and feed rate of the tool, type of drill bit and moisture content of the wood), to avoid defects or degraded areas in the wood and to maintain straight and non-deviated profiles during the drilling measurements. Additionally, a species-specific equation should be used to avoid unreliable results. A valid suggestion could be to create specific models to “calibrate” the use of the instrument to the situations and wood species that the user is typically facing.
Keeping these precautions in mind, the density estimate, combined with the use of portable instruments, allows to determine the dynamic modulus of elasticity in situ. The results were in good agreement with measurements from laboratory instruments (certified grading machines, which are commonly used for the strength grading of structural timber) and, specifically, with the measurement of the density of the whole element.
Additionally, with the presented procedure, the dynamic MOE can be determined, and the static MOE can be estimated, but several measurements of sound velocity are recommended in the same beam since the evaluation is limited to the area reached by the sensors, which cannot be considered an average of the whole cross-section.
Finally, as a conclusive remark, attention should be paid to the fact that the proposed procedures were all applicable in situ and that they were operated in disassembled elements and in laboratory conditions. The effect of the load on the timber members in situ has not yet been sufficiently studied, either on resistance drilling profiles or on sonic measurements.

Author Contributions

Conceptualization, M.B. and M.N.; methodology, M.B., M.N. and G.A.; investigation, M.B. and G.A.; formal analysis, M.N.; writing—original draft preparation, M.B., M.N. and M.V.; writing—review and editing, M.B., M.N. and M.V.; funding acquisition, M.B. and M.N. All authors have read and agreed to the published version of the manuscript.

Funding

The work was realized in the framework of DRESL project cod. 11430.27102016.099000169 and financed in the POR CREO FESR 2014–2020 program by the Toscana region.

Data Availability Statement

Third-party data.

Acknowledgments

The experimental material is from the Villa Medicea of Cafaggiolo (Florence, Italy) kindly made available by Cafaggiolo srl of Barberino di Mugello (Florence, Italy). The authors want to thank Massimo Mannucci of LegnoDOC srl, C-SIX srl and Impresa Aliberto Saccenti di Luca Saccenti sas as partners of the project.

Conflicts of Interest

The authors declare no conflict of interest. The funders had no role in the design of the study; in the collection, analyses or interpretation of data; in the writing of the manuscript; or in the decision to publish the results.

References

  1. Cruz, H.; Yeomans, D.; Tsakanika, E.; Macchioni, N.; Jorissen, A.; Touza, M.; Mannucci, M.; Lourenço, P.B. Guidelines for On-Site Assessment of Historic Timber Structures. Int. J. Archit. Herit. 2015, 9, 277–289. [Google Scholar] [CrossRef]
  2. Machado, J.S.; Riggio, M.; D’Ayala, D. Assessment of Structural Timber Members by Non- and Semi-Destructive Methods. Constr. Build. Mater. 2015, 101, 1155–1156. [Google Scholar] [CrossRef]
  3. Feio, A.; Machado, J.S. In-Situ Assessment of Timber Structural Members: Combining Information from Visual Strength Grading and NDT/SDT Methods—A Review. Constr. Build. Mater. 2015, 101, 1157–1165. [Google Scholar] [CrossRef]
  4. Cavalli, A.; Togni, M. How to Improve the On-Site MOE Assessment of Old Timber Beams Combining NDT and Visual Strength Grading. Nondestruct. Test. Eval. 2013, 28, 252–262. [Google Scholar] [CrossRef]
  5. Llana, D.F.; Íñiguez-González, G.; Montón, J.; Arriaga, F. In-Situ Density Estimation by Four Nondestructive Techniques on Norway Spruce from Built-in Wood Structures. Holzforschung 2018, 72, 871–879. [Google Scholar] [CrossRef]
  6. Osuna-Sequera, C.; Llana, D.F.; Esteban, M.; Arriaga, F. Improving Density Estimation in Large Cross-Section Timber from Existing Structures Optimizing the Number of Non-Destructive Measurements. Constr. Build. Mater. 2019, 211, 199–206. [Google Scholar] [CrossRef]
  7. Martínez, R.; Calvo, J.; Arriaga, F.; Bobadilla, I. In Situ Density Estimation of Timber Pieces by Drilling Residue Analysis. Eur. J. Wood Prod. 2018, 76, 509–515. [Google Scholar] [CrossRef]
  8. Sharapov, E.; Brischke, C.; Militz, H.; Smirnova, E. Effects of White Rot and Brown Rot Decay on the Drilling Resistance Measurements in Wood. Holzforschung 2018, 72, 905–913. [Google Scholar] [CrossRef]
  9. Nocetti, M.; Mannucci, M.; Brunetti, M. Automatic Assessment of Insect Degradation Depth in Structural Solid Wood Elements by Drilling Resistance Measurements. Constr. Build. Mater. 2023, 366, 130273. [Google Scholar] [CrossRef]
  10. Nowak, T.P.; Jasieńko, J.; Hamrol-Bielecka, K. In Situ Assessment of Structural Timber Using the Resistance Drilling Method—Evaluation of Usefulness. Constr. Build. Mater. 2016, 102, 403–415. [Google Scholar] [CrossRef]
  11. Isik, F.; Li, B. Rapid Assessment of Wood Density of Live Trees Using the Resistograph for Selection in Tree Improvement Programs. Can. J. For. Res. 2003, 33, 2426–2435. [Google Scholar] [CrossRef]
  12. Ukrainetz, N.K.; O’Neill, G.A. An Analysis of Sensitivities Contributing Measurement Error to Resistograph Values. Can. J. For. Res. 2010, 40, 806–811. [Google Scholar] [CrossRef]
  13. Johnstone, D.; Ades, P.; Moore, G.M.; Smith, I.W. Using an IML-Resi Drill to Assess Wood Density in Eucalyptus globulus Subsp. Pseudoglobulus. Aust. For. 2011, 74, 190–196. [Google Scholar] [CrossRef]
  14. Bouffier, L.; Charlot, C.; Raffin, A.; Rozenberg, P.; Kremer, A. Can Wood Density Be Efficiently Selected at Early Stage in Maritime Pine (Pinus pinaster Ait.)? Ann. For. Sci. 2008, 65, 106. [Google Scholar] [CrossRef]
  15. Rinn, F.; Schweingruber, F.H.; Schär, E. Resistograph and X-Ray Density Charts of Wood. Comparative Evaluation of Drill Resistance Profiles and X-Ray Density Charts of Different Wood Species. Holzforschung 1996, 50, 303–311. [Google Scholar] [CrossRef]
  16. Ceraldi, C.; Mormone, V.; Ermolli, E.R. Resistographic Inspection of Ancient Timber Structures for the Evaluation of Mechanical Characteristics. Mater. Struct. 2001, 34, 59–64. [Google Scholar] [CrossRef]
  17. Feio, A.O.; Lourenço, P.B.; Machado, J.S. Non-Destructive Evaluation of the Mechanical Behavior of Chestnut Wood in Tension and Compression Parallel to Grain. Int. J. Archit. Herit. 2007, 1, 272–292. [Google Scholar] [CrossRef]
  18. Lourenço, P.B.; Feio, A.O.; Machado, J.S. Chestnut Wood in Compression Perpendicular to the Grain: Non-Destructive Correlations for Test Results in New and Old Wood. Constr. Build. Mater. 2007, 21, 1617–1627. [Google Scholar] [CrossRef]
  19. Calderoni, C.; De Matteis, G.; Giubileo, C.; Mazzolani, F.M. Experimental Correlations between Destructive and Non-Destructive Tests on Ancient Timber Elements. Eng. Struct. 2010, 32, 442–448. [Google Scholar] [CrossRef]
  20. Branco, J.M.; Piazza, M.; Cruz, P.J.S. Structural Analysis of Two King-Post Timber Trusses: Non-Destructive Evaluation and Load-Carrying Tests. Constr. Build. Mater. 2010, 24, 371–383. [Google Scholar] [CrossRef]
  21. Dackermann, U.; Crews, K.; Kasal, B.; Li, J.; Riggio, M.; Rinn, F.; Tannert, T. In Situ Assessment of Structural Timber Using Stress-Wave Measurements. Mater. Struct. 2014, 47, 787–803. [Google Scholar] [CrossRef]
  22. Sharapov, E.; Wang, X.; Smirnova, E.; Wacker, J.P. Wear Behaviour of Drill Bits in Wood Drilling Resistance Measurements. Wood Fiber Sci. 2018, 50, 154–166. [Google Scholar] [CrossRef]
  23. Degl’Innocenti, M.; Nocetti, M.; Kovačević, V.C.; Aminti, G.; Betti, M.; Lauriola, M.P.; Brunetti, M. Evaluation of the Mechanical Contribution of Wood Degraded by Insects in Old Timber Beams through Analytical Calculations and Experimental Tests. Constr. Build. Mater. 2022, 339, 127653. [Google Scholar] [CrossRef]
  24. Nocetti, M.; Aminti, G.; Degl’Innocenti, M.; Brunetti, M. Geometric Representation of the Irregular Cross-Section of Old Timber Elements: Comparison of Different Approaches for Mechanical Characterisation. Constr. Build. Mater. 2021, 304, 124579. [Google Scholar] [CrossRef]
  25. EN 408; Timber Structures. Structural Timber and Glued Laminated Timber. Determination of Some Physical and Mechanical Properties. CEN—European Committee for Standardization: Brussels, Belgium, 2012.
  26. Nocetti, M.; Bacher, M.; Brunetti, M.; Crivellaro, A.; van de Kuilen, J.W.G. Machine Grading of Italian Structural Timber: Preliminary Results on Different Wood Species. In Proceedings of the World Conference on Timber Engineering, WCTE, Riva del Garda, Italy, 20–24 June 2010; pp. 285–292. [Google Scholar]
  27. Nocetti, M.; Brancheriau, L.; Bacher, M.; Brunetti, M.; Crivellaro, A. Relationship between Local and Global Modulus of Elasticity in Bending and Its Consequence on Structural Timber Grading. Eur. J. Wood Prod. 2013, 71, 297–308. [Google Scholar] [CrossRef]
  28. Castro, G.; Paganini, F. Mixed Glued Laminated Timber of Poplar and Eucalyptus Grandis Clones. Holz Roh-Werkstoff 2003, 61, 291–298. [Google Scholar] [CrossRef]
  29. Acuña, L.; Basterra, L.A.; Casado, M.M.; López, G.; Ramón-Cueto, G.; Relea, E.; Martínez, C.; González, A. Aplicación del resistógrafo a la obtención de la densidad y la diferenciación de especies de madera. Mater. Construcc. 2011, 61, 451–464. [Google Scholar] [CrossRef]
  30. Sharapov, E.; Brischke, C.; Militz, H. Effect of Grain Direction on Drilling Resistance Measurements in Wood. Int. J. Archit. Herit. 2021, 15, 250–258. [Google Scholar] [CrossRef]
  31. Morales-Conde, M.J.; Rodríguez-Liñán, C.; Saporiti-Machado, J. Predicting the Density of Structural Timber Members in Service. The Combine Use of Wood Cores and Drill Resistance Data. Mater. Construcc. 2014, 64, e029. [Google Scholar] [CrossRef]
  32. Sharapov, E.; Wang, X.; Smirnova, E. Drill Bit Friction and Its Effect on Resistance Drilling Measurements in Logs; USDA Forest Service Forest Products Laboratory in Madison: Madison, WI, USA, 2017; pp. 405–415. [Google Scholar]
  33. Lin, C.-J.; Wang, S.-Y.; Lin, F.-C.; Chiu, C.-M. Effect of Moisture Content on the Drill Resistance Value in Taiwania Plantation Wood. Wood Fiber Sci. 2003, 35, 234–238. [Google Scholar]
  34. Sharapov, E.; Brischke, C.; Militz, H.; Smirnova, E. Prediction of Modulus of Elasticity in Static Bending and Density of Wood at Different Moisture Contents and Feed Rates by Drilling Resistance Measurements. Eur. J. Wood Prod. 2019, 77, 833–842. [Google Scholar] [CrossRef]
  35. Osuna-Sequera, C.; Llana, D.F.; Hermoso, E.; Arriaga, F. Acoustic Wave Velocity in Long Pieces of Salzmann Pine for In-Situ Structural Assessment. Constr. Build. Mater. 2021, 269, 121256. [Google Scholar] [CrossRef]
  36. Arriaga, F.; Llana, D.F.; Esteban, M.; Íñiguez-González, G. Influence of Length and Sensor Positioning on Acoustic Time-of-Flight (ToF) Measurement in Structural Timber. Holzforschung 2017, 71, 713–723. [Google Scholar] [CrossRef]
  37. Arriaga, F.; Montón, J.; Bobadilla, I.; Llana, D.F. Influence of Length on Acoustic Time-of-Flight (ToF) Measurement in Built-in Structures of Norway Spruce Timber. Holzforschung 2019, 73, 339–352. [Google Scholar] [CrossRef]
  38. Arriaga, F.; Osuna-Sequera, C.; Bobadilla, I.; Esteban, M. Prediction of the Mechanical Properties of Timber Members in Existing Structures Using the Dynamic Modulus of Elasticity and Visual Grading Parameters. Constr. Build. Mater. 2022, 322, 126512. [Google Scholar] [CrossRef]
  39. Nocetti, M.; Brunetti, M.; Bacher, M. Efficiency of the Machine Grading of Chestnut Structural Timber: Prediction of Strength Classes by Dry and Wet Measurements. Mater. Struct. 2016, 49, 4439–4450. [Google Scholar] [CrossRef]
  40. Vega, A.; Dieste, A.; Guaita, M.; Majada, J.; Baño, V. Modelling of the Mechanical Properties of Castanea sativa Mill. Structural Timber by a Combination of Non-Destructive Variables and Visual Grading Parameters. Eur. J. Wood Prod. 2012, 70, 839–844. [Google Scholar] [CrossRef]
  41. Cavalli, A.; Bevilacqua, L.; Capecchi, G.; Cibecchini, D.; Fioravanti, M.; Goli, G.; Togni, M.; Uzielli, L. MOE and MOR Assessment of in Service and Dismantled Old Structural Timber. Eng. Struct. 2016, 125, 294–299. [Google Scholar] [CrossRef]
Figure 1. Directions of the two orthogonal drillings made at each cross-section.
Forests 14 01107 g001
Figure 2. Position of the probes during the time-of-flight determinations. Five measurements were conducted end-to-end, and four were conducted on the surfaces (adapted from [23]).
Forests 14 01107 g002
Figure 3. Destructive test.
Forests 14 01107 g003
Figure 4. Wood density vs. drilling resistance: the black solid line is the regression line; the gray shaded area represents the 95% confidence interval; the dotted lines represent the prediction interval.
Forests 14 01107 g004aForests 14 01107 g004b
Figure 5. Dynamic MOE calculated with density from models of Table 2 and velocity measure de-termined by Microsecond Timer (MOEdyn mod) vs. (a) dynamic MOE by ViSCAN (density calcu-lated by weight on volume of the piece, MOEdyn LAB) and vs. (b) the static modulus of elasticity (MOEstat). Black solid line = regression line; gray shaded area = 95% confidence interval; dotted lines = prediction interval.
Forests 14 01107 g005
Table 1. Mean and variability (CV = coefficient of variation) of wood density measured on full cross-section specimens cut after destructive tests for each timber element. A = silver fir; C = chestnut; P = poplar.
IDMean
(kg/m3)
CV
(%)
Min
(kg/m3)
Max
(kg/m3)
A15156.3468554
A24513.8431475
A336010.1322410
A44484.1423466
A54666.9432515
A64334.0414453
A74202.3407434
A84825.5463522
A94932.8481516
A104521.1447460
A114277.2401465
A124777.7441535
A134633.2446474
A144111.1408414
A154886.1454508
A165184.0503532
A174716.2439495
A184143.1400424
A194925.5461512
C16265.3571651
C25650.6562569
C35351.8527546
C45993.0587620
C56081.6601615
C65704.3551597
P14964.6474519
P24142.8401423
P34354.9415458
Table 2. Results of the linear regression analysis. y = wood density; x = drilling resistance; R2 = coefficient of determination.
SpeciesEquationR2Prediction Interval
Silver firy = 0.12x + 2330.76±45 (kg/m3)
Chestnuty = 0.12x + 3110.83±39 (kg/m3)
Poplary = 0.23x + 760.94±31 (kg/m3)
Table 3. Velocity values (mean and coefficient of variation) reported for each timber element for the end-to-end and lateral faces Microsecond Timer measurements. The higher variations are underlined. A = silver fir; C = chestnut; P = poplar.
IDLateral FacesEnd-to-EndEnds/Faces
Mean
(m/s)
CV
(%)
Mean
(m/s)
CV
(%)
(-)
A150062.7750004.081.00
A251951.3054600.701.05
A344280.4645651.421.03
A445881.1247792.701.04
A548430.6448862.071.01
A652751.5854920.691.04
A756071.8857651.301.03
A856540.6557961.311.03
A952450.7754551.361.04
A1052530.7253191.071.01
A1149291.1051500.631.04
A1251330.8652500.901.02
A1351571.1253360.681.03
A1445781.7747030.911.03
A1552900.9353850.781.02
A1751352.0553141.511.03
A1849772.0651700.611.04
A1953902.7555932.691.04
C147073.4648221.001.02
C244265.1445593.041.03
C447281.4248051.171.02
C646480.9847681.531.03
P151072.8752582.151.03
P245071.3446501.031.03
P347031.1848672.161.03
Disclaimer/Publisher’s Note: The statements, opinions and data contained in all publications are solely those of the individual author(s) and contributor(s) and not of MDPI and/or the editor(s). MDPI and/or the editor(s) disclaim responsibility for any injury to people or property resulting from any ideas, methods, instructions or products referred to in the content.

