Article

Transcriptome Analysis of Biochemistry Responses to Low-Temperature Stress in the Flower Organs of Five Pear Varieties

1
Forest Department, Forestry College, Hebei Agricultural University, Baoding 071000, China
2
Hebei Key Laboratory for Tree Genetic Resources and Forest Protection, 2596 Lekai South St., Baoding 071000, China
3
Hebei Academy of Forestry and Grassland Sciences, Shijiazhuang 050000, China
*
Author to whom correspondence should be addressed.
Forests 2023, 14(3), 490; https://doi.org/10.3390/f14030490
Submission received: 16 January 2023 / Revised: 21 February 2023 / Accepted: 24 February 2023 / Published: 28 February 2023
(This article belongs to the Section Genetics and Molecular Biology)

Abstract

:
Using floral organs of five pear cultivars as materials, this study determined and compared physiological indices such as relative conductivity, superoxide dismutase (SOD), and malondialdehyde (MDA) of each cultivar’s floral organs under different low-temperature stress treatments, and evaluated the cold resistance of the five pear cultivars. Transcriptome sequencing analysis was performed on the floral organs of a new early-ripening pear cultivar called “Jinguang”, and 259 differentially expressed genes (DEGs) were identified, which were mainly enriched in pathways related to circadian rhythm and flavonoid biosynthesis. Weighted gene co-expression network analysis (WGCNA) showed that specific gene modules were significantly associated with MDA and soluble protein. Key enzymes such as NPC1(non-specific PLC, NPC), transcription factor MYB102, BBX19, and LHY (Late elongated hypocotyl) genes were located at the core of the constructed network, and may have important potential roles under low-temperature stress.

1. Introduction

Pears are produced by perennial fruit trees of the genus Pyrus L. (Rosaceae), which are among the most widely planted fruit trees worldwide. In China, pears have the third largest fruit production after apples and citrus [1,2]. The main pear-producing areas in China are Hebei, Liaoning, Shandong, and Jiangsu Provinces. Pear in China has more than 3000 years of cultivation history, and is an important horticultural crop, in all parts of the world are cultivated. China is top in pear cultivation area and production around the world. The flowers, leaves, and fruits of the pear tree are very ornamental. In addition, pears are rich in fruit acids, vitamins, sugars, and a variety of mineral elements required by the human body, with sweet and palatable, crunchy flesh, more than fresh food, but also can be made into a dried pear, pear proline, and canned wine, etc., for its high medicinal value and widely popular, cough relief and phlegm. Due to the long age of the pear tree, adaptability, early fruit production, and high nutritional value of fruit, the development of pear production has become an important way of sustainable economic development in China’s pear-producing areas. It is important for the developing agricultural economy, taking full use of land resources, increasing farmers’ income, and improving people’s living standards. However, the low temperature seriously affects and restricts the growth and development of pear trees. Pear trees are prone to frost damage under short-term cold stress, which disrupts the growth of plant tissues and produces visible symptoms the day after cold stress ends. Late frost damage in spring impacts almost all fruit trees, including apple, pear, apricot, and plum trees [3,4]. Pear trees bloom early in spring, such that late frost often occurs during the flowering period, leading to flower organ damage, low fruit-setting rates, and serious economic losses in the pear industry [5,6]. Research on freezing damage in fruit trees has mainly focused on freezing conditions, cultivation measures, and protective or remedial measures [7], whereas fewer studies have investigated the mechanisms underlying freezing damage in flower organs. A study of these mechanisms in pear flower organs would lay the foundation for preventing freezing injury during flowering, improving pear yield and quality, reducing economic losses of fruit farmers, and stabilizing pear industry development.
In this study, we studied the responses of flower organs of five pear tree varieties (‘HG051102′, ‘Meiyu’, ‘Jinguang’, ‘SJ051105′, and ‘041047′) in an artificial climate chamber to low-temperature stress treatments to provide a theoretical basis for the breeding of cold-resistant pear varieties. ‘Jinguang’ is a new medium- to early-maturing pear variety [8] with excellent quality that was selected from golden pear seedlings. We performed transcriptome sequencing of ‘Jinguang’ pear flower organs at different levels of low-temperature stress and screened for differentially expressed genes (DEGs). The results of this study provide a theoretical basis for mining cold resistance-related genes for the cultivation of new pear varieties.

2. Materials and Methods

2.1. Materials

Branches of Hg051102, Meiyu, Jinguang, SJ051105, and 041047 were collected as test material at the planting base of Hebei Forestry and Grassland Academy of Sciences (38°27′35″ N, 114°51′49″ E) in a temperate continental monsoon climate with a mean annual temperature of 14.2 °C. The average temperatures in January and July are −3 °C and 28 °C, respectively. The average annual humidity, annual precipitation and annual evaporation are 59%, 551.4 mm and 1305.80 mm, respectively. The frost-free period usually lasts from 120 to 240 days and the total solar radiation ranges from 113 to 137 C/cm2. Hg051102, Meiyu, Golden Light, SJ051105, and 041047 large bud stage flowering branches of 5–10 cm outer circumference were collected in early April 2021 with a 5-year growth period and in good condition. A total of 60 branches were taken from each tree to form a mixed sample, which was retrieved from the laboratory and hydroponically grown until flowering for the low- temperature treatment experiment.

2.2. Cold Treatments

Pear flowers were subjected to cold stress using a frost simulator (MSZ-2F); the temperature was adjusted using a proportional–integral–derivative controller. Each temperature treatment was applied for 4 h, as follows: CK (18 °C), CT1 (2 °C), CT2 (0 °C), CT3 (−2 °C), or CT4 (−4 °C). Prior to the experiments, the temperature of the frost simulator was adjusted to 10 °C, and then to the required temperature at a rate of 5 °C/0.5 h, followed by 1 °C/0.5 h. The required temperature was held for 4 h, and then batches of blooming pear flowers with their branches were placed in the frost simulator for another 4 h, after which the entire flower organ was cut and wrapped with tin foil, marked, frozen in liquid nitrogen, and stored at −80 °C for transcriptome sequencing and the determination of biochemistry indicators. Each experiment was performed in triplicate.

2.3. Determination of Biochemistry Indicators

Relative conductivity was measured using a conductivity meter [9], by punching flowers with consistent dimensions into test tubes with a perforator, adding 15 mL of ionized water, and leaving the tubes at room temperature for 30 min, during which time the tubes were shaken several times to promote water exchange. After 30 min, each tube was shaken and its initial conductivity value was measured using a conductivity meter, while the conductivity value of deionized water was measured as a blank control group. After measuring the initial conductivity values, each tube was boiled in boiling water at 100 °C for 10 min to kill the cell tissues, the tubes were removed and cooled to room temperature in tap water, shaken and the final conductivity values were measured. Malondialdehyde (MDA) content was determined by the thiobarbituric acid method (TBA) [10]. The mixture of MDA extract and 0.6% TBA was heated in boiling water for 15 min and subsequently centrifuged at 12,000 R/min for 10 min at 4 °C, and the supernatant was measured for absorbance at wavelengths of 532, 600, and 450 nm. Superoxide dismutase (SOD) was performed using nitroblue tetrazolium [11]. The reaction mixture (containing 0.3 mL 130 mmol/L methionine, 0.3 mL 750 μmol/L NBT, 0.3 mL 1 μmol/L EDTA-Na2, 0.3 mL 0.2 μmol/L riboflavin, 1.8 mL of a mixture of variable volumes of 50 mmol/L phosphate buffer and extract) and measured absorbance at 560 nm to calculate SOD activity. The soluble protein content was determined by Coomassie brilliant blue G-250 staining [12]. Flowers were frozen and pulverized in liquid nitrogen, and then 200 mg of fine powder was extracted in 6 mL of distilled water. Samples were rotated for 10 min at 4 °C with pure reagent as a blank, and the absorbance of the mixture of protein extract and Coomassie brilliant blue reagent at a wavelength of 595 nm was determined spectrophotometrically. Catalase (CAT) activity was measured using nitroblue tetrazolium [13]. When 200 μL of enzyme extract was added to a mixture of 2.8 mL of 20 mmol/L H2O2, and the CAT activity was calculated by measuring the absorbance at 240 nm. For each index, 3 biological replicates were used. Superimposition weighed 0.3 g of flowers for all index determinations.

2.4. Transcriptome Sequencing

Samples from the organs of ‘Jinguang’ pear flowers were collected from each treatment group, placed in centrifuge tubes, immediately frozen in liquid nitrogen, and then stored at −80 °C. Extraction, quality control, library construction, and RNA transcriptome sequencing were performed by Guangdong Jiao Co. The DESeq software was used to analyze differential gene expression among groups based on the negative binomial distribution model. Genes with |log2fold change| > 1 and p < 0.05 were identified as DEGs using the OmicShare software and subjected to pathway enrichment analysis, where significance was evaluated at a level of p ≤ 0.05. To identify key regulatory genes in the biosynthesis of the ‘Jinguang’ pear cultivar, which responds to low-temperature stress, we performed weighted gene co-expression network analysis (WGCNA) using the OmicShare tool. The correlation matrix was converted to an adjacency matrix using the setting power(soft threshold) = 15. A hierarchical clustering tree was constructed, and similar modules in the hierarchical tree were screened using a dynamic tree-cutting algorithm. Pearson correlation coefficients were evaluated for each gene and module trait data to obtain a gene significance (GS) value, where high GS values indicate that a gene is of high significance to the phenotypic trait. For each module and each trait, we performed Pearson correlation analysis of the GS (Correlation between genes and traits) values for the correlation between genes and traits and MM (Correlation between gene expression and modules) values for the correlation between gene expression and modules, where stronger correlation indicates that a module plays an important biological role related to the trait. Next, we selected the central gene of the appropriate MM and GS range determination module to represent the expression trend of the entire module. The gene regulatory network between transcription factors and structural genes was constructed using the Cytoscape software.

2.5. PCA Analysis

Based on the gene expression information, we use R (http://www.r-project.org (accessed on 6 March 2022)) to carry out Principal Component Analysis (PCA) to study the distance relationship between samples, using the idea of dimensionality reduction. This method can effectively identify the most “dominant” elements and structures in the data by borrowing the variance decomposition, and reflect the complex sample composition relationship to the two eigenvalues of the horizontal and vertical coordinates, so as to find the effect of sample aggregation pattern from the complex data. The more similar the sample composition is, the more it is reflected in PCA. The closer the distance in the graph, the more samples from different effective treatments tend to show their own aggregated distribution.

2.6. Real-Time PCR Analysis

Real-time fluorescence quantitative PCR (q RT-PCR) was used to verify the expression of co-expression network genes. The cDNA was synthesized using M 5 sprint qPCR RT kit with gDNA remover (mei5 Biotechnology Co., Beijing, China), and the cDNAs were extracted using MagicSYBR Mixture (CWBIO, Beijing, China) on a StepOnePlus Real-time PCR System (Thermo Fisher Scientific, Wilmington, DE, USA) for qRT-PCR. Tubulin gene was used as an internal reference control [14], and primers were designed using Primer Premier 6.0 (Palo Alto, CA, USA). Relative expression levels were calculated using the 2−ΔΔCT method [15].

3. Results

3.1. Biochemistry Characteristics and Cold Resistance of Flower Organs

Browning is the most obvious form of flower damage caused by low-temperature stress [16]. To observe the condition of the five pear flower organs after freezing, we selected one representative ‘Jinguang’ pear flower from each treatment sample to photograph and record the degree of browning (Figure 1). In the ‘Jinguang’ pear flower, we observed no damage in samples from the CK (18 °C), CT1 (2 °C), CT2 (0 °C), and CT3 (−2 °C)groups at temperatures above CT4 (−4 °C), but the damage was evident in samples held at or below −4 °C. The average supercooling or critical freezing point of ‘Jinguang’ pear flower organs was −5.7 °C. This temperature represents the lower limit of the temperature range for biochemistry adaptation in this variety.
Electrical conductivity and MDA, SOD, CAT, and SP contents in plants reflect the degree of stress-induced damage. In this study, we performed PCA to evaluate cold resistance in the five pear plants under various treatments by comparing their electrical conductivity, MDA, SOD, CAT, and SP indexes.
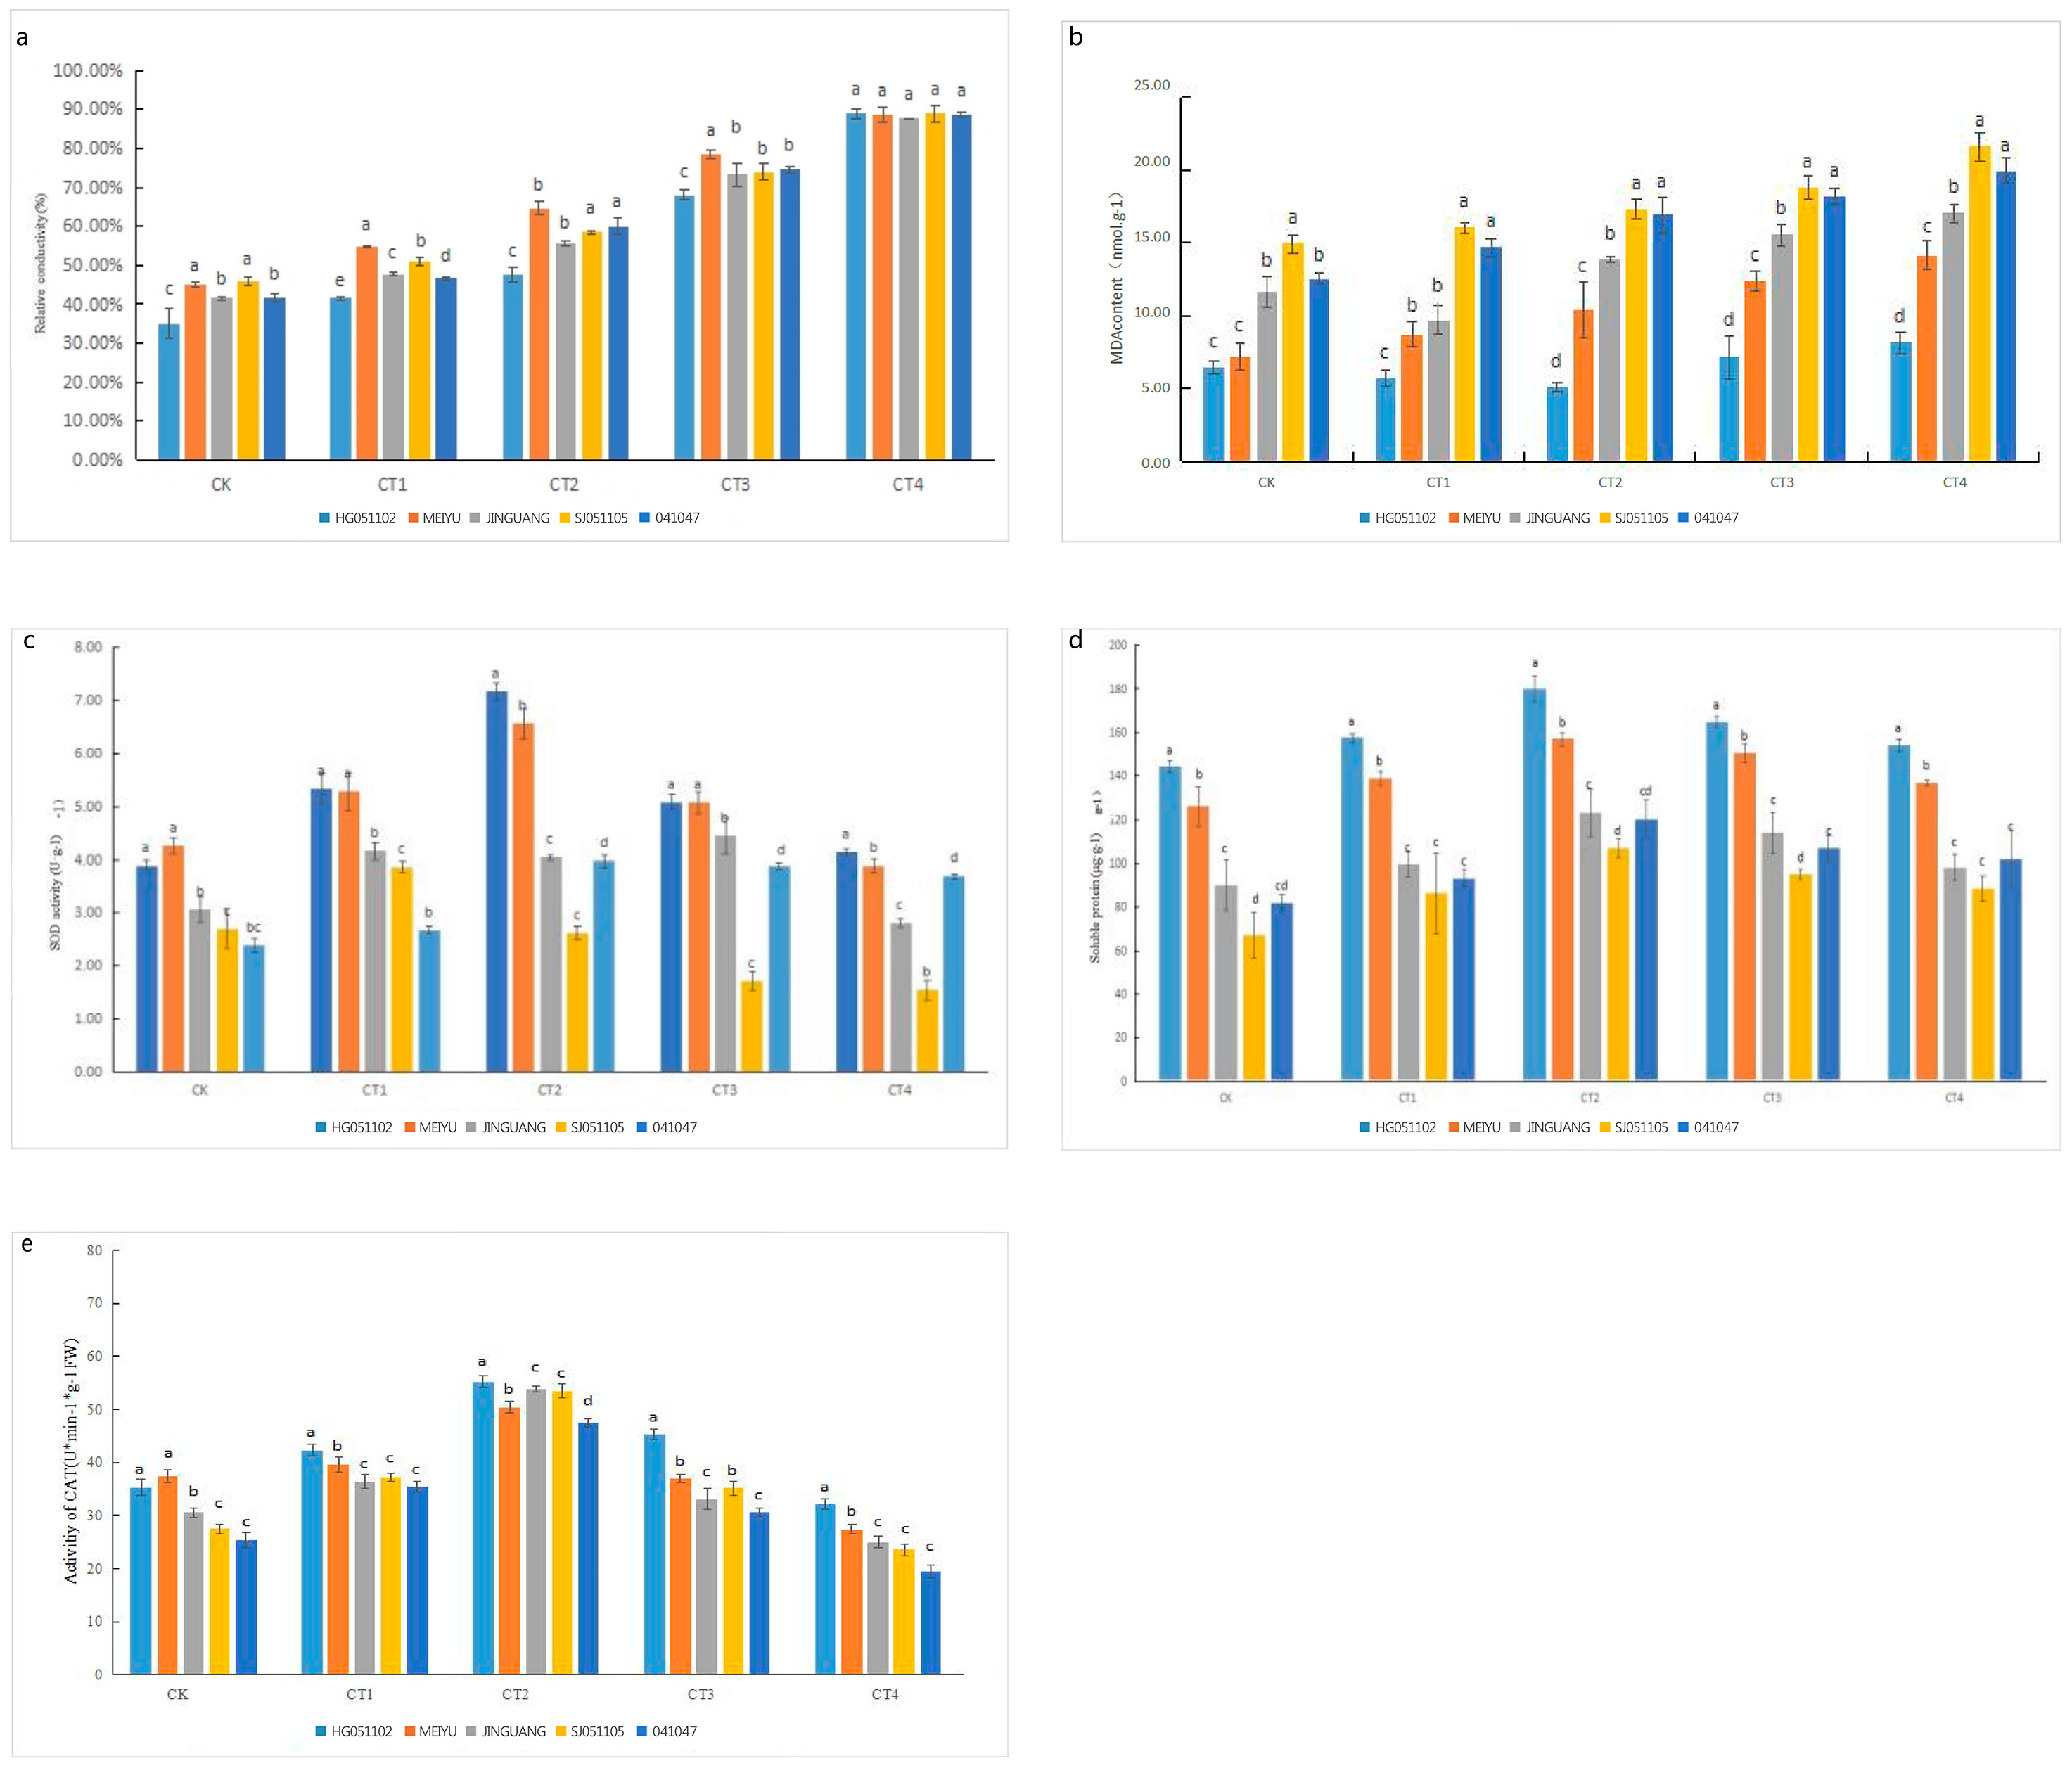
As low-temperature stress increased, relative electrical conductivity and MDA content Membrane lipid peroxidation induced by cold stress at sub-zero temperatures lead to significant MDA accumulation and increased electrical conductivity; therefore, our results indicate serious plant damage at sub-zero low-temperature stress. SOD, SP, and CAT content first increased and then decreased as low-temperature stress increased (Figure 2), Among them, CAT of floral organs of five pear varieties reached the maximum under CT2 treatment. The changes in these indicators suggest that plants trigger antioxidant systems and osmoregulatory substances to resist low-temperature damage when they are subjected to low-temperature stress.
The PCA results were used to obtain a composite score for each pear variety, and the cold resistance of each variety was ranked (Table 1). The five varieties showed cold resistance in the order ‘HG051102′ > ‘Meiyu’ > ‘Jinguang’ > ‘041047′ > ‘SJ051105′.

3.2. DEG Analysis for ‘Jinguang’

Flowers of the ‘Jinguang’ pear variety showed large numbers of DEGs under various levels of cold stress. As the treatment temperature decreased, the number of DEGs first increased and then decreased. Compared with CK, a total of 1067 DEGs were identified in the CT1 treatment, including 890 up- and 177 downregulated genes (Figure 3a). The CT2 treatment group had the highest number of DEGs (6378), including 3483 up- and 2895 downregulated genes. Plants may activate more genes to participate in the freezing response at or below 0 °C, thereby improving frost resistance. There were 2872 DEGs in the CT3 treatment group, including 1608 up- and 1264 downregulated genes, and 1529 DEGs in the CT4 treatment group, including 844 up- and 685 downregulated genes. Among these four groups, more DEGs were upregulated than downregulated, indicating that ‘Jinguang’ pear flowers subjected to cold stress resist freezing damage through gene activation. The CT1, CT2, CT3, and CT4 treatment groups had 412, 3698, 257, and 139 unique genes, respectively (Figure 3b). The total number of DEGs in the four comparison groups CK and CT1, CK and CT2, CK and CT3, and CK and CT4 was 259.

3.3. Transcription Factors Associated with Chilling Stress in Flowering Organs

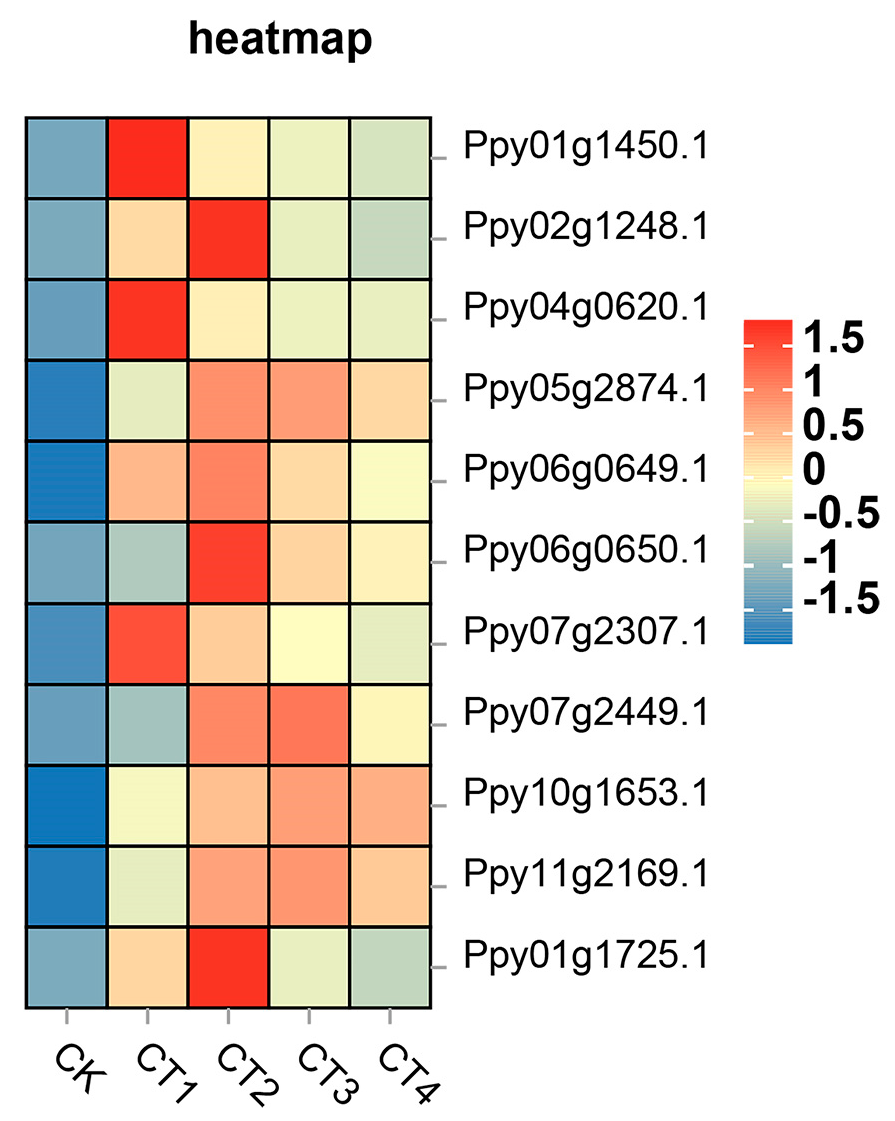
Transcription factors are important upstream regulatory proteins of genes that play a pivotal role in plant responses to biotic abiotic stresses [17]. In this study, 259 transcription factors were identified in goldenrod organs treated with different low temperatures, of which 136 were differentially expressed, with AP2/ERF transcription factors accounting for the largest proportion of 10. AP2/ERF is a large class of transcription factors unique to plants, and proteins in this family contain at least one AP2/ERF DNA-binding domain consisting of 60 to 70 conserved amino acids. Based on the number of containing structural domains and binding motifs, the AP2/ERF family can be divided into five subfamilies, DREB, ERF, AP2, RAV, and Soloist [18]. Studies have shown that AP2/ERF transcription factors play important roles in the transcriptional regulation of various biological processes, such as plant growth and development, environmental stress response, and metabolism [19]. In this study, the 10 differentially expressed AP2/ERF gene families included five ERFs and five DREBs. Members of the ERF subfamily can be involved in the regulation of ethylene response and abiotic stresses by binding to ethylene response elements (core sequence AGCCGCC) [20]. Overexpression of the TAERF1 gene in wheat in Arabidopsis improved the tolerance to low temperatures in transgenic plants [21]. Overexpression of the ERF family gene TERF2 in tomato enhanced low-temperature tolerance [22]. Members of the DREB subfamily specifically recognize and bind DRE/CRT elements (core sequence A/GCCGAC) in the promoter region as a way to induce the expression of abiotic stress-related response genes such as low temperature [23]. The most abundant AP2/ERF identified in this study showed significant up- or down-regulation under low-temperature stress to varying degrees, suggesting that it plays an important regulatory role under low-temperature stress. TCP (teosinte branched1/cycloidea/proliferating cell factor) and AP2/ERF family, as a special class of transcription factors in plants, play an important regulating role in plant growth and development and response to environmental stresses. Overexpression of OsTCP14 (PCF6) and OsTCP21 in rice was found to reduce the tolerance of plants to low temperatures and enhance the sensitivity of plants to low temperatures. After silencing the two TCP genes by Osa-miR 319b, the accumulation of ROS under low-temperature stress could be inhibited and the tolerance of rice plants to low temperature could be increased [24,25]. In this study (Figure 4), a down-regulated gene Ppy01g1725.1 encoding TCP was found in CT4 (−4 °C), indicating that TCP has a negative regulatory role in cold stress. The white poplar BPERF13 gene can effectively reduce the generation of active oxygen through interaction with a downstream CBF gene, and then improve the tolerance of plants to low-temperature stress [26]. Ptr ERF9 acts on the downstream of ethylene signal. This gene plays an active role in the cold tolerance of plants by regulating the transcription of Ptr GSTU17 to maintain ROS balance in plants [27]. The up-regulated gene Ppy11g2169.1 encoding ERF was found in CT2 (0 °C). AP2/ERF is an important regulatory factor involved in low temperature stress, indicating that it can be activated under low-temperature stress.

3.4. Comparative Analysis of DEGs Treated above and below 0 °C

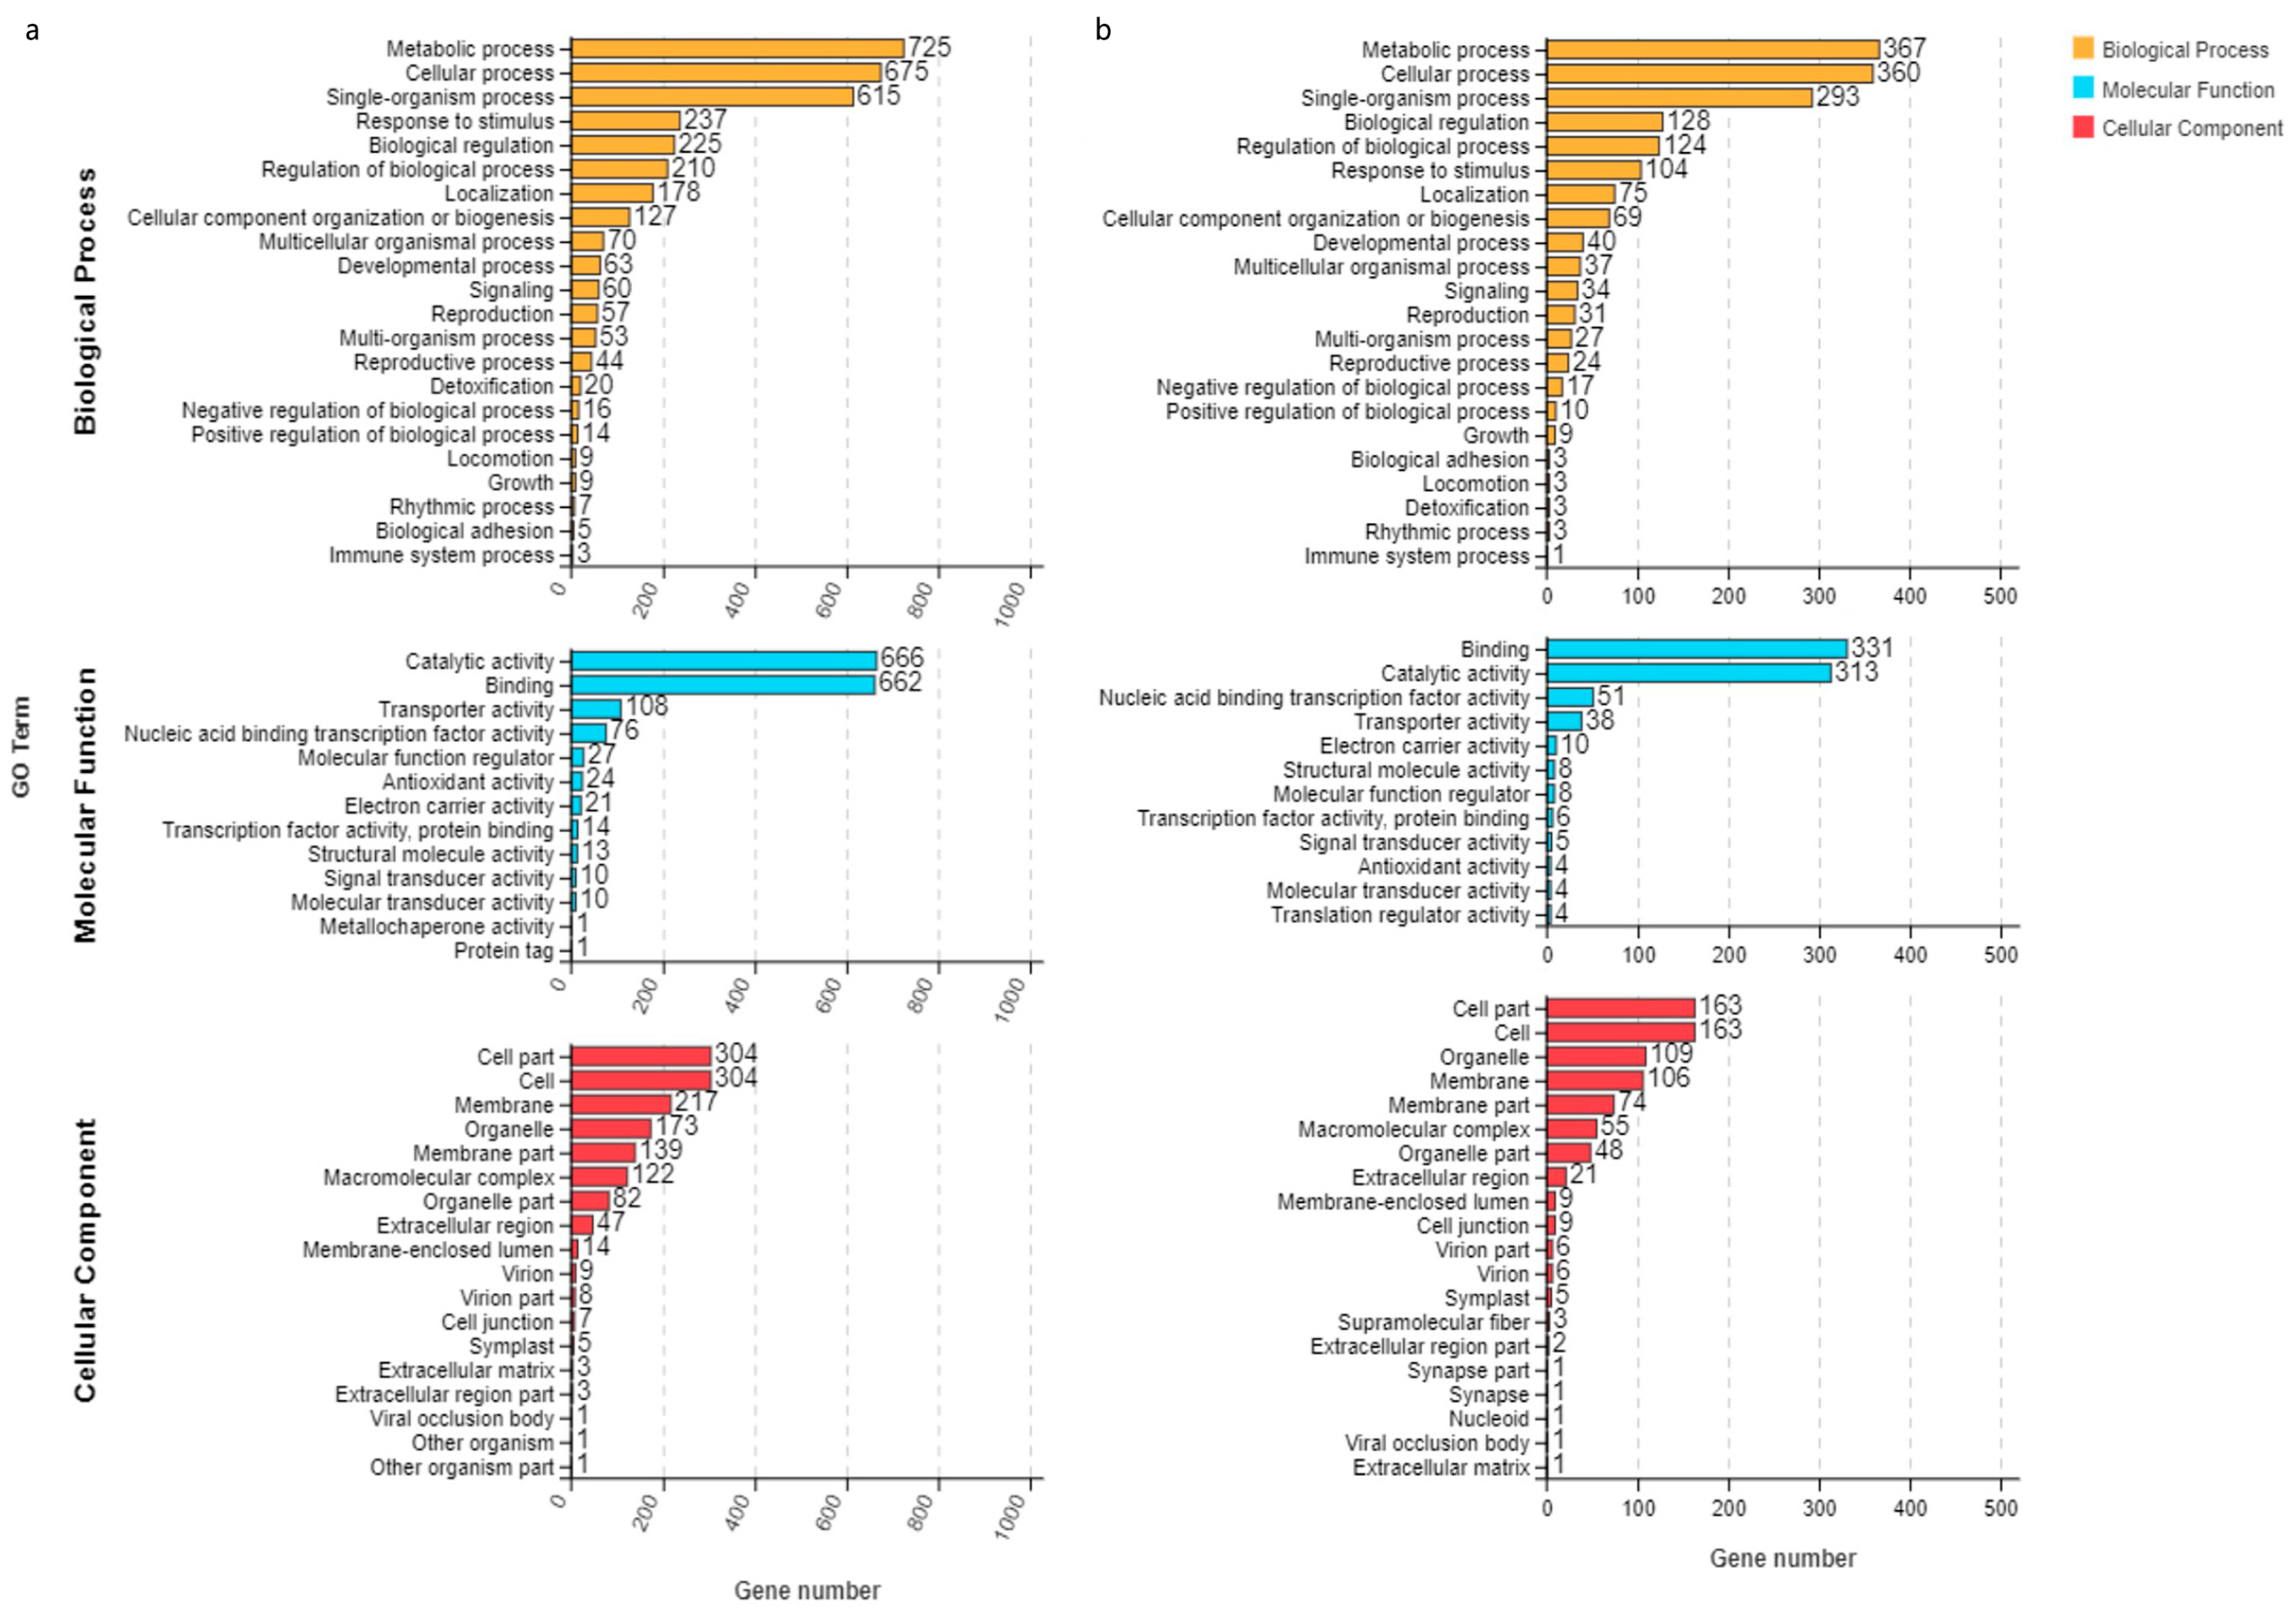
Low temperatures can severely damage the metabolism and biochemistry balance of plant cells, even causing plant death. Low-temperature stress can be classified according to plant damage, as chilling stress (0–15 °C) and freezing stress (<0 °C) [28]. Chilling and freezing injuries are associated with different mechanisms of action and degrees of plant damage. The junction point of chilling and freezing injury is 0 °C. Gene Ontology (GO) and Kyoto Encyclopedia of Genes and Genomes (KEGG) functional enrichment analyses were performed on DEGs between CK and the CT1 + CT2 (>0 °C) and CT3 + CT4 (<0 °C) treatment groups. The results showed that 574 and 1145 DEGs were enriched in various molecular functions, cellular components, and biological process categories in the >0 °C and <0 °C groups, respectively.
The GO functional classification and enrichment analysis results showed that the highest numbers of enriched DEGs between the >0 °C and <0 °C treatment groups were involved in biological (367) and metabolic (725) processes. Between the CK and >0 °C treatment groups, the molecular binding function was significantly enriched (331 DEGs), and between the CK and <0 °C treatment groups, catalytic activity was significantly enriched (666 DEGs). Among cellular components, DEGs were mainly enriched in cell parts, with 163 and 304 DEGs between CK and the >0 °C and <0 °C treatment groups, respectively (Figure 5).
KEGG pathway analysis results showed that DEGs between the >0 °C and <0 °C treatment groups were mainly enriched in cellular, environmental information, genetic information, metabolism, and organismal system processing pathways (Figure 6). Significantly enriched pathways between the two treatment groups included metabolism, flavonoid biosynthesis, photosynthesis antenna protein, circadian rhythm, secondary metabolite biosynthesis, and nitrogen metabolism. By contrast, uniquely significant pathways in comparison with CK included the starch/sucrose and fructose/mannitol metabolism pathways for the >0 °C treatment groups and the zeatin and steroid biosynthesis pathways for the <0 °C treatment groups.

3.5. Analysis of Key DEGs under Low-Temperature Stress

A total of 259 DEGs were common to the two comparison groups (CK > 0 °C or <0 °C treatment). KEGG pathway analysis of these DEGs showed that they were enriched in 40 metabolism, environmental information processing, organismal systems (Figure 7), genetic information processing, and cellular processes pathways; these mainly included photosynthesis, circadian rhythm, flavonoid biosynthesis, porphyrin metabolism, anthocyanin biosynthesis, flavone and flavonol biosynthesis, and nitrogen metabolism pathways.
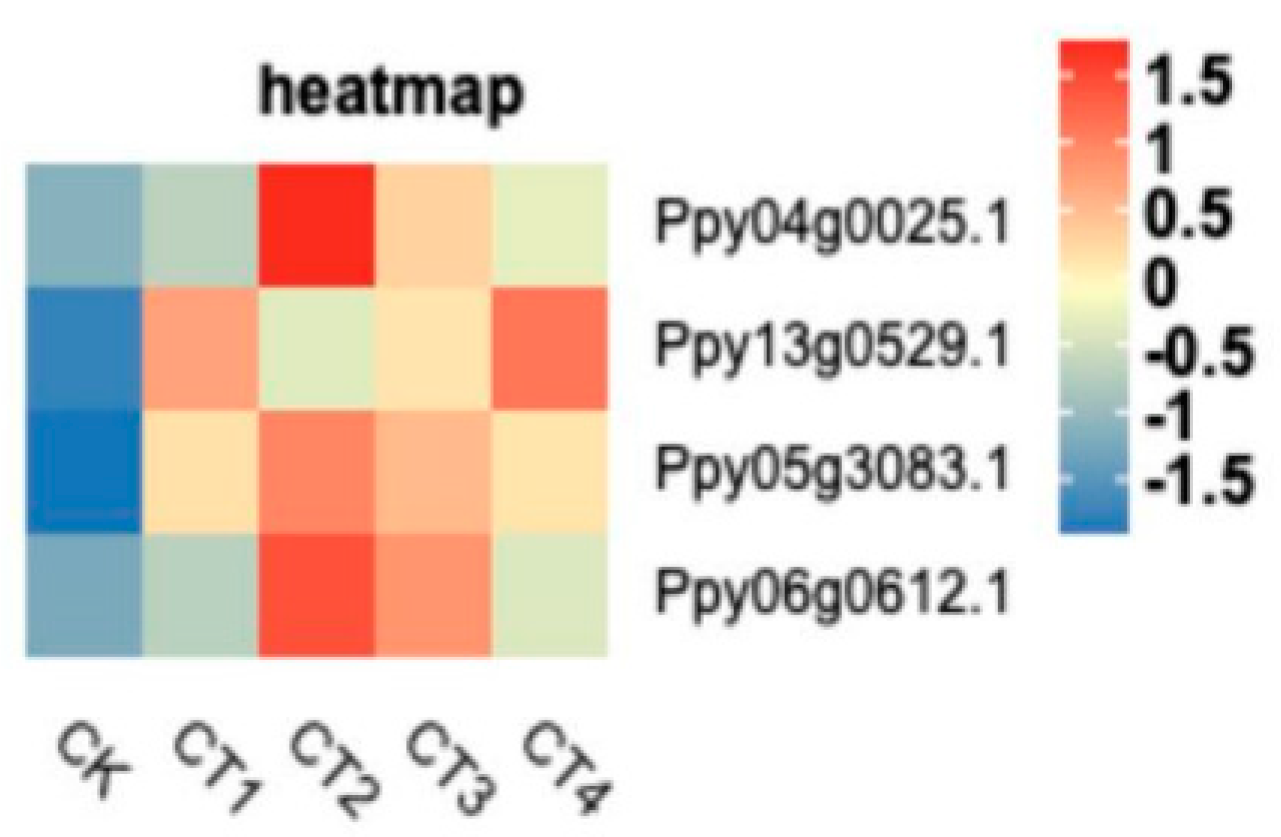
Studies have found that low-temperature stress leads to a decrease in enzyme activity and hinders the synthesis of various regulatory substances. Low-temperature stress is closely related to changes in the content of flavonoids, polyphenols, anthocyanins, and other substances in walnut leaves [29]. In this study, four upregulated DEGs (Ppy04g0025.1, Ppg13g0529.1, Ppy05g3083.1, and Ppy06g0612.1) were significantly enriched in flavonoid biosynthesis pathways: chalcone synthase, shikimate hydroxycinnamoyl transferase, anthocyanin synthase, and anthocyanin reductase, respectively (Figure 8). Chalcone synthase is the first rate-limiting enzyme in the flavonoid synthesis pathway, and is responsible for catalyzing the combination of three molecules of malonyl-CoA and one molecule of coumaroyl-CoA to form chalcone [30], which further produces various flavonoids [31]). Hydroxycinnamic acyltransferase belongs to an important branch of the plant acyltransferase family and is a key enzyme in the lignin synthesis pathway [32]. Phenolic compounds such as lignin and flavonoids can improve plant resistance [33]. Anthocyanins have diverse functions, and play important roles in plant resistance to low-temperature stress [34]. Anthocyanin synthetase is a key enzyme in anthocyanin biosynthesis [35], and anthocyanin reductase is a key procyanidin monomer biosynthesis enzyme that plays an important regulatory role in anthocyanin accumulation in plant tissues [36]). The expression levels of four genes in this pathway were significantly upregulated under cold stress, which may directly affect biochemistry processes such as cell growth, metabolism, and enzyme activity in response to low-temperature stress.

3.6. Co-Expression Network Construction and Identification of Key Genes Induced by Cold Stress

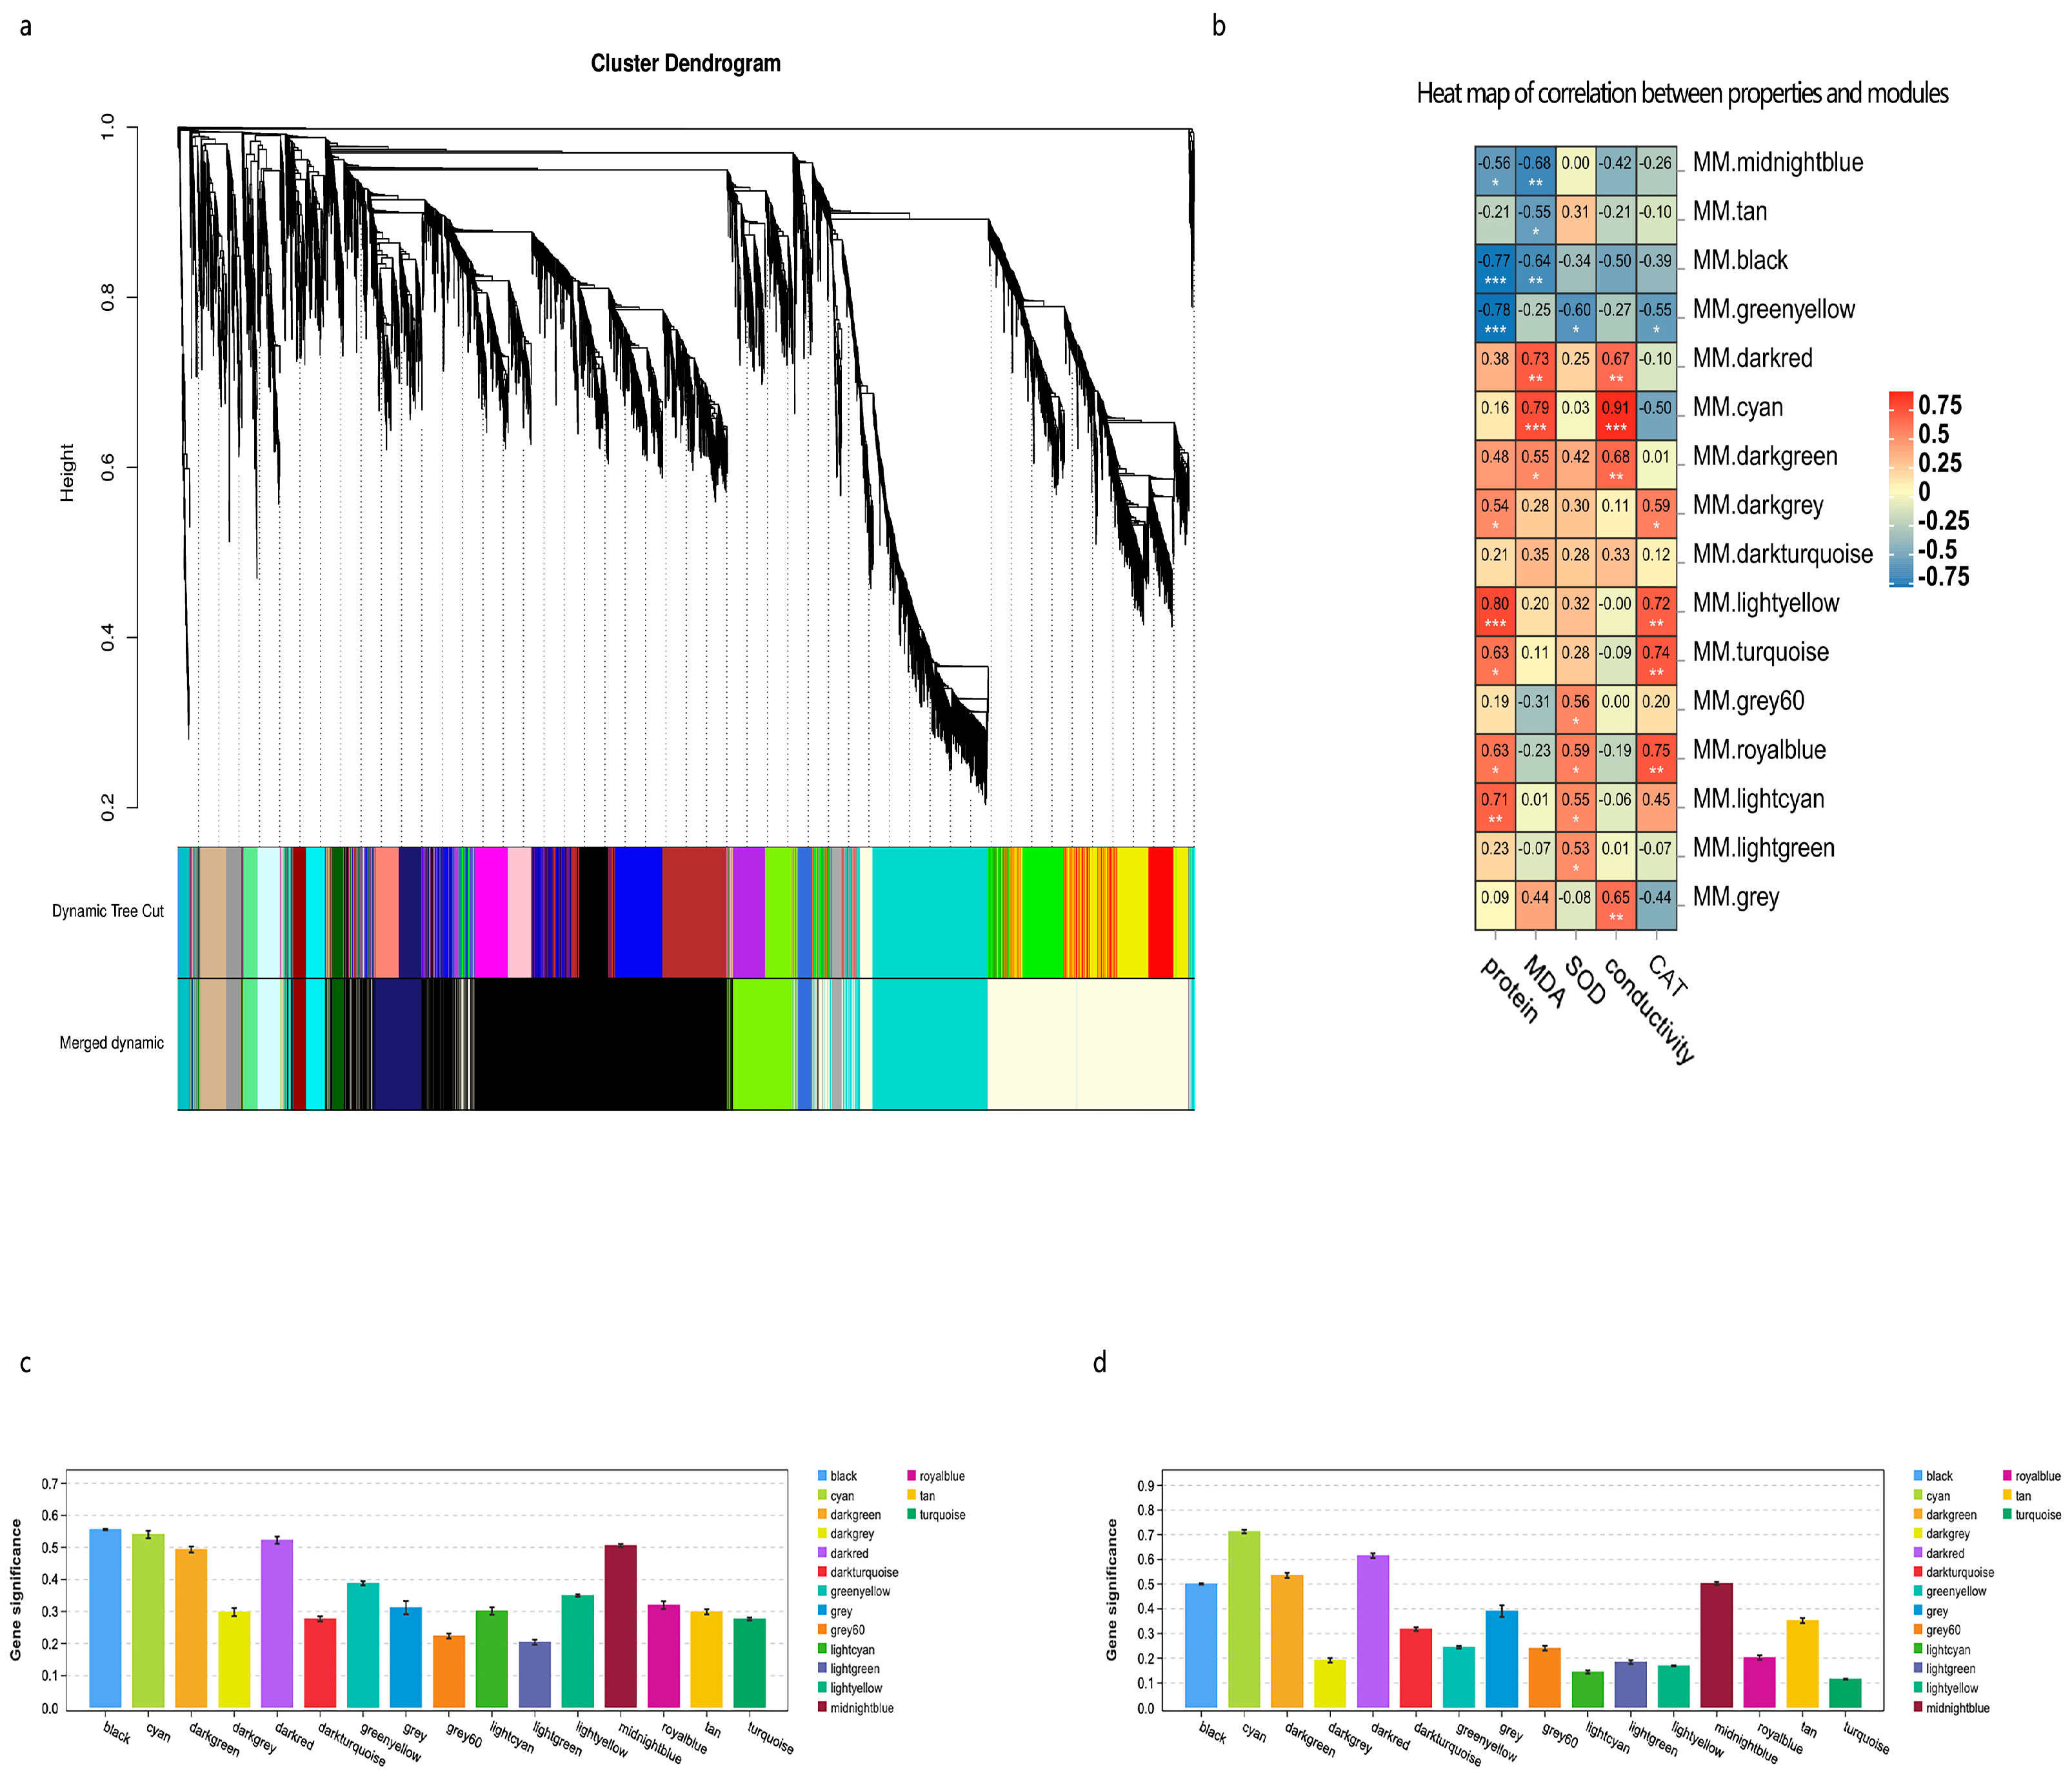
To further study the gene network regulating the effect of low-temperature stress on the growth of pear flower organs and identify specific genes closely related to the relevant biochemistry changes, we performed WGCNA using 7436 DEGs generated by RNA sequencing as source data. A scale-free co-expression network was constructed based on a soft threshold power value of β = 15. According to the WGCNA results, gene clusters with a high degree of interconnection were defined as modules, and genes within the same module had higher correlation coefficients. A total of 16 modules were identified using the dynamic tree-cutting method with the setting mergeCutHeight = 0.1 (Figure 9).
The number of genes in each module ranged from 30 to 2469; the gray module contained 30 genes that were not assigned to other modules. Correlation analysis of module eigenvalues and trait data showed that the green-yellow, light yellow, black, and cyan modules were significantly correlated with biochemistry indicators. We calculated the correlation between genes and trait data to obtain an average correlation value for the genes in each module, and then analyzed trait correlations for each module. Using a critical threshold of GS ≥ 0.30, we detected that the light yellow (1869 genes; R = 0.80, p < 0.05), green-yellow (487 genes; R = −0.78, p < 0.05), and black (2469 genes; R = −0.77, p < 0.05) modules were significantly associated with SP content, and the cyan module was significantly positively correlated with MDA content (184 genes; R = 0.79, p < 0.05).
In this study, genes with high MM and GS values were defined as highly differentially expressed genes (HDEGs). The light yellow and cyan modules were selected for WGCNA to identify the key genes involved in the response of the ‘Jinguang’ variety to low-temperature stress. In a gene co-expression network, many genes interact with only a limited number of other genes, while fewer central genes interact with many other genes. Therefore, to understand the relationships among genes within the module, we constructed the gene network of the light yellow and cyan modules using the Cytoscape software and the top 100 hub genes, with weight > 0.3 as a criterion.

3.7. Analysis of Central Genes Related to MDA Accumulation

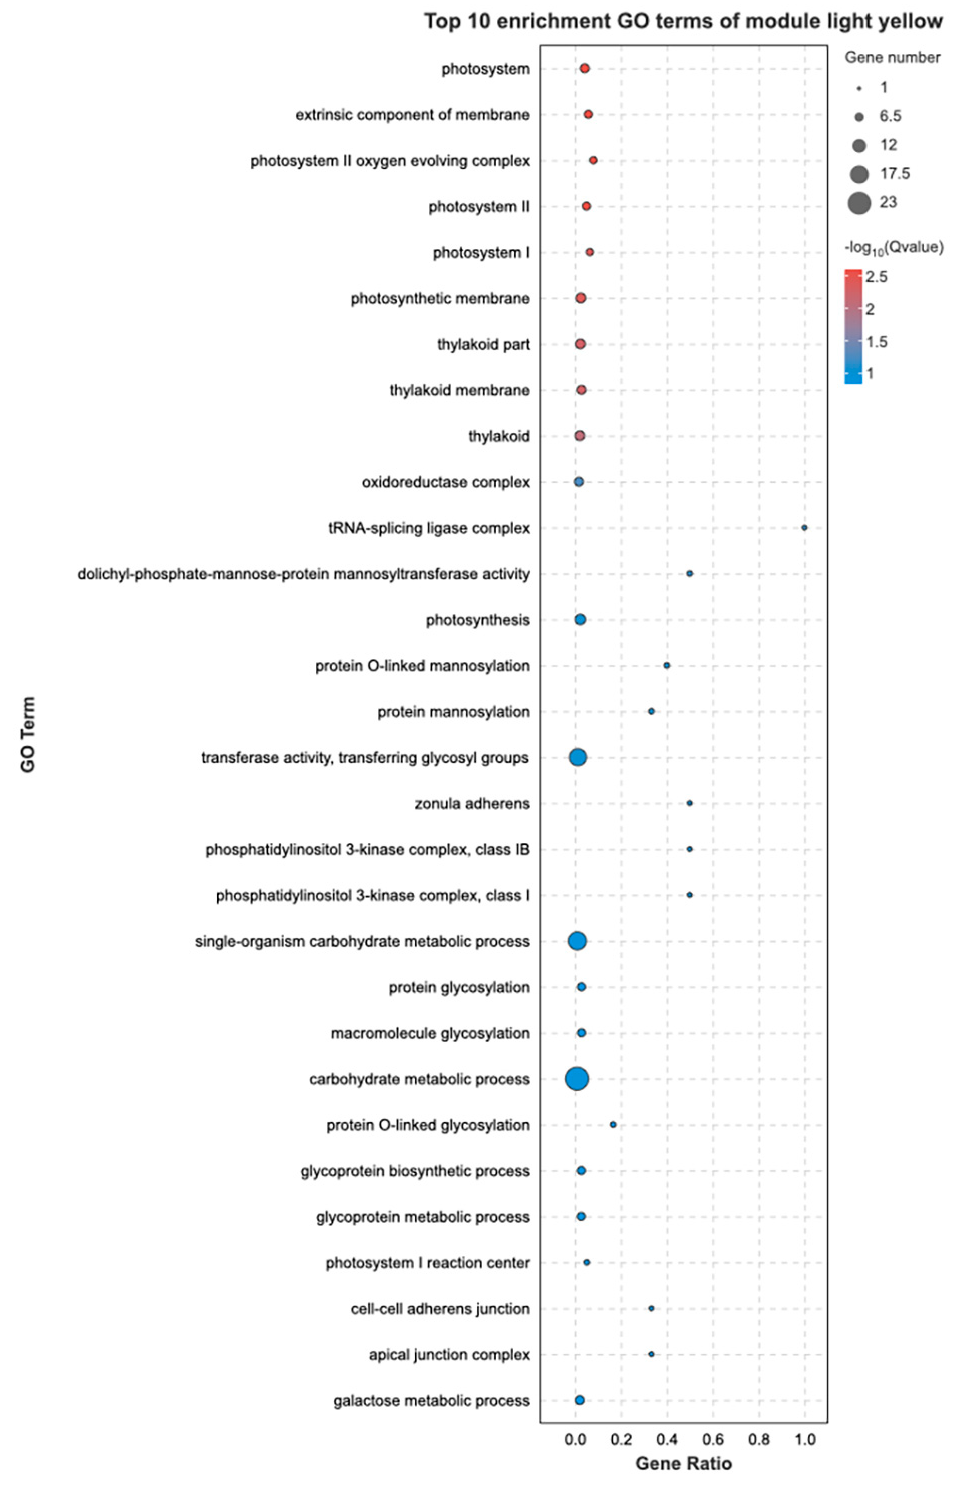
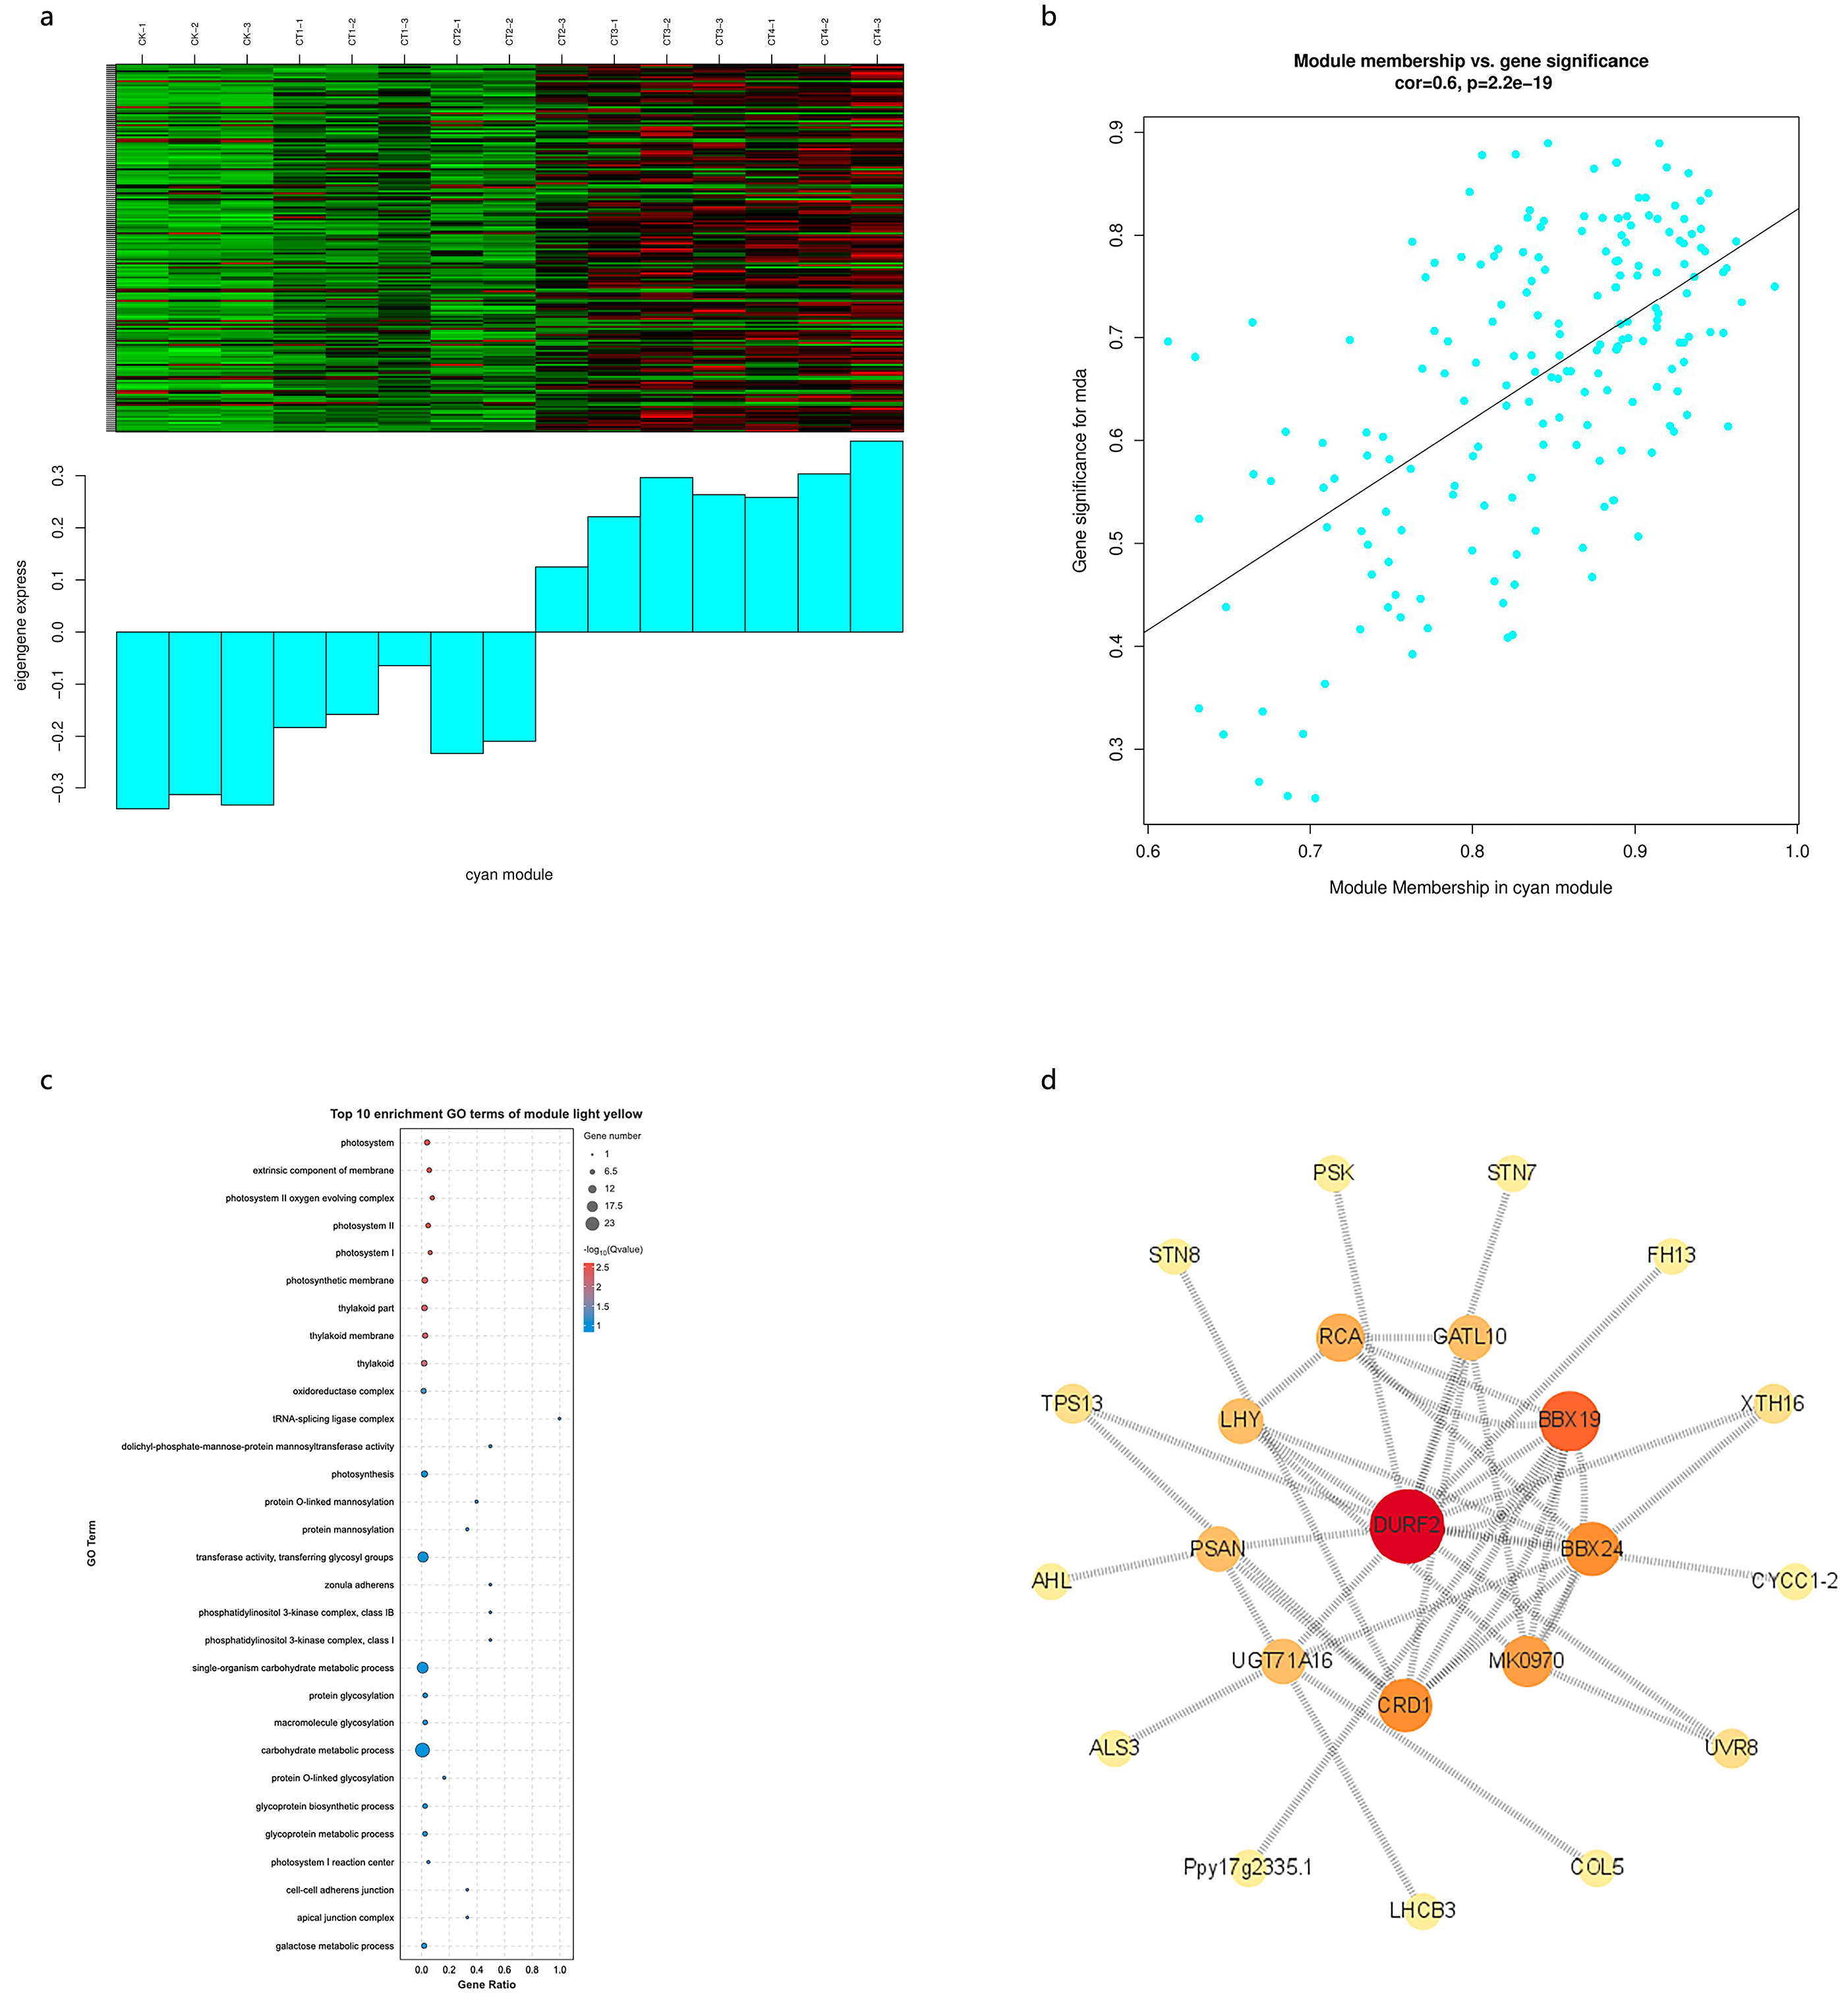
Next, we performed a functional analysis of the hub genes in the cyan module, which was the module most closely related to MDA content, and identified a total of 110 HDEGs (MM > 0.8, GS > 0.6) (Figure 10). The expression of these HDEGs decreased under CK and CT1 temperature treatment, but increased under CT3 and CT4 temperature treatment. GO analysis showed that these HDEGs were mainly enriched in the thylakoid, photosynthetic membrane, photosystem, and oxidoreductase complex, and KEGG pathway analysis showed that they were significantly enriched in metabolic processes and the photosynthesis antenna protein, photosynthesis, metabolic, phenylpropanoid biosynthesis, porphyrin metabolism, starch and sucrose metabolic, and alpha-linolenic acid metabolic pathways. A gene co-expression network diagram was drawn to obtain the genes with the highest connectivity; these included DURF2, BBX19, CRD1, and BBX24.

3.8. Analysis of Central Genes Related to SP Accumulation

Under different low-temperature environment treatments, the black, green-yellow, and light yellow modules were significantly correlated with SP, and the light yellow module was the most significant; 110 HDEGs were identified (MM > 0.95, GS > 0.8) (Figure 11). HDEG expression decreased under CK, CT1, and CT4 treatment, and increased under CT2 treatment. GO enrichment analysis showed that the HDEGs were significantly enriched in processes related to the membrane, carbohydrate metabolism, and oxidoreductase activity. KEGG pathway analysis showed that the HDEGs were significantly enriched in metabolic, flavonoid biosynthesis, secondary metabolite biosynthesis, and benzene propanoid biosynthesis pathways. A gene co-expression network diagram of the green-yellow module showed that the genes with the highest connectivity were MSTRG.12100, MSTRG.10697, MSTRG.12101, MSTRG.1324, AA01, and NPC1.

3.9. Verification of Differentially Expressed Genes by qRT-PCR

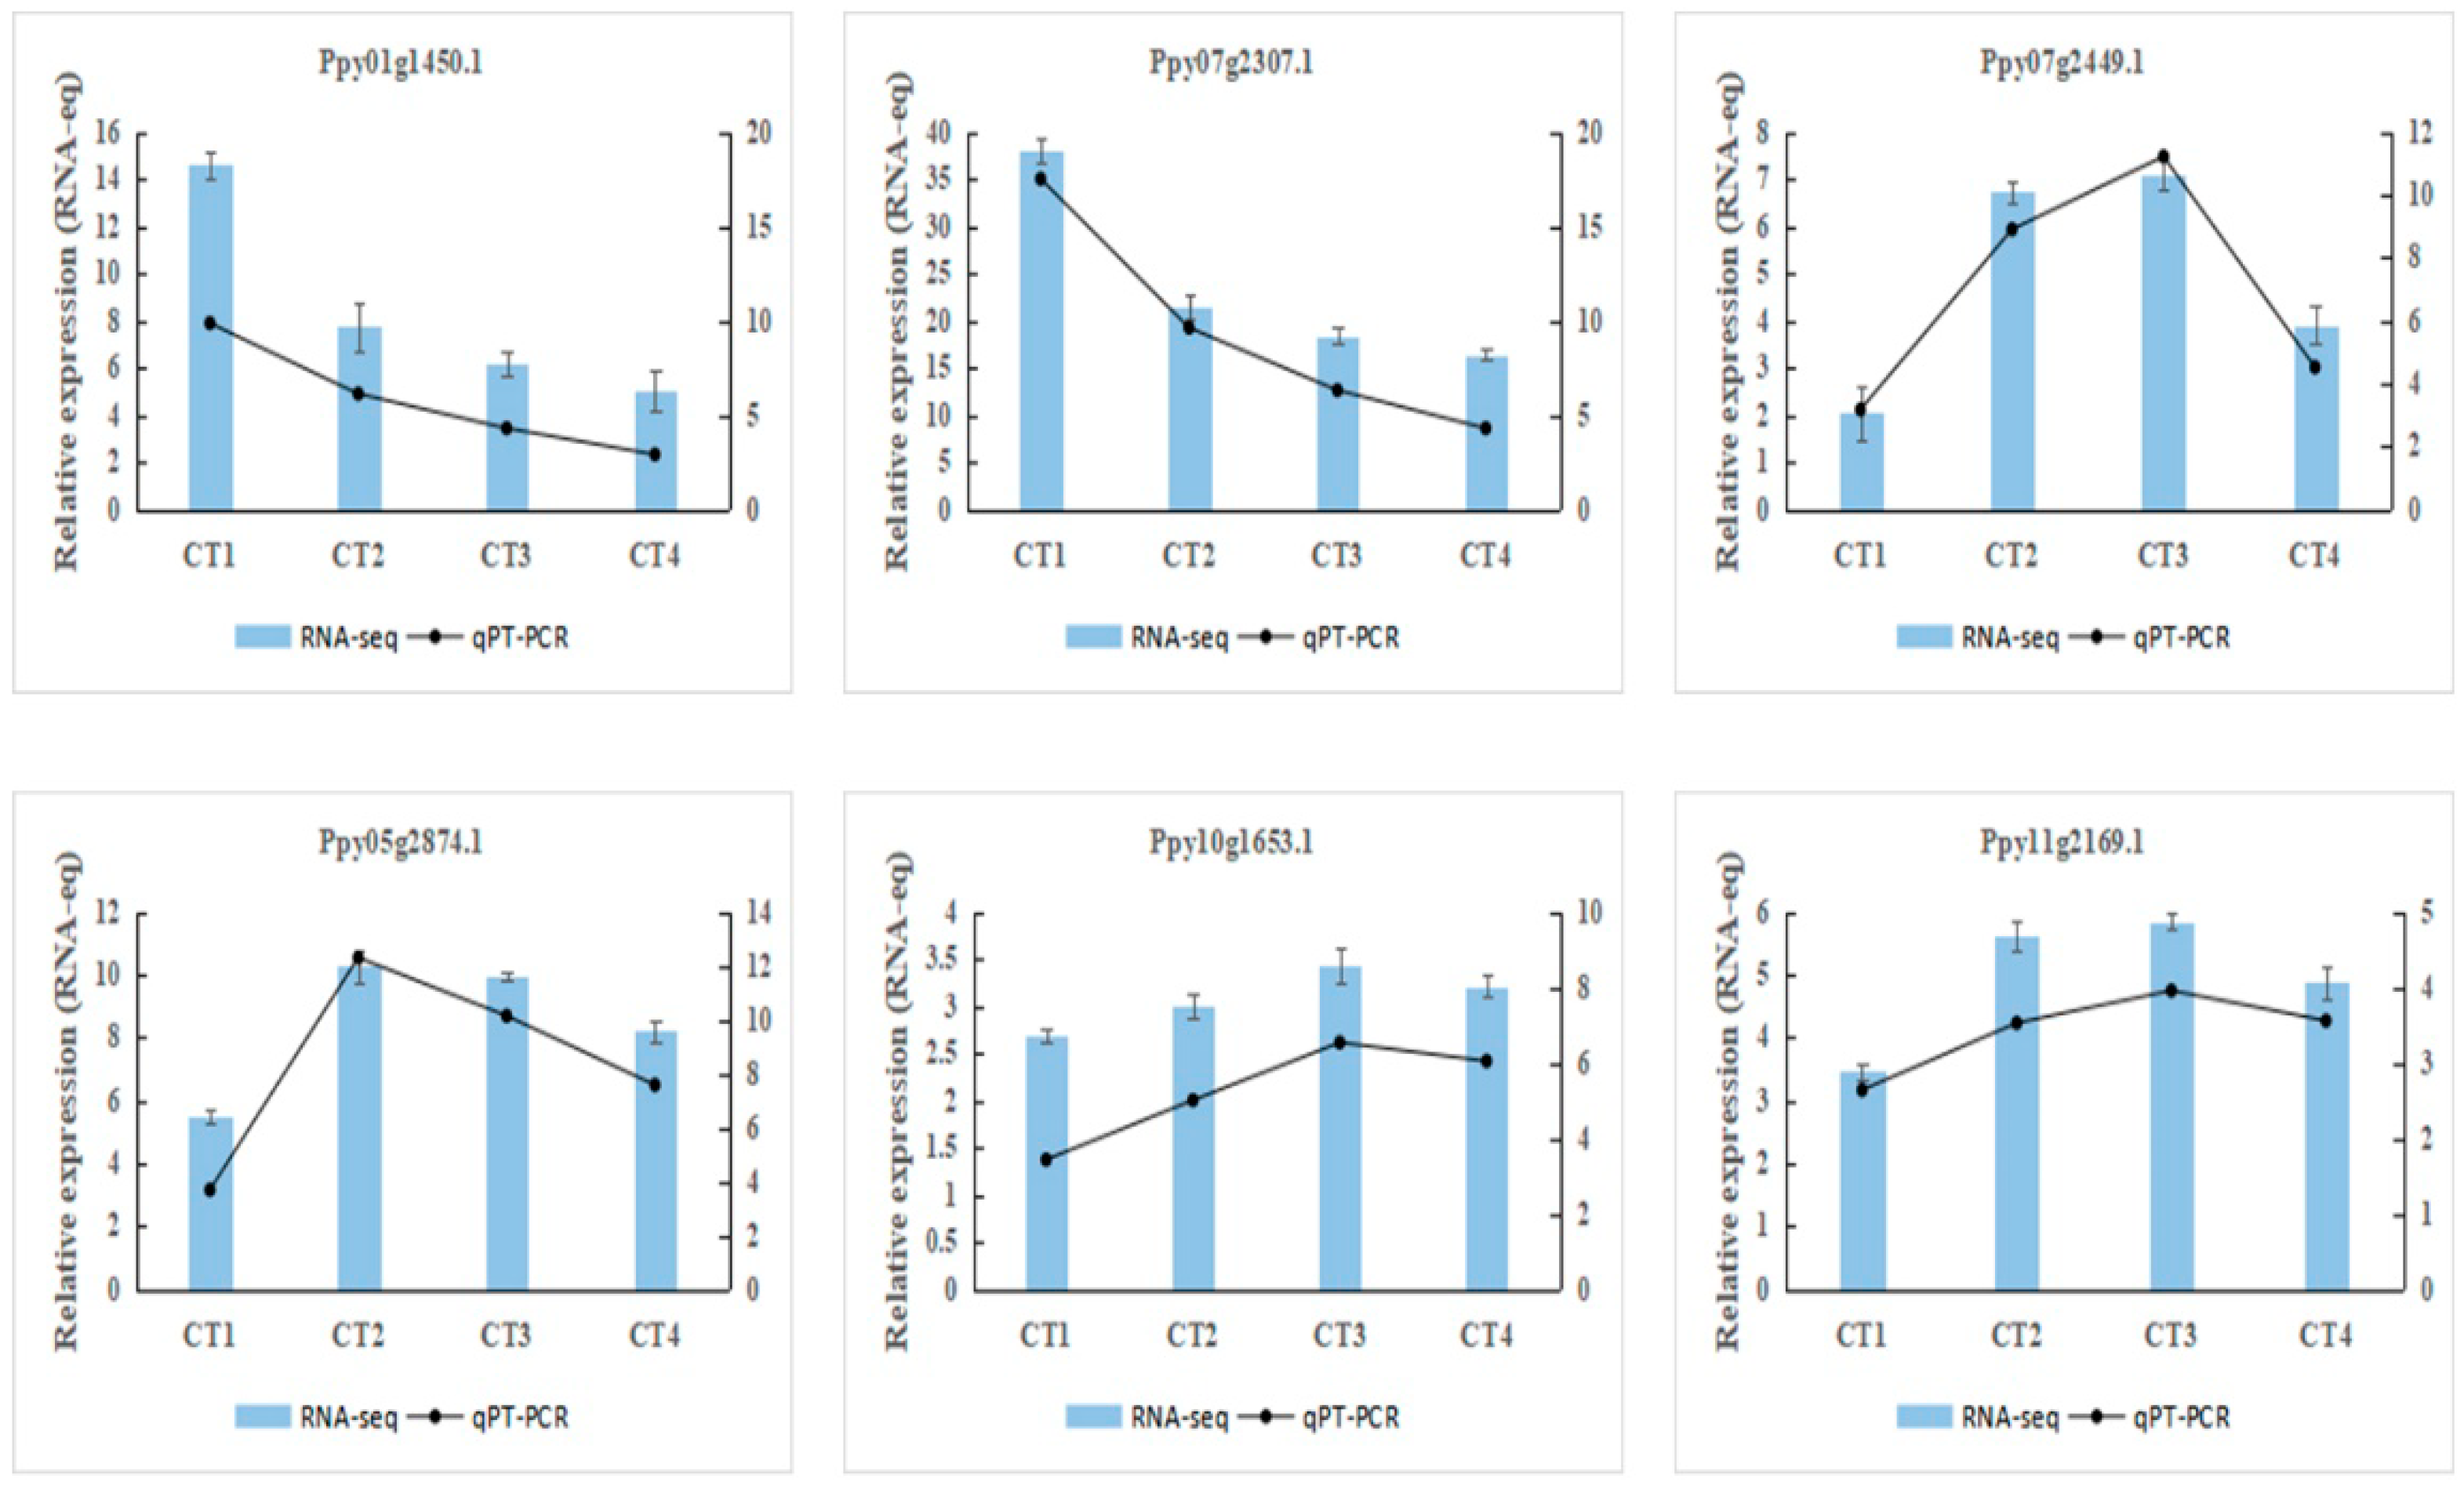
In order to verify the accuracy and reliability of RNA-seq data, six genes related to the response to low-temperature stress were selected for qRT-PCR validation in this study. The results are shown in Figure 12. The results are basically consistent with the sequencing data, indicating that the sequencing results are highly reliable.

4. Discussion

Plant damage caused by low-temperature stress involves a series of biochemistry responses. Various protective enzymes experience altered activity levels, and the content of osmotic substances such as soluble sugar and SP is altered, protecting or inhibiting plant growth to varying degrees. When stress levels exceed the limit of plant resistance, they lead to plant death [37].

4.1. Biochemistry Responses of Pears to Low-Temperature Stress

Low-temperature stress can promote the production of reactive oxygen species, aggravate cell membrane lipid peroxidation, and lead to severe cell damage or plant death. SOD and CAT is the main antioxidant enzyme involved in active oxygen scavenging [13,38] and their activity is positively correlated with cold resistance. Plants produce excess free radicals under stress and aging, which triggers or intensifies membrane lipid peroxidation. MDA is the final decomposition product of membrane lipid peroxidation and has strong cytotoxicity, causing damage to biological membranes and destroying the plant cell membrane system [39]. When plants suffer chilling damage, changes in MDA content can reflect the degree of damage to the plant cell membrane system in terms of membrane lipid peroxidation and the strength of the plant’s response to adverse conditions, thereby identifying plant cold resistance. The results of this study showed that as the temperature decreased, SOD activity and CAT activity in the flower organs of five pear varieties first increased and then decreased, while MDA content continued to increase, which is consistent with previous reports on cold stress responses in rubber trees [38], walnut trees [40], and apricot trees [41].
SP is the main osmotic adjustment substance in cells. Increases in the content of osmotic adjustment substances under low-temperature stress can alleviate or resist cold damage; therefore, SP content reflects plant cold resistance [13]. In this study, the SP content of flower organs from five pear varieties first increased and then decreased as temperature decreased. An increase in SP content in the early stage of low-temperature stress can improve the water retention capacity of cells and avoid tissue damage caused by osmotic stress at low temperatures.
In plants under stress, cell membrane damage leads to increased permeability, followed by electrolyte extravasation and increased electrical conductivity [42]. Thus, electrical conductivity can be used as an indicator of cold resistance. In this study, we found that electrical conductivity increased in flower organs of all five pear varieties under low-temperature stress.
Together, these results indicate that the antioxidant system, osmotic adjustment substances, and electrical conductivity play key roles in the growth of pear trees under low-temperature stress.

4.2. Transcriptional Differences in ‘Jinguang’ Pear Organs under Low-Temperature Stress

In this study, RNA sequencing was performed to analyze transcriptome changes in ‘Jinguang’ pear organs under different low-temperature treatments, revealing 1067, 6378, 2872, and 1529 DEGs in the CT1, CT2, CT3, and CT4 treatment groups, respectively. The expression levels of DEGs varied among treatment groups, with the CT2 treatment having the most DEGs. GO enrichment analyses showed significant differences in the numbers of DEGs enriched in various biological functions among treatments, and four different groups of genes were activated in the ‘Jinguang’ variety under different low-temperature treatments. We conducted WGCNA to construct the gene regulatory network and identify central genes in ‘Jinguang’ under different cold stress treatments. A joint analysis of biochemistry and biochemical indicators and large-scale transcriptome data identified the gene expression modules involved in the ‘Jinguang’ response to low-temperature stress. WGCNA identified the most important modules indicating gene overexpression in each treatment, including the black, green-yellow, and light yellow modules in CT2 and the cyan module in CT4. The light yellow, green-yellow, and black modules were also significantly associated with SP content, whereas the cyan module was significantly associated with MDA content. We speculate that the upregulated genes in these modules respond to low-temperature stress effects on photogrowth by altering membrane lipid peroxidation and osmoregulatory substance content.

4.3. Signal Transduction-Related Genes

Due to the frequent occurrence of extreme weather, ‘Jinguang’ pear trees are often threatened by low temperatures. Low-temperature stress induces the expression of LHY, which activates the transcription of VIN3 through different cis-elements, which is of great significance to plant growth and development. BBX19 is a member of the B-box family, which induces the expression of rice OsBBX19 under low-temperature stress and participates in abscisic acid and methyl jasmonate signal transduction [43]. PSK recognizes the phytosulfokine receptor (PSKR) on the cell membrane for signal transduction, and PSKR plays a key role in signaling pathways related to plant responses to environmental stimuli [44]. In this study, the BBX19, LHY, and PSK genes had high connectivity in the cyan module co-expression network, and their upregulated expression was highest in the CT4 treatment, indicating their potential roles in low-temperature responses.

4.4. Metabolism-Related Genes

Phospholipase C (PLC) is a key enzyme in the phosphatidylinositol signaling pathway. PLC and its products play important mediating roles in plant cell signal transduction [45,46]. PLC can be divided into phosphatidylinositol-specific PLC and non-specific PLC (NPC) according to its different substrates for hydrolyzing phospholipids [47]. NPC hydrolyzes phosphatidic acid, phosphatidylethanolamine, and other substances to generate diacyl glycerol and small molecular compounds that have phosphate groups at the head; these play important roles in various abiotic stress responses [48,49]. OsNPC2 is sensitive to salt and cold, and its expression increases significantly following saline and low-temperature treatment [50]. The AtNPC4 gene improves plant resistance to high osmotic stress [51]. The MYB family encompasses plant transcription factors related to the regulation of plant growth and development, biochemistry metabolism, cell morphology, pattern building, and other biochemistry processes. Overexpression of the rice OsMYB4 and Leymus chinensis LcMYB1 genes induces P5CS gene expression in transgenic Arabidopsis, resulting in increased content of energy substances such as proline and sugar, which may enhance the ability of plants to resist low-temperature stress [52,53]. BpMYB4 overexpression significantly increases the content of osmotic adjustment substances such as soluble sugar and SP, thereby improving low-temperature stress resistance [54]. Low-temperature stress can lead to intensified lipid peroxidation of cell membranes. Overexpression of the MYB transcription factor gene TaMYB1D, cloned from wheat, in transgenic tobacco enhanced antioxidant enzyme system activity and regulated the expression of stress-related genes, improving plant tolerance to oxidation [55]. The AtMYB12 gene regulates the gene expression of key enzymes in the flavonoid biosynthesis pathway, and flavonoid accumulation was shown to increase Arabidopsis abiotic stress tolerance [56]. This study demonstrated that the NPC1 and MYB102 genes have high connectivity in the light yellow module co-expression network, suggesting their potential roles under-low temperature stress in pear trees.

5. Conclusions

The biochemical data showed that with the increase of low-temperature stress, the relative conductivity and malondialdehyde content of flowering organs of five pear varieties showed a gradual increase, while the content of soluble protein and superoxide dismutase showed a trend of increasing and then decreasing, and their cold resistance was evaluated by the principal component analysis, which was HG051102 > Meiyu > Golden Light > 041047 > SJ051105. The transcriptome sequencing, results of the new early maturing pear variety “Golden Light”, showed that it can respond and adapt to low-temperature stress by changing signal transduction, enzymes, metabolism, and transcription factors. The central genes in the co-expression network, NPC1, MYB102, LHY, BBX19, DURF2 and PSK, play a central role in the low temperature stress response of “Golden Light”. This study provides a reference for the physiological and molecular cold resistance mechanisms of pear adaptation to low temperature stress.

Author Contributions

S.L., Y.L., J.Z. (Jun Zhang) and M.Y. designed the experiment. S.L., Y.L., J.Z. (Jingxian Zhao), W.G., W.L., M.J. and X.L. performed data and tissue collection. S.L., J.Z. (Jun Zhang) and M.Y. conceived the study and edited the manuscript. All authors have read and agreed to the published version of the manuscript.

Funding

The research was supported by the key R&D program of Hebei Province (21326308D).The research was supported by the key R&D program of Hebei Province (19226319D).

Institutional Review Board Statement

Our study does not involve ethics approval and consent to participate.

Informed Consent Statement

Informed consent was obtained from all subjects involved in the study.

Acknowledgments

We are indebted to all the authors contributing their work to this Special Issue and to all reviewers whose comments and suggestions helped to improve the quality of the accepted papers.

Conflicts of Interest

The authors declare that they have no known competing financial interest or personal relationship that could have appeared to influence the work reported in this paper.

References

  1. Chen, X.S.; Wang, N.; Zhang, Z.Y.; Feng, S.Q.; Chen, X.L.; Mao, Z.Q. Progress on the Resource and Breeding of Kernel Fruits Ⅰ: Progress on the germplasm resources, quality development and genetics and breeding of pear in China. J. Plant Genet. Resour. 2019, 20, 791–800. [Google Scholar]
  2. Zhang, S.L.; Xie, Z.H. Current status, trends, main problems and the suggestions on the development of pear industry in China. J. Fruit Trees 2019, 36, 1067–1072. [Google Scholar]
  3. Kunz, A.; Blanke, M. “60 Years on”—Effects of Climatic Change on Tree Phenology—A Case Study Using Pome Fruit. Horticulturae 2022, 8, 110. [Google Scholar] [CrossRef]
  4. Jiao, H.M.; Zhao, H.; Feng, M.; Xiao, L.J.; Wang, H.Q.; Huang, L.; Chen, G.; Cao, Y.J. Causes and preventive measures of fruit tree freeze injury. Xinjiang Agric. Reclam. Technol. 2022, 45, 36–39. [Google Scholar]
  5. Xue, Q.Q.; Yuan, J.W.; Zhang, P.F.; Zhang, Z.B.; Duan, G.Q.; Liang, Z.J. Effect of late frost on fruit trees in spring orchards and countermeasures. Shanxi Fruits 2019, 189, 51–53. [Google Scholar]
  6. Bai, Q.F.; Li, X.M.; Zhu, L. The Changes of the frost-free periods from 1961 to 2010 and its impact on apple industry in Shaanxi province. Resour. Environ. Arid. Areas 2013, 27, 65–70. [Google Scholar]
  7. Jia, T.K.; Pang, L.X. Investigation on the occurrence of fruit tree late frost damage in Chencang, Shaanxi Province in 2018 and countermeasures. Pract. Technol. Inf. Fruit Trees 2019, 294, 36–38. [Google Scholar]
  8. Guo, W.Z.; Zhao, J.X. A new mid-early maturing pear variety. China Fruit News 2022, 39, 57–58. [Google Scholar]
  9. Xu, X.J.; Li, Y.C. Comparison of two methods for measuring relative conductivity of plants. Jiangsu Agric. Sci. 2014, 42, 311–312. [Google Scholar]
  10. Shukla, N.; Awasthi, R.P.; Rawat, L.; Kumar, J. Biochemical and physiological responses of rice (Oryza sativa L.) as influenced by Trichoderma harzianum under drought stress. Plant Physiol. Biochem. 2012, 54, 78–88. [Google Scholar] [CrossRef]
  11. Xu, C.; Li, Z.; Wang, J. Linking heat and adaptive responses across temporal proteo-transcriptome and physiological traits of Solidago canadensis. Environ. Exp. Bot. 2020, 175, 102035–104035. [Google Scholar] [CrossRef]
  12. Bradford, M.M. A rapid and sensitive method for the quantitation of microgram quantities of protein utilizing the principle of protein-dye binding. Anal. Biochem. 1976, 72, 248–254. [Google Scholar] [CrossRef]
  13. Liu, D.L.; Zhang, B.Y.; Sun, H.M.; Peng, S.B.; Zhu, H.L. Comprehensive evaluation of cold resistance of different varieties of early-bearing walnut. J. Hortic. 2015, 42, 545–553. [Google Scholar]
  14. Cui, Z.Y.; Kong, F.N.; Mao, Y.X.; Sun, B.; Wang, J.H.; Dong, D.Y. Identification and expression patterns in tubulin and kinesin assays Gene families of Pyropia yezoens respond to dehydration stress. Ocean. Lakes 2021, 52, 673–684. [Google Scholar]
  15. Livak, K.J.; Schmittgen, T.D. Analysis of relative gene expression data using real-time quantitative PCR and the 2(-Delta Delta C(T)) Method. Methods. 2011, 25, 402–408. [Google Scholar] [CrossRef] [PubMed]
  16. Martínez-Damián, M.T.; Mejía-Muñoz, J.M.; Colinas-León, M.T.; Hernández-Epigmenio, F.; Cruz-Alvarez, O. Nutritio nal value bioactive compounds and capacity ant ioxidant in edible flowers of dahlia. Acta Sci. Pol. Hortorum Cultus 2021, 20, 63–72. [Google Scholar] [CrossRef]
  17. Ru, J.N.; Yu, T.F.; Chen, J.; Chen, M.; Zhou, Y.B.; Ma, Y.Z.; Xu, Z.S.; Min, D.H. Response of Wheat Zinc-Finger Transcription Factor Ta Di19A to Cold and its Screening of Interacting protein. Sci. Agric. Sin. 2017, 50, 2411–2422. [Google Scholar]
  18. Zhang, K.; Jiang, L.; Wang, X.; Han, H.; Chen, D.; Qiu, D.; Yang, Y. Transcriptome-wide analysis of AP2/ERF transcription factors involved in regulating taxol biosynthesis in Taxus media. Ind. Crops Prod. 2021, 171, 114373. [Google Scholar] [CrossRef]
  19. Licausi, F.; Ohme-Takagi, M.; Perata, P. APETALA2/ethylene responsive factor (AP2/ERF) transcription factors: Mediators of stress responses and developmental programs. New Phytol. 2013, 199, 639–649. [Google Scholar] [CrossRef]
  20. Franco-Zorrilla, J.M.; López-Vidriero, I.; Carrasco, J.L.; Godoy, M.; Vera, P.; Solano, R. DNA-binding specificities of plant transcription factors and their potential to define target genes. Proc. Natl. Acad. Sci. USA 2018, 111, 2367–2372. [Google Scholar] [CrossRef] [Green Version]
  21. Aliakbari, A. RNA-seq Transcriptome Profiling of the Halophyte Salicornia persica in Response to Salinity. J. Plant Growth Regul. 2021, 40, 707–721. [Google Scholar] [CrossRef]
  22. Miura, K.; Furumoto, T. Cold signaling and cold response in plants. Int. J. Mol. Sci. 2013, 14, 5312–5337. [Google Scholar] [CrossRef] [Green Version]
  23. Bai, X.X.; Run, X.; Yao, Y.C.; Ning, L.; Wang, S.G.; Sun, D.Z. The role and research progress of DREB/CBF transcription factors in plant abiotic stress. J. Biol. 2017, 34, 88–93. [Google Scholar]
  24. Zhang, C.; Ding, Z.; Wu, K.; Yang, L.; Li, Y.; Yang, Z.; Shi, S.; Liu, X.J.; Zhao, S.S.; Yang, Z.R.; et al. Suppression ofjasmonic acid-mediated defenseby vira-inducible microRNA319 faciitates virus infection in rice. Mol Plant. 2016, 9, 1302–1314. [Google Scholar] [CrossRef] [PubMed] [Green Version]
  25. Wang, S.T.; Sun, X.L.; Hoshino, Y.; Yu, Y.; Jia, B.; Sun, Z.W.; Duan, X.B.; Zhu, Y.M. MicroRNA319 positively regulates cold tolerance bytargetingOsPCF6 and OsTCP21 in rice (Oryza sativa L.). PLoS ONE 2014, 9, e91357. [Google Scholar]
  26. Lv, K.W.; Li, J.; Zhao, K.; Chen, S.; Nie, J.; Zhanq, W.L.; Liu, G.F.; Wei, H. Overexpression of an AP2/ERF family gene, BpERF13.in birch enhances cold tolerance through upregulating CBF genes and mitigating reactive oxygen species. Plant Sci. 2019, 292, 110375. [Google Scholar] [CrossRef]
  27. Zhang, Y.; Ming, R.; Khan, M.; Wang, Y.; Dahro, B.; Xiao, W.; Li, C.; Liu, J.H. ERF9 of Poncirus trifoliata (L.) Raf. undergoes feedback regulation by ethylene and modulates cold tolerance via regulating a glutathione S-transferase U17 gene. Plant Biotechnol. 2022, 20, 183–200. [Google Scholar] [CrossRef]
  28. Li, M.Y. Chilling injury and freezing injury of melons hazard symptim recognition. Vegetables 2021, 361, 81–83. [Google Scholar]
  29. Song, J.W.; Yin, D.S.; Zhao, D.G.; Qi, B.B.; Chen, Y.Y.; Zhou, L.; Peng, L. The response of flavonoid and polyphenols in juglans regia leaves to low temperature stress. Study Hebei For. Fruit 2017, 32, 34–41. [Google Scholar]
  30. Jiang, Y.X.; Zhang, H.N.; Guo, P.; Hu, H.C.; Li, T.; Lai, B.; Du, L.N. Genome-wide identification and expression analysis of chalcone synthase (CHS) gene family in longan. Mol. Plant Breed. 2021. [Google Scholar]
  31. Zhang, N.; Bao, H.; Cui, B.L.; Chen, K.L. Genomic analysis of chalcone synthase gene family of Phyllostachys edulis. Mol. Plant Breed. 2022, 20, 817–825. [Google Scholar]
  32. Qin, X.Y.; Qiao, J.J.; Li, Y.N. Structure, function and application of hydroxycinnamoyl transferase. Chin. J. Biochem. Mol. Biol. 2019, 35, 1058–1066. [Google Scholar]
  33. Long, X.Q.; Nie, C.; He, J.Z.; Tian, Y.; Li, X.R.; Pi, X.Y.; Wang, W.J.; Zhu, Q.K. Bioinformatics and expression analysis of hydroxycinnamoyl transferase gene family in Dendrobium candidum. J. Fujian Agric. 2022, 37, 492–502. [Google Scholar]
  34. Li, J.; An, Y.Y.; Wang, L.J. Transcriptomic analysis of Ficus carica Peels with a focus on the key genes for anthocyanin bi osynthesis. Int. J. Mol. Sci. 2020, 21, 1245. [Google Scholar] [CrossRef] [PubMed] [Green Version]
  35. Zhao, W.P.; Ding, Z.J.; Wang, F.P.; Liu, Y.; Liu, A.M.; Liu, K.Q.; Cai, H. Molecular characteristion, prokaryotic expression and expression pattern analysis of an anthocyanin synthase gene from Chrysanthemum morifolium ‘Chuju’. J. Plant Physiol. 2022, 58, 677–686. [Google Scholar]
  36. Li, J.; Liang, Y.M.; Zhao, A.C.; Liu, C.Y.; Lv, R.H.; Liu, X.Q.; Yu, M.D. Cloning and expression analysis of anthocyanin reductase gene from Mulberry. Seric. Sci. 2016, 42, 570–575. [Google Scholar]
  37. Xu, Y.; Chen, J.H.; Zhu, A.G.; Luan, M.B.; Wang, X.F.; Sun, Z.M. Research progress on response mechanism of plant under low temperature stress. Chin. Hemp Ind. Sci. 2015, 37, 40–49. [Google Scholar]
  38. Luo, P.; He, J.J.; Yao, Y.L.; Mo, Y.W. Effect of chilling stress on leaf antioxidative abilities of rubble trees with different chilling tolerance. J. Northwest Bot. 2014, 34, 311–317. [Google Scholar]
  39. Wu, Y.X.; Tian, J.B.; Qiao, Y.S.; Shi, M.J.; Tian, X.; Liu, Z.H.; Ru, H.L.; Liang, Q.; Cheng, P.H. Analysis of physiological and biochemical index for cold resistance of walnut leaf under low temperature stress. China Agron. Bull. 2016, 32, 101–106. [Google Scholar]
  40. Ren, J.J.; Zhao, S.; Su, Y.P.; Qi, G.H.; Li, B.G. Effect of low temperature stress in spring on antioxidase indexes of walnuts. J. Northwest Agric. For. Univ. (Nat. Sci. Ed.) 2016, 44, 75–81. [Google Scholar]
  41. Ai, P.F.; Jin, X.J.; Jin, Z.Z.; Yan, F.Q.; Li, K.W. Evaluation of cold-Resistant physiological of Kernel Apricot. J. Hebei Univ. Sci. Technol. 2013, 34, 48–53. [Google Scholar]
  42. Shen, H.; Meng, J.L.; Wu, S.J.; Yu, X. Screen of low temperature tolerant germplasm and the effect of low temperature on the physiological indexes in watermelon. J. North. Agric. 2021, 49, 115–123. [Google Scholar]
  43. Shalmani, A.; Jing, X.Q.; Shi, Y.; Muhammad, I.; Chen, K.M. Characterization of B-BOX gene family and their expression profiles under hormonal, abiotic and metal stresses in Poaceae plants. BMC Genom. 2019, 20, 27. [Google Scholar] [CrossRef] [PubMed] [Green Version]
  44. Hartmann, J.; Fischer, C.; Dietrich, P.; Sauter, M. Kinase activity and calmodulin binding are essential for growth signaling by the phytosulfokine receptor PSKR1. PIant J. 2014, 78, 192–202. [Google Scholar] [CrossRef] [PubMed]
  45. Huang, D.; Wu, Y. The research progress on the functions of plant phospholipase C. Life Sci. 2017, 29, 575–581. [Google Scholar]
  46. Hong, Y.; Zhao, J.; Guo, L.; Kim, S.C.; Deng, X.; Wang, G.; Zhang, G.; Li, M.; Wang, X. Plant phospholipases D and C and their diverse functions in stress responses. Prog. Lipid Res. 2016, 62, 55–74. [Google Scholar] [CrossRef] [Green Version]
  47. Wang, Y.T.; Guo, B.S.; Zhang, M.X.; Zhu, H.H.; Xu, J.; Liu, H.W.; Wang, F.Y.; Wang, H. Methods for determining hydrolysis activity of phospholipase D. Food Res. Dev. 2022, 43, 189–194. [Google Scholar]
  48. Li, H.; Yang, N.; Liu, R.R.; Zhou, Y.P.; Gao, R.; Du, Y.Q. The role of phosphoinositide- specific PLC in plant growth and development. Chin. J. Cell Biol. 2020, 42, 2215–2226. [Google Scholar]
  49. Peters, C.; Kim, S.C.; Devaiah, S.; Li, M.; Wang, X. Non-specific phospholipase C5 and diacylglycerol promote lateral root development under mild salt stress in Arabidopsis. Plant Cell Environ. 2014, 37, 2002–2013. [Google Scholar] [CrossRef] [PubMed]
  50. Singh, A.; Pandey, A.; Baranwal, V.; Kapoor, S.; Pandey, G.K. Comprehensive expression analysis of rice phospholipase D gene family during abiotic stresses and development. Plant Signal. Behav. 2013, 7, 847–854. [Google Scholar] [CrossRef] [Green Version]
  51. Krčková, Z.; Brouzdová, J.; Daněk, M.; Kocourková, D.; Rainteau, D.; Ruelland, E.; Valentová, O.; Pejchar, P.; Martinec, J. Arabidopsis non-specific phospholipase C1: Characterization and its involvement in response to heat stress. Front. Plant Sci. 2015, 6, 928. [Google Scholar] [CrossRef] [PubMed] [Green Version]
  52. Liu, Y.; Chen, S.K.; Wang, C.W.; Li, J.W.; Li, H.F. Genome-wide identification, phylogeny and Expression analysis of MYB-MYC transcription factors in rice. J. Northwest Agric. 2019, 28, 1790–1800. [Google Scholar]
  53. Cheng, L.Q.; Li, X.X.; Huang, X.; Ma, T.; Liang, Y.; Ma, X.Y.; Peng, X.J.; Jia, J.T.; Chen, S.Y.; Chen, Y.; et al. Overexpression of sheepgrass R1-MYB transcription factor LcMYB1 confers salt tolerance in transgenic Arabidopsis. Plant Physiol. Biochem. 2013, 70, 252–260. [Google Scholar] [CrossRef] [PubMed]
  54. Zhang, Y.; Chen, S.; Gao, Y.; Huang, H.J. Functional study of BpMYB4 in birch response to low temperature stress. J. Nanjing For. Univ. (Nat. Sci. Ed.) 2019, 43, 25–31. [Google Scholar]
  55. Wang, F.B.; Kong, W.L.; Wong, G.; Fu, L.F.; Peng, R.H.; Li, Z.J.; Yao, Q.H. AtMYB12 regulates flavonoids accumulation and abiotic stress tolerance in transgenic Arabidopsis thaliana. Mol. Genet. Genom. 2016, 291, 1545–1559. [Google Scholar] [CrossRef] [PubMed]
  56. Liu, J.J.; She, L.L.; Lan, X.Z.; Lu, Y.N.; Yang, J.H.; Liu, H.; Lu, C.F.; Chen, Y.Z. Bioinformatics and expression analysis of MYB gene familybased on transcriptome of cold-acclimated Mirabilis himalaica callus. China Agron. Bull. 2020, 36, 54–61. [Google Scholar]
Figure 1. Comparison of ‘Jinguang’ pear flower organ condition after 4 h of treatment at 18 °C (CK), 2 °C (CT1), 0 °C (CT2), −2 °C (CT3), or −4 °C (CT4).
Forests 14 00490 g001
Figure 2. The effects of low-temperature stress on the relative conductivity of flower organs, malondialdehyde (MDA), superoxide dismutase (SOD), catalase (CAT), and soluble protein (SP) contents of different varieties. Variation in the (a) relative conductivity. (b) MDA, (c) SOD, (d) Soluble protein, and (e) CAT contents under low-temperature stress. Error bars indicate the standard error, and different lowercase letters indicate significant differences between treatments (p < 0.05).
Forests 14 00490 g002
Figure 3. (a) Numbers of differentially expressed genes (DEGs) in the transcriptome of ‘Jinguang’ pear flowers. (b) Venn diagram of DEGs among cold treatment groups.
Forests 14 00490 g003
Figure 4. Heatmap of differential transcription factor expression.
Forests 14 00490 g004
Figure 5. GO results for DEGs between CK and the (a) CT1 and CT2 (>0 °C) and (b) CT3 and CT4 (<0 °C) treatment groups.
Forests 14 00490 g005
Figure 6. KEGG results for DEGs between CK and the (a) CT1 and CT2 (>0 °C) and (b) CT3 and CT4 (<0 °C) treatment groups.
Forests 14 00490 g006
Figure 7. DEGs common to the two comparison groups (CK vs. >0 °C or <0 °C treatment) according to KEGG pathway analysis.
Forests 14 00490 g007
Figure 8. Heat map of DEGs enriched in the flavonoid biosynthesis pathway. Blue and red indicate low and high gene expression levels, respectively.
Forests 14 00490 g008
Figure 9. Weighted gene co-expression network analysis (WGCNA) and module–trait correlation analysis results. (a) Hierarchical clustering tree showing co-expression modules identified using the dynamic tree-cutting method. Different modules are indicated by different colors. Each leaf in the tree represents a gene. The main branches formed 16 modules, indicated by different colors. (b) biochemistry indicators and WGCNA modules. Each row corresponds to a module shown in (a). The columns correspond to biochemistry indices, and the color of each cell indicates the difference between the correlation coefficient module and the biochemistry index. Numbers in the cells indicate correlation coefficients; asterisks indicate statistical significance. (c) Correlations between soluble proteins and WGCNA modules. (d) Correlation between MDA content and WGCNA modules.
Forests 14 00490 g009
Figure 10. (a) Gene co-expression heat map of the cyan module (upper panel) and expression of corresponding signature genes in each sample (lower panel). (b) A hub gene dot map showed high connectivity and expressivity for MDA content and the cyan module. The x-axis represents the correlation between the expression of each gene and the module, and the y-axis represents the correlation between each gene and the trait. (c) GO analysis of hub genes associated with MDA-related traits in cyan module genes. (d) Co-expression network of hub genes in the cyan module. The network was constructed using the top 100 hub genes, with a weight > 0.30.
Forests 14 00490 g010
Figure 11. (a) Gene co-expression heat map of the light yellow module (upper panel) and expression of corresponding signature genes in each sample (lower panel). (b) A hub gene point map showed high connectivity and expressivity for MDA content and the light yellow module. The x-axis represents the correlation between the expression of each gene and the module, and the y-axis represents the correlation between each gene and the trait. (c) GO enrichment analysis of hub genes associated with MDA content in the light yellow module. (d) Co-expression network of hub genes in the light yellow module. The network was constructed using the top 100 hub genes, with a weight > 0.30.
Forests 14 00490 g011
Figure 12. The accuracy of the RNA-seq date was verified by RT-qPCR.
Forests 14 00490 g012
Table 1. Principal component analysis (PCA) results for the five pear varieties under cold stress at a range of low temperatures.
VarietyPCA ResultsRank
PC1PC2PC3Composite ScoreAverage Affiliation
‘HG051102′−0.1077230.5133270.1146860.00050.761271
‘Meiyu’0.025991−0.0709410.7207830.00290.645232
‘Jinguang’0.2540360.072755−0.0181730.00230.357423
‘SJ051105′0.2601280.0814430.0301260.01290.175825
‘041047′0.0726190.0835590.0017930.01540.291274
Disclaimer/Publisher’s Note: The statements, opinions and data contained in all publications are solely those of the individual author(s) and contributor(s) and not of MDPI and/or the editor(s). MDPI and/or the editor(s) disclaim responsibility for any injury to people or property resulting from any ideas, methods, instructions or products referred to in the content.