

Climate-Sensitive Diameter Growth Models for White Spruce and White Pine Plantations

Abstract
:1. Introduction
2. Materials and Methods
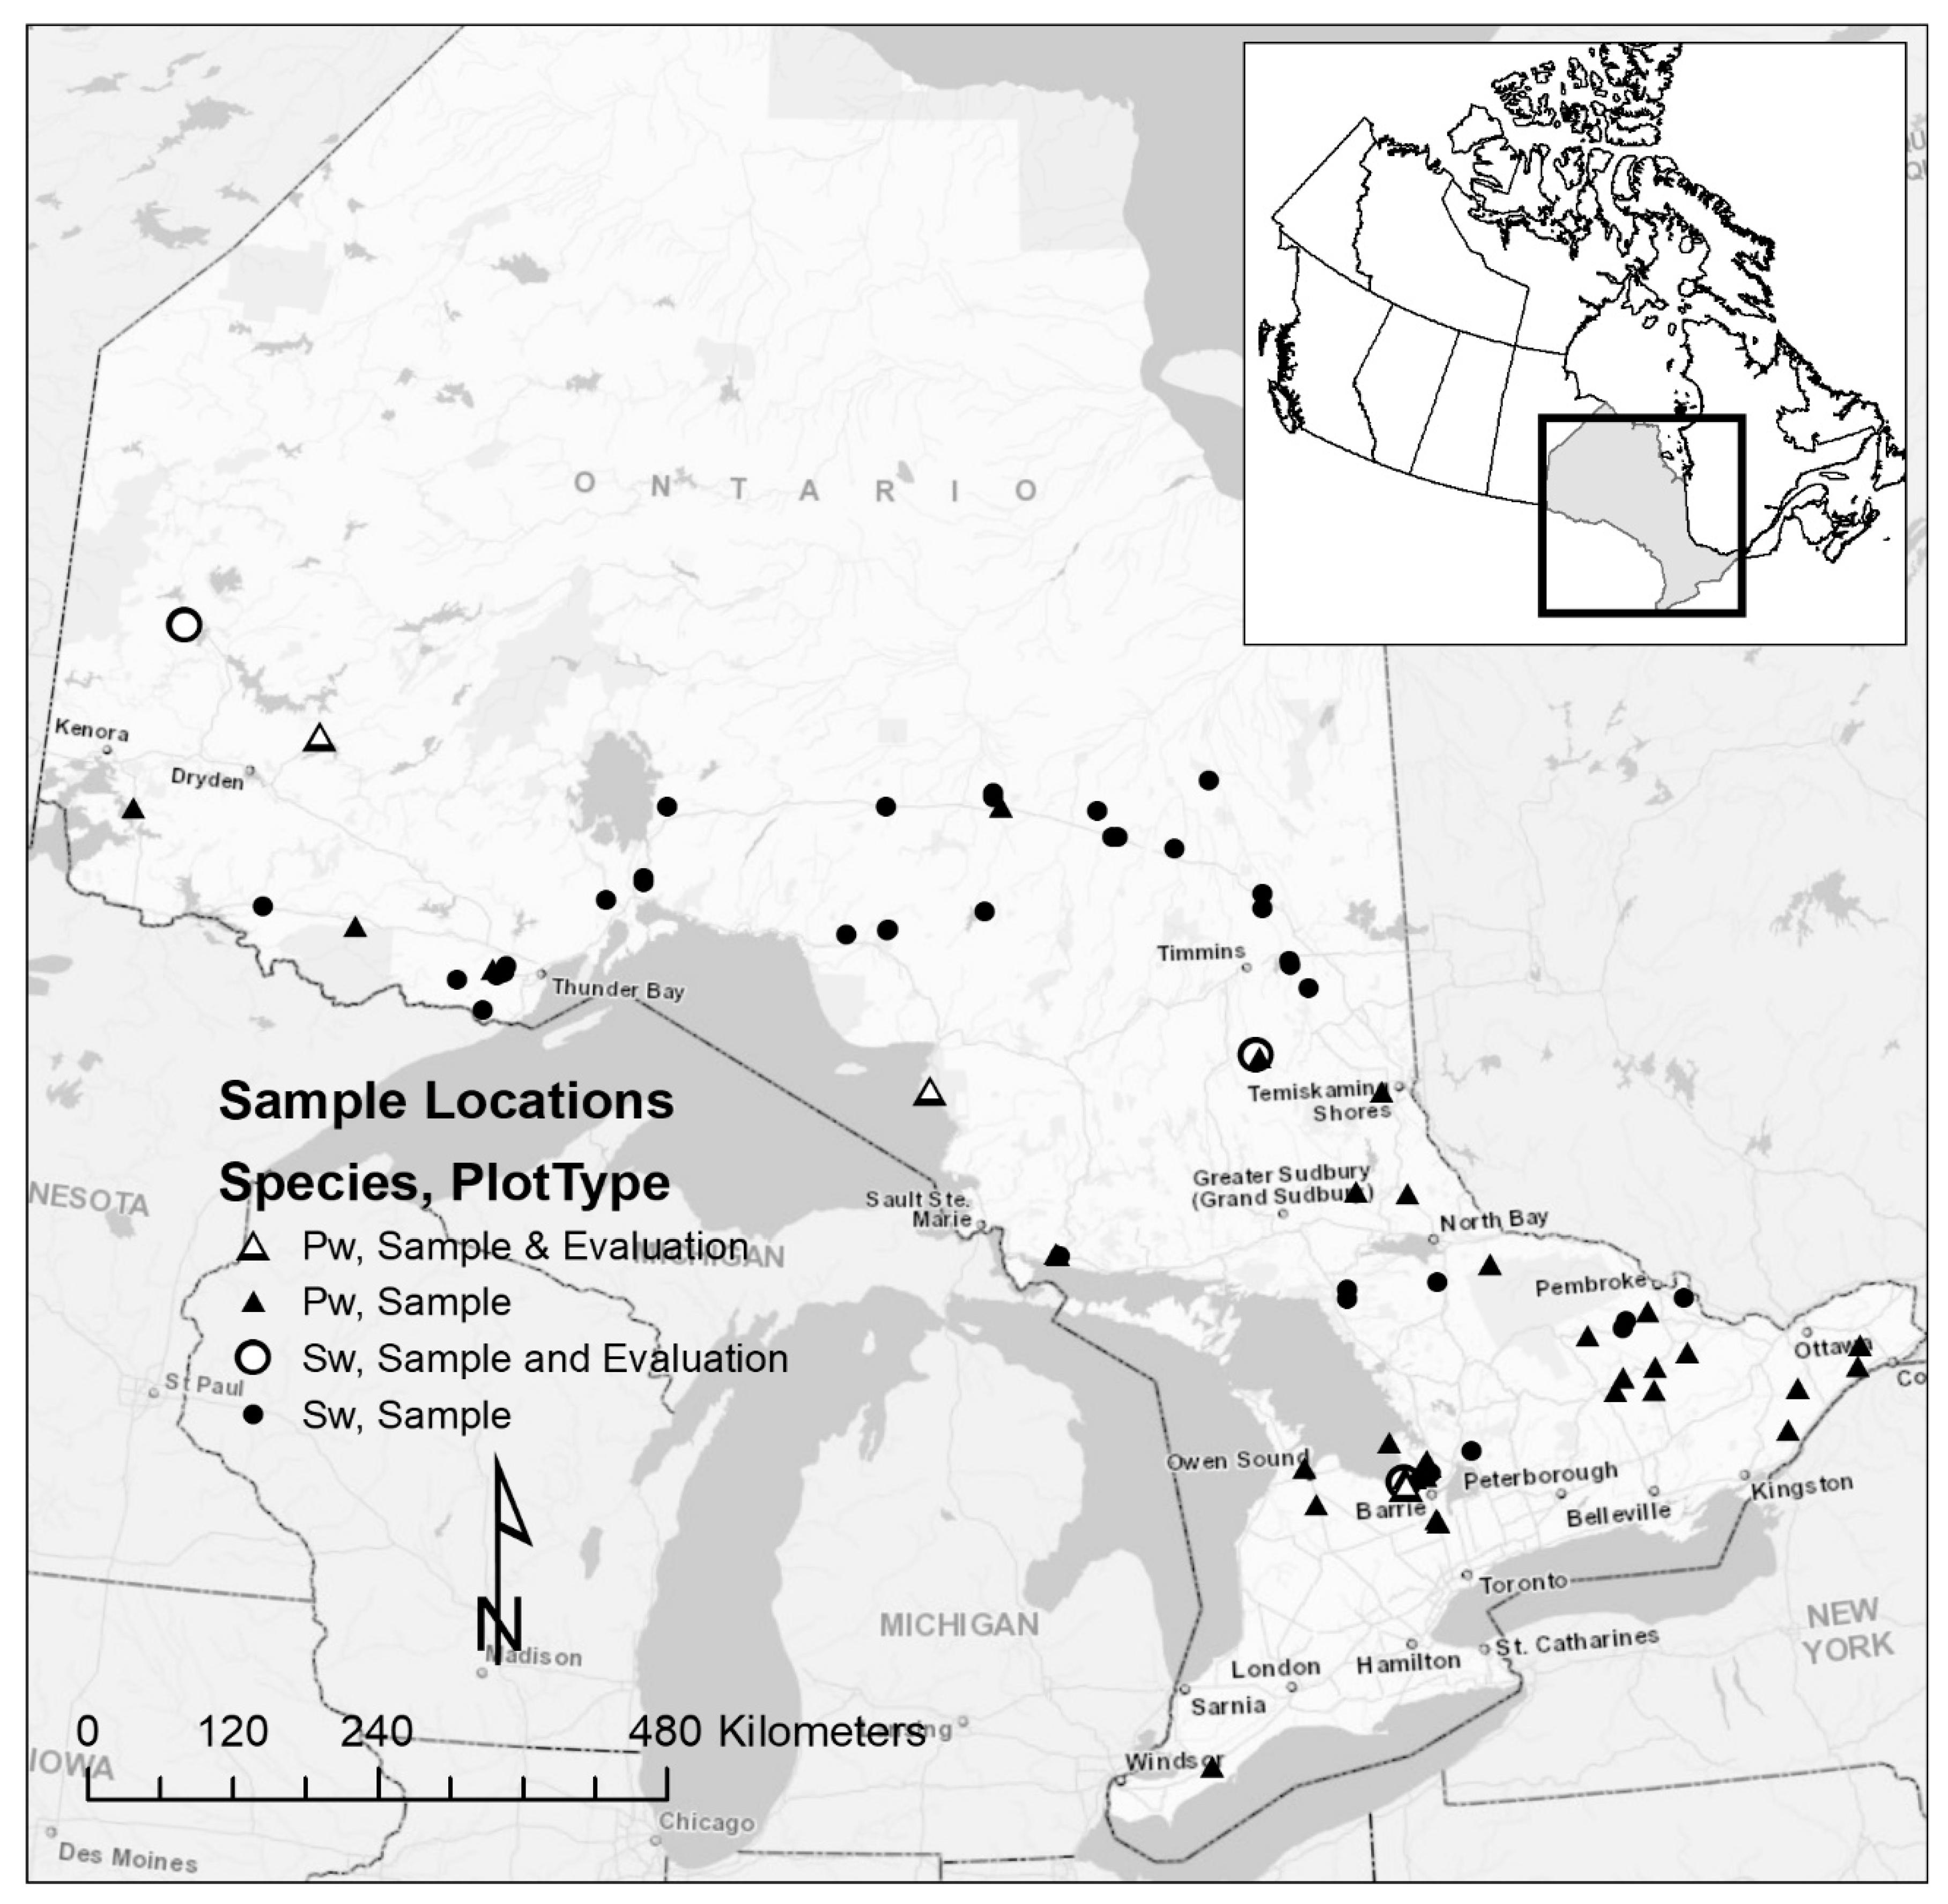
2.1. Tree Data
2.2. Climate Data
2.3. Diameter Growth Models
2.4. Methods
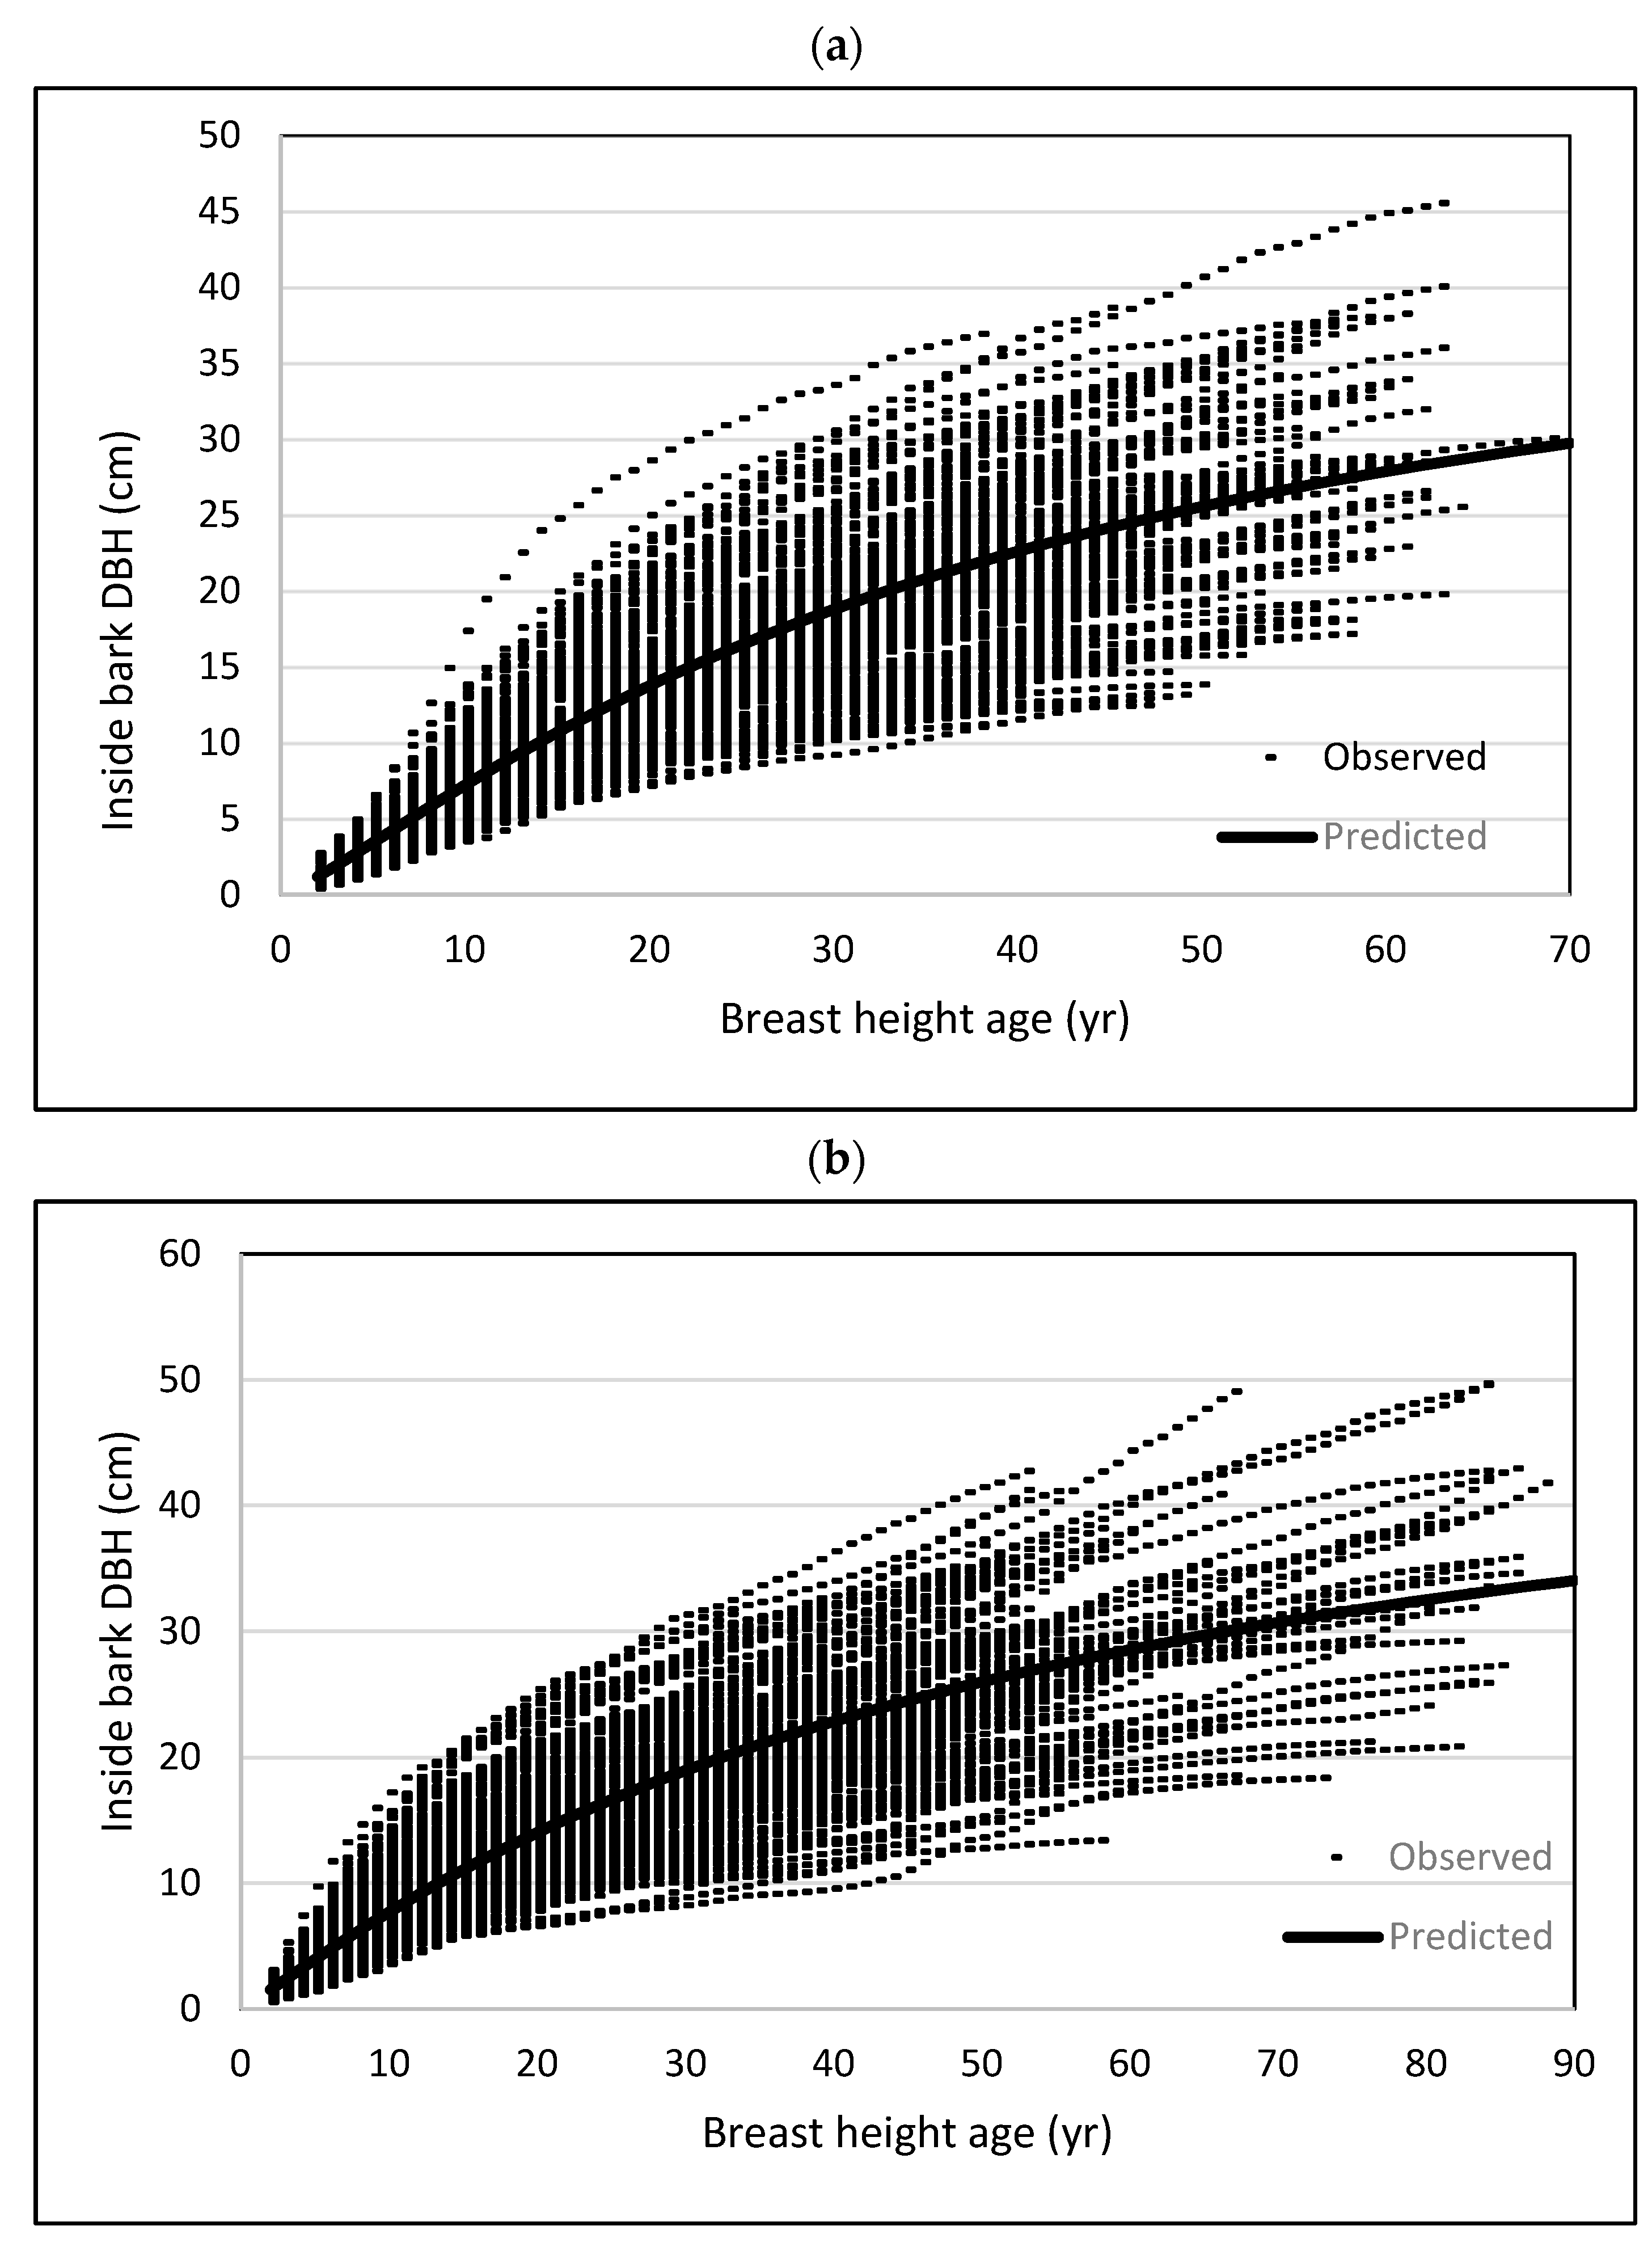
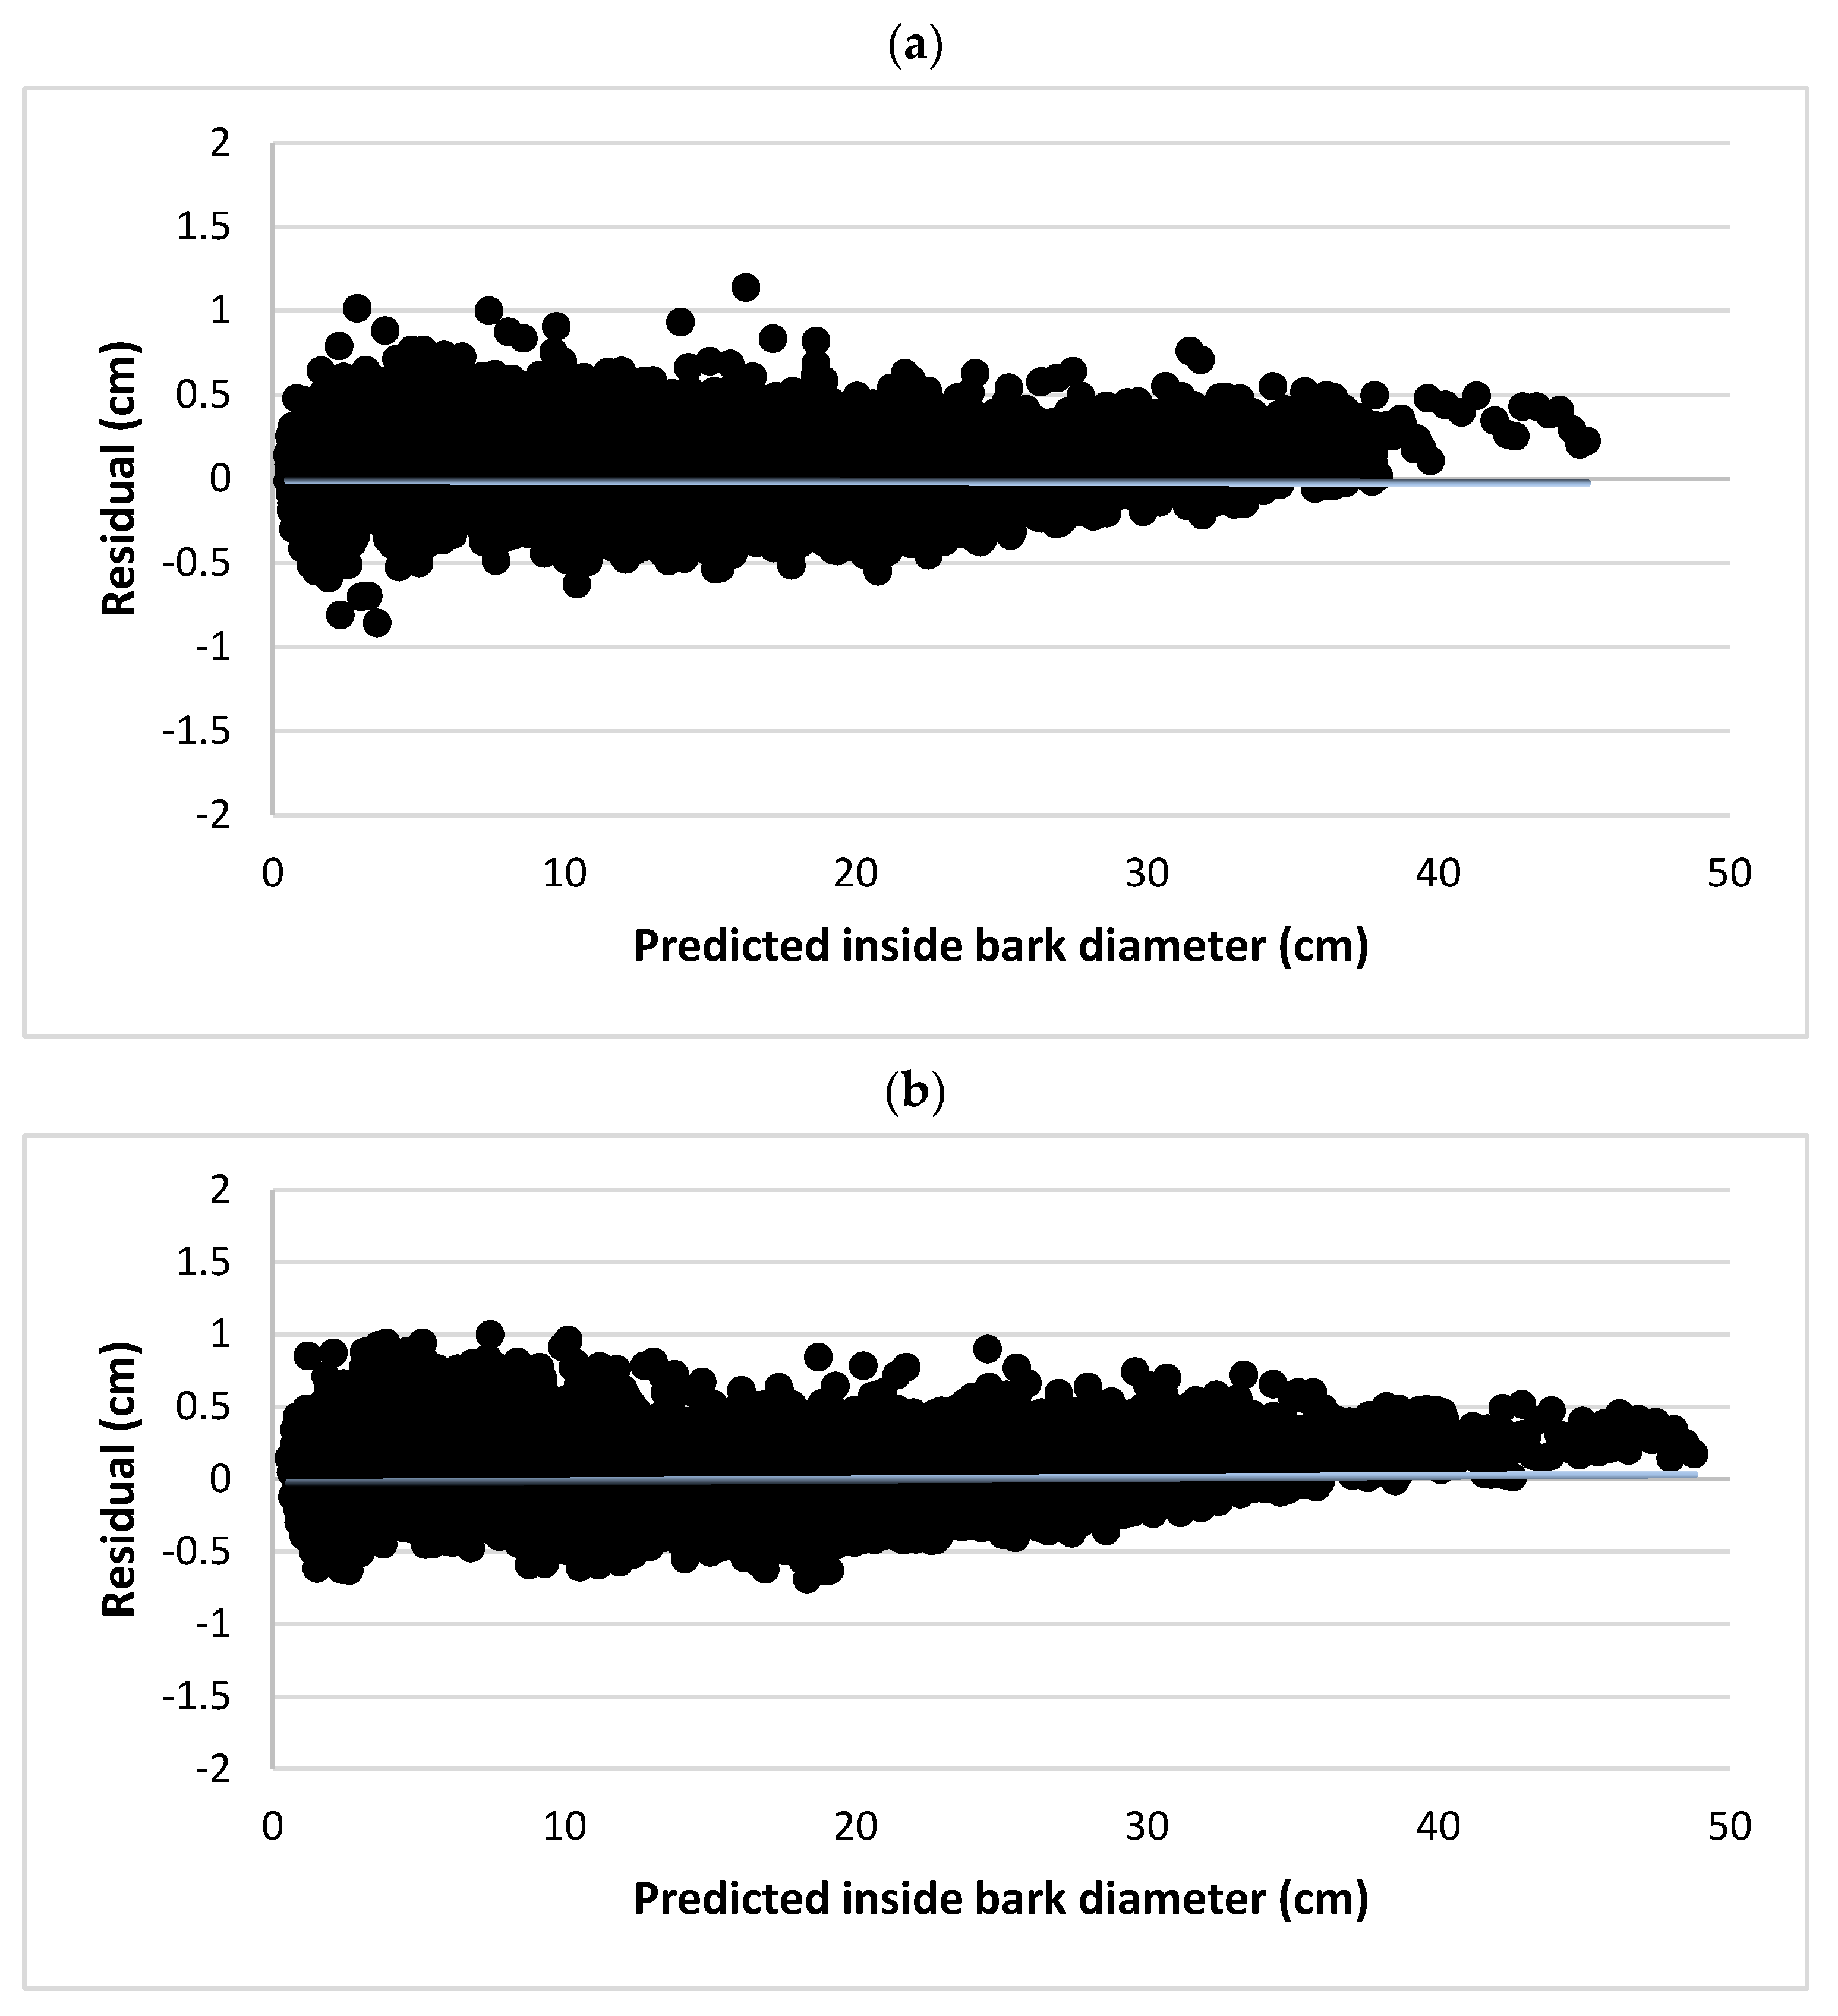
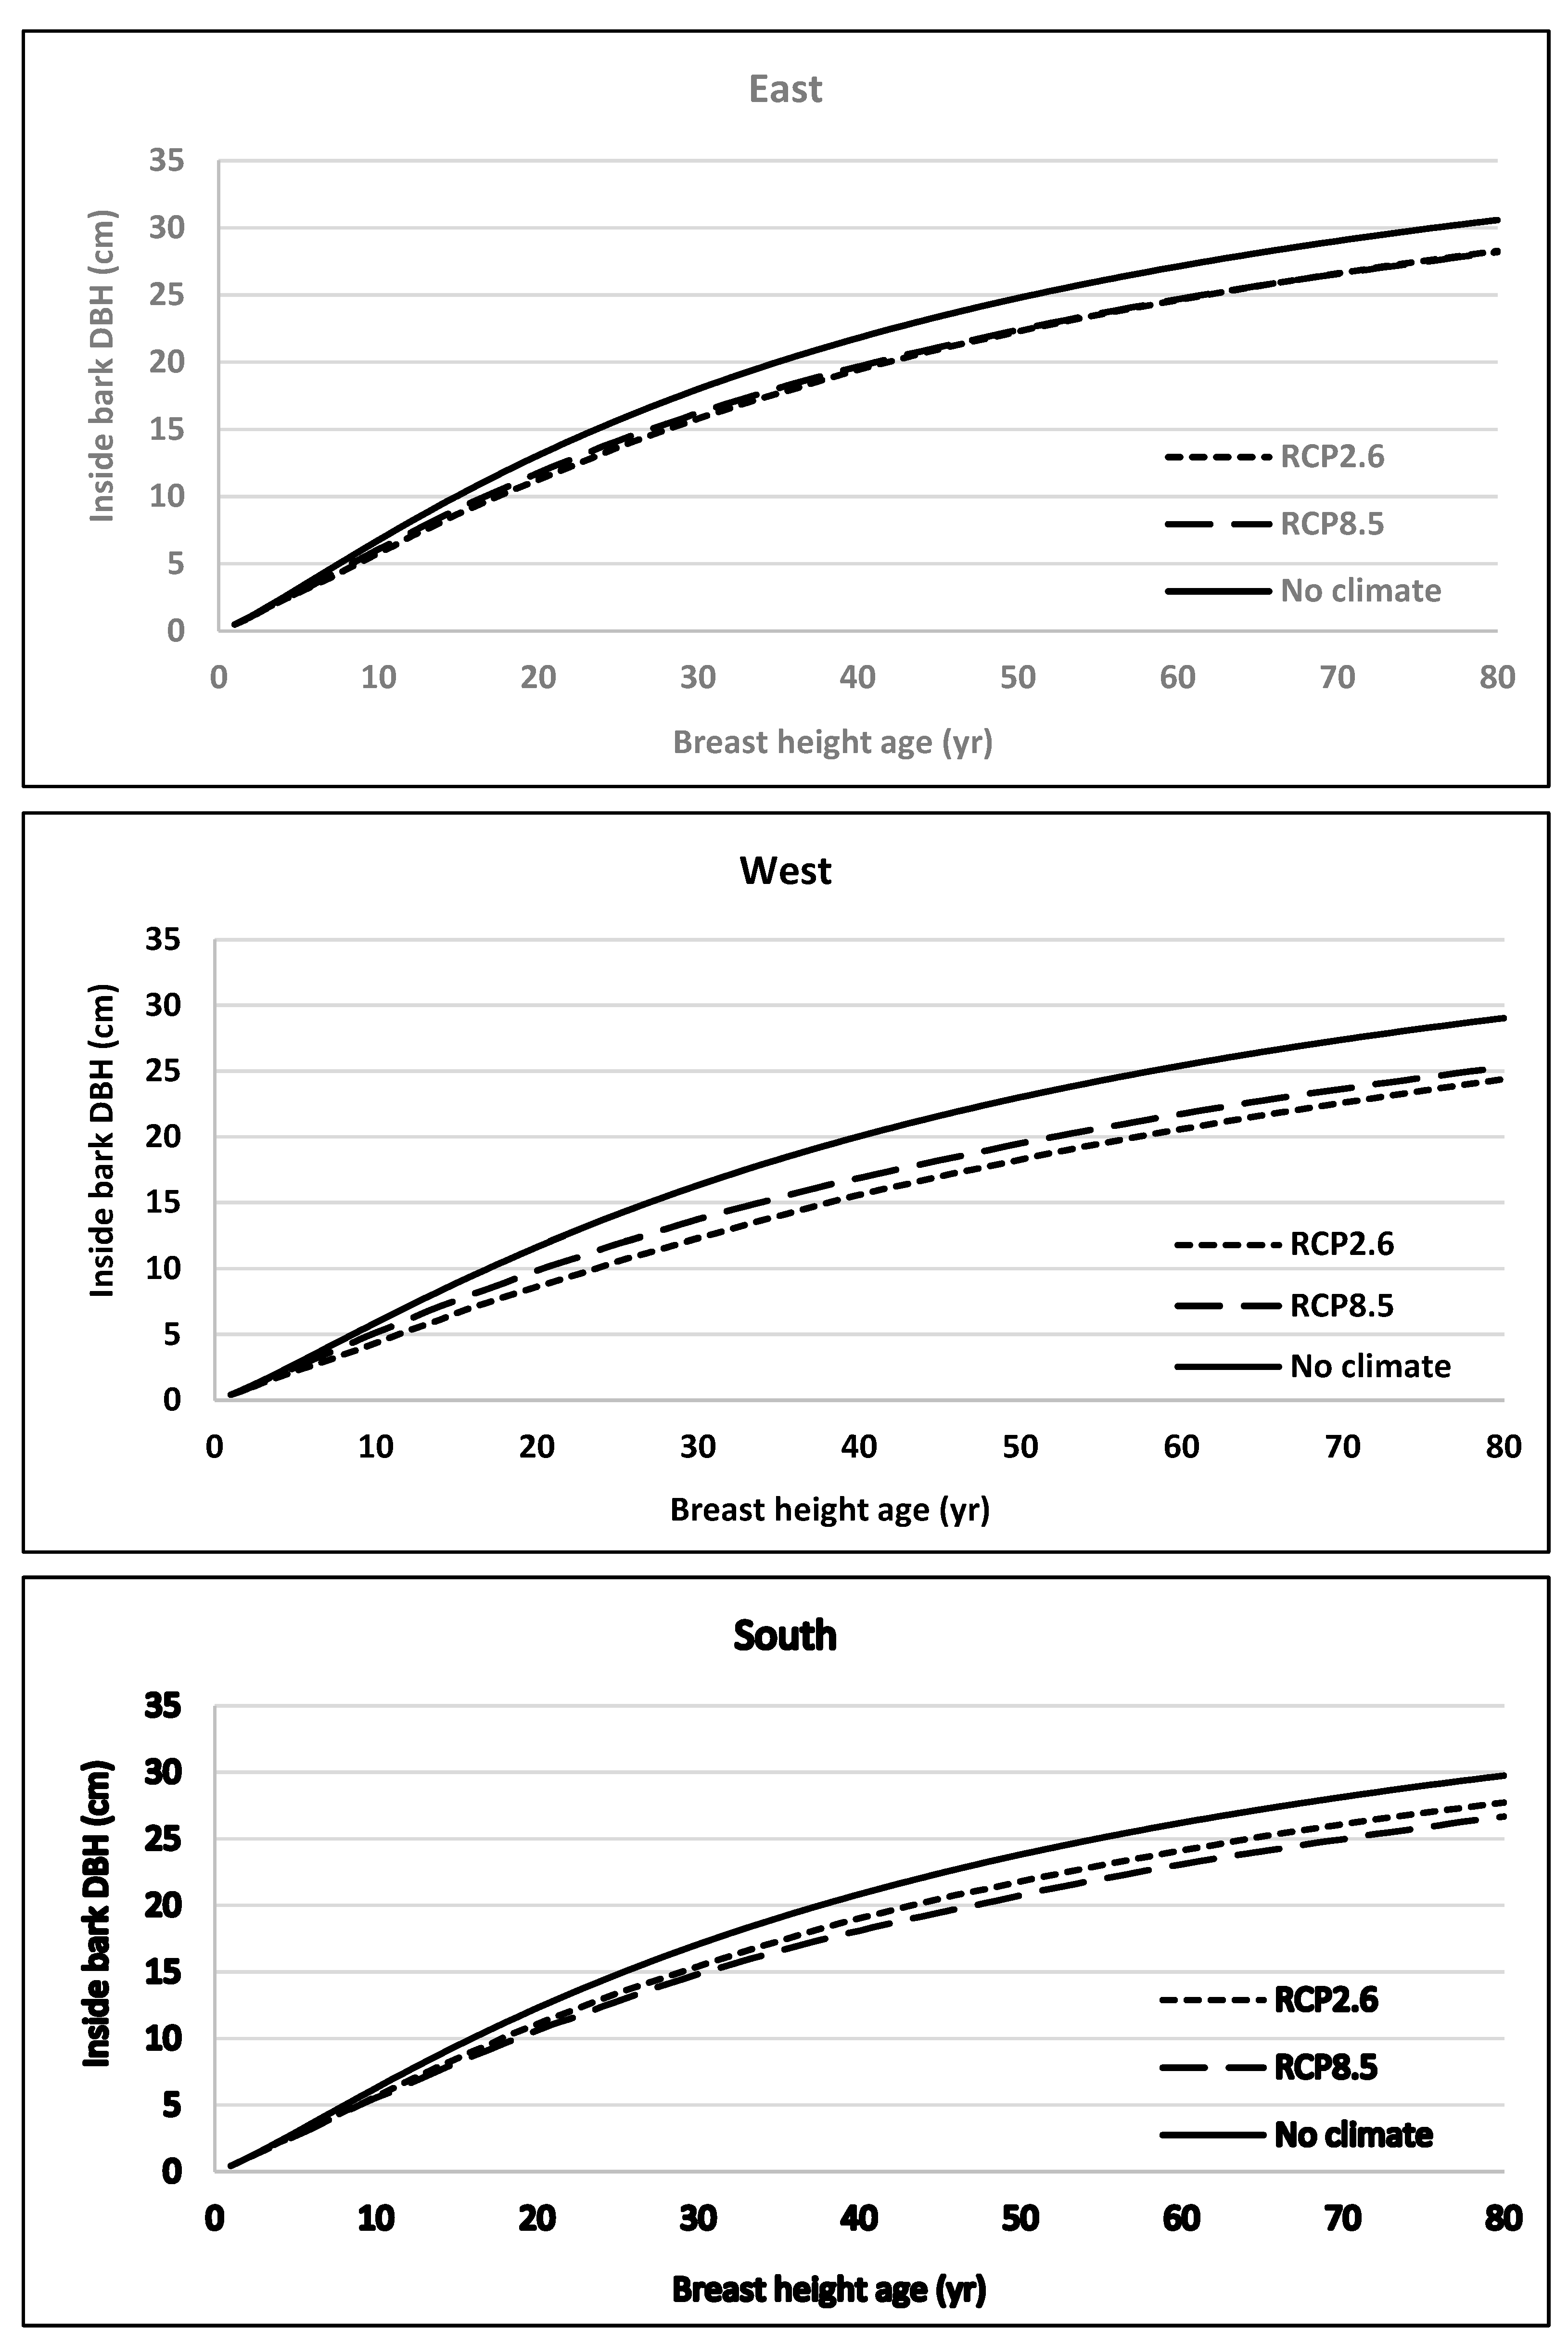
3. Results
4. Discussion
5. Conclusions
Funding
Data Availability Statement
Acknowledgments
Conflicts of Interest
References
- Vanclay, K. Modelling Forest Growth and Yield: Application to Mixed Tropical Forests; CAB International: Wallingford, UK, 1994. [Google Scholar]
- Avery, T.E.; Burkhart, H.E. Forest Measurements; McGraw-Hill: New York, NY, USA, 2002; 456p. [Google Scholar]
- Sharma, M. Modelling climate effects on diameter growth of red pine trees in boreal Ontario, Canada. Trees For. People 2021, 4, 100064. [Google Scholar] [CrossRef]
- Chhin, S.; Hogg, E.H.; Lieffers, V.J.; Huang, S. Potential effects of climate change on the growth of lodgepole pine across diameter size classes and ecological regions. For. Ecol. Manag. 2008, 256, 1692–1703. [Google Scholar] [CrossRef]
- Maxime, C.; Hendrik, D. Effects of climate on diameter growth of co-occurring Fagus sylvatica and Abies alba along an altitudinal gradient. Trees 2011, 25, 265–276. [Google Scholar] [CrossRef]
- Toledo, M.; Poorter, L.; Pena-Clara, M.; Balkazar, A.A.J.; Leano, C.; Licona, J.C.; LIanque, O.; Zuidema, V.V.P.; Bongers, F. Climate is a stronger driver of tree and forest growth rates than soil and disturbance. J. Ecol. 2011, 99, 254–264. [Google Scholar] [CrossRef]
- Hökkä, H.; Salminen, H.; Ahti, E. Effect of temperature and precipitation on the annual diameter growth of Scots pine on drained peatlands and adjacent mineral soil sites in Finland. Dendrochronologia 2012, 30, 157–165. [Google Scholar] [CrossRef]
- Matisons, R.; Puriņa, L.; Adamovičs, A.; Robalte, L.; Jansons, Ā. European beech in its northeasternmost stands in Europe: Varying climategrowth relationships among generations and diameter classes. Dendrochronologia 2017, 45, 123–131. [Google Scholar] [CrossRef]
- Rubio-Cuadrado, Á.; Bravo-Oviedo, A.; Mutke, S.; Del Río, M. Climate effects on growth differ according to height and diameter along the stem in Pinus pinaster Ait. iForest 2018, 11, 237–242. [Google Scholar] [CrossRef]
- Jiao, L.; Xue, R.; Qi, C.; Chen, K.; Liu, X. Comparison of the responses of radial growth to climate change for two dominant coniferous tree species in the eastern Qilian Mountains, northwestern China. Int. J. Biometeorol. 2021, 65, 1823–1836. [Google Scholar] [CrossRef]
- Adhikari, A.; Masters, R.E.; Adams, H.D.; Will, R.E. Radial growth responses of post oak (Quercus stellata) to climate variability and management in southeastern Oklahoma, USA. Can. J. For. Res. 2022, 52, 209–219. [Google Scholar] [CrossRef]
- Subedi, N.; Sharma, M. Climate-diameter growth relationships of black spruce and jack pine trees in boreal Ontario, Canada. Glob. Chang. Biol. 2013, 19, 505–516. [Google Scholar] [CrossRef]
- Pokharel, B.; Froese, R.B. Representing site productivity in the basal area increment model for FVS-Ontario. For. Ecol. Manag. 2009, 258, 657–666. [Google Scholar] [CrossRef]
- Oboite, O.F.; Comeau, P.G. Climate sensitive growth models for predicting diameter growth of western Canadian boreal tree species. For. Int. J. For. Res. 2021, 94, 363–373. [Google Scholar] [CrossRef]
- Bayat, M.; Knoke, T.; Heidari, S.; Hamidi, S.K.; Burkhart, H.; Jaafari, A. Modeling Tree Growth Responses to Climate Change: A Case Study in Natural Deciduous Mountain Forests. Forests 2022, 13, 1816. [Google Scholar] [CrossRef]
- Yeh, H.Y.; Wensel, L.C. The relationship between tree diameter growth and climate for coniferous species in northern California. Can. J. For. Res. 2000, 30, 1463–1471. [Google Scholar] [CrossRef]
- McKenney, D.W.; Hutchinson, M.F.; Papadopol, P. Customized spatial climate models for North America. Bull. Am. Meteorol. Soc. 2011, 92, 1161–1622. [Google Scholar] [CrossRef]
- Hogg, E.H. Climate and the southern limit of the western Canadian boreal forest. Can. J. For. Res. 1994, 24, 1835–1845. [Google Scholar] [CrossRef]
- Wykoff, W.R. A basal area increment model for individual conifers in the northern Rocky Mountains. For. Sci. 1990, 36, 1077–1104. [Google Scholar]
- Murphy, P.A.; Shelton, M.G. An individual-tree basal area growth model for loblolly pine stands. Can. J. For. Res. 1996, 26, 327–331. [Google Scholar] [CrossRef]
- Weiskittel, A.R.; Garber, S.M.; Johnson, G.P.; Maguire, D.A.; Monserud, R.A. Annualized diameter and height growth equations for Pacific Northwest plantation-grown Douglas-fir, western hemlock, and red alder. For. Ecol. Manag. 2007, 250, 266–278. [Google Scholar] [CrossRef]
- Leites, L.P.; Robinson, A.P.; Crookston, N.L. Accuracy and equivalence testing of crown ratio models and assessment of their impact on diameter growth and basal area increment predictions of two variants of the Forest Vegetation Simulator. Can. J. For. Res. 2009, 39, 655–665. [Google Scholar] [CrossRef]
- Subedi, N.; Sharma, M. Individual-tree diameter growth model for black spruce and jack pine plantations in northern Ontario. For. Ecol. Manag. 2011, 261, 2140–2148. [Google Scholar] [CrossRef]
- Sharma, R.P.; Vacek, Z.; Vacek, S.; Jansa, V.; Kucera, M. Modelling individual tree diameter growth for Norway spruce in the Czech Republic using a generalized algebraic difference approach. J. For. Sci. 2017, 63, 227–238. [Google Scholar] [CrossRef]
- Burkhart, H.E.; Tome, M. Modeling Forest Trees and Stands; Springer: Dordrecht, The Netherlands, 2012; 457p. [Google Scholar]
- Pinheiro, J.C.; Bates, D.M. Mixed-Effects Models in S and S-PLUS; Springer: New York, NY, USA, 2000; 528p. [Google Scholar]
- Vuuren, D.P.; Edmonds, J.A.; Kainuma, M.; Riahi, K.; Weyan, J. A special issue on the RCPs. Clim. Chang. 2011, 109, 1. [Google Scholar] [CrossRef]
- Buechling, A.; Martin, P.H.; Martin, P.H.; Canham, C.D. Climate and competition effects on tree growth in Rockey Mountain forests. J. Ecol. 2017, 105, 1636–1647. [Google Scholar] [CrossRef]
- Goldblum, D.; Rigg, L.S. Tree growth response to climate change at the deciduous-boreal forest ecotone, Ontario, Canada. Can. J. For. Res. 2005, 35, 2709–2718. [Google Scholar] [CrossRef]
- Sharma, M. Climate effects on black spruce and trembling aspen productivity in natural origin mixed stands. Forests 2022, 13, 430. [Google Scholar] [CrossRef]


| Attribute | N | Mean | Std Dev | Minimum | Maximum |
|---|---|---|---|---|---|
| White spruce | |||||
| DBH (outside bark) (cm) | 199 | 24.83 | 7.03 | 10.10 | 48.80 |
| DBH (inside bark) (cm) | 199 | 23.20 | 6.82 | 9.48 | 45.53 |
| Total height (m) | 199 | 19.59 | 3.08 | 12.30 | 26.75 |
| Breast height age (yr) | 199 | 48.22 | 7.71 | 28.00 | 69.00 |
| BA (m2 ha−1) | 40 | 41.65 | 11.16 | 22.76 | 81.50 |
| Trees ha−1 | 40 | 1134.14 | 451.22 | 533.33 | 2625.00 |
| White pine | |||||
| DBH (outside bark) (cm) | 200 | 27.78 | 8.84 | 11.50 | 55.10 |
| DBH (inside bark) (cm) | 200 | 25.42 | 8.01 | 10.82 | 49.23 |
| Total height (m) | 200 | 21.09 | 4.59 | 8.60 | 34.90 |
| Breast height age (yr) | 200 | 51.31 | 15.67 | 21.00 | 88.00 |
| BA (m2 ha−1) | 40 | 44.00 | 12.15 | 23.09 | 78.84 |
| Trees ha−1 | 40 | 975.08 | 451.72 | 366.67 | 2425.00 |
| Climate variables | |||||
| TPGS (mm) | 9680 | 459.43 | 95.86 | 108.20 | 960.40 |
| MTGS (°C) | 9680 | 13.41 | 1.04 | 9.65 | 17.20 |
| CMI for June (cm) | 9680 | −1.29 | 3.58 | −10.57 | 13.87 |
| Sum of growing months (April to August) CMIs (cm) | 9680 | −1.78 | 8.26 | −27.35 | 29.94 |
| Annual CMI (sum of 12 months CMIs) (cm) | 9680 | 30.61 | 13.69 | −15.47 | 94.72 |
| Parameters | White Spruce | White Pine | ||
|---|---|---|---|---|
| Estimates | SE | Estimates | SE | |
| β0 | 43.9032 | 0.36930 | 51.8574 | 0.64230 |
| β1 | 1.2177 | 0.00581 | 1.0898 | 0.00613 |
| σ2 | 0.18866 | 0.00054 | 0.05236 | 0.00075 |
| AIC | −4309 | NA | −1073 | NA |
| Parameters | White Spruce | White Pine | ||
|---|---|---|---|---|
| Estimates | SE | Estimates | SE | |
| β0 | 49.7726 | 0.93160 | 52.9072 | 0.7130 |
| β1 | 1.5247 | 0.06365 | 1.3601 | 0.06869 |
| β2 | −0.1585 | 0.02286 | 0.3975 | 0.06065 |
| β3 | −0.03690 | 0.004823 | −0.01308 | 0.00482 |
| β4 | 0.000381 | 0.000054 | −0.00015 | 0.00004 |
| β5 | 0.005878 | 0.001331 | 0.00687 | 0.00133 |
| β6 | NA | NA | −0.00071 | 0.00025 |
| σ2 | 0.03596 | 0.000531 | 0.05161 | 0.00074 |
| AIC | −4464 | NA | −1203 | NA |
| DBH (cm) | N | Bias | Std Dev | Min | Max |
|---|---|---|---|---|---|
| <15 | 626 | 0.1070 | 0.1282 | −0.4102 | 0.3816 |
| 15–20 | 1661 | −0.0880 | 0.1521 | −0.5379 | 0.6449 |
| 20–25 | 2390 | −0.0473 | 0.1626 | −0.7024 | 0.7316 |
| 25–30 | 2374 | 0.0056 | 0.1835 | −0.8580 | 1.0140 |
| 30–35 | 1137 | −0.0473 | 0.1941 | −0.5168 | 0.9998 |
| 40–45 | 721 | 0.1141 | 0.2197 | −0.5915 | 1.1369 |
| >45 | 280 | 0.1235 | 0.1875 | −0.5004 | 0.8356 |
| Age (Years) | |||||
| <10 | 1791 | 0.0713 | 0.2197 | −0.8580 | 1.1369 |
| 10–20 | 1990 | 0.0131 | 0.2016 | −0.5495 | 0.8356 |
| 20–30 | 1987 | −0.0849 | 0.1601 | −0.4884 | 0.6388 |
| 30–40 | 1883 | −0.0549 | 0.1570 | −0.3814 | 0.6272 |
| 40–50 | 1123 | −0.0083 | 0.1537 | −0.2738 | 0.7589 |
| 50–60 | 388 | 0.0332 | 0.1546 | −0.2242 | 0.7089 |
| >60 | 27 | 0.0257 | 0.0883 | −0.1506 | 0.2247 |
| DBH (cm) | N | Bias | Std Dev | Min | Max |
|---|---|---|---|---|---|
| <15 | 474 | −0.1274 | 0.1826 | −0.6106 | 0.7236 |
| 15–20 | 1049 | −0.0660 | 0.1982 | −0.5861 | 1.0820 |
| 20–25 | 1918 | −0.0558 | 0.2097 | −0.8363 | 1.2187 |
| 25–30 | 1878 | 0.0368 | 0.2285 | −0.7897 | 1.0537 |
| 30–35 | 1822 | −0.0141 | 0.2151 | −0.7197 | 1.0113 |
| 40–45 | 1266 | 0.0559 | 0.2213 | −0.8960 | 1.4841 |
| >45 | 1254 | 0.1316 | 0.2302 | −0.5750 | 1.1761 |
| Age (years) | |||||
| <10 | 1800 | 0.1128 | 0.2892 | −0.8960 | 1.4841 |
| 10–20 | 1999 | −0.0711 | 0.2131 | −0.7197 | 0.8433 |
| 20–30 | 1900 | −0.0953 | 0.1755 | −0.4930 | 0.8103 |
| 30–40 | 1630 | 0.0548 | 0.1708 | −0.4117 | 0.9912 |
| 40–50 | 1240 | 0.0394 | 0.1823 | −0.2799 | 0.6525 |
| 50–60 | 532 | −0.1264 | 0.2180 | −0.2043 | 1.1761 |
| 60–70 | 291 | 0.0894 | 0.1684 | −0.1952 | 0.6819 |
| 70–80 | 229 | 0.0814 | 0.1578 | −0.1612 | 0.5978 |
| >80 | 40 | 0.1126 | 0.1686 | −0.1161 | 0.4775 |
| Attribute | N | Mean | Std Dev | Minimum | Maximum |
|---|---|---|---|---|---|
| RCP 2.6 | |||||
| TPGS (mm) | 6400 | 570.85 | 147.86 | 225.90 | 1257.30 |
| MTGS (°C) | 6400 | 14.97 | 1.10 | 11.89 | 18.84 |
| CMI for June (cm) | 6400 | −3.27 | 4.25 | −12.69 | 15.59 |
| Sum of growing months (April to August) CMIs (cm) | 6400 | 0.60 | 7.68 | −23.49 | 28.94 |
| Annual CMI (sum of 12 months CMIs) (cm) | 6400 | 33.01 | 18.33 | −24.68 | 111.98 |
| RCP 4.5 | |||||
| TPGS (mm) | 6400 | 569.71 | 128.33 | 234.00 | 1038.10 |
| MTGS (°C) | 6400 | 15.36 | 1.11 | 11.90 | 19.26 |
| CMI for June (cm) | 6400 | −4.72 | 4.45 | −14.97 | 13.36 |
| Sum of growing months (April to August) CMIs (cm) | 6400 | −1.93 | 7.09 | −22.32 | 31.17 |
| Annual CMI (sum of 12 months CMIs) (cm) | 6400 | 28.84 | 17.48 | −31.15 | 103.06 |
| RCP 8.5 | |||||
| TPGS (mm) | 6400 | 587.72 | 135.52 | 242.70 | 1225.80 |
| MTGS (°C) | 6400 | 16.64 | 1.74 | 12.21 | 22.66 |
| CMI for June (cm) | 6400 | −6.13 | 5.00 | −20.35 | 13.91 |
| Sum of growing months (April to August) CMIs (cm) | 6400 | −3.23 | 9.84 | −38.15 | 30.26 |
| Annual CMI (sum of 12 months CMIs) (cm) | 6400 | 22.46 | 19.88 | −52.11 | 92.22 |
Disclaimer/Publisher’s Note: The statements, opinions and data contained in all publications are solely those of the individual author(s) and contributor(s) and not of MDPI and/or the editor(s). MDPI and/or the editor(s) disclaim responsibility for any injury to people or property resulting from any ideas, methods, instructions or products referred to in the content. |
© 2023 by the author. Licensee MDPI, Basel, Switzerland. This article is an open access article distributed under the terms and conditions of the Creative Commons Attribution (CC BY) license (https://creativecommons.org/licenses/by/4.0/).
Share and Cite
Sharma, M. Climate-Sensitive Diameter Growth Models for White Spruce and White Pine Plantations. Forests 2023, 14, 2457. https://doi.org/10.3390/f14122457
Sharma M. Climate-Sensitive Diameter Growth Models for White Spruce and White Pine Plantations. Forests. 2023; 14(12):2457. https://doi.org/10.3390/f14122457
Chicago/Turabian StyleSharma, Mahadev. 2023. "Climate-Sensitive Diameter Growth Models for White Spruce and White Pine Plantations" Forests 14, no. 12: 2457. https://doi.org/10.3390/f14122457
APA StyleSharma, M. (2023). Climate-Sensitive Diameter Growth Models for White Spruce and White Pine Plantations. Forests, 14(12), 2457. https://doi.org/10.3390/f14122457