Article

The Environmental and Genetic Controls of Increment Suggest a Limited Adaptability of Native Populations of Norway Spruce to Weather Extremes

Latvian State Forest Research Institute ‘Silava’, 111 Rigas Str., LV-2169 Salaspils, Latvia
*
Author to whom correspondence should be addressed.
Forests 2024, 15(1), 15; https://doi.org/10.3390/f15010015
Submission received: 14 November 2023 / Revised: 15 December 2023 / Accepted: 18 December 2023 / Published: 20 December 2023
(This article belongs to the Special Issue Tree Growth in Relation to Climate Change)

Abstract

:
In the Baltics, warming is expected to burden the growth of Norway spruce Picea abies, with weather anomalies/extremes having strong triggering effects, which can be mitigated by tree breeding. Within the region, breeding programmes have been aiming for productivity, yet being conservative, their sustainability depends on the adaptability of native genotypes, which is unclear. The adaptability of genotypes can be assessed through local adaptations and phenotypic plasticity, with the sensitivity of increment depicting the conformity of genotypes and environments. To assess the adaptability of native populations to anticipated climates, local genetic adaptation and phenotypic plasticity of the weather sensitivity of the radial increment were assessed by the methods of time series analysis and quantitative genetics based on three clonal trials (low-density single-tree plot plantations of grafted clones of native plus trees) representing the local climatic gradient in Latvia. The growth of trees was sensitive to the moisture availability in summer and the thermal regime in winter, yet coinciding anomalies in both were associated with abrupt changes in tree ring width. These environmental effects differed among the clones, indicating genetic controls over the sensitivity of increment, which, however, decreased under a warmer climate, suggesting a limited adaptability of local populations to warming. Still, the weather-growth relationships showed moderate phenotypic plasticity, suggesting some mid-term adaptability. Accordingly, supplementation of breeding populations via assisted gene transfer with the genotypes that are adapted to warmer and drier climates appears crucial.

1. Introduction

In the eastern Baltic region, the projected changes in tree species abundance are giving rise to concerns about the sustainability of Norway spruce Picea abies Karst. [1,2], which is an economically important species [3]. The decline in Norway spruce, though, has been predicted by the bioclimatic models, which can be biased due to uneven adaptability of populations [4,5]. On the contrary, an increase in forest productivity has been projected as the vegetation season extends [6], thus adding to the uncertainties. Accordingly, estimates of the genetic adaptation and phenotypic plasticity of local populations are crucial for their adaptability assessment [7,8], as well as being indicative of the marginality of the growing conditions [2,9]. Such estimates can be made by the methods of quantitative genetics [10], with provenance/progeny trials providing empirical material for broad-sense estimates [11,12]. In this regard, weather anomalies/extremes resulting from a shift/extension of the local climatic gradient [13,14] are considered the triggers for genetic adaptations [9], with the follow-up responses revealing the resilience of growth [15,16]. Such information is crucial for adaptive management [17] and for tree breeding in particular [10,11,18].
In the eastern Baltic region, forest tree breeding programmes are conservative, i.e., they rely on native genotypes and their genetic diversity [19,20,21], as well as genetic controls for the sets of the most relevant traits [22,23]. Hence, the presence of small-scale genetic adaptations is crucial [7,8,24]. Currently, the breeding indices emphasize productivity and stem quality traits [21,22,23], which are a cumulative representation of the conformity of genotypes with the past climates [25,26]. Under the accelerating environmental changes, such information might be outdated [27,28], and hence, traits highlighting compatibility with the climate are crucial [8,9]. Increment, which is an integral estimate of the conformity of genotypes with the environment [29,30], can therefore be considered an informative adaptability proxy [31,32].
Radial increment is a widely used proxy of forest growth and productivity, as it can be conveniently reconstructed from measurements of tree ring widths (TRW) [29,33]. Furthermore, TRW is a complementary source of information on the genetic and environmental control of growth [30,31]. However, radial increment is a product of site, genetics, age, weather, disturbances, etc., and hence, elaborate mathematical methods (e.g., time series deconstruction) have been developed for the separation of variance [15,34]. Considering the discrete nature of weather anomalies, specific standardization methods have been advised for the quantification of responsiveness and resilience of growth, ensuring reliable retrospections [16,34,35].
Norway spruce tolerates a wide range of edaphic conditions, but favors mesotrophic and eutrophic sites [36]. The species is sensitive to water deficit [7,24,37]; still, under a temperate climate, its growth is limited by both warmth and moisture availability [38,39]. Furthermore under temperate climate, the weather controls of growth of spruce are complex, with temperature in the dormancy period having carry-over effects [2,39], which might alter its susceptibility to water shortage in summer [36,40]. In Northern Europe, warming has been projected to improve the growth of Norway spruce [6,25,36]; however, the complex effects of the intensifying water shortages are becoming devastating [3,37,41]. This is particularly so in the case of anomalously warm and dry summers [37], highlighting the ability of genotypes to deal with water deficit as being paramount for their sustainability [8,27,42].
For Norway spruce populations, some local genetic adaptation to drought has been shown under close-to-marginal (tailing) conditions, which, however, rapidly decreases at the distribution limit [2,7]. In the Baltics, local provenances (considered nonmarginal) with trees differing in dimensions and stem/crown properties have been distinguished [43,44]. However, nonmarginal tree populations can have a common sensitivity to the principal weather drivers of growth to maximize growth [45]. Accordingly, estimates of the adaptability of such populations are crucial for the assessment of the sustainability of conservative breeding programmes and management [10,18,28]. Considering the specialization of populations [7], local information is highly anticipated.
This study aimed to estimate the local genetic adaptation and phenotypic plasticity of the native populations (local provenances) of Norway spruce in Latvia in terms of the sensitivity of increment to weather anomalies and drought conditions in particular. We hypothesized that local genotypes would show only moderate differences in sensitivity to weather anomalies, indicating a limited adaptability of the native population to the anticipated climatic changes.

2. Material and Methods

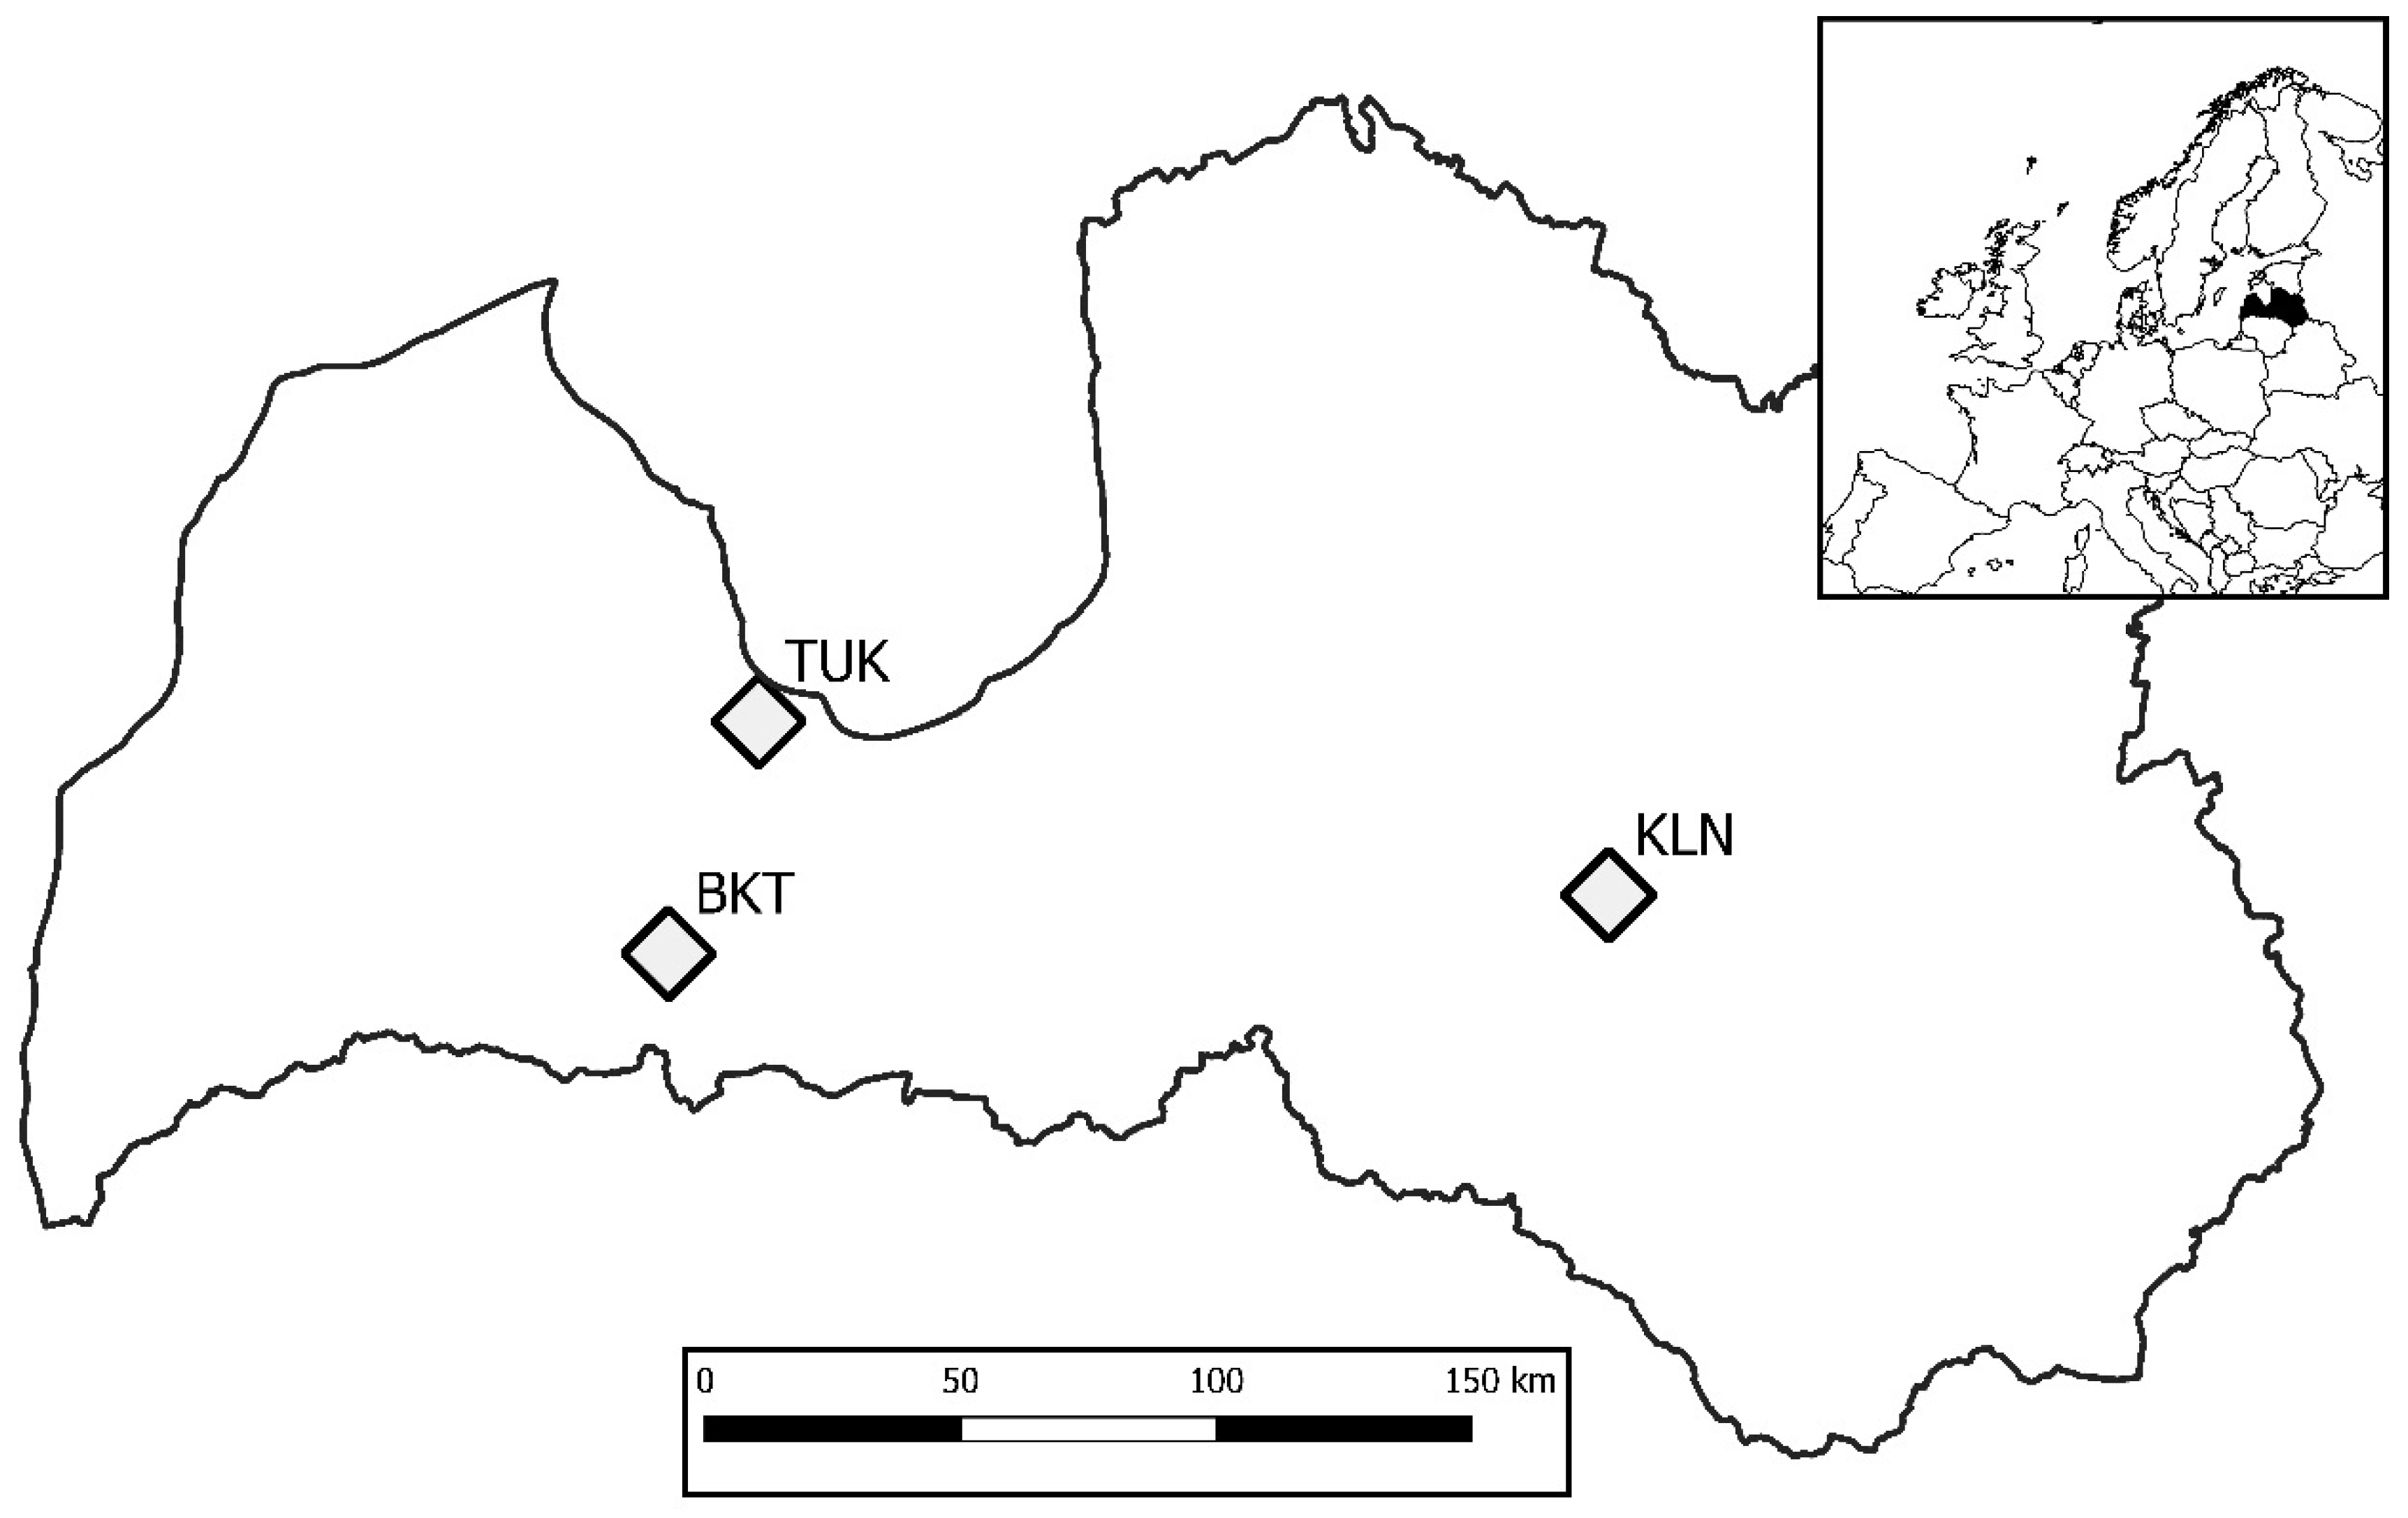
2.1. Trials and Sampling

Three clonal trials (initially intended as seed orchards, but left as clonal trials due to lack of tree topping) of local genotypes (plus trees) located in the mid-part of Latvia near Tukums (TUK), Biksti (BKT), and Kalsnava (KLN), were studied (Figure 1). The trials were established in 1964 (TUK and KLN) and 1967 (BKT) by planting two-year grafts of local plus trees originating within 35 km from the trials (in TUK and KLN trials), as well as from the western and eastern local provenance regions of Latvia (in BKT trial). Accordingly, these were the oldest clonal trials of the species within the region that were available, with their age being sufficient for time series analysis of increment. In all cases, rootstocks grown in local nurseries were used. Each trial had a unique set of clones (without overlap; the number of clones differed). The trials were established on mesotrophic former agricultural land (meadows) with a flat topography and deep freely draining sandy/silty soil. The initial spacing was 5 × 5 m (trees ha−1), and the design was randomized single-tree plots. The trials contained from 32 to 84 clones, initially represented by seven to 30 ramets (trees).
The trials represented the local continentality gradient from maritime (TUK and BKT trials) to inland (KLN trial) climate; the mean annual temperature (±st. dev.) was 7.4 ± 0.7 and 6.4 ± 0.7 °C, respectively (Supplementary Material, Figure S1). January and July were the coldest and warmest months, with temperatures ranging from −4.3 ± 2.8 to −2.2 ± 2.6 and from 17.9 ± 1.7 to 18.0 ± 1.6 °C in KLN and TUK/BKT trials, respectively. The mean annual precipitation was comparable among the trials, ranging from 681 ± 82 to 700 ± 80 mm/year in TUK/BKT and KLN, respectively. The annual distribution of precipitation was also similar among the trials, as approximately half of the annual precipitation fell during the summer months (June–September, 75 ± 16 mm/month). The climatic changes were expressed as the warming during the dormancy period, and hence as the extension of the vegetation period (by ca. two weeks during the 20th century), and particularly as the increasing heterogeneity of a summer precipitation regime with the extension of hot precipitation-free periods [13,42].
Based on the data from a trial inventory conducted in 2010–2014, 19, 20, and 77 clones, which represented the distribution of tree dimensions of the plantations and had more than four ramets, were selected for sampling in KLN, TUK, and BKT trials, respectively. Between 5 and 22 ramets, representing the stem diameter distribution, were selected for each clone. From each of the selected trees, two increment cores from randomly oriented opposite sides of the stem were collected at breast height using a 5 mm increment borer. It was ensured that at least one core per tree contained the pith (with a maximum offset of three tree-rings). Only visually healthy nonleaking trees were sampled, though. The sampling was carried out in 2015 in the KLN and TUK trials and in 2018 in the BKT trial. In the laboratory, increment cores were mounted, and their surface was progressively grinded to ensure recognition of tree ring borders. The measurements of TRW were done manually using the LINTAB 6 measuring table (RinnTech, Heidelberg, Germany). All measurements were done by the same person; TRW was measured with 0.01 mm accuracy.

2.2. Data Analysis

To ensure the quality of measurements and exact dating of increment crucial for assessment of linkages with meteorological data, time series of TRW were cross-dated graphically and statistically. The metrics of environmental strength (e.g., expressed population signal, signal-to-noise ratio, interseries correlation) and variability of TRW (mean sensitivity, gini coefficient, first-order autocorrelation, etc.) were calculated for the datasets, and their subsets were calculated based on a detrended (by a flexible cubic spline) time series. To relate changes (their abruptness) in increment (TRW) with weather anomalies, as well as to assess the effects of local adaptation in it, the complex approach suggested by Schwarz et al. (2020) [16] and Jetschke et al. (2019) [34] was used for the identification of weather-driven growth changes. To estimate the abruptness of changes in increment, pointer year (PY) analysis based on the relative growth change was used [46]. The analysis was conducted for each clone. The time series of TRW were converted into the time series of growth changes relative to the preceding five years. The relative changes in TRW of ≥40% were considered an indicator of an event year.
A PY for a clone was considered “significant” if ≥50% of trees showed coherent (positive or negative) event year. Such mild threshold values were set due to favorable growing conditions and productive growth. Additionally, time series of mean relative growth deviations were calculated for each clone. Rolling z-scores for 30-year windows were calculated for the meteorological variables to identify anomalies (z-score > 2.0). A bootstrapped (semiparametric bootstrap, 1000 iterations) Pearson correlations analysis between the mean relative deviation in TRWs for clones and local meteorological variables was conducted for the screening of meteorological conditions relating to changes in growth.
The gridded (0.5° latitude/longitude) meteorological data, mean monthly temperature, and precipitation sums were acquired from the online repository of the Climatic Research Unit of the University of East Anglia [47]. Local data (for the grid points located closer than 0.25° from the trials) were acquired. The standardized precipitation evapotranspiration index (SPEI) was calculated with respect to the three preceding months to describe the occurrence of drought conditions [48]. Considering the carry-over effects of weather conditions [2,39], the meteorological variables were arranged into the climatic window from June in the year preceding the formation of increment to September of the year of growth. Additionally, composite variables representing conditions of climatic years (October–September), winter (December–February), spring (March and April), summer (June–September), and growing period (June and July) were calculated.
To evaluate the resilience of TRW in response to the identified PYs and their local differences, resilience (“RRR”) analysis was performed [15,16]. The resilience indices (resistance, recovery, resilience, and relative resilience) were calculated for each tree with respect to four years before/after a PY. The local provenance effect of the resilience indices in the common negative PYs was estimated using mixed effects models, which were fitted using the restricted maximum likelihood approach [49]. Affiliation of the clones to local provenance region, the western and eastern part of Latvia, which differ in dimensions and stem quality of trees [43,44], was used as the fixed effect. Stem diameter at breast height was included as a covariate (fixed) to control for tree size. Trial, clone (nested), and year (crossed) were included in the models as the random effects to account for the spatiotemporal dependencies. The models were based on the pooled data from the studied trials (incomplete design). Wald’s type II χ2 test was used to estimate the significance of the differences between the two local provenance regions.
To evaluate the strength of genetic control over responses and resilience of increment in relation to weather anomalies, which differed by nature, as well as “normal” variation, heritability indices [50,51] were calculated on an annual basis. For the separation of variance components, a simple random effect was used, where relative changes in TRW as well as the calculated resilience indices of trees were used as the response, and clone was used as the random effect. The models in general form were as follows:
r i j k = µ + c k + ε k ,
where (ck) is the random effect of clone in the i-th year. The models were fitted using the maximum likelihood approach. Broad-sense heritability (H2) was estimated as the ratio of the variance of clone and the total variance [51]. To evaluate genetic variability in growth responses, the clone/provenance coefficient of variation (CCV) was calculated as the ratio of the square root of variance of a clone to the absolute mean value of the growth response. Considering that the weather-related drivers of changes in increment differed by the trials, the analysis was conducted separately for each of the trials.
To generalize genetic effects on relative changes and resilience of growth across the local climatic gradient, variance separation was carried out by mixed models based on the data from all the trials combined. The models in general form were as follows:
r i j k = µ + t i + y j + t i : y j + c k ( i ) + c k ( i ) : y j + c k ( i ) : y j : t i + ε i j k ,
where ti is the fixed effect of trial, yj is the fixed effect of year, ti:yj is their interaction, (ck(i)) is the random effect of clone nested in trial, ck(i):yj is the random effect of interaction between clone and year, and ck(i):yj:ti is the random effect of the interaction among clone, year, and trial. Random effects represent random intercepts. The relative growth changes and tolerance indices of trees were used as the responses. The heritability estimates were calculated as stated above. Data analysis was conducted in R v. 4.2.2 [52], using packages “dplR” [53], “pointRes” [46], and “lme4” [49].

3. Results

The measurements of TRWs were of a good quality, and the time series representing 1175 of 1260 initially sampled trees (93.2%) were successfully cross-dated; accordingly, the trials were represented by data from 211 to 629 trees (Table 1). Due to the uneven number of trees per clone, the metrics of the environmental signals that were captured by the time series of TRW ranged widely, particularly under the harsher climate in the KLN trial. Nevertheless, the datasets of the trials and clones mostly were representative of environmental variation, as the EPS values exceeded the arbitrary threshold of 0.85. The lower values of EPS for some clones were likely due to the lower number of trees; nevertheless, when averaged for the trial, the values were sufficient. The strength of environmental forcing of the TRW indicated by the SNR of the datasets also ranged widely, indicating the uneven sensitivity of the clones; however, it tended to be higher in the TUK trial. The gini coeffects were low, implying a low interannual variation of TRW, as the growth of trees has been quite rapid. However, the intermediate values of the mean sensitivity of the time series, as well as the low autocorrelation, indicated a nonlagged responsiveness of increment to environmental forcing.
During the periods covered by the time series of TRW, a few PYs were identified, indicating some abrupt changes in radial growth (Figure 2). However, the incidence of PYs largely differed among the clones, and such differences, as indicated by the common “significant” PYs, were stronger under the cooler climate of the KLN trial. In contrast, common PYs were more frequent under the warmer climates of the BKT and TUK trials, where up to 100 and 65% of clones showed them, respectively. Nevertheless, common tendencies in the occurrence of PYs were observed in all trials, as the positive PY occurred when trees were young, and the negative PYs occurred as the trees were ageing. The spatial synchrony (among the trials) of the positive PYs was limited, indicating the effects of local environmental conditions. Most of the negative PYs, identified during the second part of the reference intervals, were common among the trials, indicating large-scale environmental effects.
The identified PYs occurred in years with a few coinciding weather anomalies (Table 2), indicating complex cumulative effects of meteorological conditions, as well as the robustness of radial growth regarding single moderate climatic disturbances. Generally, the positive PYs (growth improvements) occurred when winters were cold and summers were cool or moist. The negative PYs were associated with hot and dry summers coupled with an increased temperature during the dormancy period, which, however, differed by clone. On an annual basis, the relative growth changes (mean growth deviations for the clones) showed correlations with the meteorological variables, reflecting periods during and before the formation of increment, thus indicating direct and carry-over effects of weather conditions (Figure 3). However, the strength of weather limitations on the TRW differed by trials as indicated by the proportion of clones with significant correlations.
Under the harsher climate of the KLN trial, clonal differences regarding the meteorological forcing of the TRW were the strongest. Accordingly, the negative correlation with precipitation in May was the most common, being significant for 63% of the clones (Figure 3). Between 32 and 42% of the clones showed correlations with moisture availability (SPEI) in the preceding summer (July to September). The correlation with summer precipitation, indicating a direct effect of moisture availability on increment, was significant for one-third of the clones. A few clones showed correlations with conditions during winter. Under the warmer coastal climate of the TUK trial, correlations with precipitation in February and June (positive) and temperature during the growing season and summer (negative) were the most common, being significant for up to 52% of clones. Such correlations, as well as similar effects of precipitation, indicated growth limitations by summer water availability.
Considerably stronger weather limitations on the TRW and, hence, the weakest clonal differences were suggested by the weather-growth correlations under warmer inland climate in the BKT trial (Figure 3). This was particularly so considering the higher number of clones tested, which represented genotypes from the local and neighboring provenance region. In this trial, the number of meteorological variables showing significant weather–growth correlations was also higher, likely due to a wider representation of the genotypes (Table 1). In the trial, 95% of the clones showed a positive correlation with February precipitation, and the majority of them also showed a positive correlation with SPEI in spring months (Figure 3). The temperature in summer showed negative correlations for 72% of the clones. Additionally, positive correlations with temperature in winter/spring and precipitation in summer months were significant for 20–30% of the genotypes. Nevertheless, the signs of correlations were consistent for the clones.
The resilience of growth regarding the negative PY was similar among the studied populations (local provenances), as only slight differences in resilience components were estimated (Figure 4, Table 3). Overall, the mean values of the resilience components indicated the ability of the genotypes to restore growth to pre-disturbance levels, even though the negative PY were considered. As trees were young and TRW had an explicit age trend, the resilience of the TRW was slightly below 1.0, and hence, relative resilience was low. However, resilience was specific for the genotypes and local conditions, as well as the nature of the water anomaly underlying PY, as indicated by the structure of random variances. The recovery was comparable to the inverse values of the resistance, confirming that the pre-disturbance levels of TRW were rapidly achieved. The resistance was the only component, which differed among the local populations and indicated higher sensitivity of the genotypes from the eastern population, likely to the intensifying water shortages (Table 2).
The clonal differences in the occurrence of PY (Figure 2) and sensitivity of increment (Figure 3) indicated genetic controls over the growth responses to weather anomalies; however, the annual heritability estimates (both H2 and CCV) were low to intermediate (Figure 2). The CCV was generally lower than H2, indicating limited genetic plasticity. The heritability estimates mostly peaked during the negative PY, yet the peaks and the overall values tended to be lower under the warmer climate, indicating diminishing genetic effects. Accordingly, the highest annual heritability estimates for the relative changes in TRW were higher under the coolest climate in the KLN trial while being the lowest under warmer conditions in BKT. Still, in the BKT trial, the highest heritability was estimated in response to the positive PY of 1993, which was a cold year (Table 2). The occurrence of peaks in heritability estimates showed some specifics among the PY, indicating complex meteorological triggers of genetic effects. In the BKT and TUK trials, heritability peaked in 2007, although a stronger PY occurred a year before, while in the KLN trial, the peak in 1992 was not associated with the identified PYs. Similar trends occurred in the BKT and TUK trials in 2012. The heritability of the resilience components of TRW showed a pattern that is highly similar to the relative changes in growth, although the heritability estimates for resilience were low (Supplementary Material, Figure S2).
The components of clone/genetic variance and the broad-sense heritability coefficients estimated for the entire reference periods were low, showing weak genetic effects on the responsiveness of TRW to weather anomalies (Table 4). The variance components, however, showed that such low estimates were likely due to a high random variance, as the models did not include fixed effects of environmental variability. Irrespective of the random variance, the clonal variance was low compared to the other components, implying a lack of systematic responses. On the other hand, the variance components related to the interactions involving clones, which indicate the genotype-by-environment interactions, were higher, yet their structure differed for the resilience components of TRW. Clone-by-year interaction was the highest for relative growth changes, resistance, and relative resistance of TRW, indicating specific responses to meteorological anomalies. For recovery, the interaction between clone, year, and trials was the strongest, implying local specifics in the effects of weather anomalies.

4. Discussion

4.1. Representativity of the Datasets

The increment of the studied genotypes of Norway spruce was sensitive to weather fluctuations, implying climatic controls over the growth, thus allowing assessment of sustainability under anticipated climatic changes [29,31,33]. The high percentage of the cross-dated time series of TRW, as well as the statistics on its interannual variation (Table 1), highlighted the presence of explicit weather forcing of radial increment, as well as the informativity of the datasets [53,54]. The intermediate values of the mean sensitivity of the time series confirmed their sufficiency for weather-growth analysis [54]. Although tree growth under temperate conditions depends on nutrient reserves, which results in the autocorrelation of growth [54], the estimate was low implying immediate and plastic responses to environmental changes. The clonal differences in the time series statistics (Table 1) also indicated a diversity of responses to environmental fluctuations, hinting at the adaptability of the local populations [7,8].
The intermediate strength of the PYs (Figure 2), considering limited interannual variability (Table 1), implied a general rigidness of increment, particularly as the trees were young and grew under optimal conditions (trial). The incidence of the PY with several weather anomalies (Table 2) also suggested the robustness of TRW to single climatic disturbances [34,35]. The relatively low variability in TRW can also be related to the seasonally fluctuating rate of xylogenesis [55]. The largest part of which (earlywood) is formed during the first part of the period [38] when soil moisture is abundant [13]. As the growing season advances and the weather gets warmer and drier, the effects of moisture availability on growth increases, yet only a part of TRW is affected [38,55], thus explaining the limited interannual variability (gini of TRW; Table 1). The negative effects of water shortage on TRW might also be partially offset by the positive effects of warming [6,56]. Accordingly, the moderate expression of a common sensitivity of growth can still be considered informative for the sustainability of genotypes to weather conditions and, particularly, moisture deficiency, which can have devastating legacy effects on Norway spruce [3,41]. The plasticity of increment and its responses to environmental fluctuation, however, can be considered an adaptation to an increasing range of environmental conditions [4,9,11], as the trees grow productively. Alternatively, this might be an artefact of the relatively small age of the trees, when the radial increment is largely affected by competition rather than weather conditions [54].

4.2. Weather Controls of Increment

Under the temperate climate in the hemiboreal zone, weather controls of tree growth are complex, as the effects of cold damage by low temperatures, vegetation, and/or growing season length and intensifying droughts interact [36,37]. Accordingly, the effects of weather conditions previously identified as the regional drivers of spruce growth [2,39] were associated with the PY and annual changes in the TRW of the studied genotypes (Figure 3, Table 2). These relationships confirmed the spatiotemporal complexity of meteorological effects [39]. The effects of intensifying hot droughts, which are emerging threats to forest growth [14,37,42], were indicated by the weather anomalies in summer moisture availability underlying the PY, particularly in the latter part of the analyzed period (Table 2). The correlations with summer temperature (negative) and precipitation (positive; Figure 3) particularly supported the sensitivity of local genotypes to hot droughts [42]. Considering Norway spruce as a boreal species that is adapted to cold climates [7,57], the differences in climatic forcing of TRW showed an explicit thermal cline in sensitivity of increment among the trials, such as on the distribution limit [2]. In turn, the positive correlations in the KLN trial with moisture availability in the previous vegetation season (Figure 3) might be explained by the assimilation of additional nutrients and, hence, the facilitated early growth in cases when moisture was not limited [36,38].
Considering the location in a cool temperate climate, the weather conditions during the dormancy period had a carry-over effect on increment. The effects of winter temperature and precipitation (Figure 3), which are usually in the form of snow, might be explained by the insulating effects of snow cover, which affect root dynamics and water relations in the following vegetation season [40]. Additionally, the amount of winter precipitation that replenishes groundwater determines the moisture availability during the first part of the vegetation period [13]. This was particularly so under the warmer and drier climate of the BKT trials. Contrastingly, the negative correlations with May precipitation under the cooler climate of the KLN trial might be related to reduced assimilation in the case of rainy and, hence, cloudy conditions [36,58].
The positive PY (Figure 2) tended to coincide with a cool or moist summer (Table 2), implying that increased moisture availability boosted increment at a juvenile age, when drought tolerance of spruce is high [59]. As the trees age, their drought sensitivity increases due to changes in their hydraulic architecture and increasing maintenance costs [60]; accordingly, the limiting effect of moisture deficiency emerged. However, at the maturing age, the incidence of a negative PY with increased winter temperatures (warmth records) might be related to interrupted dormancy and respiratory nutrient loss [58,61], and hence, reduced formation of earlywood [38]. Such a shift in responsiveness to anomalies implicitly suggests that 20–25 years is the age when the drought sensitivity of trees increases [60].
Although spruce populations from the two local provenance regions show explicit differences in productivity [43,44], only minor differences were estimated for the resilience components of growth (Figure 4), suggesting a comparable tolerance to weather anomalies. Still, the resistance of TRW in the negative PYs, which were drought-related (Table 2), was higher for genotypes from the western local provenance region, indicating some degree of local adaptation [2,7,24]. Although resistance is inverse to plasticity, it has been related to the productivity of the genotypes of Scots pine [62]. For the studied Norway spruce genotypes, resilience was similar, implying even susceptibility of growth to weather extremes [7,36], although recovery appeared sufficient [15]. The clonal differences in resilience components (Table 3), though, suggested the presence of adaptations to microsite conditions [9,45]. This was also supported by the variability in resilience in response to the combinations of weather anomalies underlying PY (Table 3). The weather-growth relationships were estimated for progenies of plus trees, and hence, might be biased for general populations [63]. Nevertheless, adaptive management implies that improved forest regenerative material is used, thus emphasizing the superior genotypes [21,26,28]

4.3. Genetic Controls over Sensitivity of Growth

Trees possess large genomes, which is an adaptation allowing them to survive a range of environmental conditions and their extremes [64], for which the rare alleles can be crucial [65]. Accordingly, the genetic control of the increment peaked during the PY, indicating immediate genetic responses to weather disturbances and highlighting small-scale local genetic adaptations [31,45,57,66]. Still, meteorological conditions apparently had uneven adaptive significance on increment [8,66], as the peaks in heritability differed by PY (Figure 2, Table 4), thus highlighting the complexity of genotype and environment interactions [10,11,18]. Genetic controls over the sensitivity of the TRW, particularly regarding moisture availability, have been observed between populations of Scots pine from the same region [32], highlighting the growing relevance of local adaptations regarding the sustainability of genotypes [26,31].
The adaptability of populations to environmental changes depends on local genetic adaptation and phenotypic plasticity [8,12,57], which are reflected by the variance components of genotype and genotype-by-environment interaction, respectively [11,18]. The differences in the strength of peaks in genetic (clonal) effect represented by H2 between the BKT/TUK and KLN trials (Figure 2), which had small differences in climate (Supplementary Material, Figure S1), suggested negative effects of warming [2,4,6]. This was also supported phenotypically by the higher proportion of clones, which represented two local provenances, showing common correlations (Figure 3). Accordingly, the diminishing genetic effects under a warmer climate project a reducing adaptability for the local populations that are used to cool and moist climates [7,67], supporting the hypothesis of this study. Genetic differences in weather-growth relationships at a small scale have been attributed to the near-marginal parts of the distribution of widespread species [45], while the actual genetic differences diminish [2]. Accordingly, the estimated structure of the variance component of a clone (Figure 2; Table 4) supports the rapidly increasing marginality of climatic conditions for the native populations of Norway spruce, also within the species range [4]. Hence, the marginality of growing conditions apparently also applies to the population level, supporting regional differences in the adaptability of native stands [28,37].
When the heritability estimates were generalized for the reference periods across the trials (Table 4), the negligible variance of clone indicated a limited adaptability to extending climatic gradients and intensifying droughts [7,57,68]. Still, the variance of the clone-by-year, as well as by year and trial interactions, which comprised up to 33% of the total for resilience components (Table 4), implied moderate phenotypic plasticity, and hence, some mid-term adaptability of the populations [8,10,18,26]. Accordingly, the moderate, yet diminishing genetic controls over the weather-growth responses (Figure 2, Table 4) supported the projected decline in the abundance of the local population [1,4] and indicated a weakening potential for improvements by conservative breeding [7,19,23]. Still, the location of the Baltics within the range of spruce suggests that assisted gene transfer of genotypes adapted to warmer and drier conditions could still contribute to the sustainability of Norway spruce. Accordingly, supplementation of local breeding populations with north-transferred genotypes appears compulsory for sustaining commercial spruce forests in the Baltics [24,57]. For the screening of the most adapted genotypes, the sensitivity of increment, particularly in response to the intensifying weather anomalies (Table 2, Figure 2), appears as a crucial and informative trait [30,35].

5. Conclusions

The increment of studied clones of Norway spruce plus trees under a temperate climate in the near marginal tailing part of the species distribution was complexly controlled by summer moisture availability and winter thermal regime, which have been identified as the regional drivers of growth. The increment of the tree, however, appeared quite robust to meteorological conditions, as only coinciding anomalies in both winter thermal and summer moisture regimes were associated with abrupt (yet moderate) changes in growth. The strength of these environmental effects showed clonal differences that suggest genetic controls over the sensitivity of increment. The genetic controls, however, were weaker under a warmer climate, implying an increasing marginality of growing conditions and limited adaptability of local populations to it. Still, the weather-growth relationships showed moderate genotype-by-environment interactions and, hence, phenotypical plasticity, thus highlighting the ability to cope with moderate environmental changes. This suggests that the increase in marginality also applies to local populations. Considering the diminishing genetic effects and moderate plasticity of native genotypes/populations regarding the weather-growth relationships, supplementation of breeding populations with genotypes that are adapted to warmer and drier climates via assisted gene transfer is encouraged.

Supplementary Materials

The following supporting information can be downloaded at: https://www.mdpi.com/article/10.3390/f15010015/s1, Figure S1: Climatic description of the trials. Mean monthly temperature (line) and precipitation (bars) with their standard deviations (whiskers and polygon) for the period 1988–2017 are shown. Figure S2: The proportion of clones showing “significant” pointer year in TRW in the studied clonal plantations of local plus-trees of Norway spruce in Latvia (bars). Lines indicate broad sense clonal heritability (H2) of the resilience components (resistance, recovery, resilience and relative resilience) of TRW calculated on annual basis. Heritability coefficients are calculated for the periods represented by ≥5 clones and ≥50 observations.

Author Contributions

Conceptualization, R.M. and Ā.J.; Methodology, R.M. and P.Z.; Software, R.M. and D.J.; Validation, J.K.; Formal analysis, R.M. and J.K.; Investigation, J.K., P.Z. and D.J.; Resources, Ā.J.; Data curation, J.K., P.Z. and D.J.; Writing—original draft, R.M., P.Z. and Ā.J.; Writing—review and editing, R.M., P.Z., D.J. and Ā.J.; Visualization, R.M.; Supervision, R.M., P.Z. and Ā.J.; Project administration, Ā.J.; Funding acquisition, Ā.J. All authors have read and agreed to the published version of the manuscript.

Funding

This study was funded by the European Regional Development Fund project ‘Decision support tool for increased forest productivity via efficient climate-adjusted transfer of genetic gain’ (no 1.1.1.1/19/A/111).

Data Availability Statement

Data are contained within the article.

Conflicts of Interest

The authors declare no conflict of interest.

References

  1. Buras, A.; Menzel, A. Projecting tree species composition changes of European forests for 2061–2090 under RCP 4.5 and RCP 8.5 Scenarios. Front. Plant Sci. 2019, 9, 1986. [Google Scholar] [CrossRef] [PubMed]
  2. Klisz, M.; Buras, A.; Sass-Klaassen, U.; Puchałka, R.; Koprowski, M.; Ukalska, J. Limitations at the limit? Diminishing of genetic effects in Norway spruce provenance trials. Front. Plant Sci. 2019, 10, 306. [Google Scholar] [CrossRef] [PubMed]
  3. Knoke, T.; Gosling, E.; Thom, D.; Chreptun, C.; Rammig, A.; Seidl, R. Economic losses from natural disturbances in Norway spruce forests—A quantification using Monte-Carlo simulations. Ecol. Econ. 2021, 185, 107046. [Google Scholar] [CrossRef]
  4. Garzón, M.B.; Robson, T.M.; Hampe, A. Δ Trait SDMs: Species distribution models that account for local adaptation and phenotypic plasticity. New Phytol. 2019, 222, 1757–1765. [Google Scholar] [CrossRef] [PubMed]
  5. Valladares, F.; Matesanz, S.; Guilhaumon, F.; Araújo, M.B.; Balaguer, L.; Benito-Garzón, M.; Cornwell, W.; Gianoli, E.; van Kleunen, M.; Naya, D.E.; et al. The effects of phenotypic plasticity and local adaptation on forecasts of species range shifts under climate change. Ecol. Lett. 2014, 17, 1351–1364. [Google Scholar] [CrossRef] [PubMed]
  6. Reyer, C.; Lasch-Born, P.; Suckow, F.; Gutsch, M.; Murawski, A.; Pilz, T. Projections of regional changes in forest net primary productivity for different tree species in Europe driven by climate change and carbon dioxide. Ann. For. Sci. 2014, 71, 211–225. [Google Scholar] [CrossRef]
  7. Liepe, K.J.; van der Maaten, E.; van der Maaten-Theunissen, M.; Liesebach, M. High phenotypic plasticity, but low signals of local adaptation to climate in a large-scale transplant experiment of Picea abies (L.) Karst. in Europe. Front. For. Glob. Chang. 2022, 5, 804857. [Google Scholar] [CrossRef]
  8. Moran, E.; Lauder, J.; Musser, C.; Stathos, A.; Shu, M. The genetics of drought tolerance in conifers. New Phytol. 2017, 216, 1034–1048. [Google Scholar] [CrossRef]
  9. Chevin, L.-M.; Hoffmann, A.A. Evolution of phenotypic plasticity in extreme environments. Philos. Trans. R. Soc. B Biol. Sci. 2017, 372, 20160138. [Google Scholar] [CrossRef]
  10. Li, Y.; Suontama, M.; Burdon, R.D.; Dungey, H.S. Genotype by environment interactions in forest tree breeding: Review of methodology and perspectives on research and application. Tree Genet. Genomes 2017, 13, 60. [Google Scholar] [CrossRef]
  11. Chmura, D.J.; Barzdajn, W.; Kowalkowski, W.; Guzicka, M.; Rożkowski, R. Analysis of genotype-by-environment interaction in a multisite progeny test with Scots pine for supporting selection decisions. Eur. J. For. Res. 2021, 140, 1457–1467. [Google Scholar] [CrossRef]
  12. Leites, L.P.; Rehfeldt, G.E.; Robinson, A.P.; Crookston, N.L.; Jaquish, B. Possibilities and limitations of using historic provenance tests to infer forest species growth responses to climate change. Nat. Resour. Model. 2012, 25, 409–433. [Google Scholar] [CrossRef]
  13. Meier, H.E.M.; Kniebusch, M.; Dieterich, C.; Gröger, M.; Zorita, E.; Elmgren, R.; Myrberg, K.; Ahola, M.P.; Bartosova, A.; Bonsdorff, E.; et al. Climate change in the Baltic Sea region: A summary. Earth Syst. Dyn. 2022, 13, 457–593. [Google Scholar] [CrossRef]
  14. Reyer, C.P.O.; Bathgate, S.; Blennow, K.; Borges, J.G.; Bugmann, H.; Delzon, S.; Faias, S.P.; Garcia-Gonzalo, J.; Gardiner, B.; Gonzalez-Olabarria, J.R.; et al. Are forest disturbances amplifying or canceling out climate change-induced productivity changes in European forests? Environ. Res. Lett. 2017, 12, 034027. [Google Scholar] [CrossRef] [PubMed]
  15. Lloret, F.; Keeling, E.G.; Sala, A. Components of tree resilience: Effects of successive low-growth episodes in old ponderosa pine forests. Oikos 2011, 120, 1909–1920. [Google Scholar] [CrossRef]
  16. Schwarz, J.; Skiadaresis, G.; Kohler, M.; Kunz, J.; Schnabel, F.; Vitali, V.; Bauhus, J. Quantifying growth responses of trees to drought—A critique of commonly used resilience indices and recommendations for future studies. Curr. For. Rep. 2020, 6, 185–200. [Google Scholar] [CrossRef]
  17. Nabuurs, G.J.; Verkerk, P.J.; Schelhaas, M.J.; González Olabarria, J.R.; Trasobares, A.; Cienciala, E. Climate-Smart Forestry: Mitigation Impacts in Three European Regions. 2018. Available online: https://www.efi.int/sites/default/files/files/publication-bank/2018/efi_fstp_6_2018.pdf (accessed on 14 July 2023).
  18. Ansarifar, J.; Akhavizadegan, F.; Wang, L. Performance prediction of crosses in plant breeding through genotype by environment interactions. Sci. Rep. 2020, 10, 11533. [Google Scholar] [CrossRef]
  19. Baliuckas, V.; Pliūra, A.; Eriksson, G. Forest tree breeding strategies in Nordic and Baltic countries and the possible implications on Lithuanian tree breeding strategy. Balt. For. 2004, 10, 95–103. [Google Scholar]
  20. Jansons, Ā.; Donis, J.; Danusevičius, D.; Baumanis, I. Differential analysis for next breeding cycle for Norway spruce in Latvia. Balt. For. 2015, 21, 285–297. [Google Scholar]
  21. Jansson, G.; Hansen, J.K.; Haapanen, M.; Kvaalen, H.; Steffenrem, A. The genetic and economic gains from forest tree breeding programmes in Scandinavia and Finland. Scand. J. For. Res. 2017, 32, 273–286. [Google Scholar] [CrossRef]
  22. Burdon, R.D.; Klápště, J. Alternative selection methods and explicit or implied economic-worth functions for different traits in tree breeding. Tree Genet. Genomes 2019, 15, 79. [Google Scholar] [CrossRef]
  23. Hong, Z.; Fries, A.; Wu, H.X. High negative genetic correlations between growth traits and wood properties suggest incorporating multiple traits selection including economic weights for the future Scots pine breeding programs. Ann. For. Sci. 2014, 71, 463–472. [Google Scholar] [CrossRef]
  24. Trujillo-Moya, C.; George, J.-P.; Fluch, S.; Geburek, T.; Grabner, M.; Karanitsch-Ackerl, S.; Konrad, H.; Mayer, K.; Sehr, E.M.; Wischnitzki, E.; et al. Drought sensitivity of Norway spruce at the species’ warmest fringe: Quantitative and molecular analysis reveals high genetic variation among and within provenances. Genes Genom. Genet. 2018, 8, 1225–1245. [Google Scholar] [CrossRef] [PubMed]
  25. Goude, M.; Nilsson, U.; Mason, E.; Vico, G. Using hybrid modelling to predict basal area and evaluate effects of climate change on growth of Norway spruce and Scots pine stands. Scand. J. For. Res. 2022, 37, 59–73. [Google Scholar] [CrossRef]
  26. MacLachlan, I.R.; Wang, T.; Hamann, A.; Smets, P.; Aitken, S.N. Selective breeding of lodgepole pine increases growth and maintains climatic adaptation. For. Ecol. Manag. 2017, 391, 404–416. [Google Scholar] [CrossRef]
  27. Breed, M.F.; Stead, M.G.; Ottewell, K.M.; Gardner, M.G.; Lowe, A.J. Priority actions to improve provenance decision-making. BioScience 2018, 68, 510–516. [Google Scholar] [CrossRef]
  28. O’neill, G.A.; Stoehr, M.; Jaquish, B. Quantifying safe seed transfer distance and impacts of tree breeding on adaptation. For. Ecol. Manag. 2014, 328, 122–130. [Google Scholar] [CrossRef]
  29. Xu, K.; Wang, X.; Liang, P.; An, H.; Sun, H.; Han, W.; Li, Q. Tree-ring widths are good proxies of annual variation in forest productivity in temperate forests. Sci. Rep. 2017, 7, 1945. [Google Scholar] [CrossRef]
  30. Zhang, Z.; Babst, F.; Bellassen, V.; Frank, D.; Launois, T.; Tan, K.; Ciais, P.; Poulter, B. Converging climate sensitivities of European forests between observed radial tree growth and vegetation models. Ecosystems 2018, 21, 410–425. [Google Scholar] [CrossRef]
  31. Housset, J.M.; Nadeau, S.; Isabel, N.; Depardieu, C.; Duchesne, I.; Lenz, P.; Girardin, M.P. Tree rings provide a new class of phenotypes for genetic associations that foster insights into adaptation of conifers to climate change. New Phytol. 2018, 218, 630–645. [Google Scholar] [CrossRef]
  32. Matisons, R.; Schneck, V.; Jansone, D.; Bāders, E.; Dubra, S.; Zeltiņš, P.; Jansons, Ā. South-eastern Baltic provenances of Scots pine show heritable weather-growth relationships. Forests 2021, 12, 1101. [Google Scholar] [CrossRef]
  33. McCullough, I.M.; Davis, F.W.; Williams, A.P. A range of possibilities: Assessing geographic variation in climate sensitivity of ponderosa pine using tree rings. For. Ecol. Manag. 2017, 402, 223–233. [Google Scholar] [CrossRef]
  34. Jetschke, G.; van der Maaten, E.; van der Maaten-Theunissen, M. Towards the extremes: A critical analysis of pointer year detection methods. Dendrochronologia 2019, 53, 55–62. [Google Scholar] [CrossRef]
  35. Bräuning, A.; Bolte, A.; Nabais, C.; Rossi, S.; Sass-Klaassen, U. Studying tree responses to extreme events. Front. Plant Sci. 2017, 8, N506. [Google Scholar] [CrossRef]
  36. Jönsson, A.M.; Lagergren, F. Effects of climate and soil conditions on the productivity and defence capacity of Picea abies in Sweden—An ecosystem model assessment. Ecol. Model. 2018, 384, 154–167. [Google Scholar] [CrossRef]
  37. Bosela, M.; Tumajer, J.; Cienciala, E.; Dobor, L.; Kulla, L.; Marčiš, P.; Popa, I.; Sedmák, R.; Sedmáková, D.; Sitko, R.; et al. Climate warming induced synchronous growth decline in Norway spruce populations across biogeographical gradients since 2000. Sci. Total Environ. 2021, 752, 141794. [Google Scholar] [CrossRef]
  38. Jyske, T.; Mäkinen, H.; Kalliokoski, T.; Nöjd, P. Intra-annual tracheid production of Norway spruce and Scots pine across a latitudinal gradient in Finland. Agric. For. Meteorol. 2014, 194, 241–254. [Google Scholar] [CrossRef]
  39. Matisons, R.; Elferts, D.; Krišāns, O.; Schneck, V.; Gärtner, H.; Wojda, T.; Kowalczyk, J.; Jansons, Ā. Nonlinear weather-growth relationships suggest disproportional growth changes of Norway spruce in the eastern Baltic region. Forests 2021, 12, 661. [Google Scholar] [CrossRef]
  40. Tierney, G.L.; Fahey, T.J.; Groffman, P.M.; Hardy, J.P.; Fitzhugh, R.D.; Driscoll, C.T. Soil freezing alters fine root dynamics in a northern hardwood forest. Biogeochemistry 2001, 56, 175–190. [Google Scholar] [CrossRef]
  41. Seidl, R.; Rammer, W. Climate change amplifies the interactions between wind and bark beetle disturbances in forest landscapes. Landsc. Ecol. 2017, 32, 1485–1498. [Google Scholar] [CrossRef]
  42. Allen, C.D.; Breshears, D.D.; McDowell, N.G. On underestimation of global vulnerability to tree mortality and forest die-off from hotter drought in the Anthropocene. Ecosphere 2015, 6, 1–55. [Google Scholar] [CrossRef]
  43. Gailis, A. Norway spruce provenances in Latvia. In Proceedings of the Norway Spruce Provenances and Breeding: Proceedings of IUFRO (S2.2–11) Symposium, Riga, Latvia, 14–18 September 1993; pp. 44–49. [Google Scholar]
  44. Zeltiņš, P.; Gailis, A.; Zariņa, I. Long-term performance of Norway spruce in two provenance trials in Latvia. Balt. For. 2021, 27, 195. [Google Scholar] [CrossRef]
  45. Cavin, L.; Jump, A.S. Highest drought sensitivity and lowest resistance to growth suppression are found in the range core of the tree Fagus sylvatica L. not the equatorial range edge. Glob. Chang. Biol. 2017, 23, 362–379. [Google Scholar] [CrossRef]
  46. van der Maaten-Theunissen, M.; Trouillier, M.; Schwarz, J.; Skiadaresis, G.; Thurm, E.A.; van der Maaten, E. pointRes 2.0: New functions to describe tree resilience. Dendrochronologia 2021, 70, 125899. [Google Scholar] [CrossRef]
  47. Harris, I.; Osborn, T.J.; Jones, P.; Lister, D. Version 4 of the CRU TS monthly high-resolution gridded multivariate climate dataset. Sci. Data 2020, 7, 1–18. [Google Scholar] [CrossRef]
  48. Vicente-Serrano, S.M.; Beguería, S.; López-Moreno, J.I. A multiscalar drought index sensitive to global warming: The standardized precipitation evapotranspiration index—SPEI. J. Clim. 2010, 23, 1696–1718. [Google Scholar] [CrossRef]
  49. Bates, D.; Mächler, M.; Bolker, B.; Walker, S. Fitting linear mixed-effects models using lme4. J. Stat. Softw. 2015, 67, 1–48. [Google Scholar] [CrossRef]
  50. Falconer, D.S.; Mackay, T.F.C. Introduction to Quantitative Genetics, 4th ed.; Longmans Green: Harlow, UK, 1996; 635p. [Google Scholar]
  51. Loha, A.; Tigabu, M.; Teketay, D.; Lundkvist, K.; Fries, A. Provenance variation in seed morphometric traits, germination, and seedling growth of Cordia africana Lam. New For. 2006, 32, 71–86. [Google Scholar] [CrossRef]
  52. R Core Team. R: A Language and Environment for Statistical Computing; R Foundation for Statistical Computing: Vienna, Austria, 2022; Available online: https://www.R-project.org/ (accessed on 17 December 2023).
  53. Bunn, A.G. A dendrochronology program library in R (dplR). Dendrochronologia 2008, 26, 115–124. [Google Scholar] [CrossRef]
  54. Speer, J.H. Fundamentals of Tree-Ring Research; The University of Arizona Press: Tucson, AZ, USA, 2010; 333p. [Google Scholar]
  55. Cuny, H.E.; Fonti, P.; Rathgeber, C.B.K.; Von Arx, G.; Peters, R.L.; Frank, D.C. Couplings in cell differentiation kinetics mitigate air temperature influence on conifer wood anatomy. Plant Cell Environ. 2019, 42, 1222–1232. [Google Scholar] [CrossRef]
  56. Socha, J.; Solberg, S.; Tymińska-Czabańska, L.; Tompalski, P.; Vallet, P. Height growth rate of Scots pine in Central Europe increased by 29% between 1900 and 2000 due to changes in site productivity. For. Ecol. Manag. 2021, 490, 119102. [Google Scholar] [CrossRef]
  57. Milesi, P.; Berlin, M.; Chen, J.; Orsucci, M.; Li, L.; Jansson, G.; Karlsson, B.; Lascoux, M. Assessing the potential for assisted gene flow using past introduction of Norway spruce in southern Sweden: Local adaptation and genetic basis of quantitative traits in trees. Evol. Appl. 2019, 12, 1946–1959. [Google Scholar] [CrossRef]
  58. Strand, M.; Löfvenius, M.O.; Bergsten, U.; Lundmark, T.; Rosvall, O. Height growth of planted conifer seedlings in relation to solar radiation and position in Scots pine shelterwood. For. Ecol. Manag. 2006, 224, 258–265. [Google Scholar] [CrossRef]
  59. Matisons, R.; Krišāns, O.; Jansons, Ā.; Kondratovičs, T.; Elferts, D.; Ievinsh, G. Norway spruce seedlings from an Eastern Baltic provenance show tolerance to simulated drought. Forests 2021, 12, 82. [Google Scholar] [CrossRef]
  60. Prendin, A.L.; Mayr, S.; Beikircher, B.; von Arx, G.; Petit, G. Xylem anatomical adjustments prioritize hydraulic efficiency over safety as Norway spruce trees grow taller. Tree Physiol. 2018, 38, 1088–1097. [Google Scholar] [CrossRef] [PubMed]
  61. Ögren, E. Relationship between temperature, respiratory loss of sugar and premature dehardening in dormant Scots pine seedlings. Tree Physiol. 1997, 17, 47–51. [Google Scholar] [CrossRef]
  62. Matisons, R.; Jansone, D.; Elferts, D.; Adamovičs, A.; Schneck, V.; Jansons, Ā. Plasticity of response of tree-ring width of Scots pine provenances to weather extremes in Latvia. Dendrochronologia 2019, 54, 1–10. [Google Scholar] [CrossRef]
  63. Klesse, S.; DeRose, R.J.; Guiterman, C.H.; Lynch, A.M.; O’connor, C.D.; Shaw, J.D.; Evans, M.E.K. Sampling bias overestimates climate change impacts on forest growth in the southwestern United States. Nat. Commun. 2018, 9, 5336. [Google Scholar] [CrossRef] [PubMed]
  64. Neale, D.B.; Martínez-García, P.J.; De La Torre, A.R.; Montanari, S.; Wei, X.-X. Novel insights into tree biology and genome evolution as revealed through genomics. Annu. Rev. Plant Biol. 2017, 68, 457–483. [Google Scholar] [CrossRef] [PubMed]
  65. Schaberg, P.G.; DeHayes, D.H.; Hawley, G.J.; Nijensohn, S.E. Anthropogenic alterations of genetic diversity within tree populations: Implications for forest ecosystem resilience. For. Ecol. Manag. 2008, 256, 855–862. [Google Scholar] [CrossRef]
  66. de la Mata, R.; Zas, R.; Bustingorri, G.; Sampedro, L.; Rust, M.; Hernandez-Serrano, A.; Sala, A. Drivers of population differentiation in phenotypic plasticity in a temperate conifer: A 27-year study. Evol. Appl. 2022, 15, 1945–1962. [Google Scholar] [CrossRef] [PubMed]
  67. Isaac-Renton, M.; Montwé, D.; Hamann, A.; Spiecker, H.; Cherubini, P.; Treydte, K. Northern forest tree populations are physiologically maladapted to drought. Nat. Commun. 2018, 9, 5254. [Google Scholar] [CrossRef] [PubMed]
  68. Zeltiņš, P.; Katrevičs, J.; Gailis, A.; Maaten, T.; Desaine, I.; Jansons, Ā. Adaptation capacity of Norway spruce provenances in Western Latvia. Forests 2019, 10, 840. [Google Scholar] [CrossRef]
Figure 1. Location of the studied clonal trials of local plus trees of Norway spruce in Latvia.
Forests 15 00015 g001
Figure 2. The proportion of clones showing “significant” pointer year in TRW in the studied clonal trials (ac) of local plus trees of Norway spruce in Latvia (bars). Lines indicate broad-sense clonal heritability (H2; solid line) and coefficient of genetic (clonal) variation (CCV) of relative changes in TRW calculated on an annual basis. Heritability coefficients are calculated for the periods represented by ≥5 clones and ≥50 observations.
Forests 15 00015 g002
Figure 3. The proportion of clones showing significant correlations between the mean deviation in tree ring width (relative growth changes) and meteorological variables in three clonal trials of local plus trees of Norway spruce in Latvia (ac) during the period of 1985–2015. Only the variables estimated with significant correlations are shown. SPEI—standardized precipitation evapotranspiration index.
Forests 15 00015 g003
Figure 4. Estimated marginal means of the resilience components of tree ring width of native genotypes of plus trees of Norway spruce, generalized across the studied three clonal trials in Latvia in relation to the negative pointer years during the period of 1985–2018. N—number of observations. Dissimilar letters indicate the significance of the differences (p-value < 0.05).
Forests 15 00015 g004
Table 1. Statistics of the time series of tree ring width of Norway spruce clones in three low-density grafted clonal trials in Latvia. The agreement statistics are calculated for time series detrended by flexible cubic spline. The mean value and the range of estimates (among clones; in brackets) are shown.
TrialKalsnava (KLN)Tukums (TUK)Biksti (BKT)
Number of clones192077
Timespan of series1969–20151971–20151981–2018
Total number of cross-dated trees211335629
Number of ramets (trees) per clone 11.1 (6–18)16.7 (7–24)8.3 (5–22)
Mean tree ring width, mm4.00 (3.58–4.91)4.62 (3.74–5.44)5.68 (4.22–7.02)
Standard deviation in tree ring width, mm1.61 (1.28–2.16)1.49 (1.21–1.76)2.00 (1.33–2.99)
Mean sensitivity of time series0.22 (0.19–0.28)0.25 (0.21–0.29)0.23 (0.17–0.29)
Gini coefficient of time series0.13 (0.10–0.16)0.14 (0.12–0.15)0.12 (0.09–0.17)
First-order autocorrelation of time series0.13 (0.10–0.16)0.14 (0.12–0.15)0.12 (0.09–0.17)
Mean interseries correlation (r-bar)0.40 (0.22–0.57)0.48 (0.31–0.62)0.50 (0.20–0.68)
Expressed Population Signal (EPS)0.87 (0.75–0.94)0.93 (0.81–0.97)0.85 (0.82–0.97)
Signal-to-noise ratio (SNR)8.02 (3.00–17.25)16.21 (4.07–32.45)9.02 (3.73–38.06)
Table 2. Meteorological anomalies according to the national almanack and gridded climatic data (monthly meteorological variables; CRU TS4) coinciding with the estimated “significant” pointer years in tree ring width of local clones of Norway spruce in clonal trials in Latvia during the period of 1971–2018. For the monthly weather anomalies, rolling 30-year z-scores are shown in brackets. Only the anomalies with z-score > 2.00 are shown. MAT—mean annual temperature, SPEI—standardized precipitation evapotranspiration index.
YearPointer YearAlmanackGridded Data, Monthly Variables
1974neg., KLNCold and heat records in winter and summerPrec. spring (−2.34)
1975neg., KLNWarmth records in winter, contrasting spring temp., dry summerMAT (2.49), SPEI Mar. (−2.41)
1978pos., TUKLow temp. records in spring and summer, moist summerPrec. Aug. (2.14)
1980pos., TUK, KLNLow. temp. records in winter and spring, cool spring, moist summerPrec. prev. Jul. (2.19), SPEI Aug. (2.46)
1981pos., KLNCold records in spring, heat records in summer, warm and moist summerPrec. Mar. (2.17), prec. Jun. (2.25)
1990pos., BKT, TUKWarmth records in winter, warm winter, springTemp. Feb. (2.14), temp. Mar. (2.10), temp. winter (2.68)
1993pos., BKT, TUKLow temp. records in winter and summer, cold yearTemp. prev. Oct. (−2.31), temp. May (2.34), SPEI Mar. (2.04)
1995pos., BKTWarmth records in spring and summer, contrasting summer temp.Temp. prev. Jul. (2.32), prec. prev. Jul. (−2.11)
1998neg., KLNWarmth records in winter, moist summerTemp. prev. Aug. (2.46), prec. Jun. (2.1), prec. veg. seas. (2.07)
2000neg., KLNWarmth records in winter, spring, and summerTemp. prev. Jun. (2.29), temp. Apr. (2.37), SPEI. Jun. (2.06)
2006neg.Cold records in winter, heat records in July-
2007neg., BKT, TUKTemp. contrasts in winter and springTemp. prev. Dec. (2.26), temp Mar. (2.43), prec. Jan. (2.33)
2014neg.Warmth record in spring, contrasting temp. May, heat records in summer, warm and dry summerSPEI. prev. Sep. (2.06), SPEI Jan. (2.30), SPEI. veg. seas (−2.55)
2017neg., BKTWarmth records in winter and spring, low temp. records in summer, warm winter, cool summer.Prec. Sep. (2.26)
2018neg., BKTHeat records in spring and summer, dry and warm summerTemp. May (2.51), temp. summer (2.34)
Table 3. The fixed effect of local provenances (provenance region) and stem diameter at breast height on the resilience components of tree ring width of native genotypes of plus trees of Norway spruce, generalized across the studied three clonal trials in Latvia in relation to negative pointer years during the period of 1985–2018, as well as the random variance related to trial design and year of increment.
ResistanceRecoveryResilienceRelative Resilience
Fixed effects
χ2p-valueχ2p-valueχ2p-valueχ2p-value
Local provenance4.7<0.050.10.822.80.090.10.74
Stem diameter at breast height38.7<0.0556.4<0.050.10.8132.2<0.05
Random effects, variance
Tree0.00100.00010.03550.0076
Clone0.00220.01050.00130.0023
Provenance0.00010.00010.00010.0001
Year0.00290.00820.00230.0007
Trial0.00450.00350.00830.0014
Residual0.03530.22240.01560.0419
Model statistic, R2
Marginal 0.0180.0250.0050.017
Conditional0.2450.1140.7530.238
Table 4. Components of genetic/clonal variance for relative changes and resilience components in tree ring width of native genotypes of plus trees of Norway spruce, generalized across the studied three clonal trials in Latvia in relation to negative pointer years calculated on an annual basis for the entire period of 1985–2018. H2—broad sense heritability, CCV—clonal coefficient of variation.
Relative ChangesResistanceRecoveryResilienceRelative Resilience
Variance components
Clone-trial-year interaction0.00070.01780.04680.00010.0026
Clone-year interaction0.00350.01640.00010.02210.0261
Clone0.00020.00010.00010.00160.0001
Residual0.06420.06800.13390.12600.0857
Heritability estimates
H20.00350.00010.00010.01040.0001
CCV0.01600.00010.00010.04010.0001
Disclaimer/Publisher’s Note: The statements, opinions and data contained in all publications are solely those of the individual author(s) and contributor(s) and not of MDPI and/or the editor(s). MDPI and/or the editor(s) disclaim responsibility for any injury to people or property resulting from any ideas, methods, instructions or products referred to in the content.

