Article

Quantitative Assessment of the Impacts of Climate Change and Human Activity on the Net Primary Productivity of Subtropical Vegetation: The Case of Shaoguan, Guangdong, China

1
Guangzhou Institute of Geochemistry, Chinese Academy of Sciences, Guangzhou 510640, China
2
Key Laboratory of Guangdong for Utilization of Remote Sensing and Geographical Information System, Guangdong Open Laboratory of Geospatial Information Technology and Application, GuangDong Engineering Technology Research Center of Remote Sensing Big Data Application, Guangzhou Institute of Geography, Guangdong Academy of Sciences, Guangzhou 510070, China
3
University of Chinese Academy of Sciences, Beijing 100049, China
4
Joint Laboratory on Low-Carbon Digital Monitoring, Guangdong Institute of Carbon Neutrality (Shaoguan), Shaoguan ShenBay Low Carbon Digital Technology Co., Ltd., Shaoguan 512029, China
*
Author to whom correspondence should be addressed.
Forests 2023, 14(12), 2447; https://doi.org/10.3390/f14122447
Submission received: 15 November 2023 / Revised: 1 December 2023 / Accepted: 6 December 2023 / Published: 15 December 2023
(This article belongs to the Section Forest Ecology and Management)

Abstract

:
Vegetation net primary productivity (NPP) is critical to maintaining and enhancing the carbon sink of vegetation. Shaoguan is a characteristic forest city in the subtropical region of South China and an ecological barrier in the Guangdong–Hong Kong–Macau Greater Bay Area (GBA), playing an instrumental role in protecting water resources, purifying air, and maintaining ecological balance. However, studies that quantify subtropical vegetation NPP dynamics in Shaoguan under the influence of climate and human drivers are still incomplete. In this research, vegetation NPP at 30 m resolution was estimated from 2001 to 2020 using the enhanced CASA model based on the GF-SG algorithm in Shaoguan. The RESTREND method was then utilized to quantify climatic and human effects on NPP. The results indicated that the vegetation NPP in Shaoguan increased rapidly (4.09 g C/m2/yr, p < 0.001) over the past 20 years. Climate and human drivers contributed 0.948 g C/m2/yr and 3.137 g C/m2/yr to vegetation NPP, respectively. Human activity plays a major role in vegetation restoration through ecological projects, whereas vegetation deterioration is primarily attributable to the combined action of climate change and human activity, such as urban expansion, deforestation, and meteorological disasters. The results emphasize the importance of ecological projects for the restoration of vegetated ecosystems and ecological construction in Shaoguan.

Graphical Abstract

1. Introduction

Vegetation serves an indispensable function in the absorption of greenhouse gases, the regulation of climate, and the attainment of carbon neutrality [1]. It is estimated that during 2011–2020, terrestrial ecosystems absorbed 29% of the CO2 emitted by humans into the atmosphere, in which vegetation ecosystems played a vital role [2,3]. Vegetation net primary productivity (NPP) is an essential index for assessing ecosystems, revealing the productive capacity of plant communities under natural conditions [4].
Natural drivers, especially climate change, have significant impacts on the structure, function, and services of ecosystems [5,6]. Earlier research on vegetation NPP dynamics has shown that human activity and climate change are forcing or facilitating vegetation ecosystems [7]. The photosynthetic and respiratory capacity of vegetation is affected by climate change, which leads to changes in NPP [8]. Hydrothermal conditions, including temperature, precipitation, and solar radiation (SOL), are critical factors in natural ecosystem processes [9] and clearly influence vegetation productivity and ecological patterns, with substantial regional and global variation [10,11]. For example, on the Tibetan Plateau, temperature is a limiter of NPP increases in humid areas, whereas precipitation is the main limiter of NPP in arid areas [12]. In the Dongting Lake Wetland, climate change has increased vegetation NPP by 1.08 g C/m2/yr over the past 20 years [13]. In contrast, the vegetation NPP in Central Asia decreased significantly during 2001–2008, which is attributable to drought intensification [14]. For South American rainforests, solar radiation was the primary driver of an increase in NPP, while decreased precipitation and prolonged drought led to a decrease in NPP [15].
Simultaneously, there is evidence of the increasing influence of human activity on vegetation dynamics [16]. With rapid economic and social development, large-scale land use changes are inevitable, leading to a rapid decline in vegetation NPP [17,18]. For instance, NPP shows a significant downward trend in the Guangdong–Hong Kong–Macau Greater Bay Area (GBA) because of changes in land use types (especially a decrease in the area of cropland and forest types) [19]. On the other hand, positive greening measures such as afforestation, ecological restoration, and ecological transformation cannot be ignored [20,21]. In China’s five typical ecologically fragile areas, human activities have significantly restored NPP, indicating the success of ecological restoration programs [22]. Wang et al. [23] suggested that human activity was a key factor in an increase in NPP in the Yangtze River Basin.
With the popularization of remote sensing technology and the advancement of the NPP simulation model, multi-scale NPP estimation is becoming increasingly accurate [24,25]. At the locational, regional, and global scales, indirect estimation using models is a major approach in NPP studies. Ruimy [26] summarizes these models as light energy utilization models, ecosystem process models, and climate production potential models. The Carnegie–Ames–Stanford Approach (CASA) is built on the principle of photosynthesis, combined with the view of resource balance and the light energy utilization rate proposed by Monteith [27]. Compared with other models, the CASA model requires fewer parameters and is easy to obtain, avoiding errors caused by missing data and human factors, and easy to popularize [28]. Meanwhile, the CASA model is more applicable to different spatiotemporal scales due to the combination of remote sensing data [29]. However, most studies on vegetation NPP use low-resolution (250 m, 500 m, and 1000 m) remote sensing data to reflect the temporal variation trend in the NPP of vegetation, but it is not enough to reveal the spatial detail characteristics of NPP [30,31,32]. As urban landscape fragmentation intensifies and vegetation types become more complex, remote sensing imagery with higher quality is needed to estimate NPP [33].
The mechanisms that affect vegetation change are very complex, particularly in regions with diverse natural structures, unique climates, and frequent anthropogenic disturbances [34]. For instance, the subtropical area is very rich in vegetation resources and is also one of the most densely settled and economically advanced regions [35]. The growth of subtropical vegetation is more affected by global warming and the continued intensification of human activity [36]. Shaoguan is a subtropical area; since the reform and opening up, urbanization and industrialization processes have been accelerating, and the forest has long been disturbed and destroyed by human activities. However, with the deepening of ecological civilization construction in recent years, Shaoguan has gradually increased its attention on and promotion of forest protection and ecological restoration. Through scientific planning and management, the quality and function of forest ecosystems have been gradually restored. Therefore, it is imperative to quantitatively analyze the effects of climatic and anthropogenic drivers on subtropical vegetation changes in Shaoguan.
Here, we aimed to develop a rational technical process for subtropical vegetation NPP simulations at 30 m resolution and with an interpretable approach to quantify climatic and human effects on NPP changes. The aims of the research were as follows: (1) to simulate and explore the spatiotemporal distribution of vegetation NPP with 30 m resolution using an improved CASA model; (2) to quantitatively evaluate climatic and human effects on NPP dynamics. The significance of this research lies in improving the quality of NPP estimations, enhancing our understanding of the influence of drivers on the carbon cycle of subtropical vegetation ecosystems, and providing theoretical references for the ecological security of subtropical vegetation.

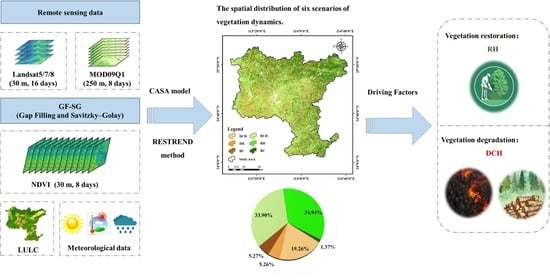
2. Materials and Methods

In this research, we introduce an enhanced CASA model designed to simulate vegetation NPP. Additionally, climatic and human impacts on the NPP of Shaoguan from 2001 to 2020 were quantitatively evaluated with the RESTREND method. There is a detailed flowchart shown in Figure 1.

2.1. Study Area

Shaoguan is situated in the northern part of Guangdong, at the southern end of the Nanling Mountains, which serves as a crucial ecological barrier in Guangdong. It lies at 23°53′~25°31′ N, 112°53′~114°45′ E (Figure 2), occupying an area of approximately 18,424 km2. The climate of Shaoguan is a monsoon climate in the southern subtropics, with an average annual temperature that ranges from 18.8 °C to 21.6 °C and an average annual rainfall that ranges from 1400 mm to 2400 mm. The natural flora in Shaoguan belongs to the southern subtropical evergreen broadleaf forest. In 2022, the forest area of Shaoguan was 1,278,600 hm2, with a forest cover rate of 74.5%. In addition, the forest greening rate is 74.95%, and the storage volume is 100,902,000 m3. In addition, Shaoguan was also selected as a forestry carbon sink pilot city in 2022.
Although Shaoguan has the most abundant forest resources in Guangdong Province, there has been a decline in forest cover and quality due to climate change, rapid urban expansion, and inappropriate forestry policies. Therefore, it is an important step toward ecological revitalization and achieving carbon neutrality in Shaoguan to study the long-term changes in forest NPP and to assess how climate and human drivers affect vegetation NPP.

2.2. Data Sources and Preprocessing

The surface reflectance products include Landsat 5/7/8 (30 m, 16 days) and MOD09Q1 (250 m, 8 days), which were supplied by the United States Geological Survey (USGS) and were obtainable from the GEE platform during the study period. Given the humid subtropical monsoon climate of Shaoguan City, it was challenging to acquire cloud-free remote sensing images for each month. To account for this challenge, the gap-filling and GF-SG methods were used to reconstruct time series from Landsat (30 m, 8 days) during 2001–2020. Additionally, approximately 22% of the data in Landsat 7 scenes have been missing since 31 May 2003 because of a malfunction in the Scan Line Corrector (SLC) of the Landsat 7 imager [37]. To fill the image gaps, the gap-filling method, based on adjacent non-empty linear interpolation, was employed in this research. For the contemporaneous images between the previous and subsequent years, a median image of the missing pixels was taken. A linear correlation was then established between the missing pixel and the 21 × 21 adjacent pixels containing non-zero values. The missing value of the vacant image element can be obtained from this linear relationship. For a detailed methodology, see Wang et al. [38].
The Geospatial Data Cloud Platform (https://www.gscloud.cn (accessed on 23 May 2023).) provided SRTM DEM (30 m) products, which were used as the topographic data for the study region.
Meteorological data were obtained from the China Meteorological Data Network (http://data.cma.cn/ (accessed on 16 May 2023)). This dataset includes daily temperature, rainfall, and sunshine records from 28 meteorological stations within and outside the study area. The solar radiation data were calculated using meteorological observations such as temperature and sunshine hours. To enhance the precision of the meteorological data, we utilized the cokriging interpolation method with the meteorological data collected from these stations and the DEM in ArcGIS 10.8.
We applied the RF classifier [39] in the GEE platform using imagery from Landsat 5/7/8 as inputs for the 2001-to-2020 period. The overall classification accuracy of LULC exceeded 83.27%, and the kappa coefficients were over 0.79, which met the accuracy requirements of this research.
The FMI (forest management inventory) is a forest resource survey with each municipal administrative district as a survey unit, which includes survey factors such as the average age of trees, mean diameter at breast height, mean height of trees, and tree species structure. We screened 46 typical sample plots based on the spatial resolution of remote sensing images and the spatial correspondence of the sample plots and calculated the vegetation NPP of each sample plot by utilizing the correlation between the vegetation NPP and the annual growth and wilting of the community. For details, see Yu et al. [40].

2.3. Spatiotemporal NDVI Reconstruction

In the research, we reconstructed a high-quality NDVI (30 m, 8 days) from 2001 to 2020 using the GF-SG method, invoking MOD09Q1 and Landsat 5/7/8 surface reflectance products on the GEE platform. First, the GF-SG algorithm fills gaps in the original Landsat NDVI chronology by combining the MODIS time-series NDVI and the surrounding cloud-free Landsat NDVI to produce a MODIS-Landsat time-series NDVI. Second, the synthesized time series go through the weighted Savitzky–Golay filter to reduce and smooth residual noise. For detailed steps in the GF-SG algorithm, see Chen et al. [41].

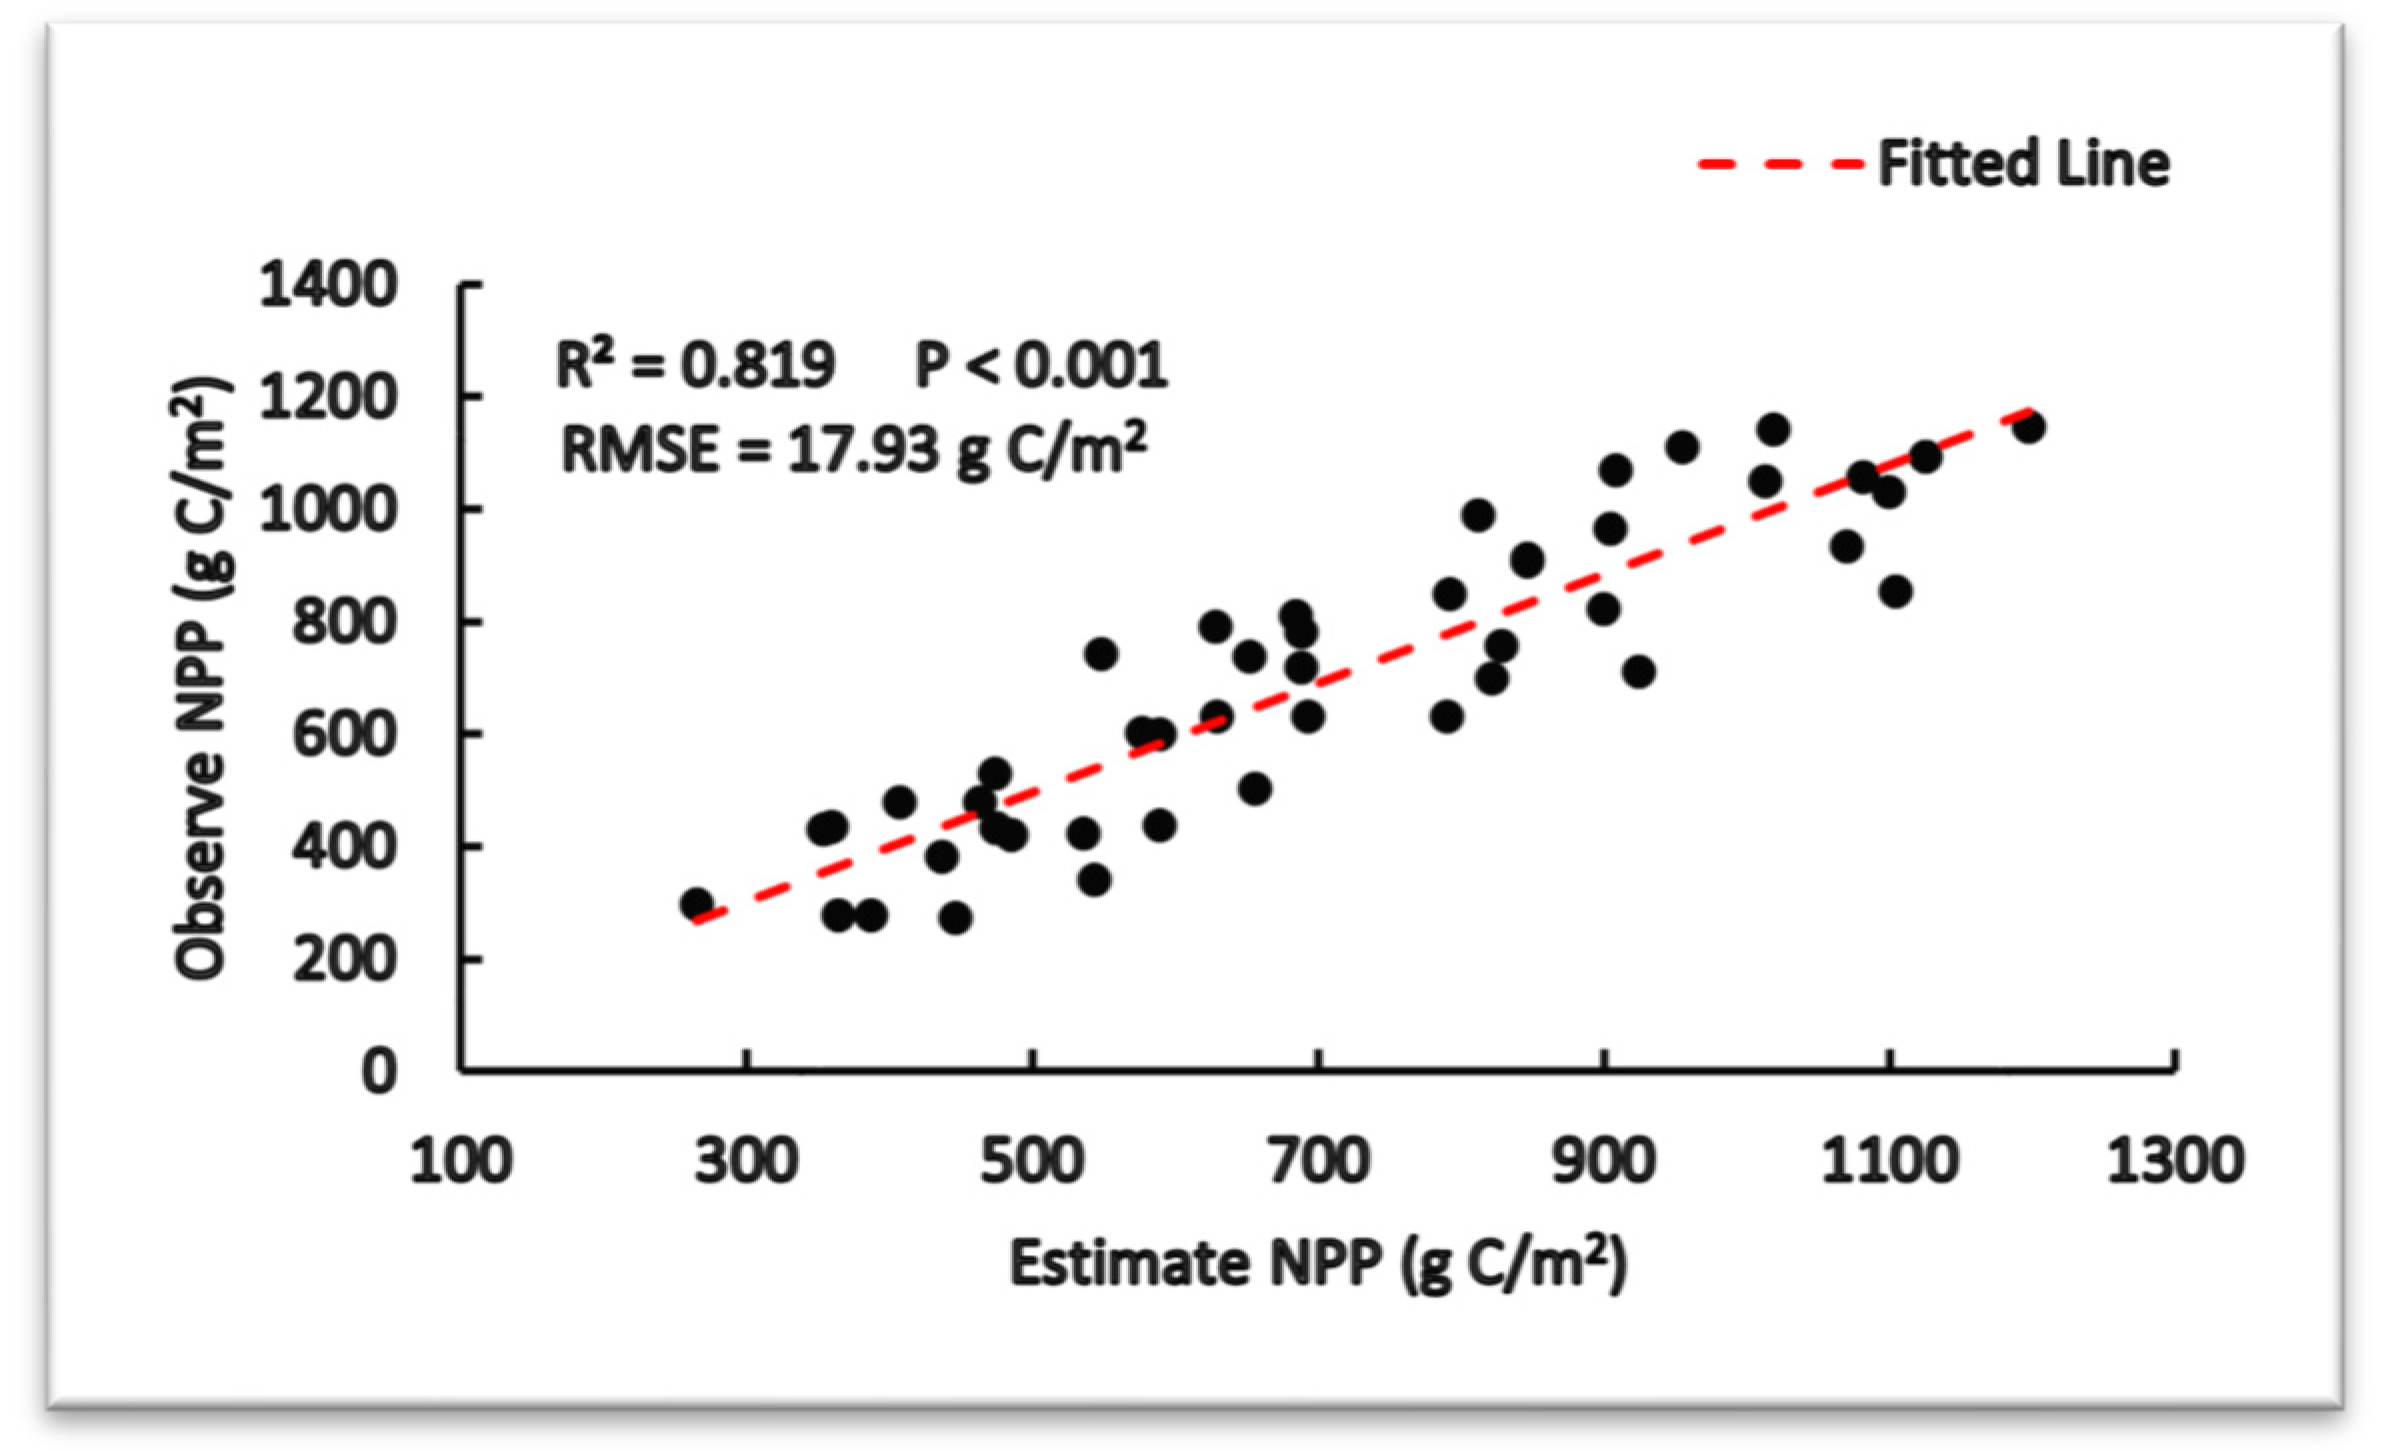
2.4. NPP Estimation and Validation

The vegetation NPP of Shaoguan was simulated from 2001 to 2020 using the enhanced CASA model in this research. Potter et al. [42] and Field et al. [43] proposed the CASA model, which was easy to use. The equations are as follows:
NPP (x,t) = APAR (x,t) × ε (x,t)
where x and t are the pixel spatial location and the month, respectively; APAR and ε represent the photosynthetically active radiation absorbed by vegetation and the light-use efficiency of vegetation, which can be computed by Equations (2) and (3).
APAR (x,t) = a × SOL (x,t) × FPAR (x,t)
ε (x,t) = Tε1 (x,t) × Tε2 (x,t) × Wε (x,t) × εmax
where FPAR is the fraction of photosynthetically active radiation (PAR) absorbed by the vegetation layer; SOL represents the total solar radiation; a denotes the fraction of solar radiation that vegetation is able to utilize as effective radiation out of SOL, which is generally 0.5; Tε1/Tε2 and Wε are the temperature stress coefficient and water stress coefficient, respectively; εmax is the maximum light-use efficiency of vegetation under ideal conditions and is set as a constant.
Previous studies have shown SOL spatial data accuracy decreases with fewer solar radiation stations in the study area when using spatial interpolation [44]. In this paper, conventional observations (i.e., temperature and sunshine hours) from meteorological stations were used to estimate solar radiation indirectly. The formula is shown below:
SOL = S0 × [a × S1 + b × ln(D) + c]
where a, b, and c are the empirical coefficients; D is the daily temperature difference; S1 represents the percentage of sunshine; and S0 is astronomical radiation, which can be obtained by using Equation (5):
S0 = (ISC × E0 × (ωS × sin∅ × sinδ + cos∅ × cosδ × sinωS))/π
where ISC is the solar constant, and the value is 118.109 MJ/m2/d; E0 represents the Earth’s orbital eccentricity correction factor; δ is the solar declination; ∅ is the geographical latitude of each site; ωS is the hour angle at sunset. More details of the above formula can be obtained from previous studies [45].
The conventional CASA model suggests 0.389 g C/MJ as the εmax for all vegetation types worldwide, which is highly controversial [46]. It is unreasonable for all vegetation types to share the same εmax, resulting in an underestimation of vegetation NPP [47]. Peng et al. [48] concluded that the εmax for all vegetation types takes a value of 0.389 g C/MJ, which is low for Guangdong vegetation. Running and Hunt [49] used the BIOME-BGC model to estimate the εmax for each vegetation type, which significantly improved the accuracy of the vegetation NPP estimation. The findings were then employed in this paper.
In this study, R2, RMSE, and p-value are employed to validate the CASA model. R2 reflects the fraction to which all variables in the regression model explain the target variable. Typically, R2 ranges from 0 to 1 and is equal to 1 when the fitted values are unbiased. RMSE is the average deviation between the predicted and true values, with smaller values indicating more accurate predictions from the model.
R 2 = 1 i = 1 n x ~ i x i 2 i = 1 n x ~ i x ¯ i 2
R M S E = i = 1 n x ~ i x i 2 n 1
where  x ~ i  is the field observations,  x i  is the estimated values,  x ¯ i  is the mean of the field observations, and n represents the size of the sample.

2.5. Trend Analysis

In this paper, the Theil–Sen median slope (i.e., Sen’s slope) and the Mann–Kendal (MK) trend analysis were adopted to assess the interannual variation in vegetation NPP in Shaoguan. The aim was to reveal the long-term variation trend and significance of vegetation NPP.
Sen’s slope is a statistical method that is well-known in geosciences and is primarily used to analyze the trend of each element [50]. This method judges the trend of time series by the median size of the slope to reduce or avoid the influence of missing data and anomalies on statistical results. It is calculated as follows:
K = M e d i a n x j x k j k
where  x j  and  x k  are the  x  for the corresponding time ( j = k + 1 ; j , k < n );  K  is the variation trend of  x  at a pixel level.
Moreover, the MK trend analysis is a nonparametric approach that reveals the significance of the trend. The MK trend analysis is calculated as follows:
S = k n 1 j n s g n x j x k
where  n  is the value of  x x j  and  x k  represent the value of  x  at times  j  and  k , respectively.  s g n x j x k  is the sign function:
s g n x j x k =   1 ,          x j x k > 0     0 ,          x j x k = 0    1 ,          x j x k < 0   
When n > 10, the F-variable is calculated as follows:
F = S 1 / V ,    S > 0                      0 ,    S = 0 S 1 / V ,    S < 0
V = n n 1 2 n + 5 18
K > 0 suggests an upward trend in NPP; K < 0 suggests a downward trend in NPP. If |F| ≥ F(α/2) at an assumed α significance level, the original hypothesis is rejected (i.e., there is an obvious upward or downward trend in vegetation NPP at the α significance level). The trends were tested at different α values (0.05 and 0.01) and categorized into the following levels (Table 1):

2.6. Contribution of Driving Factors

In this research, the RESTREND method was employed to quantify the factors affecting vegetation NPP change in Shaoguan. The RESTREND method hypothesized that vegetation NPP dynamics are driven mainly by climate factors (precipitation, temperature, and SOL) and anthropogenic activity. The climatic and human contribution to NPP was computed using Equation (13) [51,52]:
K N P P C c + C h = C t e m p + C p r e + C S O L + C h = N P P t e m p × t e m p t + N P P p r e × p r e t + N P P S O L × S O L t + C h
where  K N P P  represents interannual variation in vegetation NPP;  C c C h C t e m p C p r e , and  C S O L  are the contributions of the drivers (i.e., climate change, human activities, temperature, precipitation, and SOL) for vegetation NPP;  C h  is the anthropogenic contribution to NPP;  C c  is equal to the sum of  C t e m p C p r e , and  C S O L C p r e  is a product of  N P P p r e  and  p r e t ; and  C t e m p  and  C S O L  are also computed in the same way. In addition to climate change, other drivers (such as forest fires, soil moisture, CO2 fertilization effect, etc.) also contribute to NPP and are included in  C h . However, among these factors, human activity still dominates. Therefore,  C h  is roughly equal to the anthropogenic contribution to NPP.
In general, vegetation NPP not only reflects changes in vegetation carbon sequestration but also reflects vegetation restoration and degradation [53]. Six scenarios were identified to simplify the intricate mechanisms that drive vegetation dynamics, based on the interplay between vegetation dynamics and both climate and human drivers (Table 2).

3. Results

3.1. Validation of Simulated NPP

Figure 3 shows the correlation between the field observations and the corresponding estimated vegetation NPP. There is a significant positive correlation between the field observations and estimated vegetation (R2 = 0.819, p < 0.001), as well as a relatively small RSME between them (RSME = 17.93 g C/m2), indicating that the CASA model estimate is reliable and can be further analyzed for interannual variation in vegetation NPP.

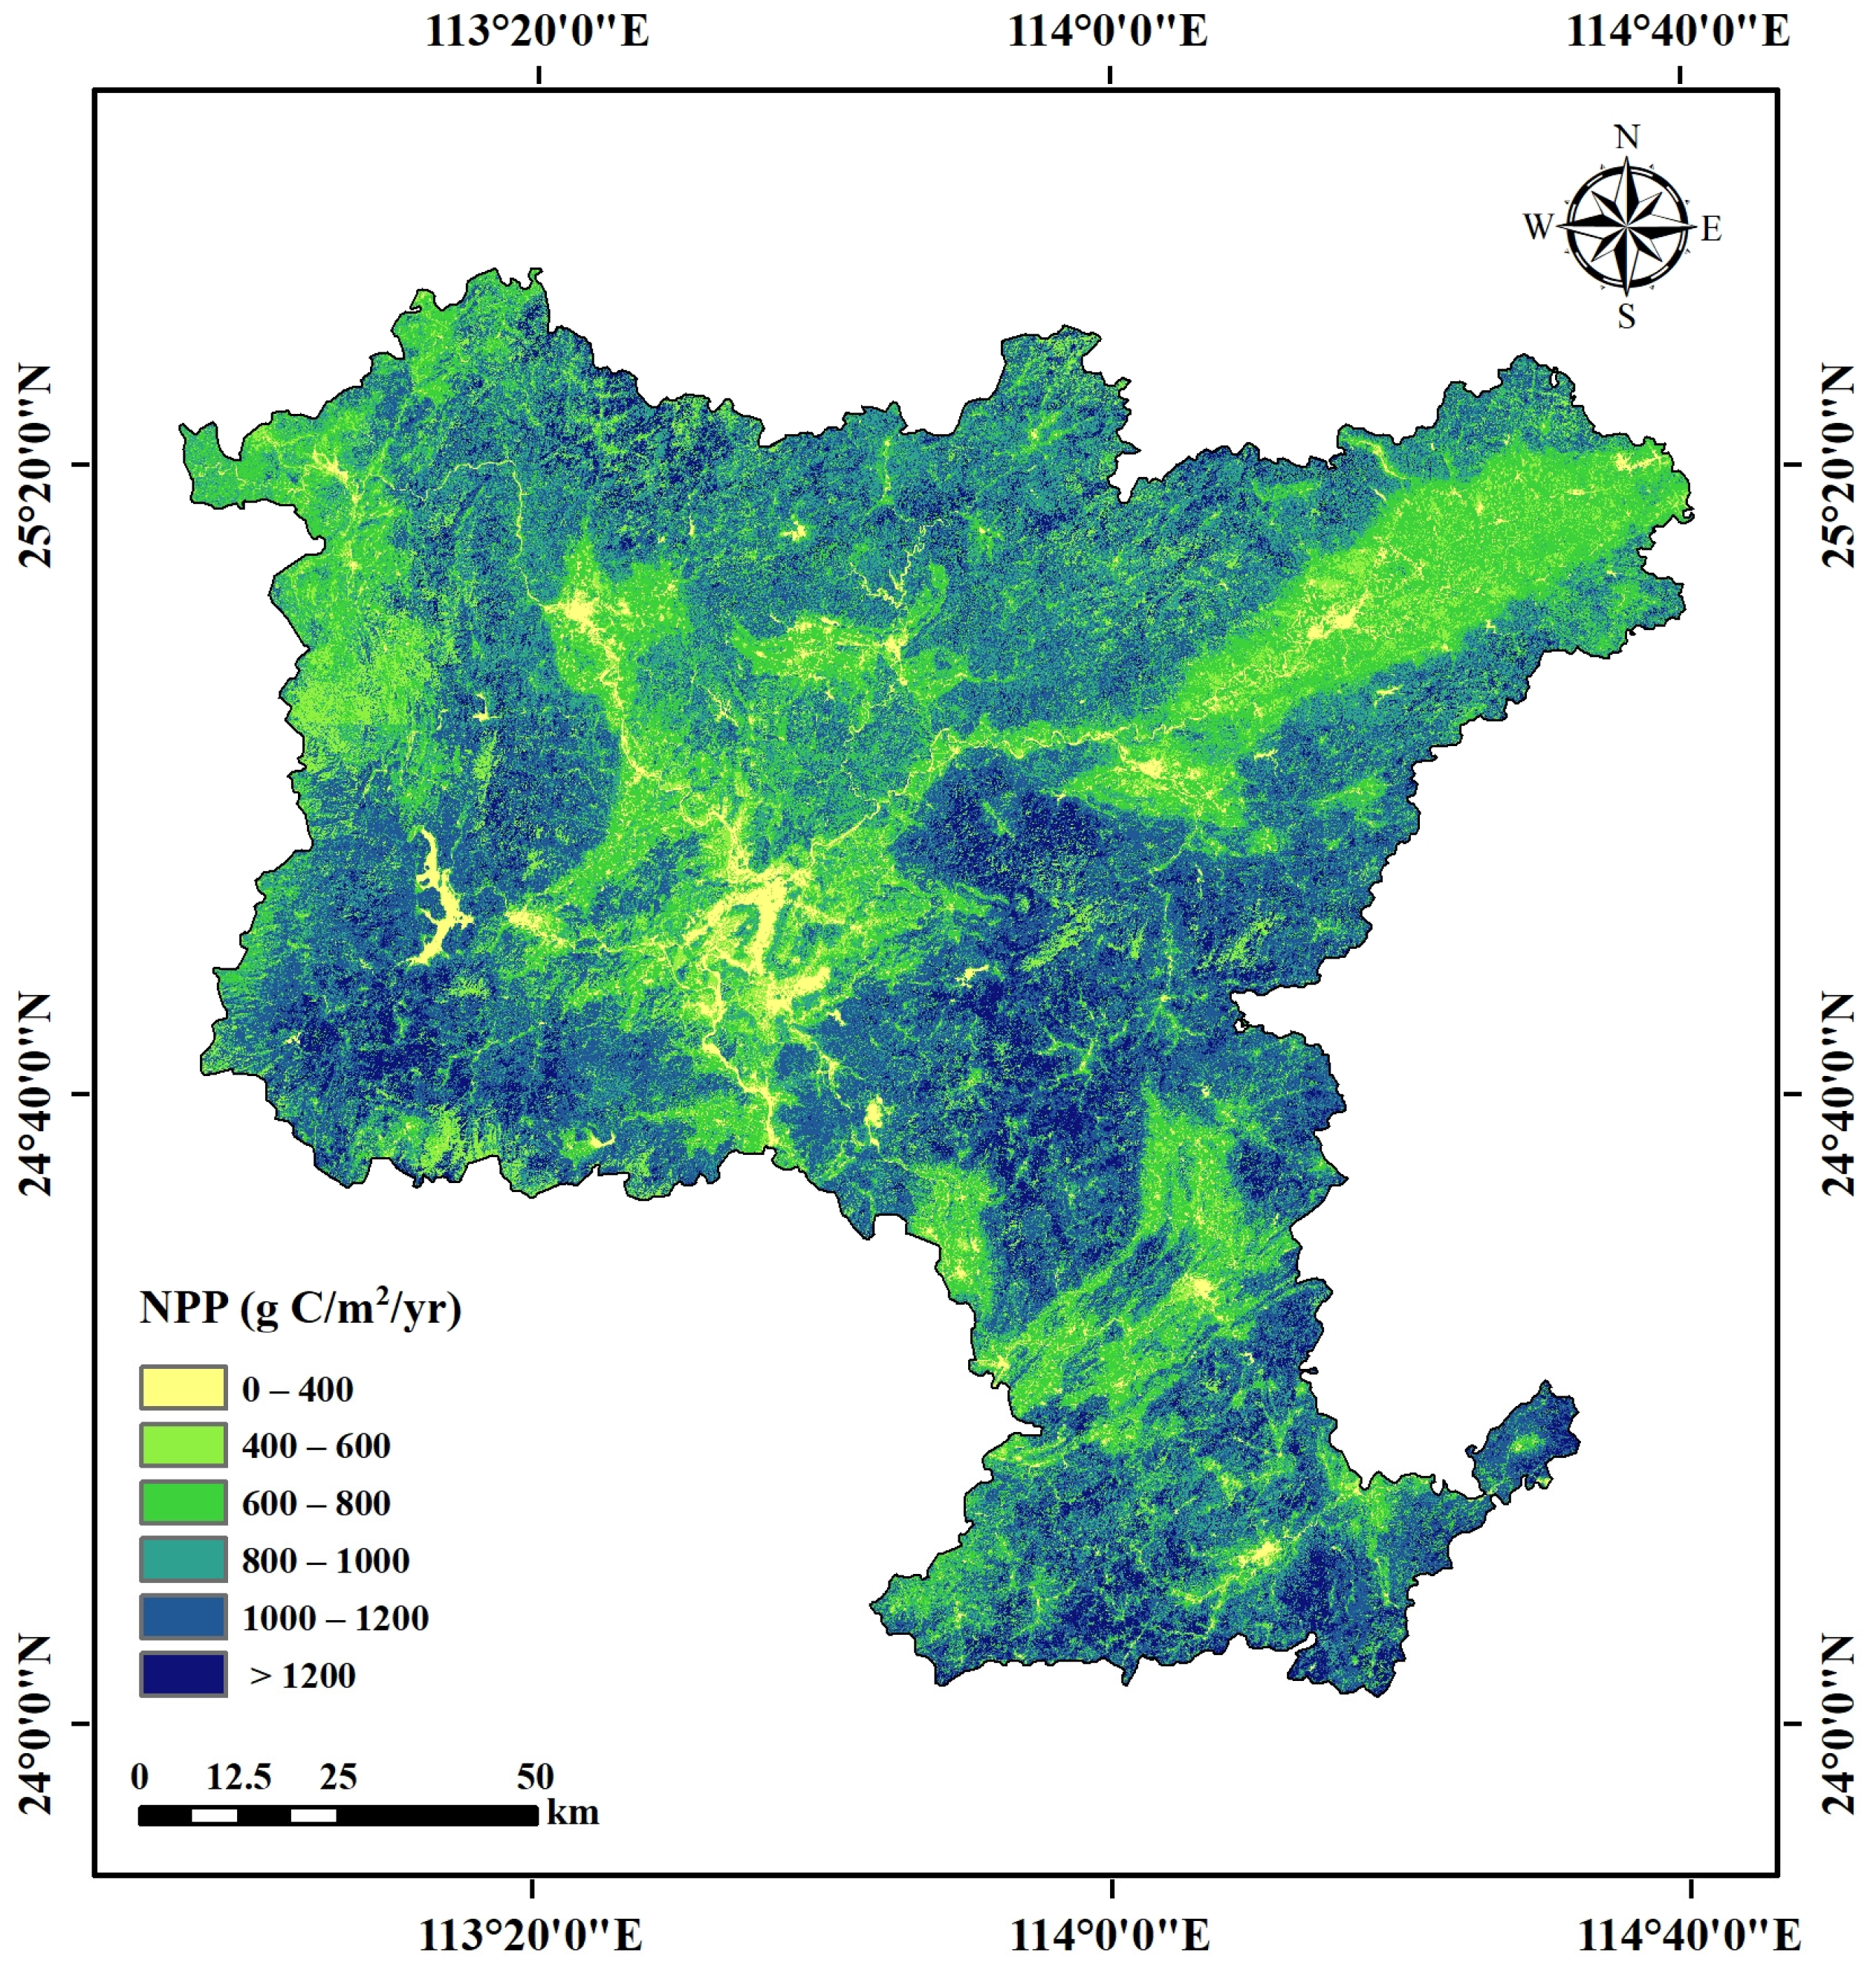
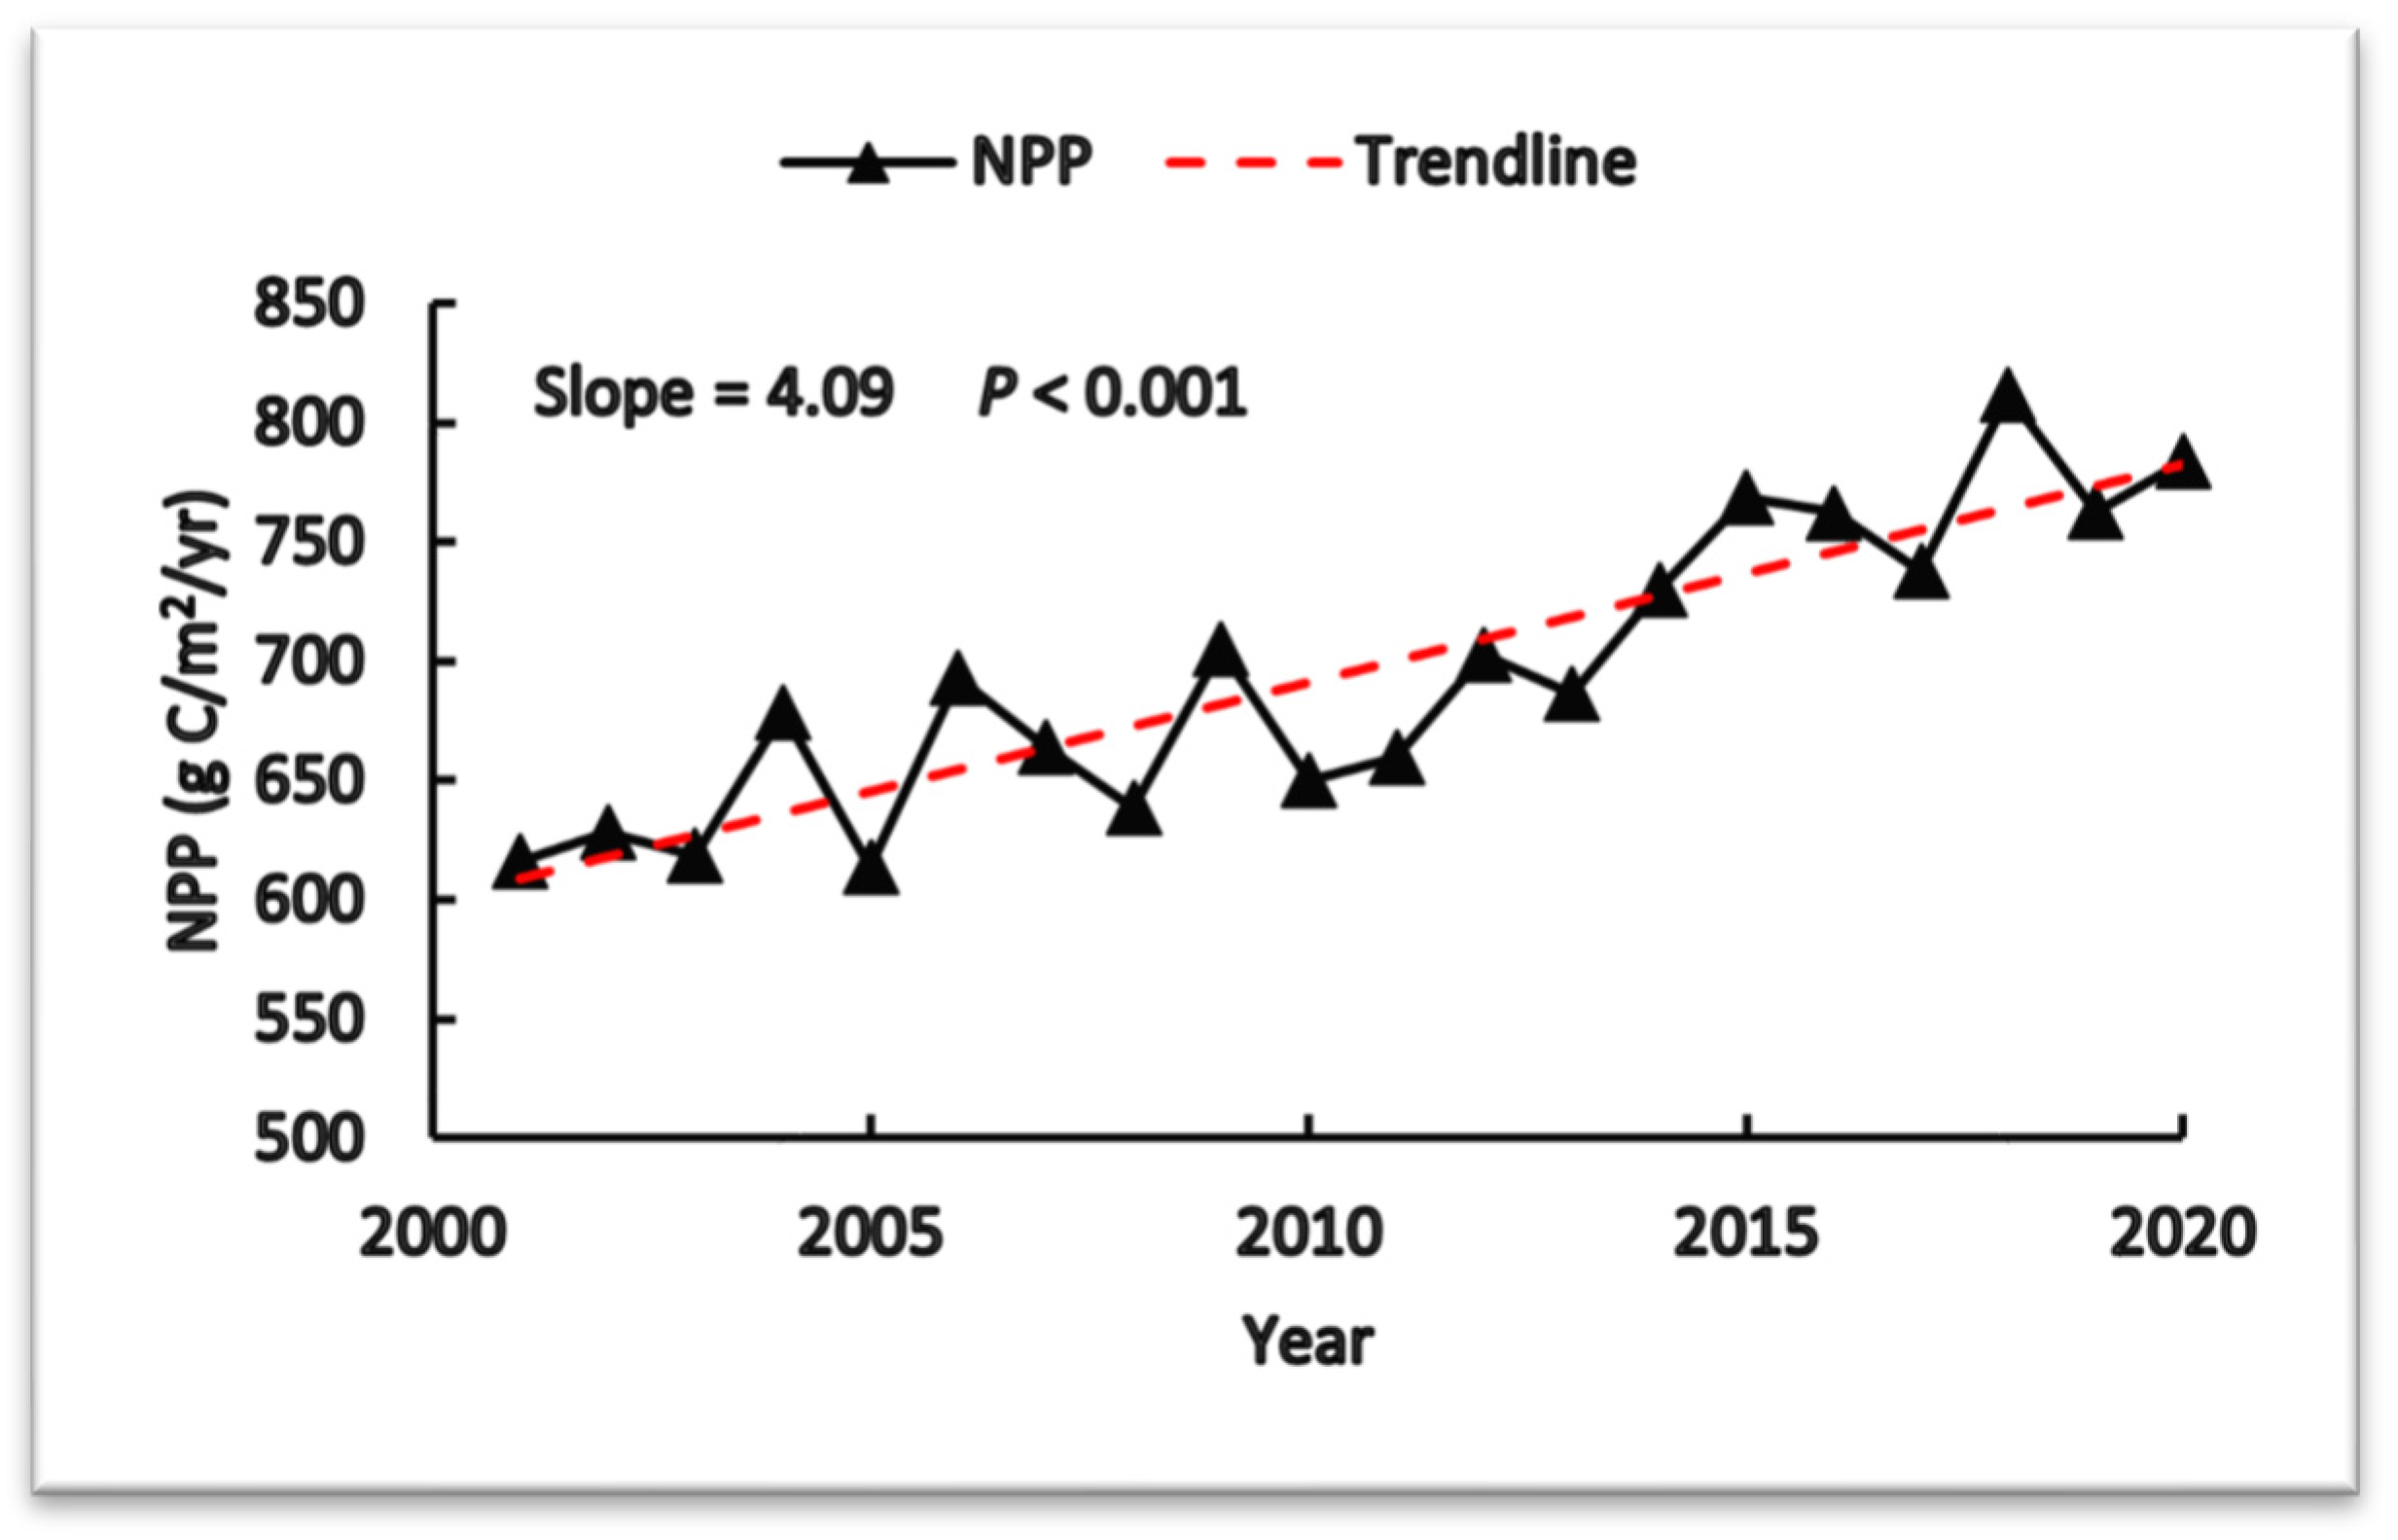
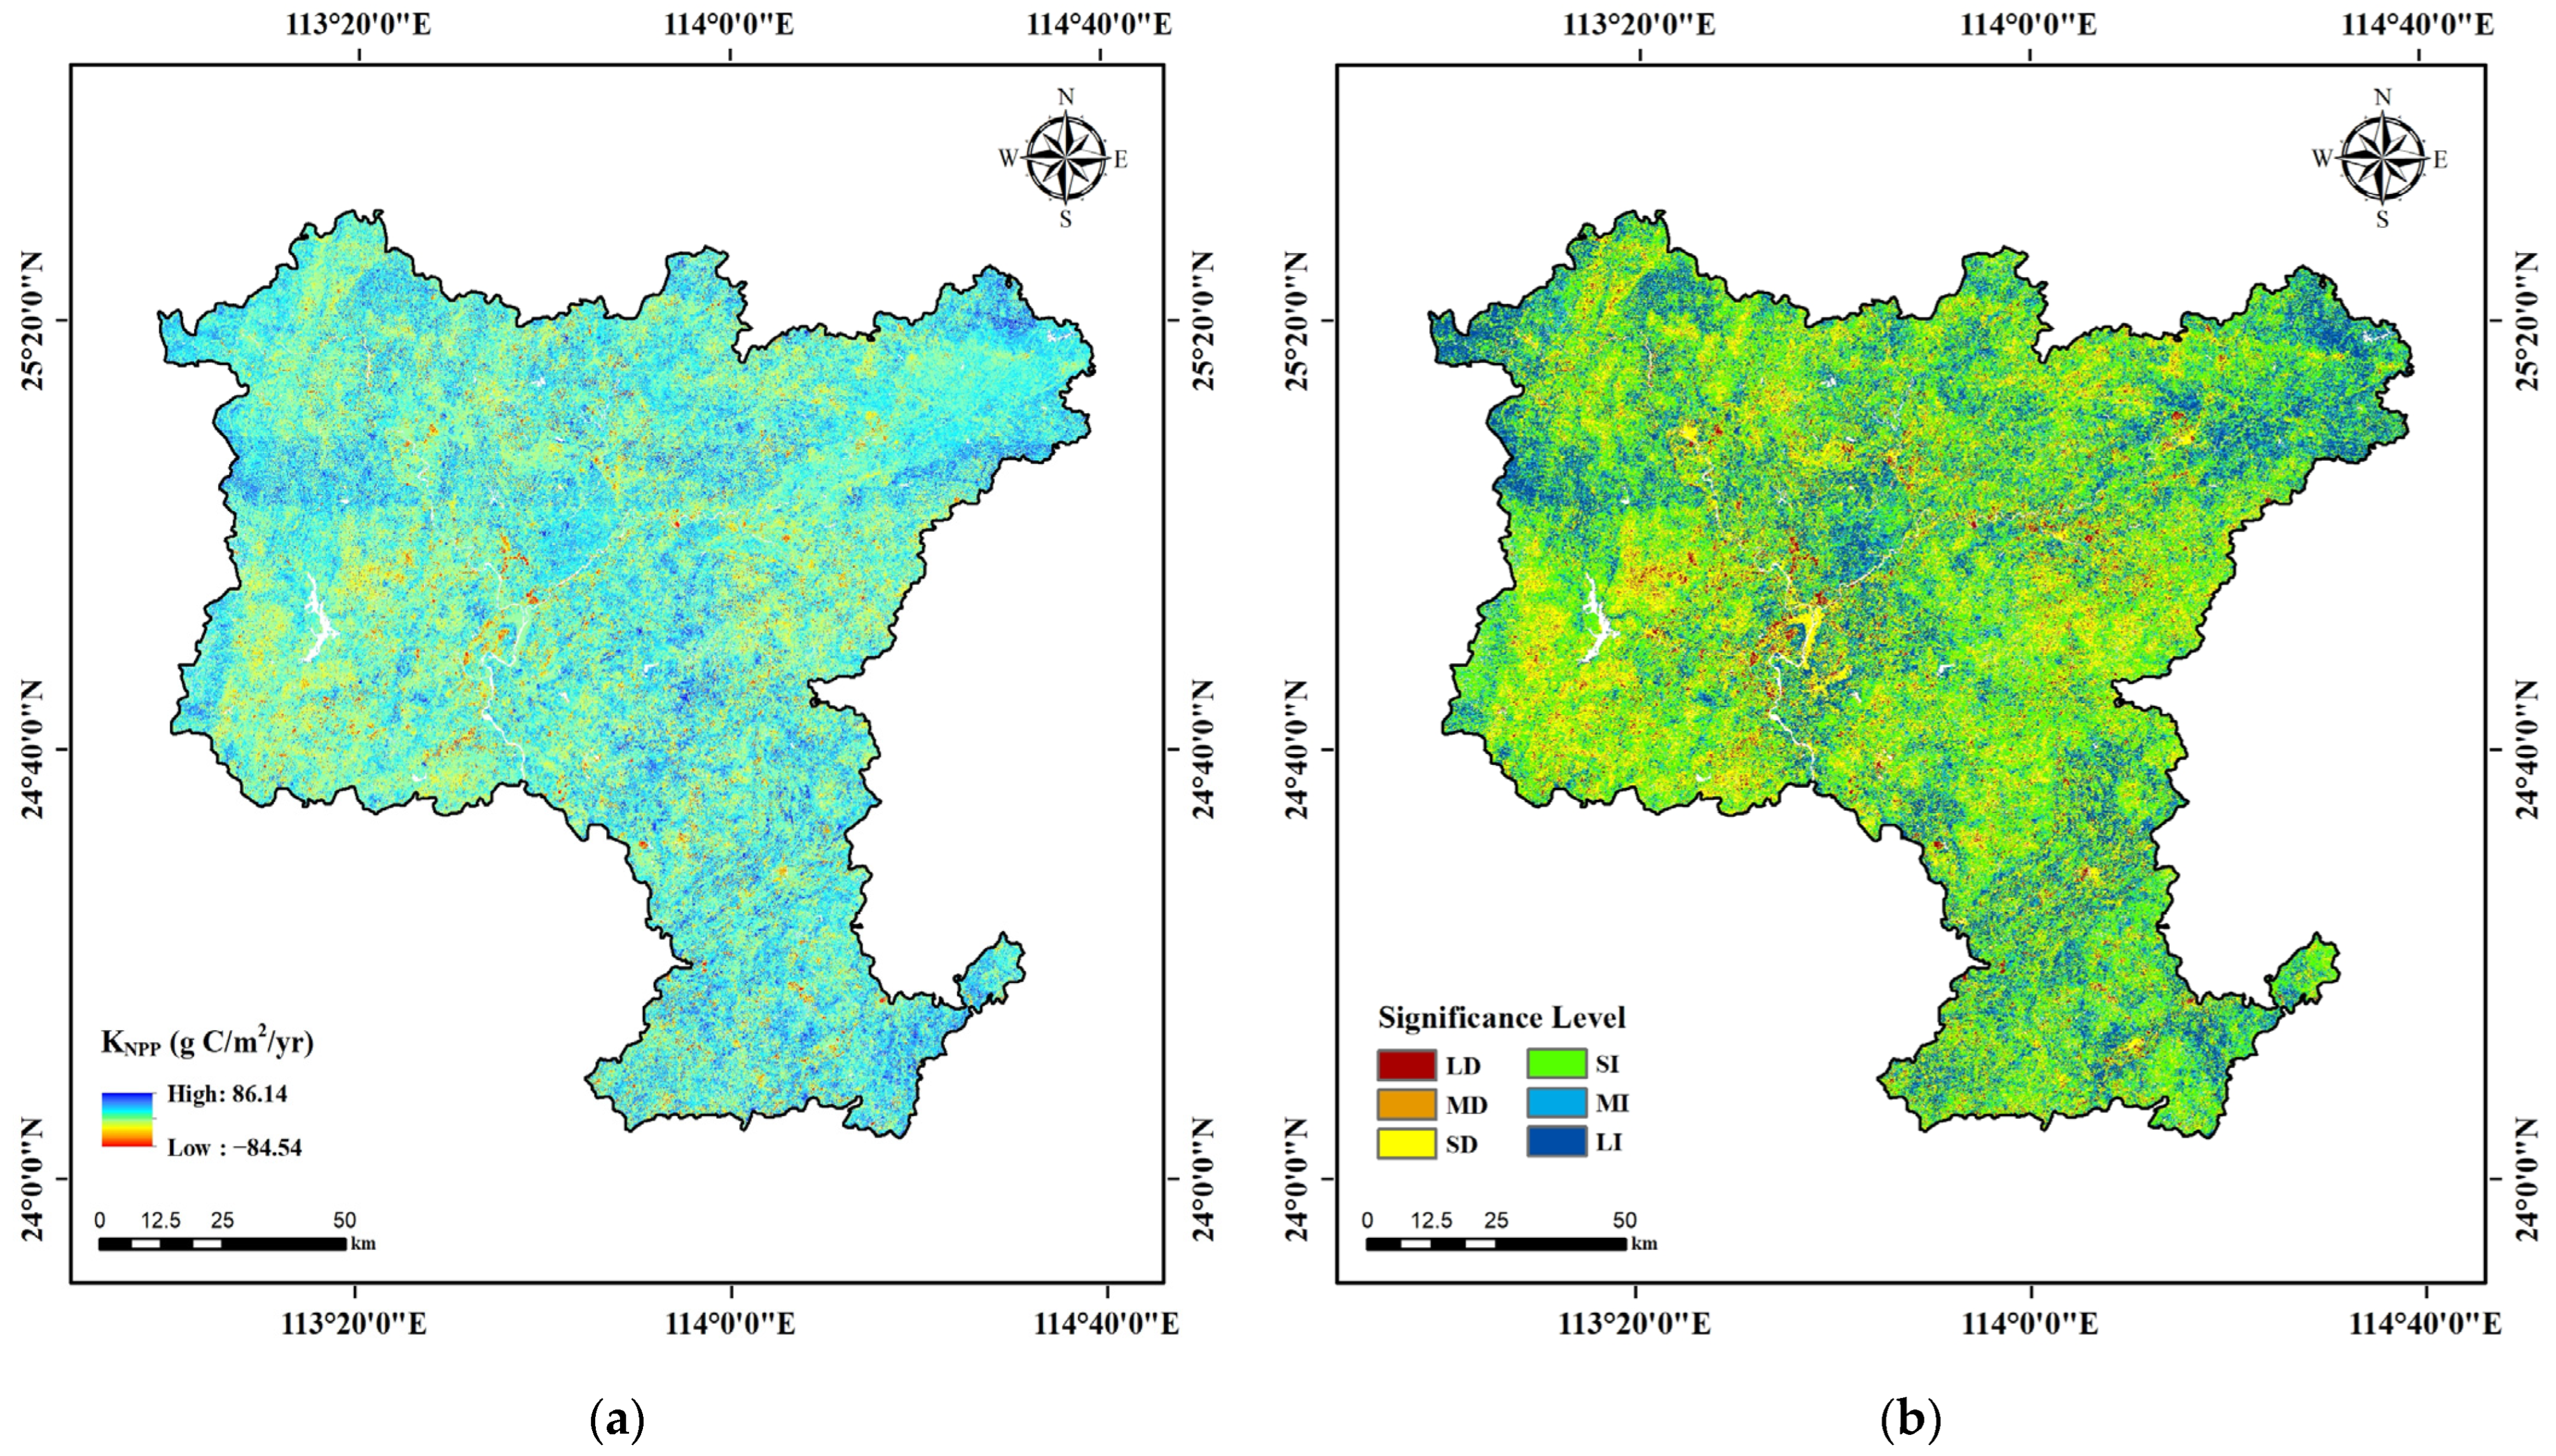
3.2. Spatial Distribution and Interannual Variation in Vegetation NPP

The annual mean vegetation NPP of Shaoguan was 683.77 g C/m2/yr from 2001 to 2020. Overall, the NPP is roughly between 200 and 1000 g C/m2/yr (Figure 4). High-NPP (>1000 g C/m2/yr) areas were predominantly situated in the southwestern and east-central regions of the research areas, characterized by substantial forest and shrub coverage. Conversely, low-NPP (<200 g C/m2/yr) areas were primarily identified in the water body, urban, and cropland areas. The statistics show that forests had the highest mean annual NPP (790.36 g C/m2/yr), followed by shrubland (562.74 g C/m2/yr), cropland (463.97 g C/m2/yr), wetland (290.50 g C/m2/yr), and grassland (137.37 g C/m2/yr).
As shown in Figure 5, there was a significant upward trend in mean annual vegetation NPP (4.09 g C/m2/yr, p < 0.001) in Shaoguan from 2001 to 2020. Generally, vegetation NPP in the research region obviously increased. The results obtained from Sen’s slope (Figure 6a) revealed that the area of vegetation NPP increase (70.21%) was more than twice that of the area of vegetation NPP decrease (29.79%) over the last two decades.
Furthermore, the MK trend analysis results revealed that there was a distinct spatial heterogeneity in the interannual variation trend of vegetation NPP changes (Figure 6b). The significant increase in areas is widely distributed throughout the study area, particularly LI and MI (i.e., large and moderate increases in vegetation NPP), accounting for 16.27% and 12.97%, respectively. Conversely, there are fewer regions that show an obvious decreasing trend, with a more concentrated distribution. LD and MD (i.e., large and moderate decreases in vegetation NPP) were scattered in built-up land and accounted for only 3.55% and 2.84% of the study region, respectively. Shaoguan’s ecological environment was properly protected over the past 20 years, and its vegetation NPP maintained a stable state. SD (i.e., slight decreases in vegetation NPP) were concentrated in built-up land and forest, which account for 23.23% of the study region. SI (i.e., slight increases in vegetation NPP) was mainly concentrated in forests bordering farmland, which account for 41.14% of the area.

3.3. Climatic and Human Contributions to NPP Dynamics

Overall, human activity resulted in greater increases in vegetation NPP than climate change. Human and climate drivers contributed 3.137 g C/m2/yr and 0.948 g C/m2/yr to vegetation NPP, respectively (Table 3). A total of 64.81% of vegetation NPP was positively impacted by human activity, and 40.66% was facilitated by climate change. Most of the areas with significant anthropogenic impact were situated in built-up land and the forest in the southwest (Figure 7b). In contrast, climate change significantly reduced NPP in several forest types, especially timber and water conservation forests in the southwest and ecological economic forests in the north (Figure 7a).
Statistically, the contribution of SOL to NPP was the largest (0.668 g C/m2/yr), followed by precipitation (0.276 g C/m2/yr) and temperature (0.004 g C/m2/yr) (Table 3). In most of the study regions, the positive contribution of SOL to vegetation NPP exceeded that of temperature and precipitation. Statistically, SOL positively affected vegetation NPP in significantly more areas (61.41%) than temperature (22.02%) and precipitation (46.82%) but still showed an apparent negative effect in the southwestern and north-central forested areas (Figure 8c). Temperature and precipitation both affected vegetation NPP in Shaoguan, resulting in an opposite contribution distribution at the pixel level. Temperature contributes positively to vegetation NPP in ecological forests in the northwest and in water-holding forests in the northeast (Figure 8a). In contrast, the positive contribution of precipitation to NPP was primarily focused within the central part of the study area (Figure 8b).

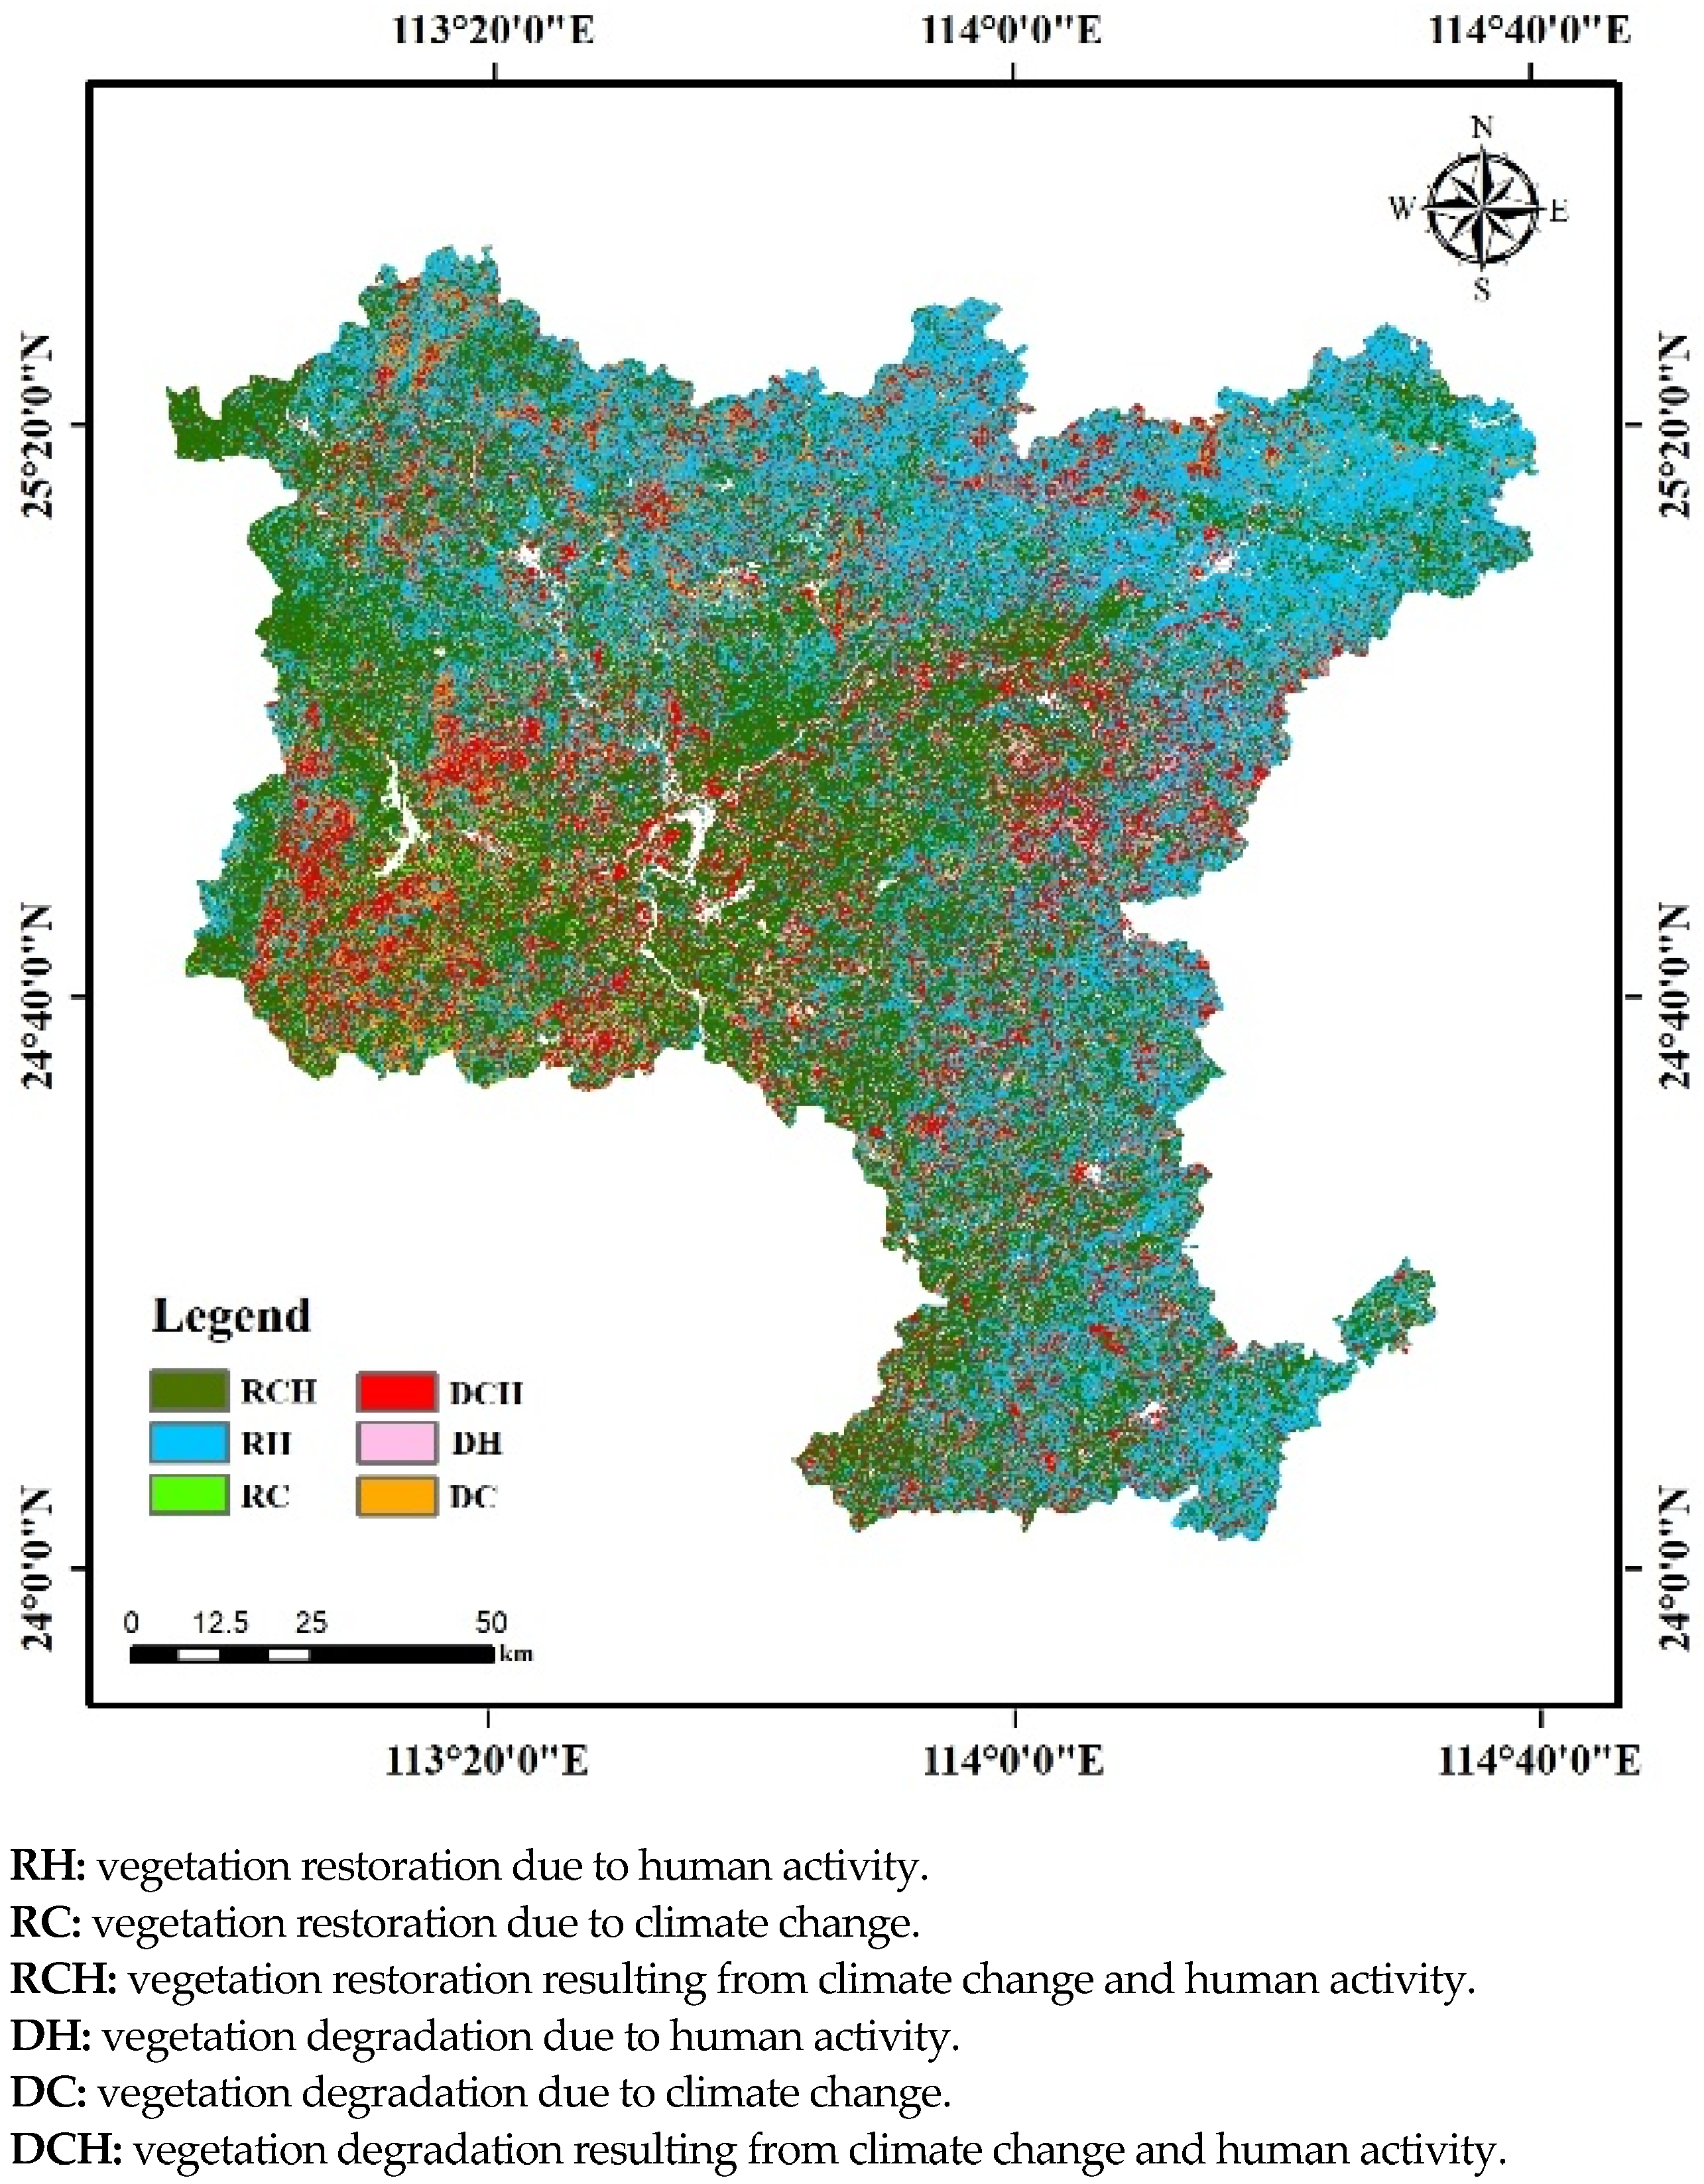
3.4. Vegetation Restoration and Degradation Affected by Climate and Human Drivers

The results suggest that the restoration of vegetation in Shaoguan was mainly influenced by human activities (Figure 9). From 2001 to 2020, human activities caused 34.94% of the total area of vegetation restoration (Table 4). In contrast, climate change restored only 1.37% of the vegetation. Moreover, 33.90% of the study area’s vegetation restoration can be attributed to the combined action of climate and human drivers (RCH), and the areas with more than half of the human contribution account for 91.45%. RCH was distributed in forest areas around farmland.
Furthermore, the combined action of climate and human drivers was an important driver of vegetation degradation (DCH), accounting for 19.26% of the research area. DCH was predominantly distributed in artificial forests and around construction land in the southwest and east-central regions. The effect of climate change on vegetation degradation was scattered, accounting for only 5.27% of the research region. Only 5.26% of vegetation degradation in the study area was associated with human activity.

4. Discussion

The accurate simulation of vegetation NPP is necessary for evaluating the carbon sequestration potential of ecosystems, especially in subtropical regions with rich vegetation resources, favorable climate conditions, and diverse ecological types. In this research, an enhanced CASA model based on the GF-SG algorithm was employed to accurately simulate the subtropical vegetation NPP in Shaoguan over the past 20 years. Climatic and human influences on NPP were then quantified using the RESTREND method.
Although there was a high correlation between the field observations and vegetation NPP estimated with the modified CASA model, there are still uncertainties, including the precision of the vegetation classification, the interpolation error of the weather station data, and the  ε m a x    differing from the actual situation and the model structure. In addition, although 46 field observations were available to validate the model, spatial resolution differences between ground biomass measurements and remotely sensed data may affect the accuracy of the model. For example, a 30 × 30 m pixel may contain both multiple vegetation types and non-vegetation types, whereas a field observation plot contains only a single vegetation type. Furthermore, the validation data type only covers forest-type data, resulting in some inaccuracies in the validation results of the model. Nonetheless, since forests make up 74.5% of the entire study area, our study concentrated on examining the effects of climate change and human activities on forest alterations. We delved into the specifics of forest ecosystem changes and potential management practices, aiming to generate effective strategies for conserving and managing forest resources. Combining the above results, we concluded that the enhanced CASA model has the potential to estimate vegetation NPP at high resolutions and can be used to analyze long-term dynamic changes in vegetation NPP.
The RESTREND method avoids the errors that result from simulating potential NPP with empirical formulas and obtains the contribution of a single driver related to climate change, so it is preferable to residual analysis methods [13]. However, the RESTREND method simply approximates human activity contribution to NPP ( C h ) as the residual of the NPP annual change rate and the climate change contribution and includes other factors affecting NPP (such as CO2 fertilization, nitrogen enrichment and deposition, ozone concentration, soil moisture, forest fires, pests, and diseases.) in  C h , which will lead to the overestimation or underestimation of human activity’s contribution to NPP [51]. It is, hence, imperative to more comprehensively consider the impact of other drivers on vegetation NPP in order to accurately assess the contributions of different drivers to vegetation NPP in future studies.
Generally, compared with climate change, human activity contributes more to vegetation restoration in Shaoguan, which is also consistent with previous studies [54]. Because Shaoguan belongs to the unique subtropical monsoon climate zone south of the Tropic of Cancer, with abundant precipitation throughout the year and high average annual temperatures, the weak climate change did not significantly affect vegetation growth. Therefore, the effect of climate change on vegetation NPP is not obvious. Meanwhile, the introduction of numerous ecological policies and artificial restoration measures, including GTGP (the Grain-to-Green Program) and soil and water conservation projects, will also promote the growth of vegetation NPP [55]. However, vegetation degradation is a combined result of climate change and human activities. Along with large-scale orchard reclamation, rapid urban expansion, and the deforestation of timber forests, a large amount of vegetation has been destroyed, and NPP has declined rapidly. In addition, excessive temperature will also inhibit vegetation photosynthesis and reduce vegetation NPP [56].
Although a multitude of ecological projects, especially GTGP and NFCP, were introduced in the early stages in Shaoguan, there are still some problems and deficiencies. First, as the ages of the trees increase, the NPP of these forests will also decline [57]. Secondly, early ecological projects often used unsuitable plant species or single tree species, resulting in poor-quality planted forests that are prone to ecosystem degradation [58]. Therefore, the sustainable growth of vegetation NPP and the optimization of ecosystem service function cannot be realized only by relying on early ecological projects, and new ecological restoration measures are still necessary for vegetation NPP growth. Depending on the results of monitoring and evaluating NPP changes in vegetation and drivers, different ecological measures are required. Suitable species, mixed afforestation, and intercropping should be used to improve forest quality and stability in areas with declining forest quality. For the areas where NPP is on the rise or at a high level, vegetation resources should be used rationally, the structure and function of forestry should be optimized, and the economic and social benefits of forestry should be improved. In addition, the long-term monitoring of and research on changes in NPP and its influencing factors should be strengthened in order to adjust and improve ecological measures in time and realize the coordinated development of NPP and ecosystem service functions in Shaoguan.

5. Conclusions

In this research, high-quality NPP data for Shaoguan from 2001 to 2020 were constructed with an enhanced CASA model based on the GF-SG algorithm. Climatic and anthropogenic impacts on vegetation changes were then evaluated using NPP as an index. The vegetation NPP of Shaoguan increased significantly (4.0 g C/m2/yr, p < 0.001) from 2001 to 2020. In addition, the interannual variation in vegetation NPP was positively impacted by climate factors, with SOL contributing most to vegetation NPP (0.668 g C/m2/yr). Furthermore, the contribution of human activity to vegetation NPP (3.137 g C/m2/yr) was more than three times that of climate change (0.948 g C/m2/yr) because Shaoguan is located in the southern subtropics, where the effects of weak climate change on vegetation NPP are not noticeable. Human activity was the main cause of vegetation restoration owing to ecological policies, while vegetation degradation was dominated by the combinations of human activity and climate change owing to urban sprawl, deforestation, and extreme weather disasters.

Author Contributions

Conceptualization, C.Z.; methodology, C.Z.; software, K.J.; validation, K.J.; formal analysis, C.Z.; investigation, B.Q. and Y.S.; resources, D.L. and H.Z.; data curation, B.Q.; writing—original draft preparation, C.Z.; writing—review and editing, S.C.; visualization, D.L. and Y.S.; supervision, S.C.; project administration, K.J. and H.Z.; funding acquisition, S.C. and B.Q. All authors have read and agreed to the published version of the manuscript.

Funding

This research was funded by the “Nanling Mountain Team Plan” (Double Carbon Spatial Big Data) Project 2022 of Shaoguan; the Guangdong Province Agricultural Science and Technology Innovation and Promotion Project (No. 2023KJ102); and the GDAS Project of Science and Technology Development (2022GDASZH-2022010202-003; 2022GDASZH-2022010102).

Data Availability Statement

No new data were created or analyzed in this study. Data sharing is not applicable to this article.

Acknowledgments

We thank the Platform for providing free data and the scholars who provided references.

Conflicts of Interest

The authors declare no conflict of interest. Authors Shuisen Chen, Kai Jia, Dan Li, Boxiong Qin and Hao Zhang were employed by the company Shaoguan ShenBay Low Carbon Digital Technology Co., Ltd. The remaining authors declare that the research was conducted in the absence of any commercial or financial relationships that could be construed as a potential conflict of interest. The Shaoguan ShenBay Low Carbon Digital Technology Co., Ltd. had no role in the design of the study; in the collection, analyses, or interpretation of data; in the writing of the manuscript, or in the decision to publish the results.

References

  1. Yuan, J.; Xu, Y.; Xiang, J.; Wu, L.; Wang, D. Spatiotemporal variation of vegetation coverage and its associated influence factor analysis in the Yangtze River Delta, eastern China. Environ. Sci. Pollut. Res. 2019, 26, 32866–32879. [Google Scholar] [CrossRef] [PubMed]
  2. Friedlingstein, P.; Jones, M.W.; O’Sullivan, M.; Andrew, R.M.; Bakker, D.C.E.; Hauck, J.; Le Quéré, C.; Peters, G.P.; Peters, W.; Pongratz, J.; et al. Global Carbon Budget 2021. Earth Syst. Sci. Data 2022, 14, 1917–2005. [Google Scholar] [CrossRef]
  3. Terrer, C.; Phillips, R.P.; Hungate, B.A.; Rosende, J.; Pett-Ridge, J.; Craig, M.E.; van Groenigen, K.J.; Keenan, T.F.; Sulman, B.N.; Stocker, B.D.; et al. A trade-off between plant and soil carbon storage under elevated CO2. Nature 2021, 591, 599–603. [Google Scholar] [CrossRef] [PubMed]
  4. Zhu, Q.; Zhao, J.; Zhu, Z.; Zhang, H.; Zhang, Z.; Guo, X.; Bi, Y.; Sun, L. Remotely Sensed Estimation of Net Primary Productivity (NPP) and Its Spatial and Temporal Variations in the Greater Khingan Mountain Region, China. Sustainability 2017, 9, 1213. [Google Scholar] [CrossRef]
  5. Teng, M.; Zeng, L.; Hu, W.; Wang, P.; Yan, Z.; He, W.; Zhang, Y.; Huang, Z.; Xiao, W. The impacts of climate changes and human activities on net primary productivity vary across an ecotone zone in Northwest China. Sci. Total Environ. 2020, 714, 136691. [Google Scholar] [CrossRef] [PubMed]
  6. Wang, T.; Yang, M.; Yan, S.; Geng, G.; Li, Q.; Wang, F. Effects of Temperature and Precipitation on Spatiotemporal Variations of Net Primary Productivity in the Qinling Mountains, China. Pol. J. Environ. Stud. 2021, 30, 409–422. [Google Scholar] [CrossRef]
  7. Yin, L.; Dai, E.; Zheng, D.; Wang, Y.; Ma, L.; Tong, M. What drives the vegetation dynamics in the Hengduan Mountain region, southwest China: Climate change or human activity? Ecol. Indic. 2020, 112, 106013. [Google Scholar] [CrossRef]
  8. Sullivan, P.F.; Arens, S.J.T.; Chimner, R.A.; Welker, J.M. Temperature and Microtopography Interact to Control Carbon Cycling in a High Arctic Fen. Ecosystems 2008, 11, 61–76. [Google Scholar] [CrossRef]
  9. Zhu, W.; Pan, Y.; Yang, X.; Song, G. Comprehensive analysis of the impact of climatic changes on Chinese terrestrial net primary productivity. Chin. Sci. Bull. 2007, 52, 3253–3260. [Google Scholar] [CrossRef]
  10. Yuan, Z.; Wang, Y.; Xu, J.; Wu, Z. Effects of climatic factors on the net primary productivity in the source region of Yangtze River, China. Sci. Rep. 2021, 11, 1376. [Google Scholar] [CrossRef]
  11. Saki, M.; Soltani, S.; Esfahani, M.T.; Jafari, R. Evaluating the variability of ANPP in central Iranian arid and semi-arid rangelands using CASA model and its relationship with climatic factors. Geosci. J. 2019, 23, 531–545. [Google Scholar] [CrossRef]
  12. Luo, Z.; Wu, W.; Yu, X.; Song, Q.; Yang, J.; Wu, J.; Zhang, H. Variation of Net Primary Production and Its Correlation with Climate Change and Anthropogenic Activities over the Tibetan Plateau. Remote Sens. 2018, 10, 1352. [Google Scholar] [CrossRef]
  13. Zhang, M.; Yuan, N.; Lin, H.; Liu, Y.; Zhang, H. Quantitative estimation of the factors impacting spatiotemporal variation in NPP in the Dongting Lake wetlands using Landsat time series data for the last two decades. Ecol. Indic. 2022, 135, 108544. [Google Scholar] [CrossRef]
  14. Zhang, J.; Hao, X.; Hao, H.; Fan, X.; Li, Y. Climate Change Decreased Net Ecosystem Productivity in the Arid Region of Central Asia. Remote Sens. 2021, 13, 4449. [Google Scholar] [CrossRef]
  15. Nemani, R.R.; Keeling, C.D.; Hashimoto, H.; Jolly, W.M.; Piper, S.C.; Tucker, C.J.; Myneni, R.B.; Running, S.W. Climate-Driven Increases in Global Terrestrial Net Primary Production from 1982 to 1999. Science 2003, 300, 1560–1563. [Google Scholar] [CrossRef] [PubMed]
  16. Chen, S.; Jiang, H.; Cai, Z.; Zhou, X.; Peng, C. The response of the net primary production of Moso bamboo forest to the on and off-year management: A case study in Anji County, Zhejiang, China. For. Ecol. Manag. 2018, 409, 1–7. [Google Scholar] [CrossRef]
  17. Li, H.; Ding, J.; Zhang, J.; Yang, Z.; Yang, B.; Zhu, Q.; Peng, C. Effects of Land Cover Changes on Net Primary Productivity in the Terrestrial Ecosystems of China from 2001 to 2012. Land 2020, 9, 480. [Google Scholar] [CrossRef]
  18. Liu, X.; Pei, F.; Wen, Y.; Li, X.; Wang, S.; Wu, C.; Cai, Y.; Wu, J.; Chen, J.; Feng, K.; et al. Global urban expansion offsets climate-driven increases in terrestrial net primary productivity. Nat. Commun. 2019, 10, 5558. [Google Scholar] [CrossRef]
  19. Wu, Y.; Luo, Z.; Wu, Z. The Different Impacts of Climate Variability and Human Activities on NPP in the Guangdong & Hong Kong & Macao Greater Bay Area. Remote Sens. 2022, 14, 2929. [Google Scholar]
  20. Sha, Z.; Bai, Y.; Li, R.; Lan, H.; Zhang, X.; Li, J.; Liu, X.; Chang, S.; Xie, Y. The global carbon sink potential of terrestrial vegetation can be increased substantially by optimal land management. Commun. Earth Environ. 2022, 3, 8. [Google Scholar] [CrossRef]
  21. Li, C.; Dou, T.; Wang, Y.; Zhu, T.; Yin, H.; Zhou, M.; Liu, L.; Wu, X. A Method for Quantifying the Impacts of Human Activities on Net Primary Production of Grasslands in Northwest China. Remote Sens. 2021, 13, 2479. [Google Scholar] [CrossRef]
  22. Wang, H.; Liu, G.; Li, Z.; Wang, P.; Wang, Z. Comparative Assessment of Vegetation Dynamics under the Influence of Climate Change and Human Activities in Five Ecologically Vulnerable Regions of China from 2000 to 2015. Forests 2019, 10, 317. [Google Scholar] [CrossRef]
  23. Wang, J.; Delang, C.O.; Hou, G.; Gao, L.; Lu, X. Net primary production increases in the Yangtze River Basin within the latest two decades. Glob. Ecol. Conserv. 2021, 26, e01497. [Google Scholar] [CrossRef]
  24. Baeza, S.; Paruelo, J.M. Spatial and temporal variation of human appropriation of net primary production in the Rio de la Plata grasslands. ISPRS J. Photogramm. Remote Sens. 2018, 145, 238–249. [Google Scholar] [CrossRef]
  25. Bandaru, V.; West, T.O.; Ricciuto, D.M.; César Izaurralde, R. Estimating crop net primary production using national inventory data and MODIS-derived parameters. ISPRS J. Photogramm. Remote Sens. 2013, 80, 61–71. [Google Scholar] [CrossRef]
  26. Ruimy, A.; Saugier, B.; Dedieu, G. Methodology for the estimation of terrestrial net primary production from remotely sensed data. J. Geophys. Res. Atmos. 1994, 99, 5263–5283. [Google Scholar] [CrossRef]
  27. Cao, S.; Sanchez-Azofeifa, G.A.; Duran, S.M.; Calvo-Rodriguez, S. Estimation of aboveground net primary productivity in secondary tropical dry forests using the Carnegie–Ames–Stanford approach (CASA) model. Environ. Res. Lett. 2016, 11, 075004. [Google Scholar] [CrossRef]
  28. Yan, Y.; Wu, C.; Wen, Y. Determining the impacts of climate change and urban expansion on net primary productivity using the spatio-temporal fusion of remote sensing data. Ecol. Indic. 2021, 127, 107737. [Google Scholar] [CrossRef]
  29. Wu, S.; Zhou, S.; Chen, D.; Wei, Z.; Dai, L.; Li, X. Determining the contributions of urbanisation and climate change to NPP variations over the last decade in the Yangtze River Delta, China. Sci. Total Environ. 2014, 472, 397–406. [Google Scholar] [CrossRef]
  30. Bian, J.; Li, A.; Deng, W. Estimation and analysis of net primary Productivity of Ruoergai wetland in China for the recent 10 years based on remote sensing. Procedia Environ. Sci. 2010, 2, 288–301. [Google Scholar] [CrossRef]
  31. Gao, Q.; Wan, Y.; Li, Y.; Guo, Y.; Ganjurjav; Qin, X.; Jiangcun, W.; Wang, B. Effects of topography and human activity on the net primary productivity (NPP) of alpine grassland in northern Tibet from 1981 to 2004. Int. J. Remote Sens. 2013, 34, 2057–2069. [Google Scholar] [CrossRef]
  32. Liu, H.; Zhang, A.; Liu, C.; Zhao, Y.; Zhao, A.; Wang, D. Analysis of the time-lag effects of climate factors on grassland productivity in Inner Mongolia. Glob. Ecol. Conserv. 2021, 30, e01751. [Google Scholar] [CrossRef]
  33. Yan, Y.; Liu, X.; Wang, F.; Li, X.; Ou, J.; Wen, Y.; Liang, X. Assessing the impacts of urban sprawl on net primary productivity using fusion of Landsat and MODIS data. Sci. Total Environ. 2018, 613–614, 1417–1429. [Google Scholar] [CrossRef] [PubMed]
  34. Qu, S.; Wang, L.; Lin, A.; Yu, D.; Yuan, M.; Li, C. Distinguishing the impacts of climate change and anthropogenic factors on vegetation dynamics in the Yangtze River Basin, China. Ecol. Indic. 2020, 108, 105724. [Google Scholar] [CrossRef]
  35. Liu, X.; Trogisch, S.; He, J.-S.; Niklaus, P.A.; Bruelheide, H.; Tang, Z.; Erfmeier, A.; Scherer-Lorenzen, M.; Pietsch, K.A.; Yang, B.; et al. Tree species richness increases ecosystem carbon storage in subtropical forests. Proc. R. Soc. B Biol. Sci. 2018, 285, 20181240. [Google Scholar]
  36. Chen, X.; Wu, D.; Huang, X.; Lv, F.; Brenner, M.; Jin, H.; Chen, F. Vegetation response in subtropical southwest China to rapid climate change during the Younger Dryas. Earth-Sci. Rev. 2020, 201, 103080. [Google Scholar] [CrossRef]
  37. Markham, B.L.; Storey, J.C.; Williams, D.L.; Irons, J.R. Landsat sensor performance: History and current status. IEEE Trans. Geosci. Remote Sens. 2004, 42, 2691–2694. [Google Scholar] [CrossRef]
  38. Wang, X.; Zhong, L.; Ma, Y. Estimation of 30 m land surface temperatures over the entire Tibetan Plateau based on Landsat-7 ETM+ data and machine learning methods. Int. J. Digit. Earth 2022, 15, 1038–1055. [Google Scholar] [CrossRef]
  39. Pan, X.; Wang, Z.; Gao, Y.; Dang, X.; Han, Y. Detailed and automated classification of land use/land cover using machine learning algorithms in Google Earth Engine. Geocarto Int. 2022, 37, 5415–5432. [Google Scholar] [CrossRef]
  40. Yu, C.; Wang, B.; Liu, H.; Yang, X.; Xiu, Z. Dynamic change of net production and mean net primary productivity of China’s forests. For. Res. 2014, 27, 542–550. [Google Scholar]
  41. Chen, Y.; Cao, R.; Chen, J.; Liu, L.; Matsushita, B. A practical approach to reconstruct high-quality Landsat NDVI time-series data by gap filling and the Savitzky–Golay filter. ISPRS J. Photogramm. Remote Sens. 2021, 180, 174–190. [Google Scholar] [CrossRef]
  42. Potter, C.S.; Randerson, J.T.; Field, C.B.; Matson, P.A.; Vitousek, P.M.; Mooney, H.A.; Klooster, S.A. Terrestrial ecosystem production: A process model based on global satellite and surface data. Global Biogeochem. Cycles 1993, 7, 811–841. [Google Scholar] [CrossRef]
  43. Field, C.B.; Randerson, J.T.; Malmström, C.M. Global net primary production: Combining ecology and remote sensing. Remote Sens. Environ. 1995, 51, 74–88. [Google Scholar] [CrossRef]
  44. Zang, H.; Xu, Q.; Bian, H. Generation of typical solar radiation data for different climates of China. Energy 2012, 38, 236–248. [Google Scholar] [CrossRef]
  45. Almorox, J. Estimating global solar radiation from common meteorological data in Aranjuez, Spain. Turk. J. Phys. 2011, 35, 53–64. [Google Scholar] [CrossRef]
  46. Huang, X.; He, L.; He, Z.; Nan, X.; Lyu, P.; Ye, H. An improved Carnegie-Ames-Stanford Approach model for estimating ecological carbon sequestration in mountain vegetation. Front. Ecol. Evol. 2022, 10, 1048607. [Google Scholar] [CrossRef]
  47. Zhu, W.; Pan, Y.; He, H.; Yu, D.; Hu, H. Simulation of maximum light use efficiency for some typical vegetation types in China. Chin. Sci. Bull. 2006, 51, 457–463. [Google Scholar] [CrossRef]
  48. Peng, S.; Guo, Z.; Wang, B. Use of GIS and RS to estimate the light utilization efficiency of the vegetation in Guangdong, China. Acta Ecol. Sin. 2000, 20, 903–909. [Google Scholar]
  49. Running, S.W.; Hunt, E.R. 8—Generalization of a Forest Ecosystem Process Model for Other Biomes, BIOME-BGC, and an Application for Global-Scale Models. In Scaling Physiological Processes; Ehleringer, J.R., Field, C.B., Eds.; Academic Press: San Diego, CA, USA, 1993; pp. 141–158. [Google Scholar]
  50. Wang, Y.B.; Zhao, Y.H.; Han, L.; Ao, Y. Spatiotemporal variation of vegetation net primary productivity and its driving factors from 2000 to 2015 in Qinling-Daba Mountains, China. Ying Yong Sheng Tai Xue Bao = J. Appl. Ecol. 2018, 29, 2373–2381. [Google Scholar]
  51. Jiang, Y.; Guo, J.; Peng, Q.; Guan, Y.; Zhang, Y.; Zhang, R. The effects of climate factors and human activities on net primary productivity in Xinjiang. Int. J. Biometeorol. 2020, 64, 765–777. [Google Scholar] [CrossRef]
  52. Yan, Y.; Liu, X.; Wen, Y.; Ou, J. Quantitative analysis of the contributions of climatic and human factors to grassland productivity in northern China. Ecol. Indic. 2019, 103, 542–553. [Google Scholar] [CrossRef]
  53. Chen, J.; Fan, W.; Li, D.; Liu, X.; Song, M. Driving factors of global carbon footprint pressure: Based on vegetation carbon sequestration. Appl. Energy 2020, 267, 114914. [Google Scholar] [CrossRef]
  54. Wu, Y.; Wu, Z. NPP Variability Associated with Natural and Anthropogenic Factors in the Tropic of Cancer Transect, China. Remote Sens. 2023, 15, 1091. [Google Scholar] [CrossRef]
  55. Kong, R.; Zhang, Z.; Zhang, F.; Tian, J.; Chang, J.; Jiang, S.; Zhu, B.; Chen, X. Increasing carbon storage in subtropical forests over the Yangtze River basin and its relations to the major ecological projects. Sci. Total Environ. 2020, 709, 136163. [Google Scholar] [CrossRef]
  56. Yan, W.; He, Y.; Cai, Y.; Qu, X.; Cui, X. Relationship between extreme climate indices and spatiotemporal changes of vegetation on Yunnan Plateau from 1982 to 2019. Glob. Ecol. Conserv. 2021, 31, e01813. [Google Scholar] [CrossRef]
  57. Jiang, M.; Medlyn, B.E.; Drake, J.E.; Duursma, R.A.; Anderson, I.C.; Barton, C.V.M.; Boer, M.M.; Carrillo, Y.; Castañeda-Gómez, L.; Collins, L.; et al. The fate of carbon in a mature forest under carbon dioxide enrichment. Nature 2020, 580, 227–231. [Google Scholar] [CrossRef]
  58. Cao, S.; Chen, L.; Yu, X. Impact of China’s Grain for Green Project on the landscape of vulnerable arid and semi-arid agricultural regions: A case study in northern Shaanxi Province. J. Appl. Ecol. 2009, 46, 536–543. [Google Scholar] [CrossRef]
Figure 1. Flowchart of NPP simulation and spatiotemporal dynamics analysis.
Forests 14 02447 g001
Figure 2. The spatial location of Shaoguan and LULC. EBF: evergreen broadleaf forest; DBF: deciduous broadleaf forest; ENF: evergreen needleleaf forest.
Forests 14 02447 g002
Figure 3. Correlation between the observations and the corresponding estimated vegetation NPP (46 field sampling sites).
Forests 14 02447 g003
Figure 4. Spatial distribution pattern of the average annual vegetation NPP in Shaoguan from 2001 to 2020.
Forests 14 02447 g004
Figure 5. Interannual variation trends in vegetation NPP in Shaoguan from 2001 to 2020.
Forests 14 02447 g005
Figure 6. Interannual trend (a) and MK test results (b) for vegetation NPP in Shaoguan from 2001 to 2020. Definitions of the significance level codes are listed in Table 1.
Forests 14 02447 g006
Figure 7. Climatic (a) and human (b) contribution to NPP dynamics in Shaoguan.
Forests 14 02447 g007
Figure 8. The impacts of temperature (a), precipitation (b), and SOL (c) on vegetation NPP dynamics in Shaoguan.
Forests 14 02447 g008
Figure 9. Spatial distribution of different vegetation dynamics scenarios in Shaoguan.
Forests 14 02447 g009
Table 1. Classification of NPP trend.
LevelDescriptionK|F|
1LD<0[2.58, ∞)
2MD(1.96, 2.58)
3SD(0, 1.96)
4LI>0[2.58, ∞)
5MI(1.96, 2.58)
6SI(0, 1.96)
LD: large decrease; MD: moderate decrease; SD: slight decrease; LI: large increase; MI: moderate increase; SI: slight increase.
Table 2. Drivers of vegetation restoration and degradation: identification criterion and contributions.
KNPPCcChContribution Rate (%)Description
Climate ChangeHuman Activity
>0<0>00100RH
>0>0<01000RC
>0>0>0   K P K P + K H × 100   K H K P + K H × 100 RCH
<0>0<00100DH
<0<0>01000DC
<0<0<0   K P K P + K H × 100   K H K P + K H × 100 DCH
RH: vegetation restoration due to human activity. RC: vegetation restoration due to climate change. RCH: vegetation restoration due to climate change and human activity. DH: vegetation degradation due to human activity. DC: vegetation degradation due to climate change. DCH: vegetation degradation due to climate change and human activity.
Table 3. Climatic and human contributions to NPP dynamics.
TypeContribution (g C/m2/yr)Total (g C/m2/yr)
Climate changeTemperature0.0040.948
Precipitation0.276
SOL0.668
Human activity/3.1373.137
Table 4. Percentage contributions of different drivers of vegetation dynamics.
Vegetation DynamicDriversContribution (%)
Vegetation restorationClimate change (RC)1.37
Human activity (RH)34.94
Combined action (RCH)33.90
Vegetation degradationClimate change (DC)5.27
Human activity (DH)5.26
Combined action (DCH)19.26
Disclaimer/Publisher’s Note: The statements, opinions and data contained in all publications are solely those of the individual author(s) and contributor(s) and not of MDPI and/or the editor(s). MDPI and/or the editor(s) disclaim responsibility for any injury to people or property resulting from any ideas, methods, instructions or products referred to in the content.

