
Benchmark for Automatic Clear-Cut Morphology Detection Methods Derived from Airborne Lidar Data


Abstract
1. Introduction
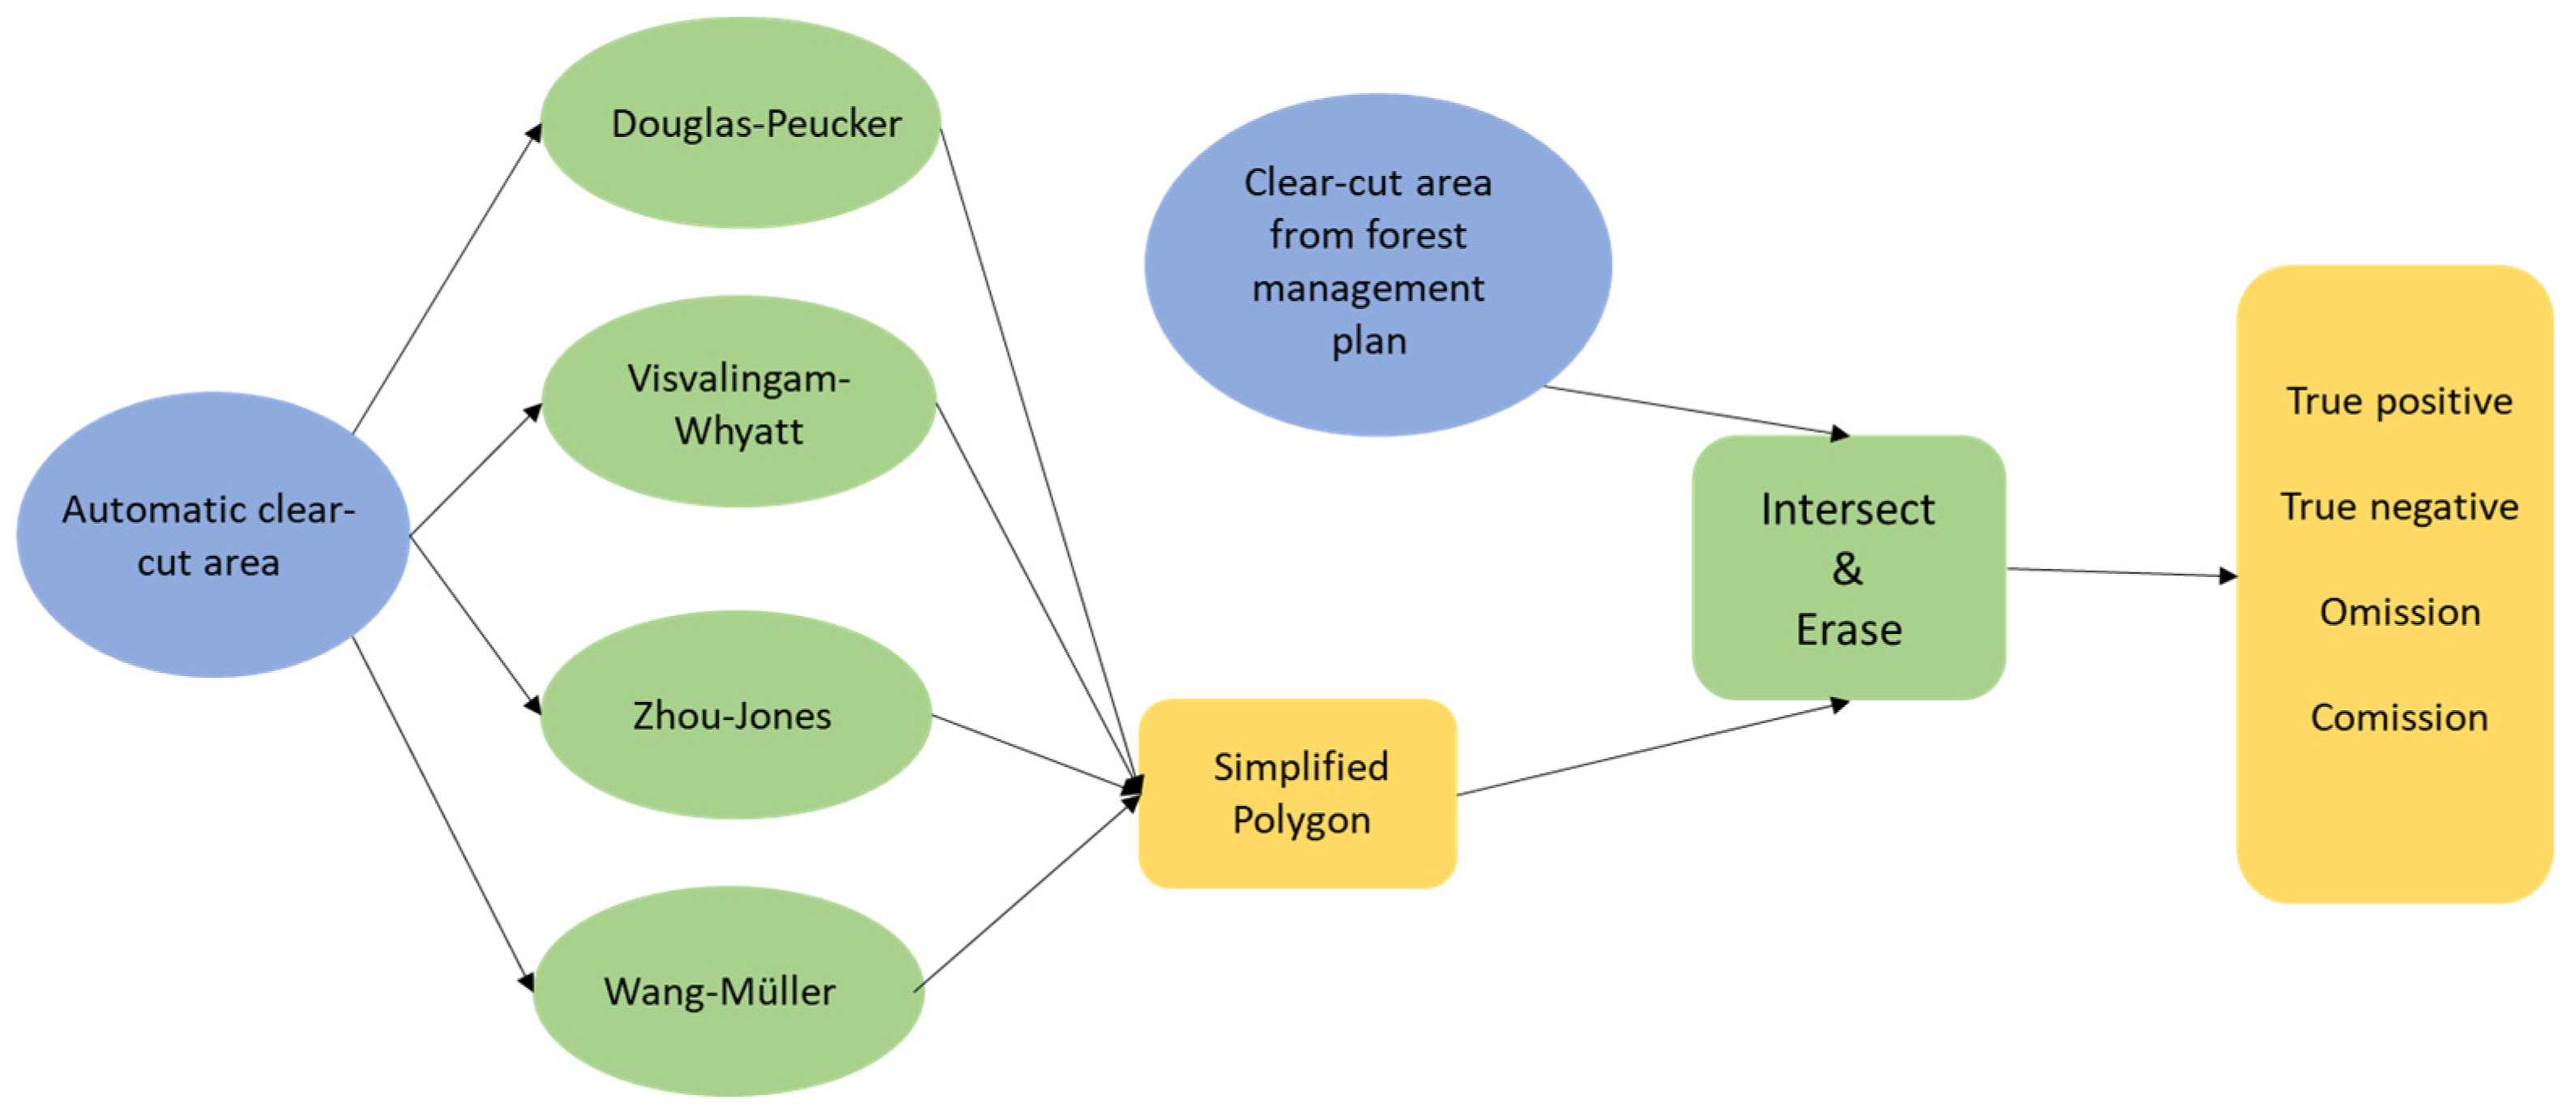
2. Materials and Methods
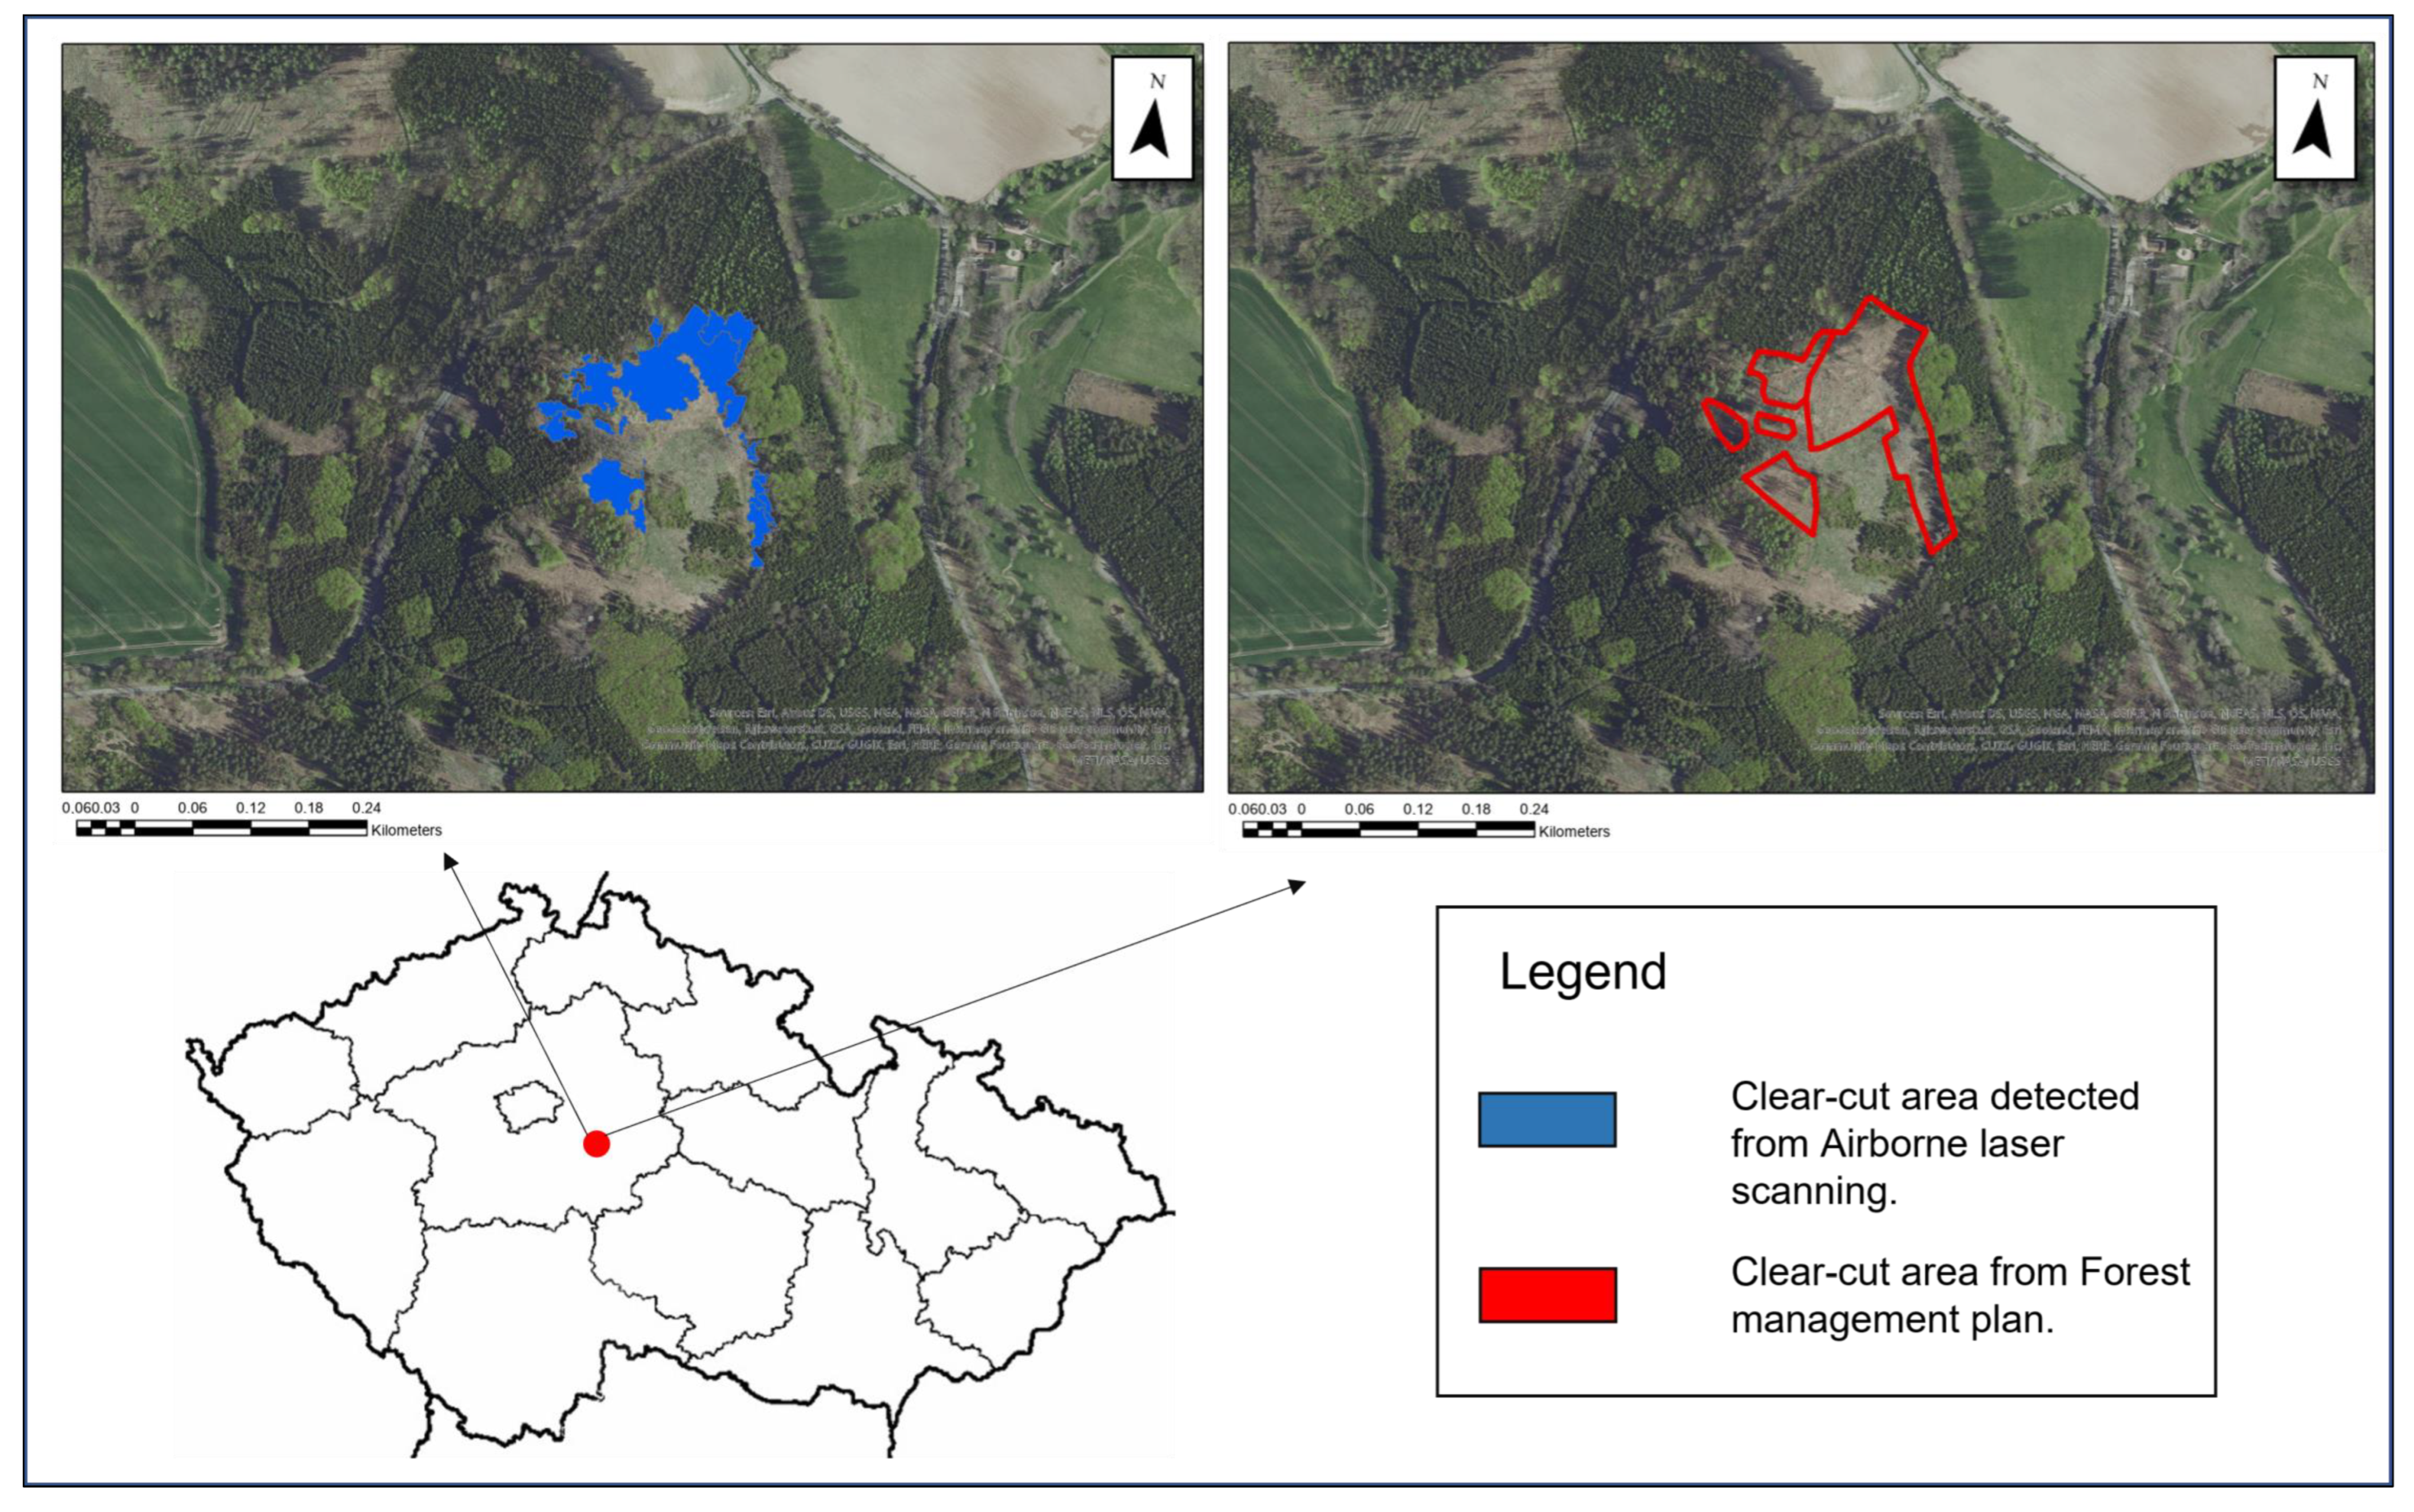
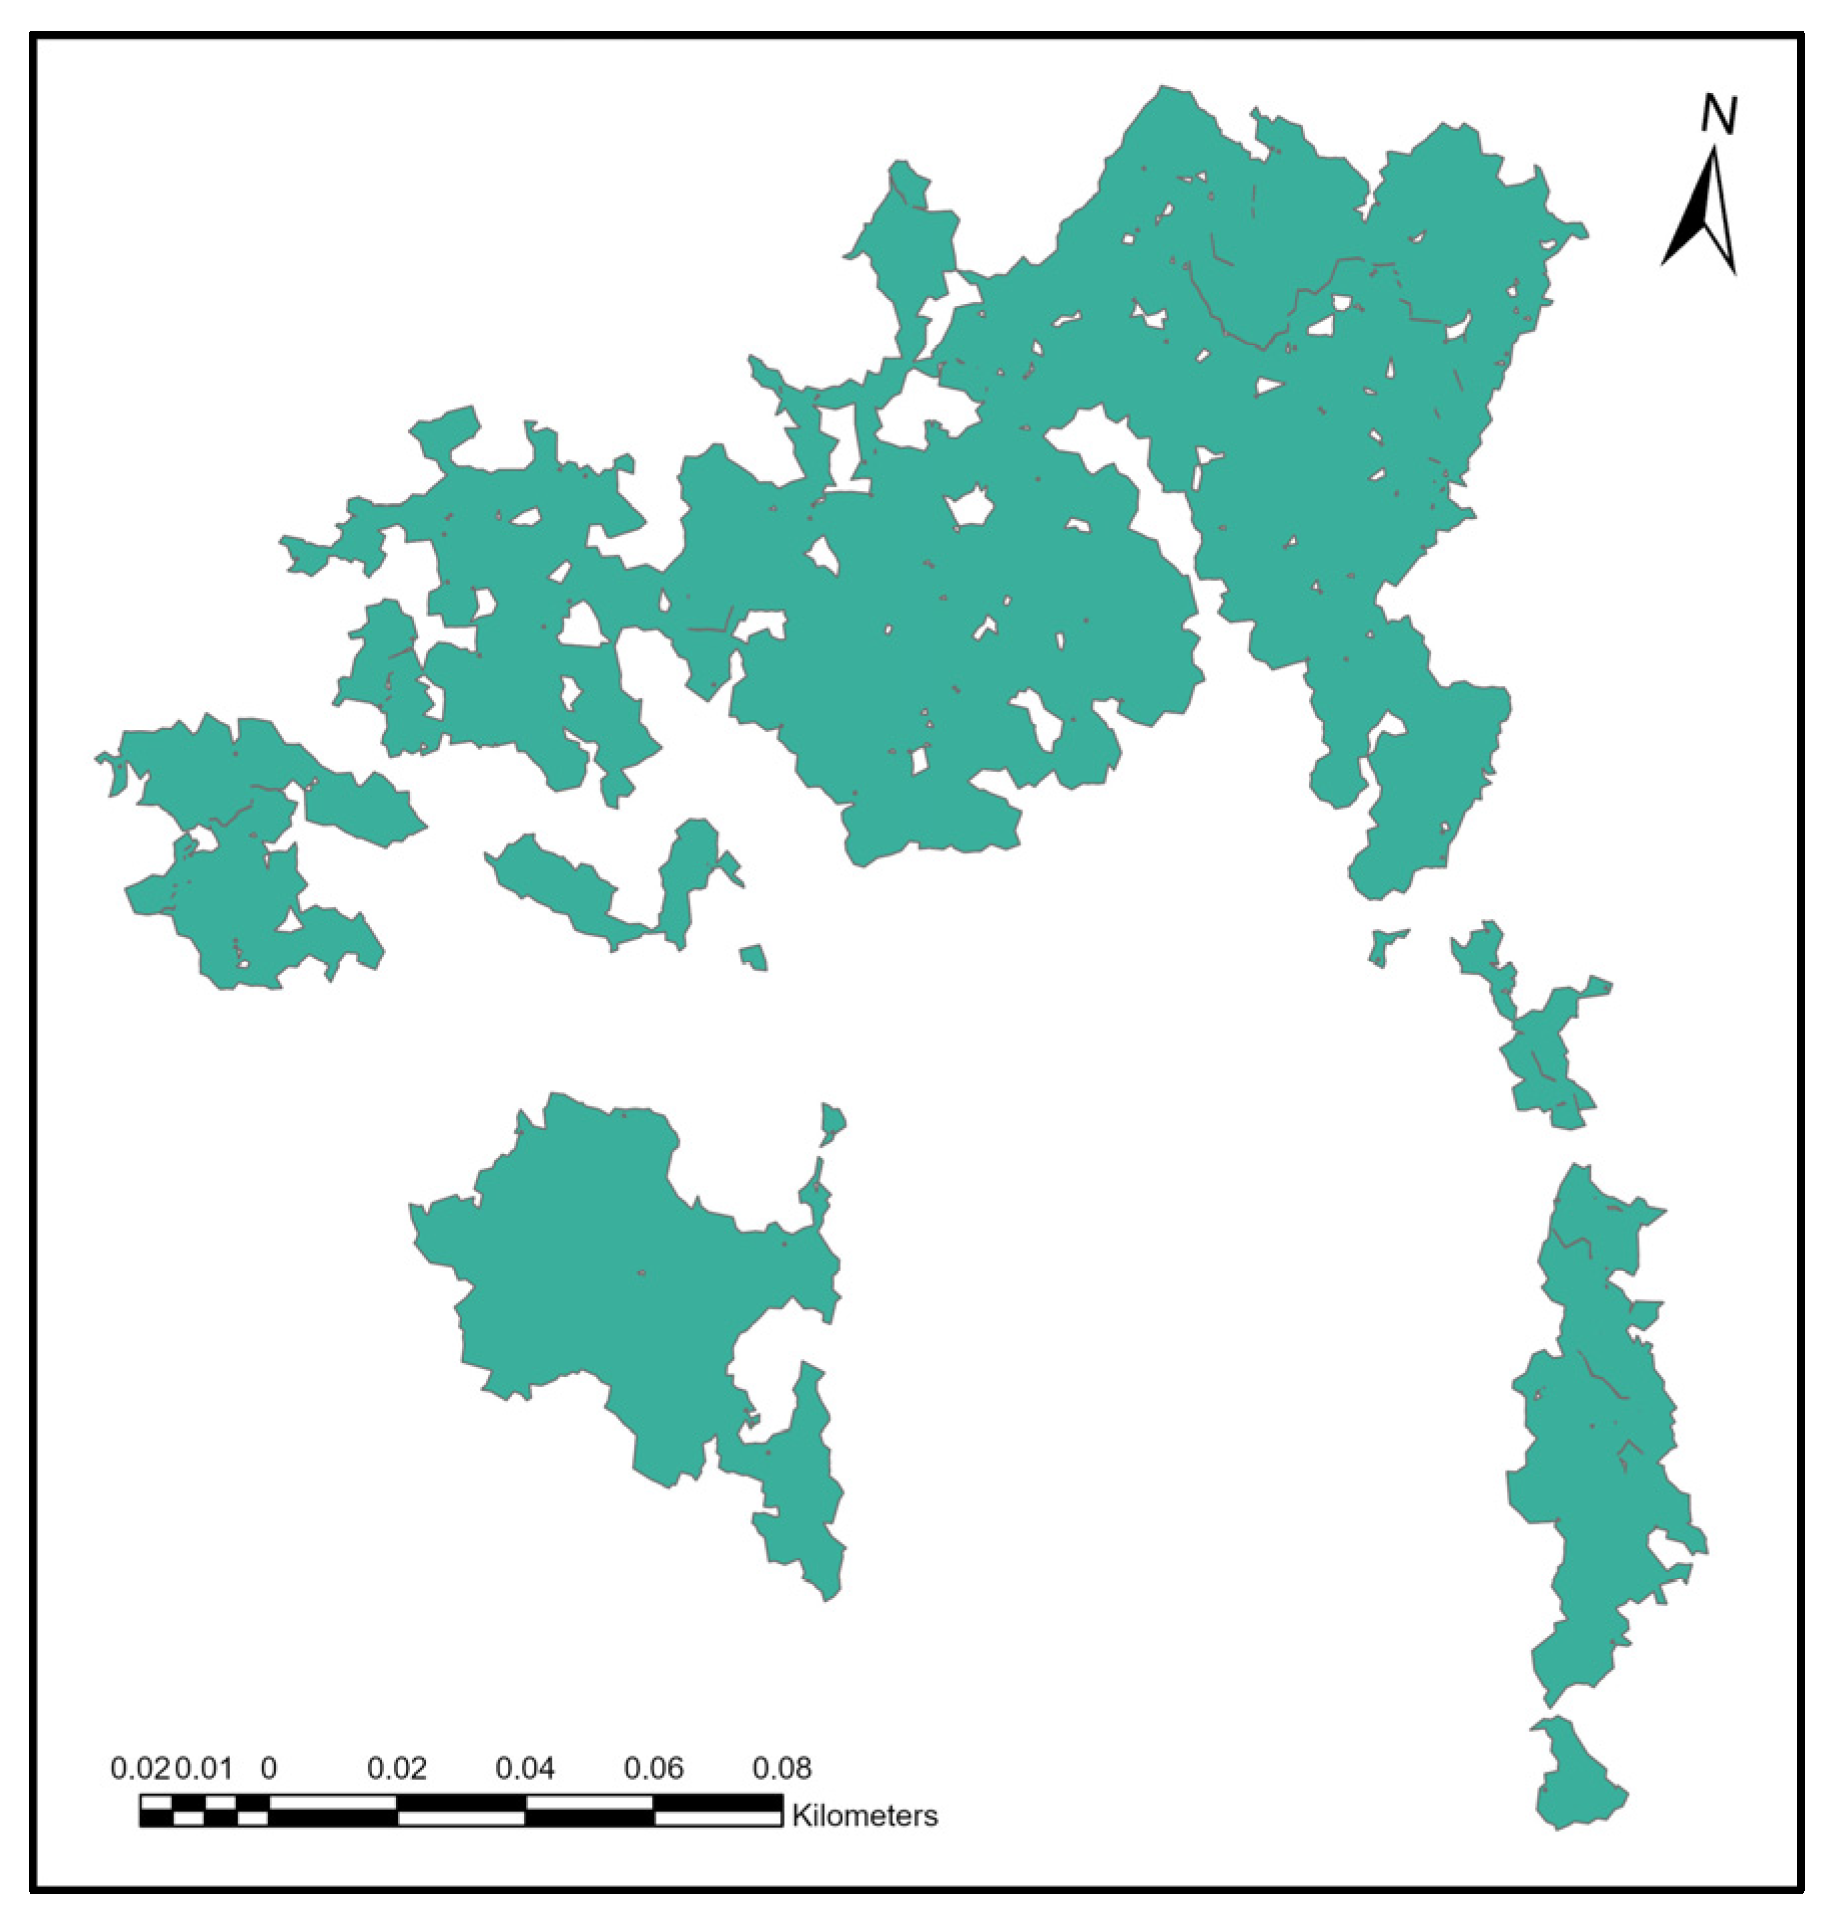
2.1. Study Site
2.2. Data Processing
Rasterization
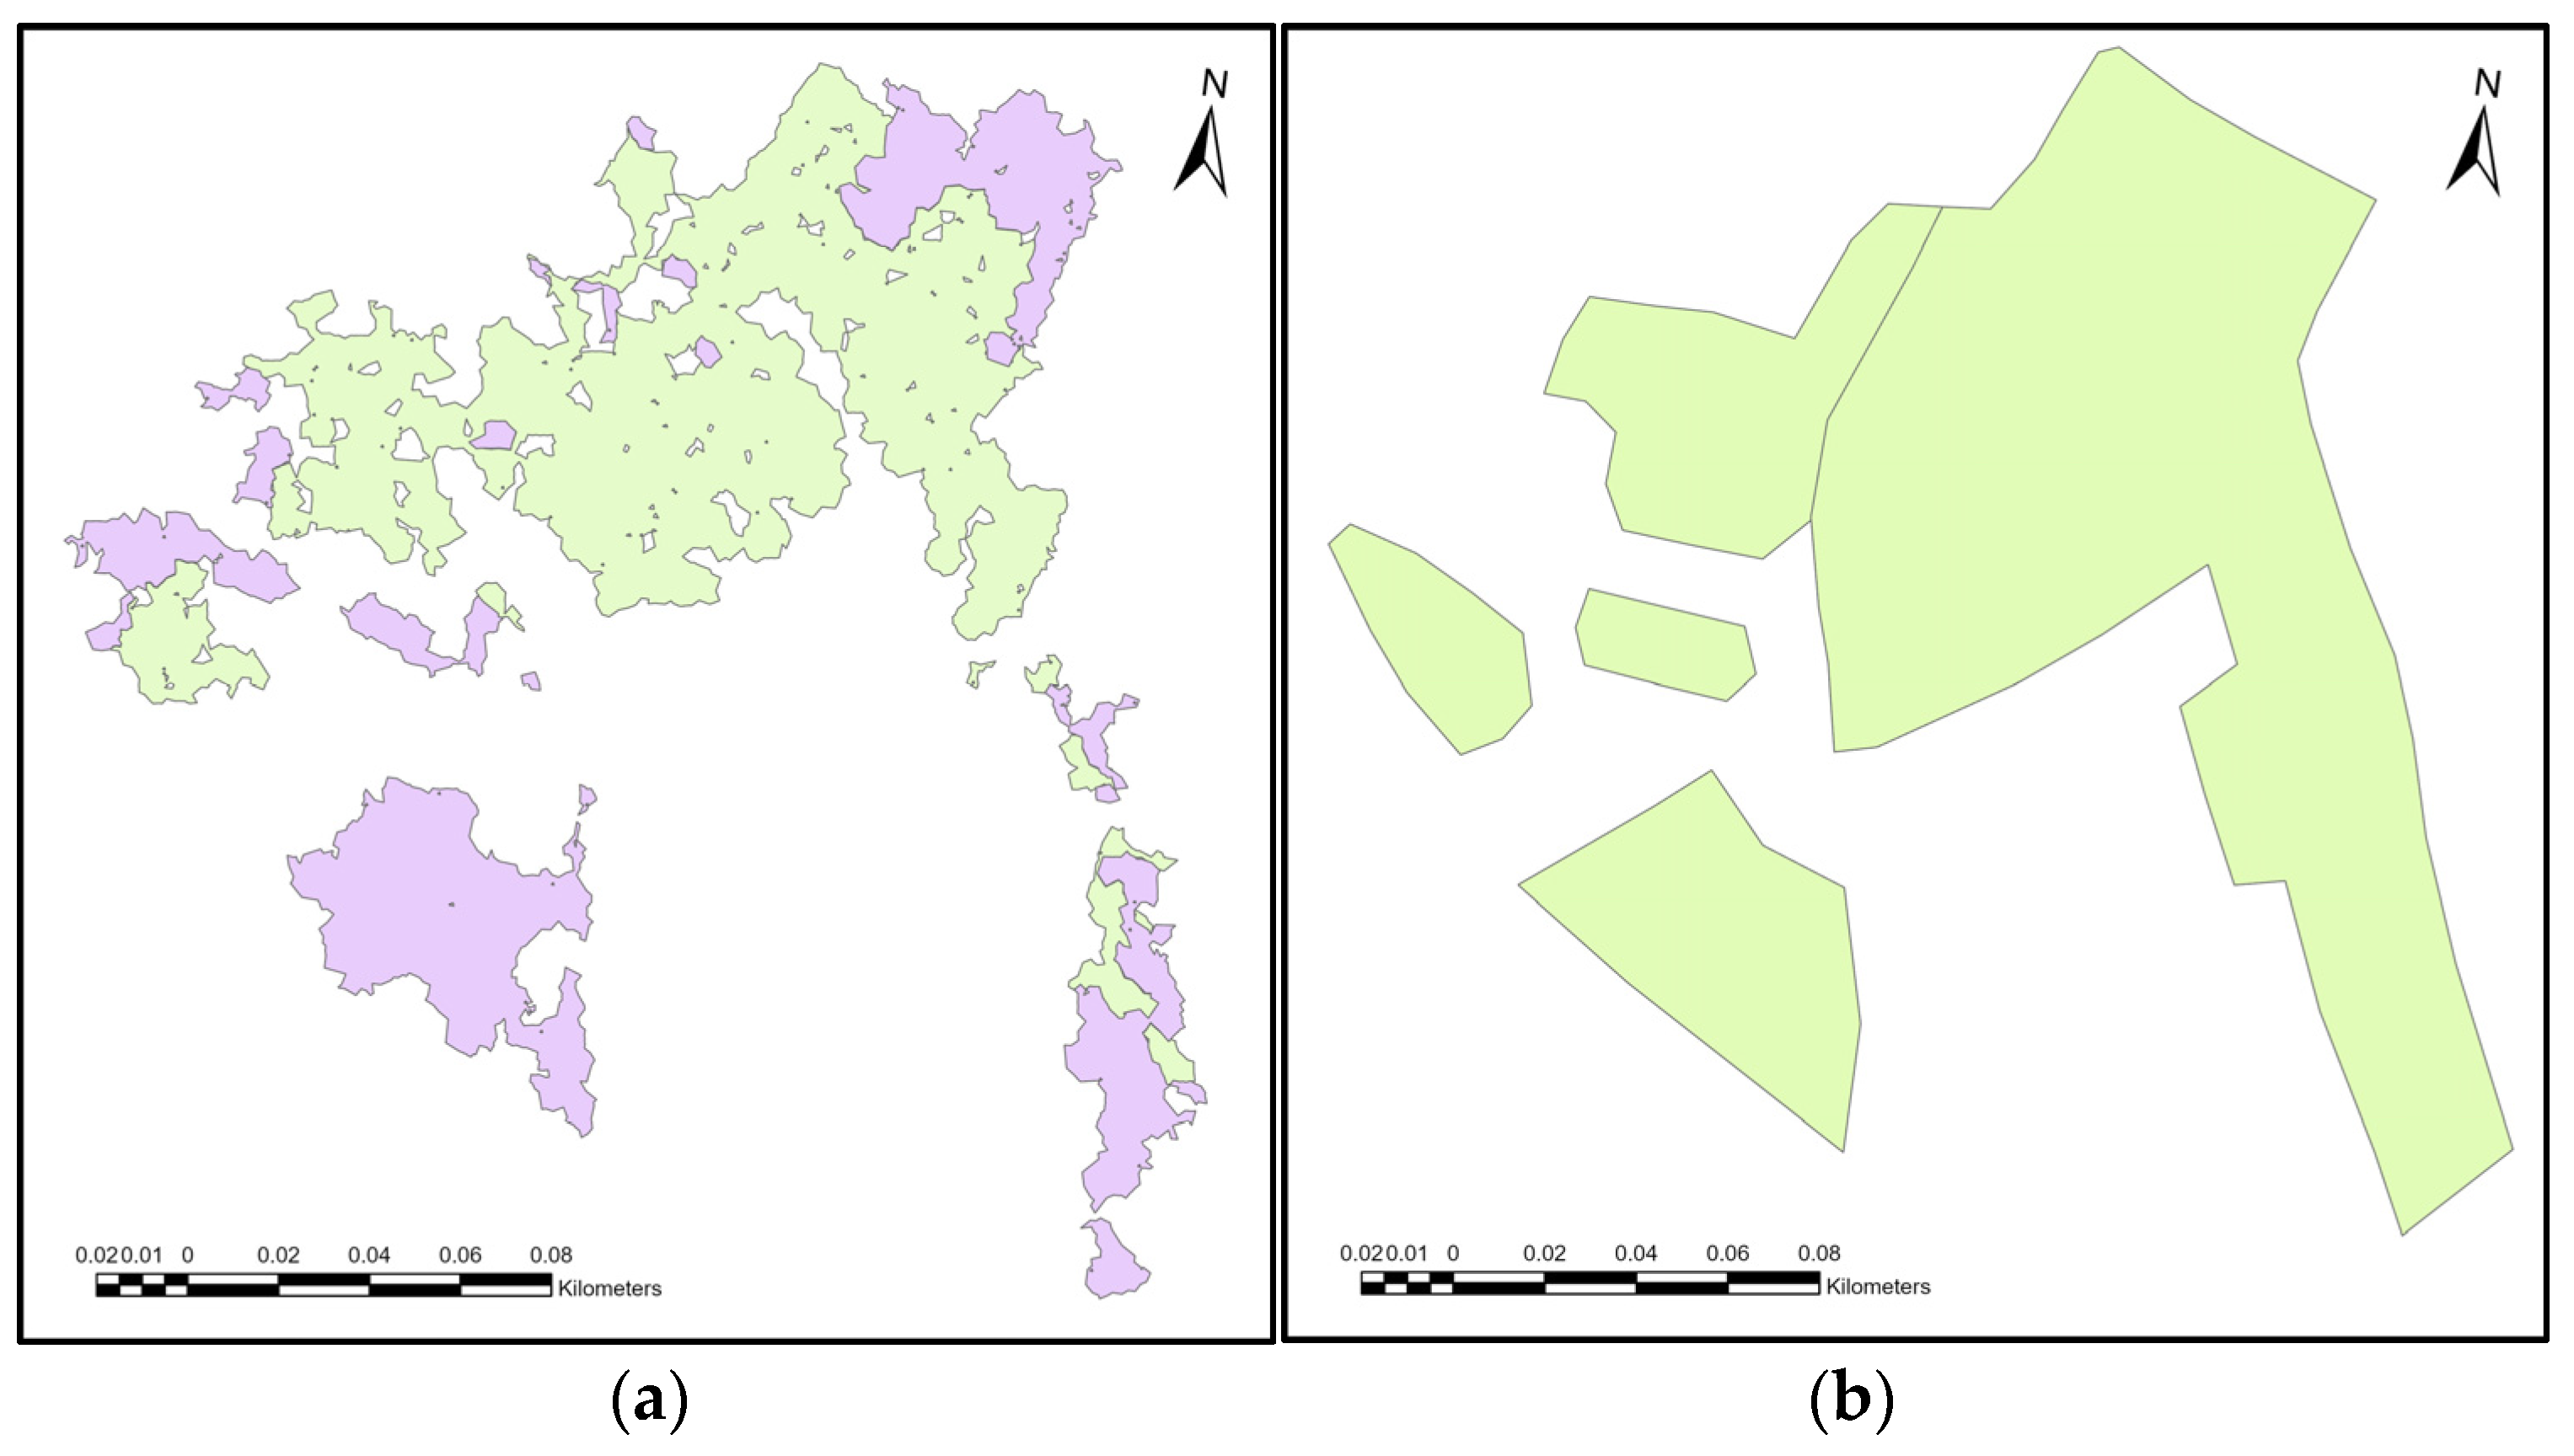
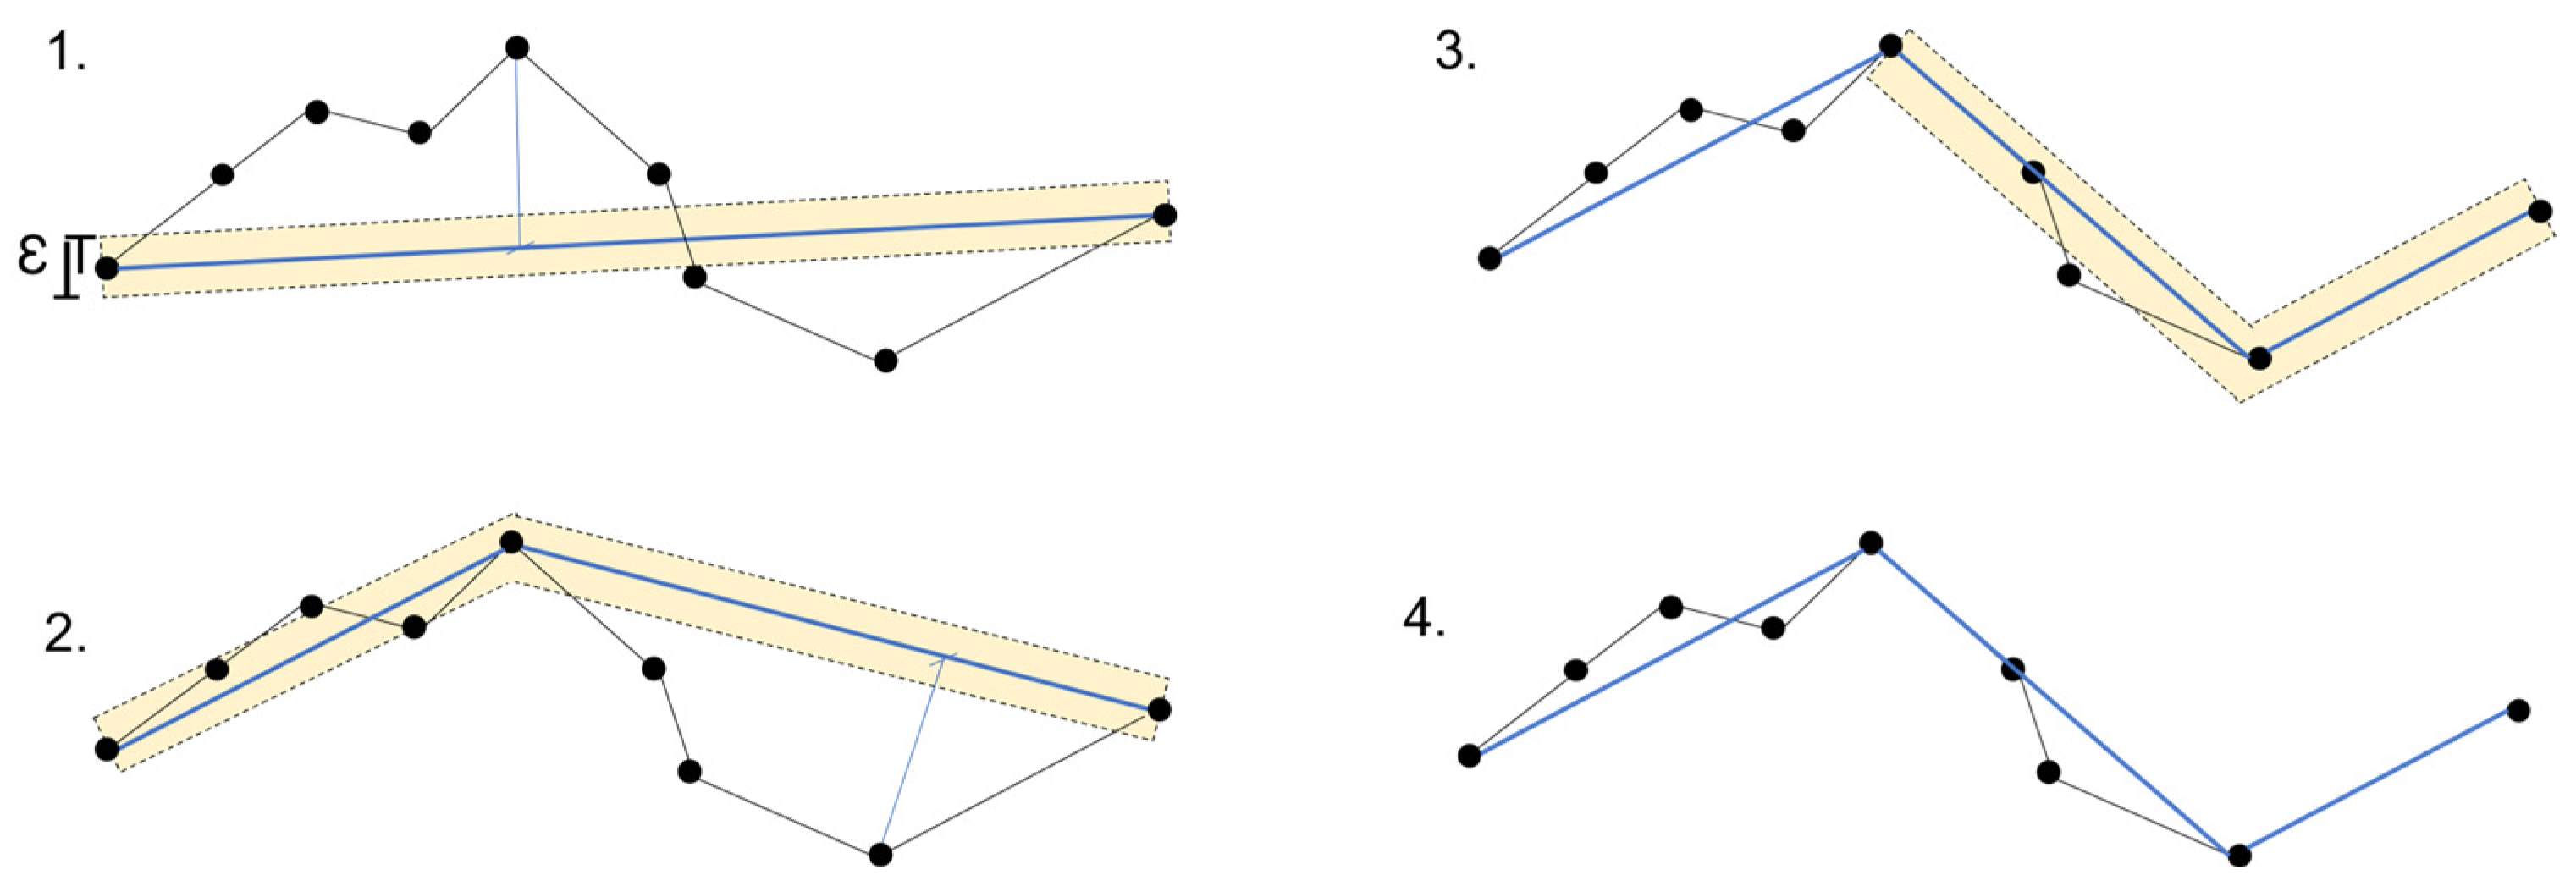
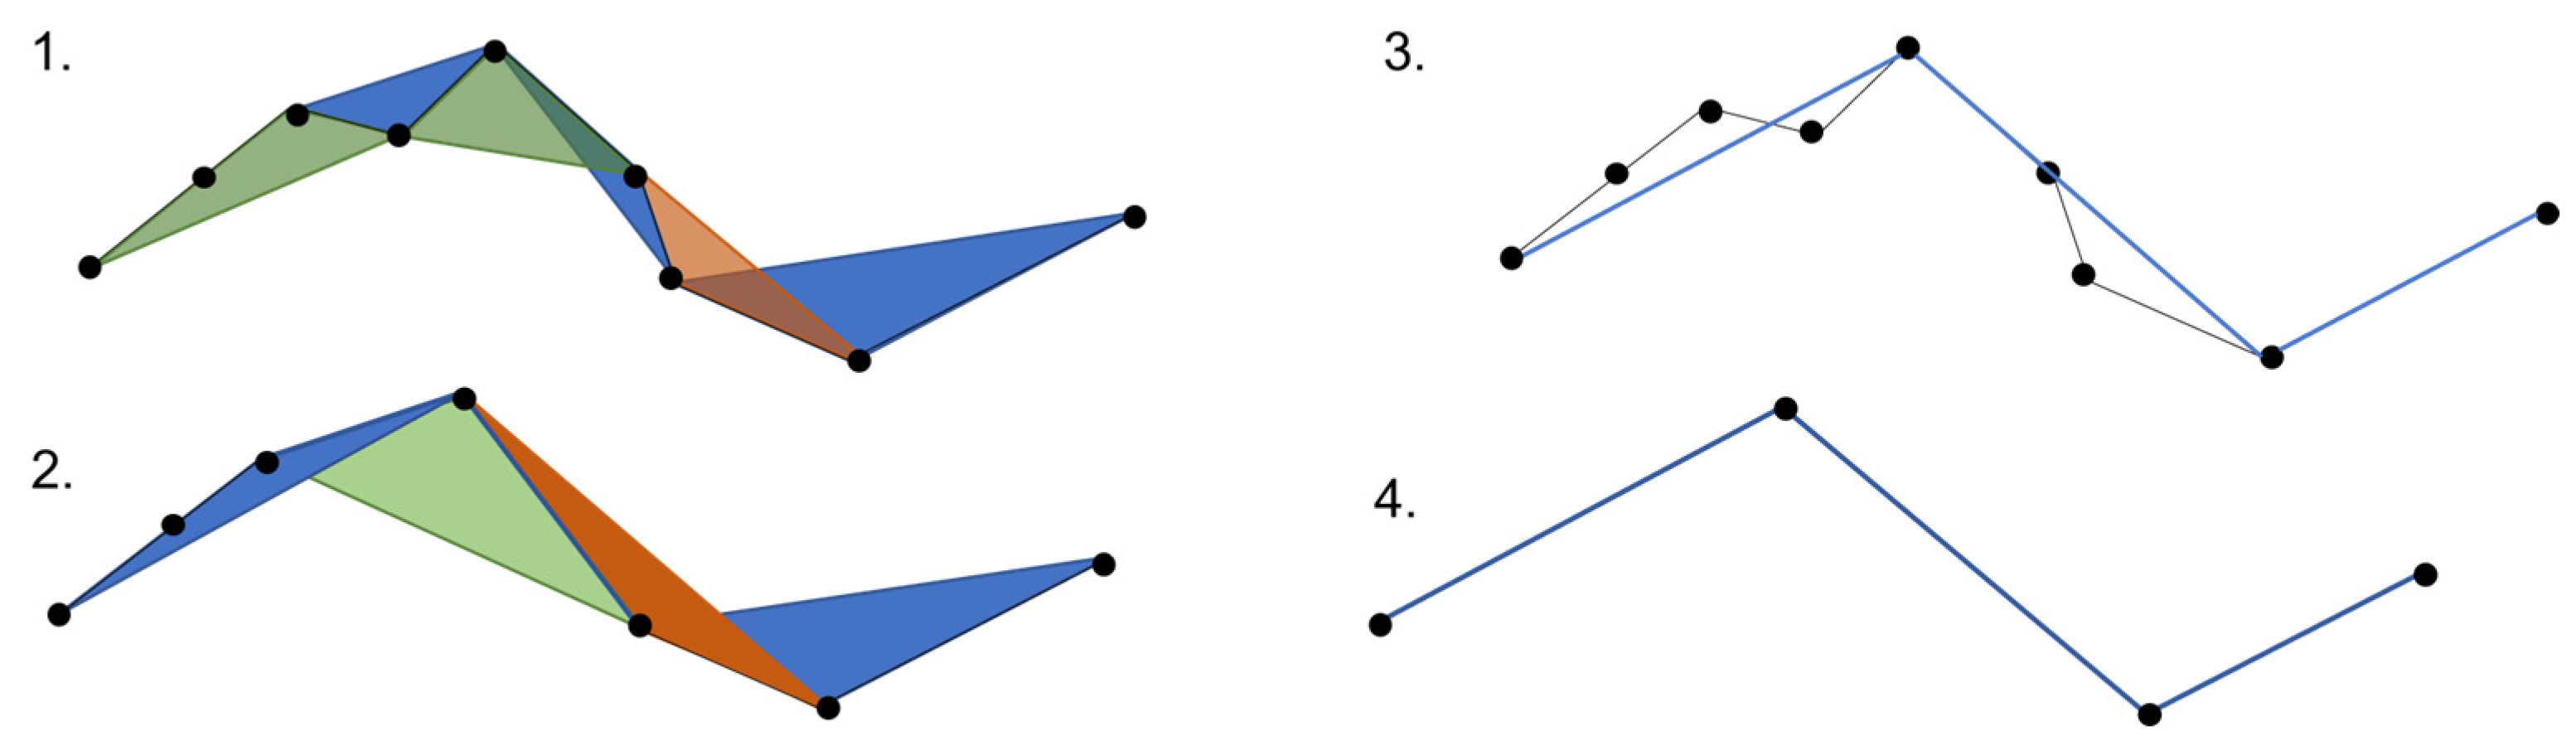
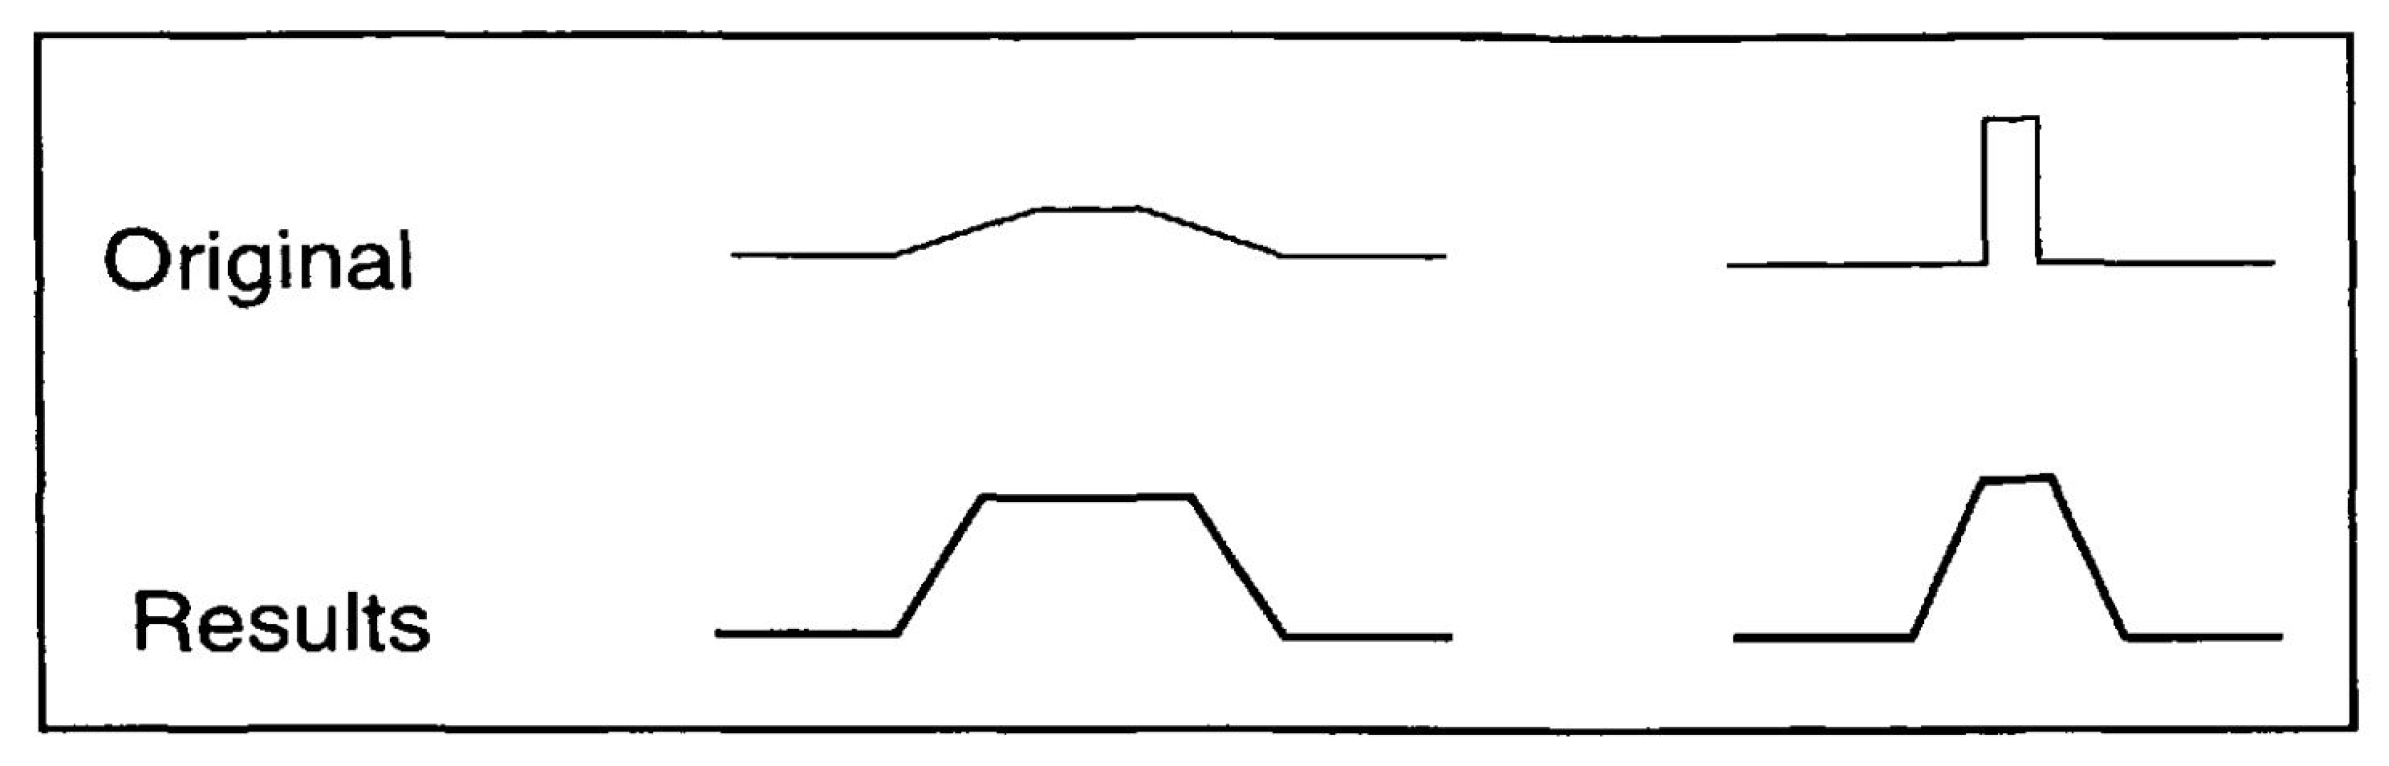
- The retain critical points algorithm (Douglas–Peucker) functions based on the concept of reducing the number of points while preserving those that are crucial for defining the polygon’s shape. It iteratively eliminates points by dividing the line segment and repeating the process until no more points can be removed. Initially, it creates a line segment by connecting the first and last points. Next, it identifies the point on the line segment that is farthest from the straight line connecting the endpoints. If the distance between this point and the straight line is smaller than the specified epsilon value (tolerance), the point is discarded. The algorithm then restarts the process with the remaining points between the endpoints, as proposed by Visvalingam and Whyatt in 1990 [18]. This simplified version of the Douglas–Peucker algorithm is demonstrated graphically in Figure 4.
- 2.
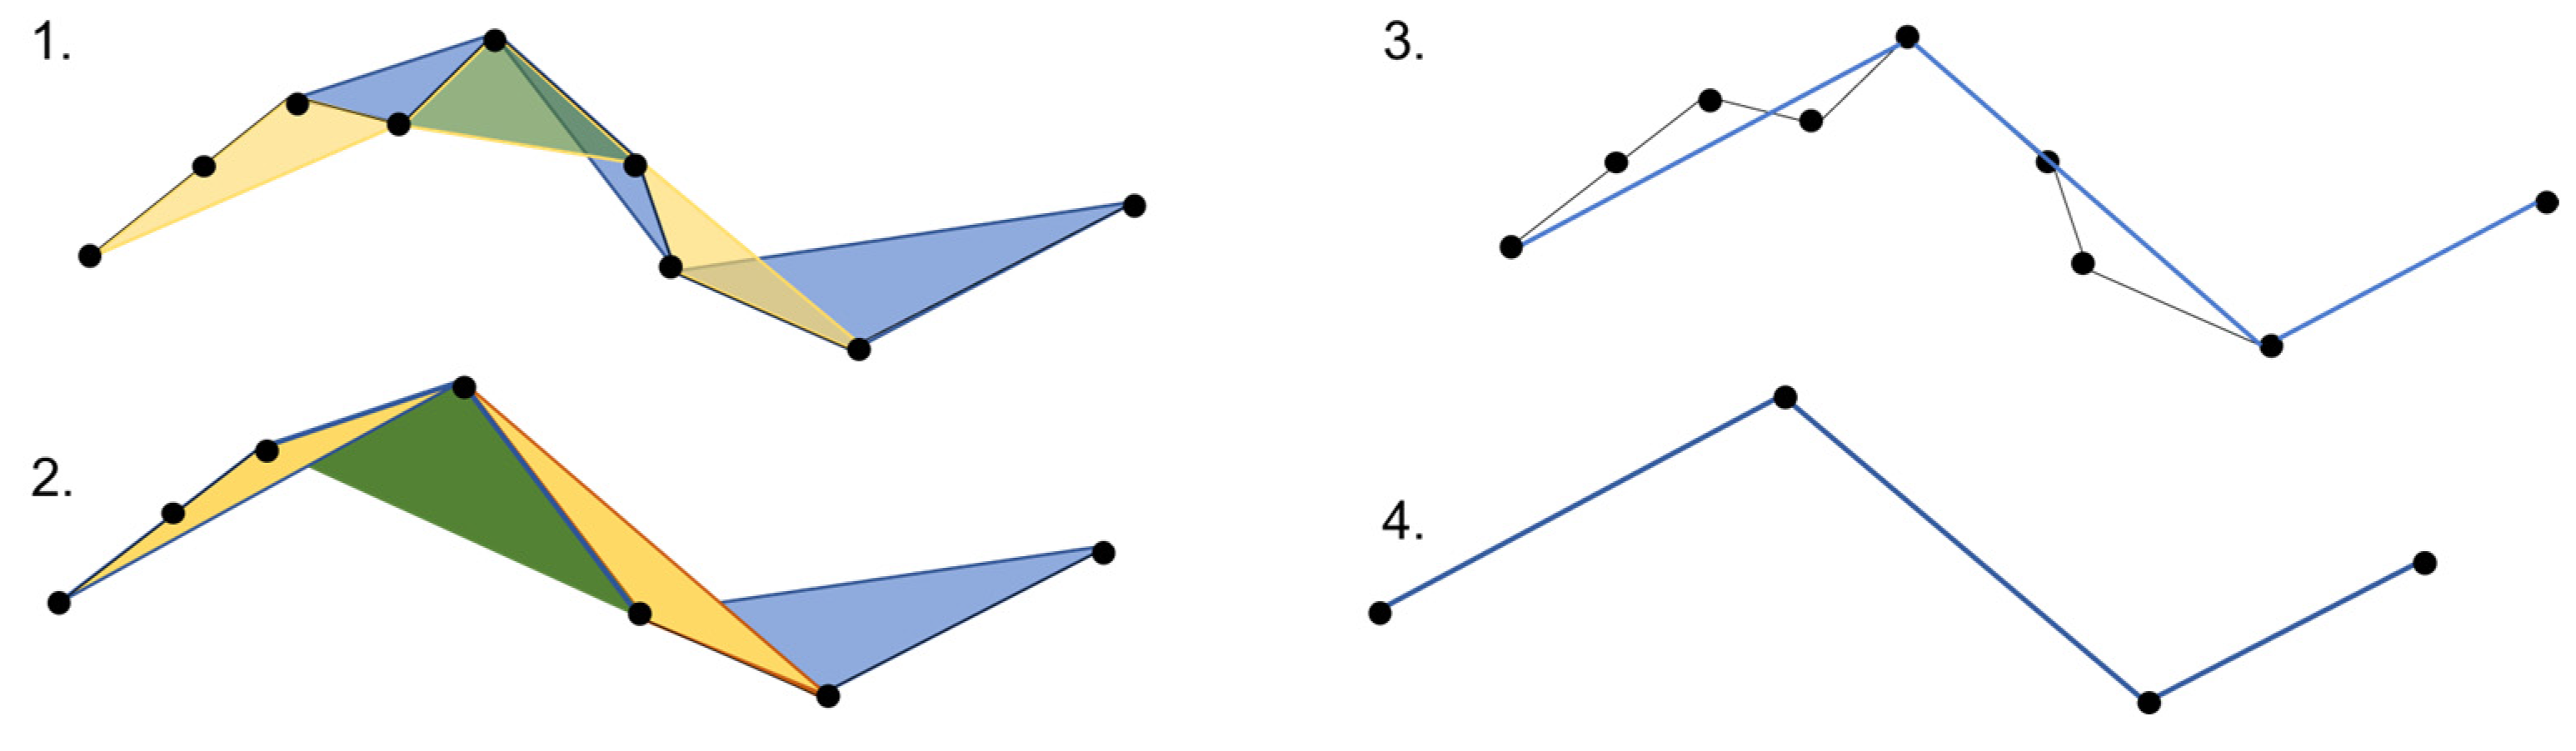
- The Visvalingam–Whyatt algorithm, also known as the retain effective areas algorithm, identifies triangles with effective area and uses that information to remove vertices to simplify the polygon’s outline while preserving its overall shape characteristics. This method shares similarities with the Douglas–Peucker algorithm, but instead of a distance-based tolerance, it utilizes a triangle’s area as the tolerance criterion. The algorithm starts by identifying the smallest triangle and compares its area to a predefined value also called epsilon [29]. The areas of triangles are continuously compared to the tolerance value. The algorithm removes triangles whose areas are smaller than epsilon. This process is repeated until all triangles with areas smaller than the tolerance value are eliminated [18]. The simplification process using this algorithm is illustrated in Figure 5.
- 3.
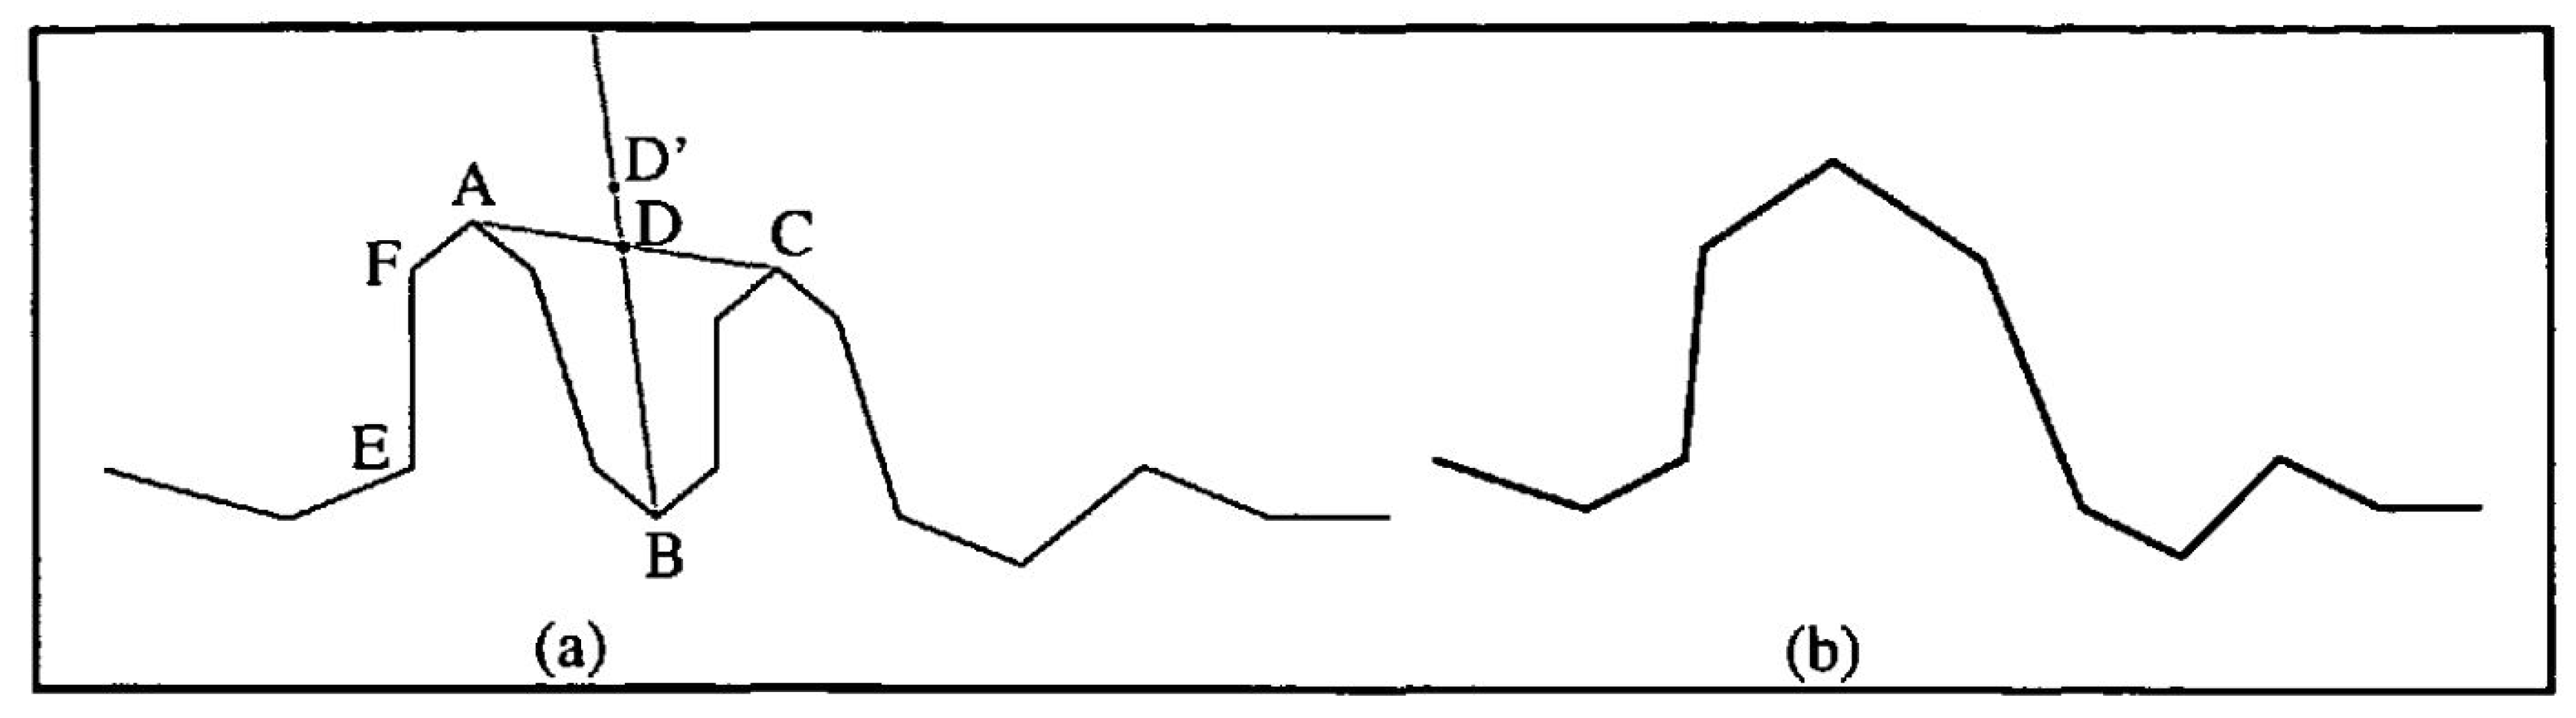
- The Zhou–Jones algorithm (Figure 6), known as the weighted effective area preservation algorithm, assesses the effective areas of triangles associated with each vertex. These effective areas are determined by considering the shape of the triangle and various metrics, such as flatness, skewness, and convexity [30]. The computation of effective areas for triangles involves applying a weight factor to the initial effective area. This weight factor serves to capture certain aspects of the triangle’s shape. Consequently, the introduction of weighted effective area values allows for the distinction between triangles that share the same area but exhibit different shape characteristics. Utilizing various weight definitions enables highlighting of different aspects of triangle shapes. In this context, the functions serve as filters. These filters designate certain triangles as “standard forms” by assigning them a weight of 1, making their effective areas equal under the filter. When examining a triangle’s shape characteristics, parameters such the base line length (W), height (H), and length of the middle line (ML) are considered. These parameters allow the measurement of a triangle’s flatness, skewness (deviation from an isosceles triangle with the same W and H values), and convexity (orientation relative to a predefined vertex order). There are two models that measure flatness. The first model, which constitutes a high-pass filter, gives priority to taller triangles and reduces the significance of flatter triangles. The second model, a low-pass filter, is identified as a symmetric version of the previously described high-pass filter; its purpose is to eliminate extreme points. The skewness filter is designed to retain points using effective triangles close to being isosceles. The convexity filter is characterized by a constant. If this constant is less than 1, the convexity filter tends to retain points with convex effective triangles. Otherwise, points with concave effective triangles are retained [30]. After weighted areas are calculated, the algorithm strategically eliminates vertices to achieve the maximum possible simplification of the line while still preserving its essential characteristics to the greatest extent possible [31].
- 4.
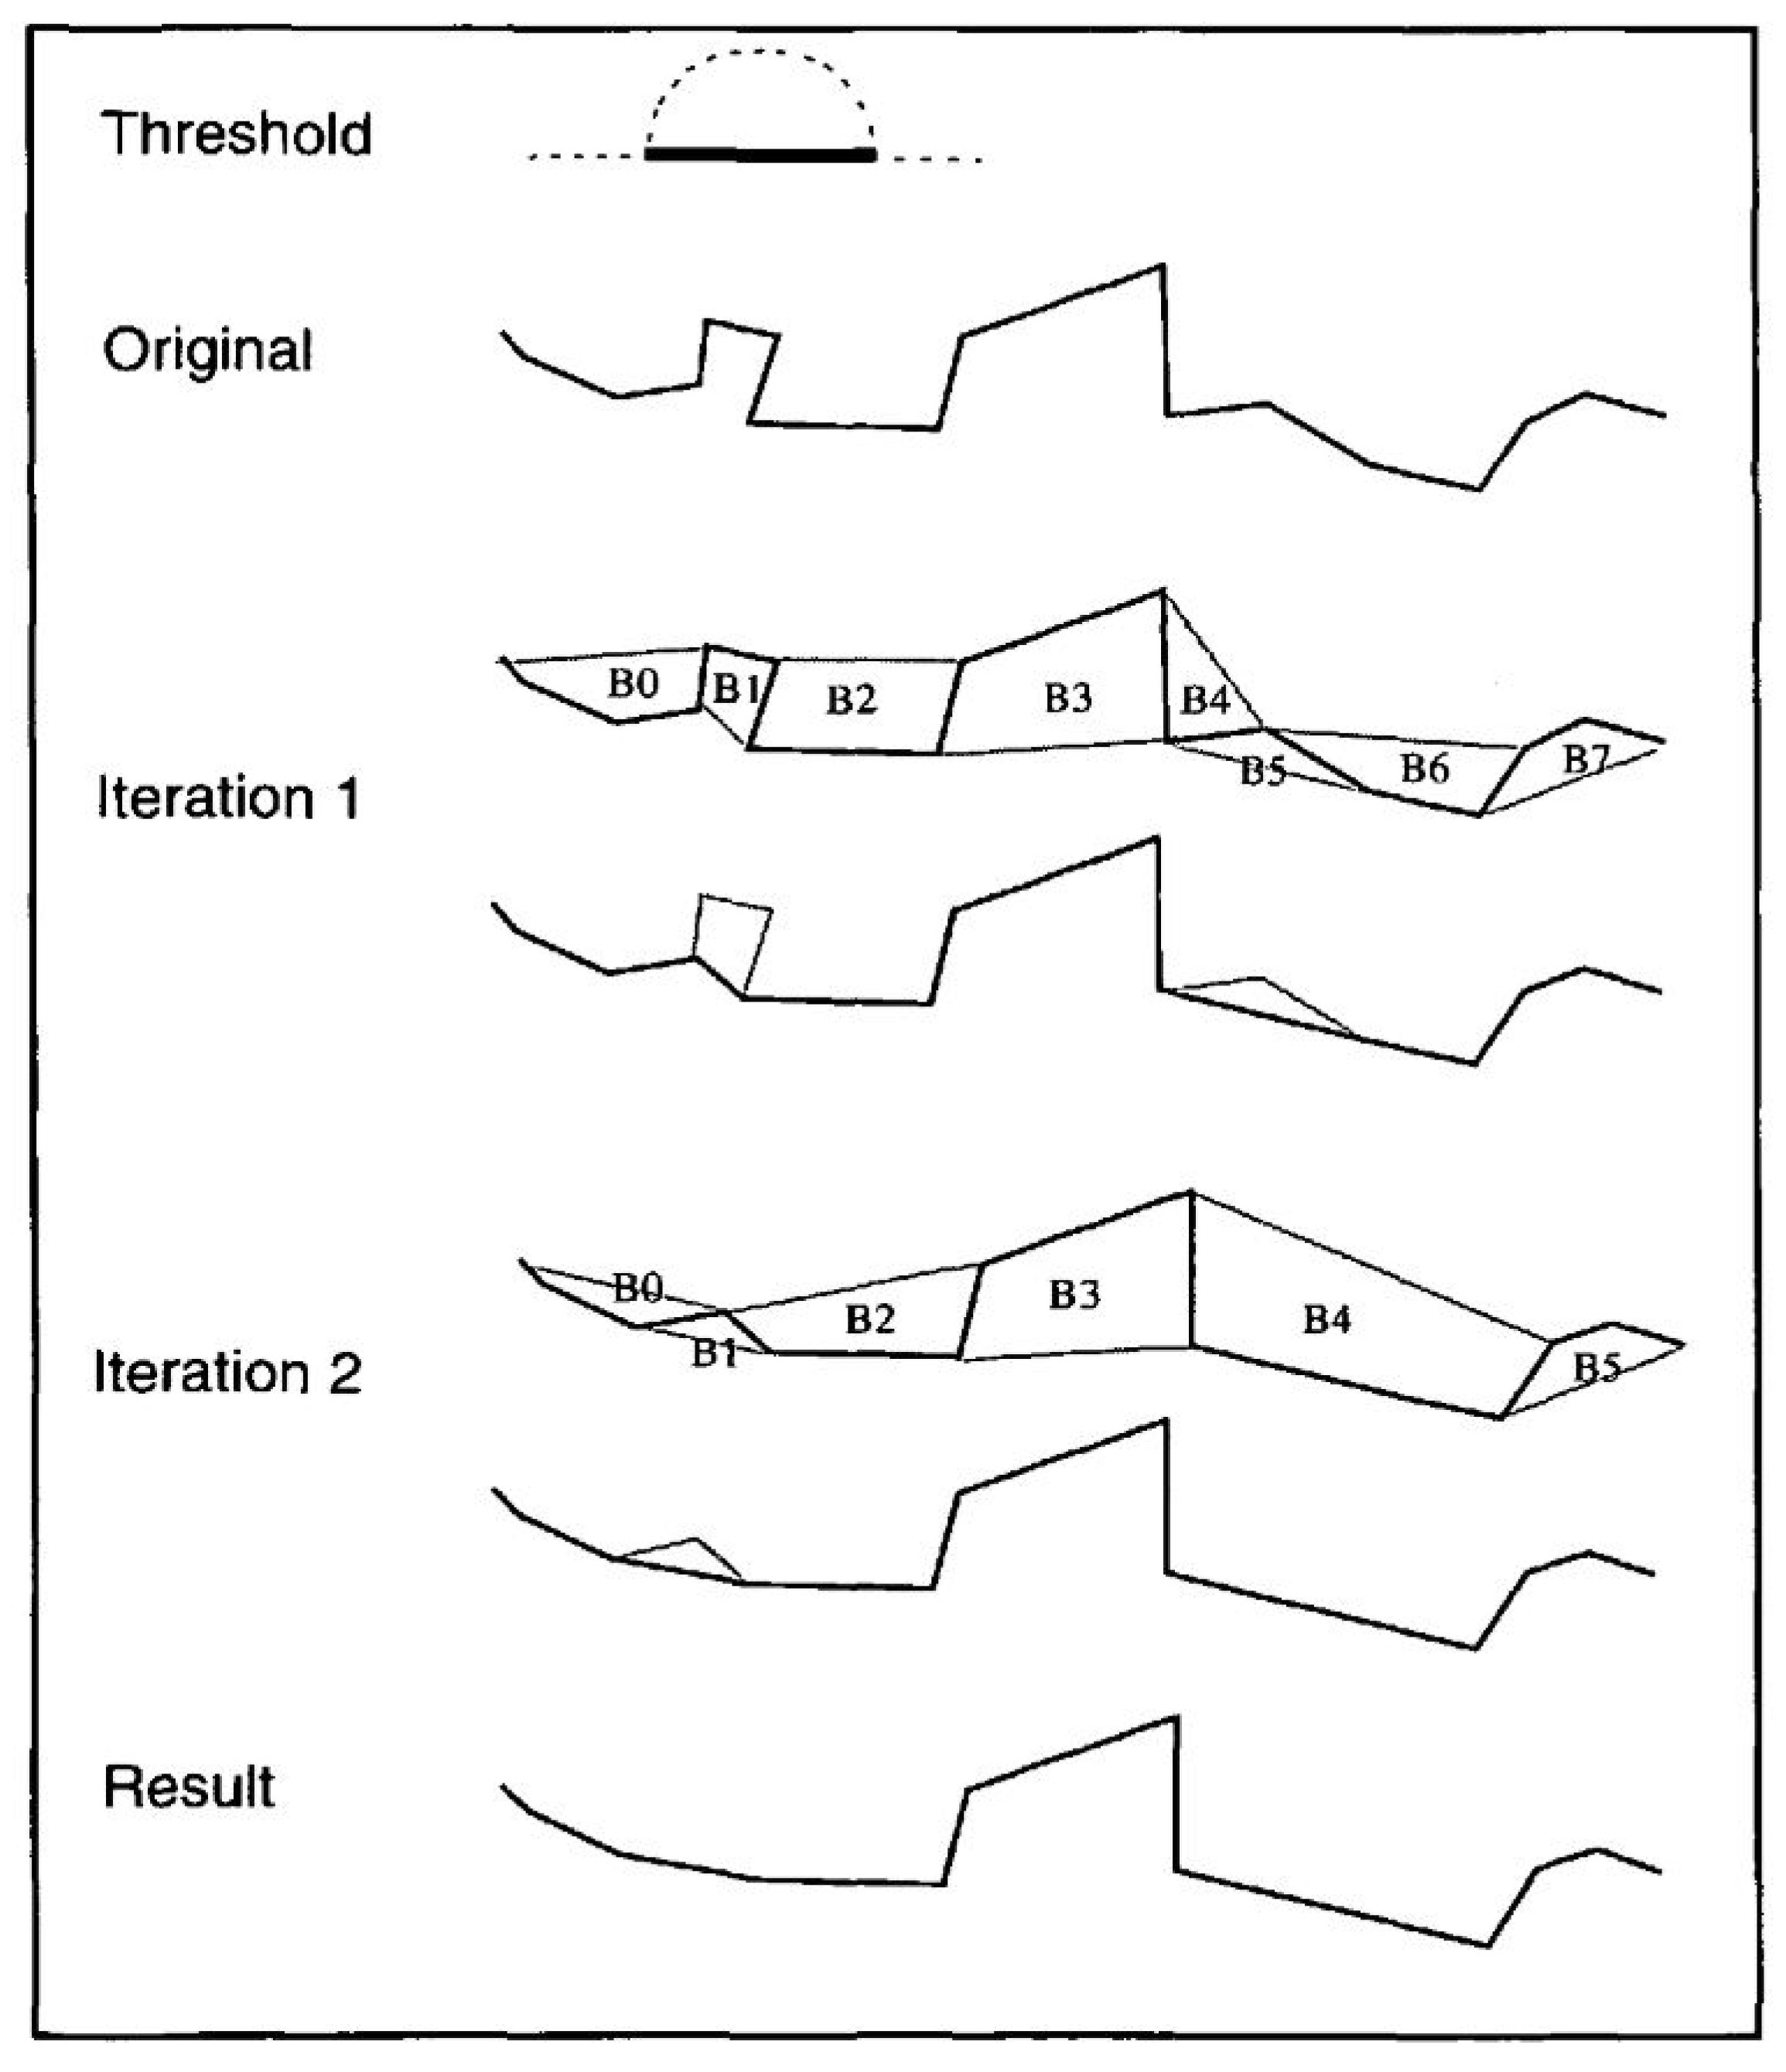
- The retain critical bends algorithm (Wang–Müller) aims to eliminate insignificant bends in polygons. Figure 7, Figure 8 and Figure 9 depict the process for outline simplification. The minimum diameter for a semicircular bend is set as the tolerance and reference for bend removal. One of the operations in this algorithm is bend elimination (Figure 7); a curved segment is replaced with a straight line. As consecutive straight lines representing bends are not connected, the elimination process must be iteratively performed by removing local minimal bends in each loop. A local minimal bend refers to a bend smaller than both of its neighboring bend points, whereas at the endpoints it is assumed that bends are larger than their neighbors.
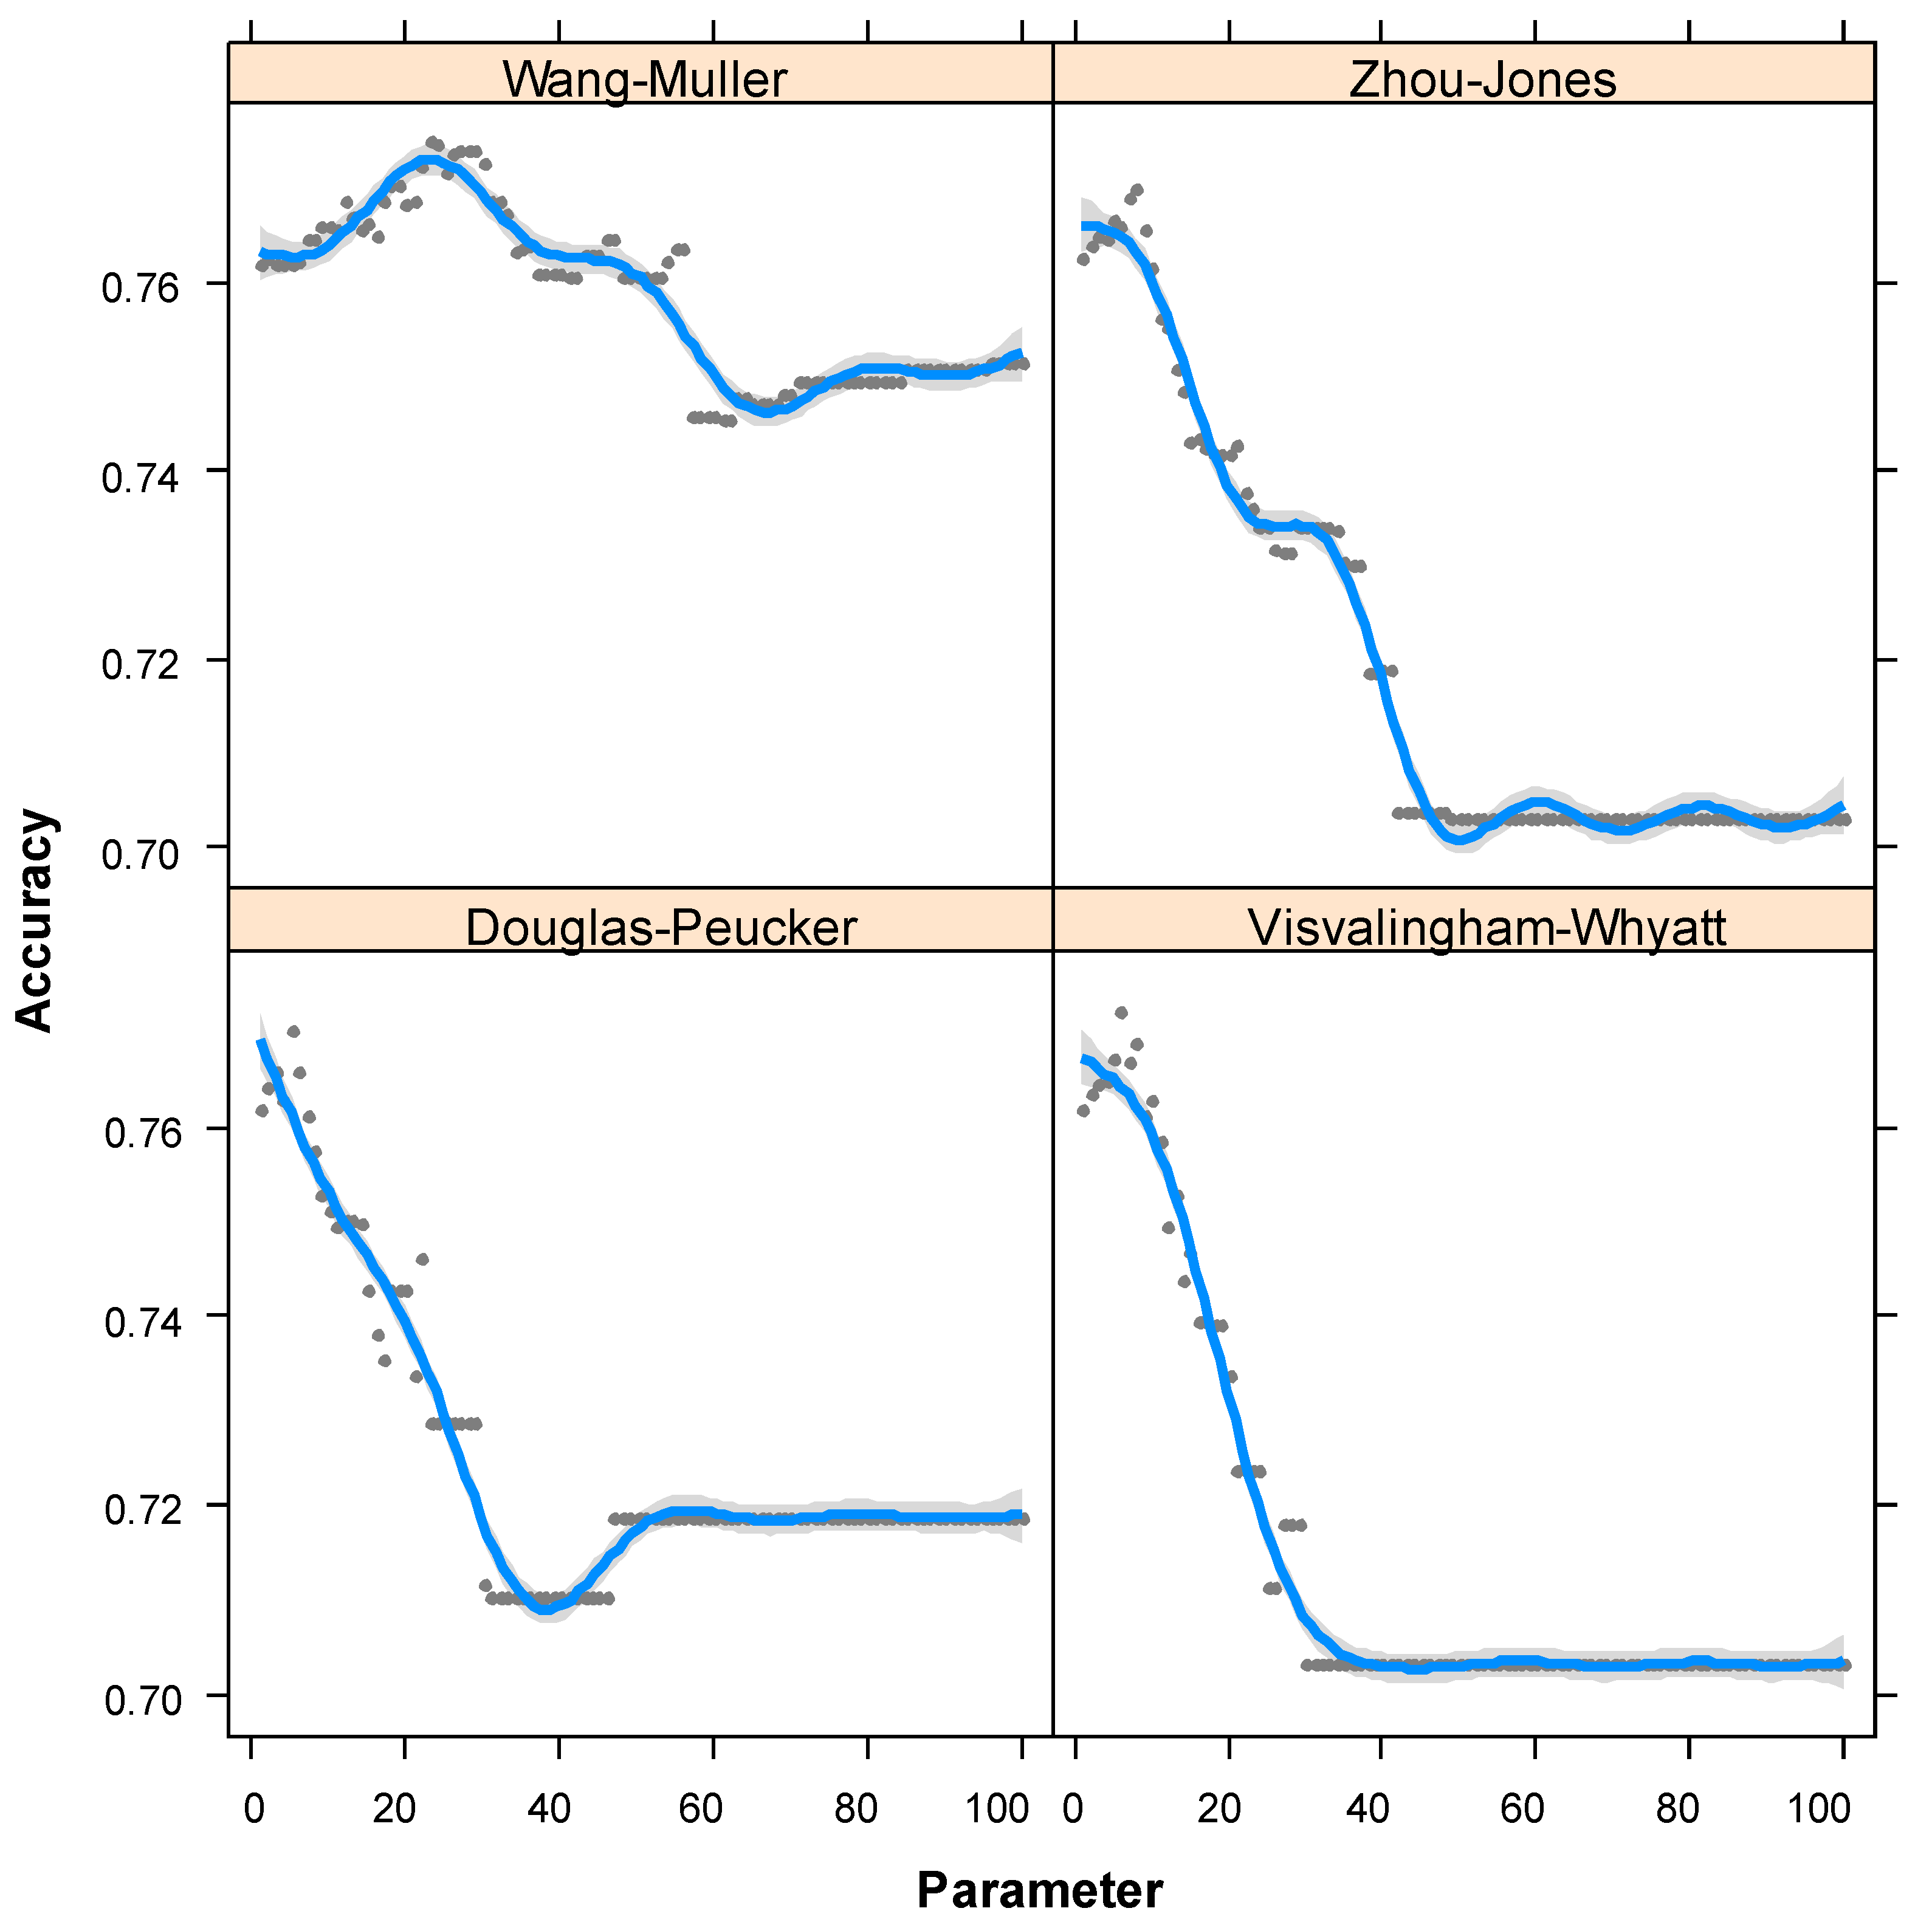
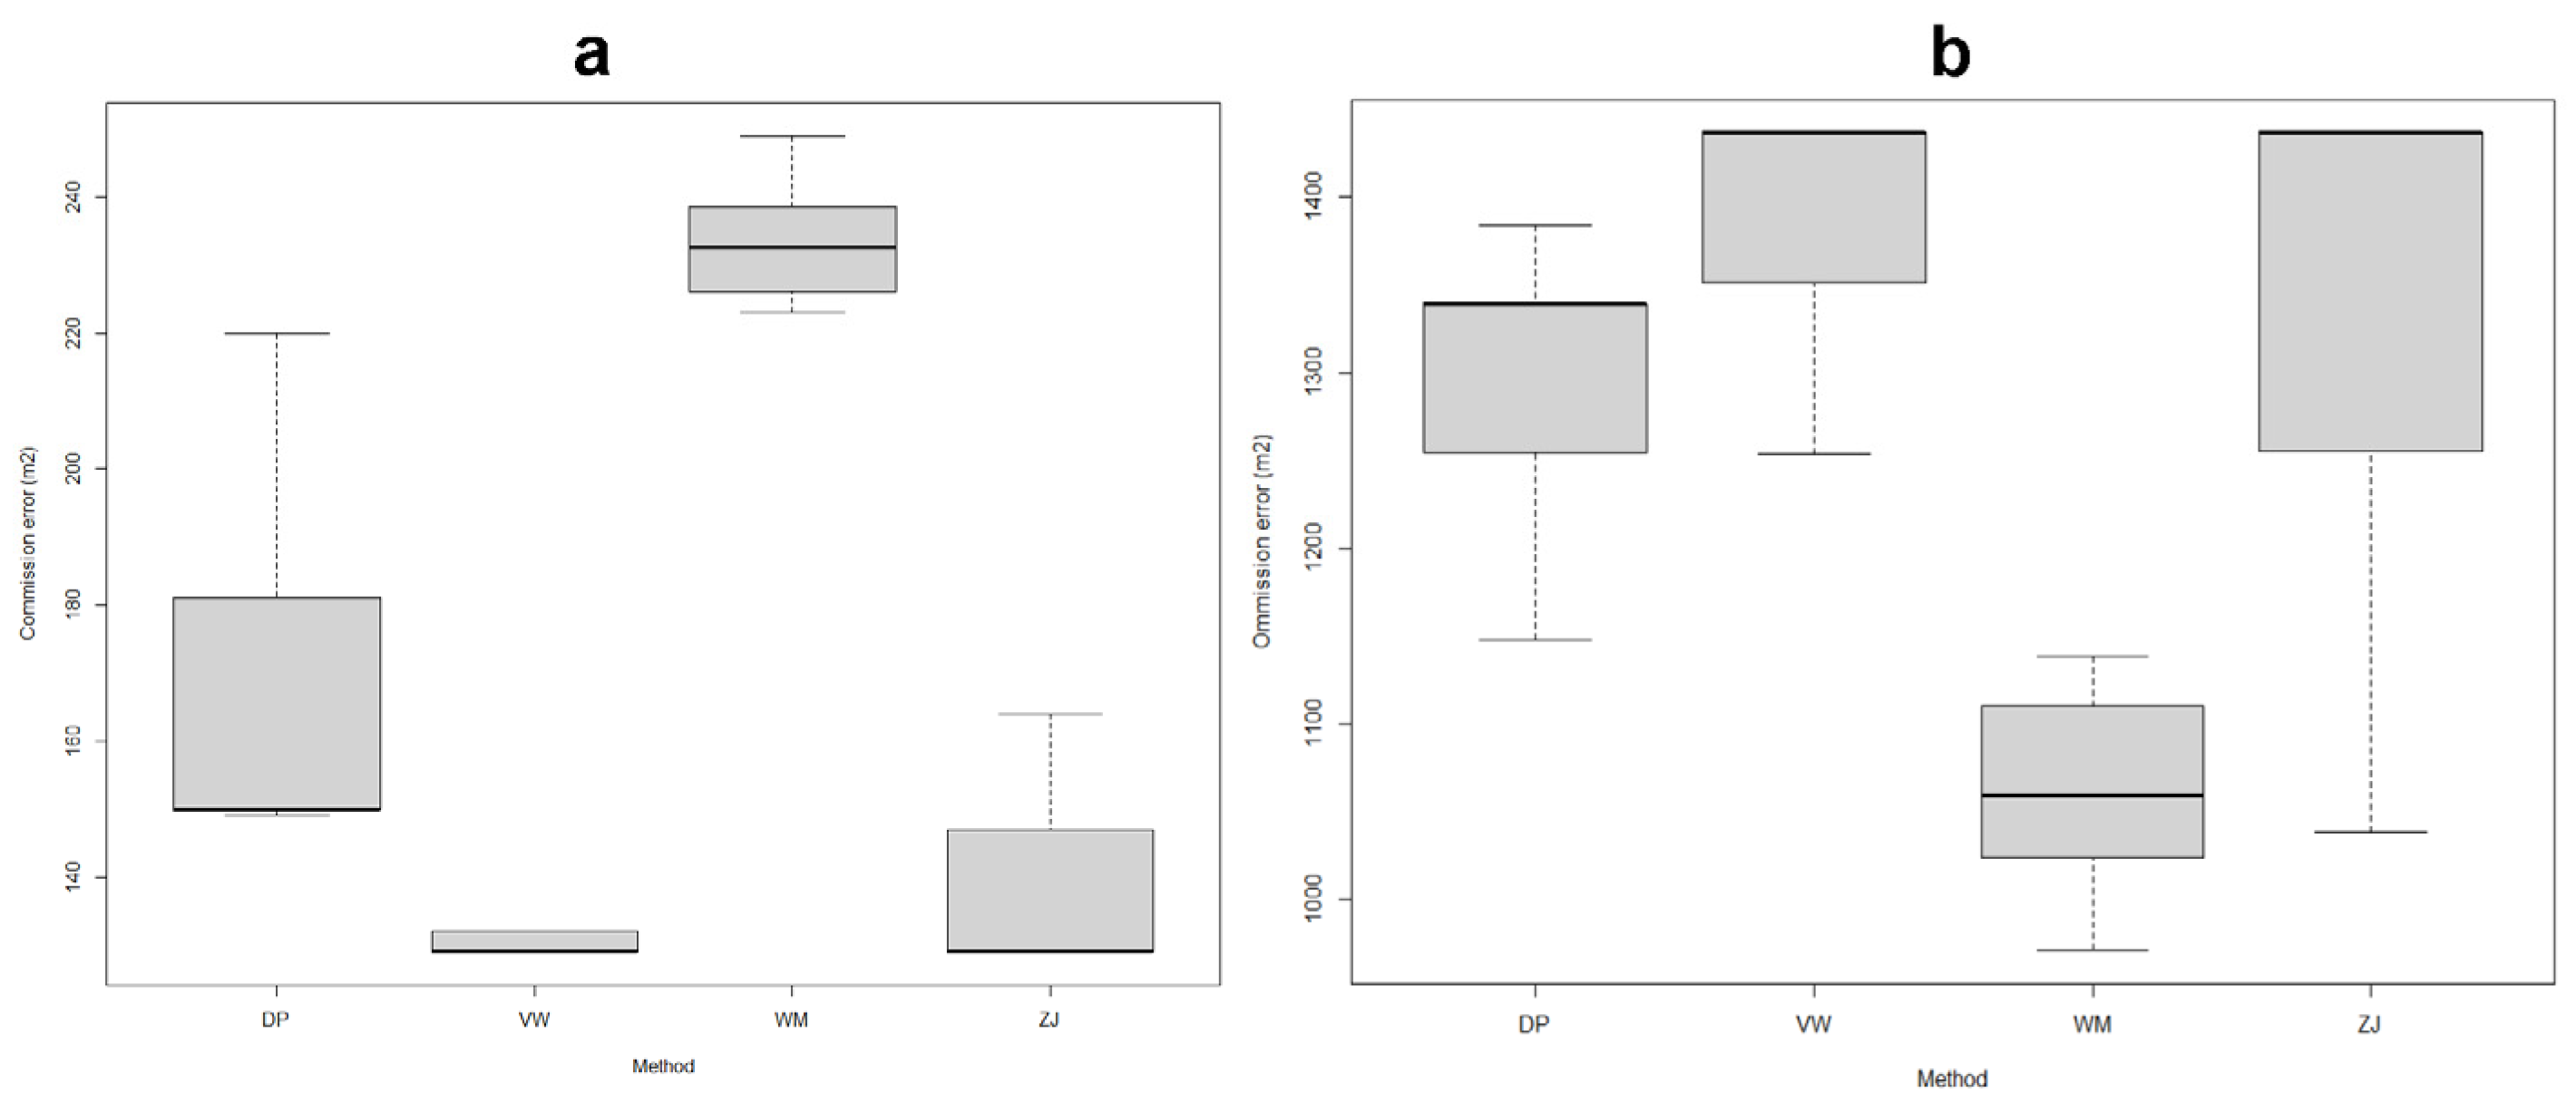
2.3. Statistical Analysis and Accuracy Assessment
3. Results
4. Discussion
5. Conclusions
Author Contributions
Funding
Data Availability Statement
Conflicts of Interest
References
- Schelhaas, M.J.; Fridman, J.; Hengeveld, G.M.; Henttonen, H.M.; Lehtonen, A.; Kies, U.; Krajnc, N.; Lerink, B.; Dhubháin, Á.N.; Polley, H.; et al. Actual European Forest Management by Region, Tree Species and Owner Based on 714,000 Re-Measured Trees in National Forest Inventories. PLoS ONE 2018, 13, e0207151. [Google Scholar] [CrossRef] [PubMed]
- Luyssaert, S.; Marie, G.; Valade, A.; Chen, Y.Y.; Njakou Djomo, S.; Ryder, J.; Otto, J.; Naudts, K.; Lansø, A.S.; Ghattas, J.; et al. Trade-Offs in Using European Forests to Meet Climate Objectives. Nature 2018, 562, 259–262. [Google Scholar] [CrossRef] [PubMed]
- Pilli, R.; Grassi, G.; Kurz, W.A.; Moris, J.V.; Viñas, R.A. Modelling Forest Carbon Stock Changes as Affected by Harvest and Natural Disturbances. II. EU-Level Analysis. Carbon Balance Manag. 2016, 11, 20. [Google Scholar] [CrossRef] [PubMed]
- Ceccherini, G.; Duveiller, G.; Grassi, G.; Lemoine, G.; Avitabile, V.; Pilli, R.; Cescatti, A. Abrupt Increase in Harvested Forest Area over Europe after 2015. Nature 2020, 583, 72–77. [Google Scholar] [CrossRef] [PubMed]
- Picard, N.; Leban, J.M.; Guehl, J.M.; Dreyer, E.; Bouriaud, O.; Bontemps, J.D.; Landmann, G.; Colin, A.; Peyron, J.L.; Marty, P. Recent Increase in European Forest Harvests as Based on Area Estimates (Ceccherini et Al. 2020a) Not Confirmed in the French Case. Ann. For. Sci. 2021, 78, 1–5. [Google Scholar] [CrossRef]
- Breidenbach, J.; Ellison, D.; Petersson, H.; Korhonen, K.; Henttonen, H.; Wallerman, J.; Fridman, J.; Gobakken, T.; Astrup, R.; Næsset, E. No “ Abrupt Increase in Harvested Forest Area over Europe after 2015 ”—How the Misuse of a Satellite-Based Map Led to Completely Wrong Conclusions. In Proceedings of the vEGU21, The 23rd EGU General Assembly, Online, 19–30 April 2021; Volume 77, p. 13243. [Google Scholar]
- Zielewska-Büttner, K.; Adler, P.; Ehmann, M.; Braunisch, V. Automated Detection of Forest Gaps in Spruce Dominated Stands Using Canopy Height Models Derived from Stereo Aerial Imagery. Remote Sens. 2016, 8, 175. [Google Scholar] [CrossRef]
- Yu, X.; Maltamo, M. Methods of Airborne Laser Scanning for Forest Test Site and Applied Laser Scanner Data. In Proceedings of the Workshop on 3D Remote Sensing in Forestry, Vienna, Austria, 14–15 February 2006; pp. 1–16. [Google Scholar]
- Su, J.; Bork, E. Influence of Vegetation, Slope, and LiDAR Sampling Angle on DEM Accuracy. Photogramm. Eng. Remote Sens. 2006, 72, 1265–1274. [Google Scholar] [CrossRef]
- Maltamo, M.; Eerikäinen, K.; Pitkänen, J.; Hyyppä, J.; Vehmas, M. Estimation of Timber Volume and Stem Density Based on Scanning Laser Altimetry and Expected Tree Size Distribution Functions. Remote Sens. Environ. 2004, 90, 319–330. [Google Scholar] [CrossRef]
- Mielcarek, M.; Stereńczak, K.; Khosravipour, A. Testing and Evaluating Different LiDAR-Derived Canopy Height Model Generation Methods for Tree Height Estimation. Int. J. Appl. Earth Obs. Geoinf. 2018, 71, 132–143. [Google Scholar] [CrossRef]
- Stereńczak, K. Factors Influencing Individual Tree Crowns Detection Based on Airborne Laser Scanning Data. For. Res. Pap. 2014, 74, 323–333. [Google Scholar] [CrossRef][Green Version]
- Räty, M.; Kankare, V.; Yu, X.; Holopainen, M.; Vastaranta, M.; Kantola, T.; Hyyppä, J.; Viitala, R. Tree Biomass Estimation Using ALS Features. In Proceedings of the SilviLaser 2011, Hobart, Australia, 16–20 October 2011; pp. 1–8. [Google Scholar]
- Nijland, W.; Coops, N.C.; Ellen Macdonald, S.; Nielsen, S.E.; Bater, C.W.; John Stadt, J. Comparing Patterns in Forest Stand Structure Following Variable Harvests Using Airborne Laser Scanning Data. For. Ecol. Manage. 2015, 354, 272–280. [Google Scholar] [CrossRef]
- Tompalski, P.; Coops, N.C.; White, J.C.; Goodbody, T.R.H.; Hennigar, C.R.; Wulder, M.A.; Socha, J.; Woods, M.E. Estimating Changes in Forest Attributes and Enhancing Growth Projections: A Review of Existing Approaches and Future Directions Using Airborne 3D Point Cloud Data. Curr. For. Rep. 2021, 7, 1–24, Correction in Curr. For. Rep. 2021, 7, 25–30. [Google Scholar] [CrossRef]
- Ruas, A. Map Generalization. In Encyclopedia of GIS; Springer: Boston, MA, USA, 2008; pp. 631–632. [Google Scholar] [CrossRef]
- Pfaltz, J.L.; Rosenfeld, A. Computer Representation of Planar Regions by Their Skeletons. Commun. ACM 1967, 10, 119–122. [Google Scholar] [CrossRef]
- Visvalingam, M.; Whyatt, J.D. The Douglas-Peucker Algorithm for Line Simplification: Re-evaluation through Visualization. Comput. Graph. Forum. 1990, 9, 213–225. [Google Scholar] [CrossRef]
- Saalfeld, A. Topologically Consistent Line Simplification with the Douglas-Peucker Algorithm. Cartogr. Geogr. Inf. Sci. 1999, 26, 7–18. [Google Scholar] [CrossRef]
- Jakštys, M. Wang—Müller Algorithm Realization for Cartographic Line Generalization. 2021, p. 54. Available online: https://git.jakstys.lt/motiejus/wm/raw/branch/main/mj-msc-full.pdf. (accessed on 7 December 2023).
- García Balboa, J.L.; Ariza López, F.J. Sinuosity Pattern Recognition of Road Features for Segmentation Purposes in Cartographic Generalization. Pattern Recognit. 2009, 42, 2150–2159. [Google Scholar] [CrossRef]
- Blaszczak-Bak, W.; Janowski, A.; Kamiñski, W.; Rapiñski, J. Optimization Algorithm and Filtration Using the Adaptive TIN Model at the Stage of Initial Processing of the ALS Point Cloud. Can. J. Remote Sens. 2012, 37, 583–589. [Google Scholar] [CrossRef]
- Costa, R.L.C.; Miranda, E.; Dias, P.; Moreira, J. Evaluating Preprocessing and Interpolation Strategies to Create Moving Regions from Real-World Observations. ACM SIGAPP Appl. Comput. Rev. 2020, 20, 46–58. [Google Scholar] [CrossRef]
- Shao, G.; Tang, L.; Liao, J. Overselling Overall Map Accuracy Misinforms about Research Reliability. Landsc. Ecol. 2019, 34, 2487–2492. [Google Scholar] [CrossRef]
- Kamusoko, C. Land Cover Classification Accuracy Assessment. Springer Geogr. 2022, 80, 105–118. [Google Scholar] [CrossRef]
- Available online: https://arboretum.czu.cz/en/r-12506-o-arboretu/r-12526-prirodni-a-klimaticke-podminky (accessed on 7 December 2023).
- Available online: https://pdal.io/workshop/exercises/analysis/ground/ground.html (accessed on 7 December 2023).
- Available online: https://pdal.io/en/2.4.3/workshop/exercises/analysis/dtm/dtm.html (accessed on 7 December 2023).
- Botto-Tobar, M.; Barzola-Monteses, J.; Santos-Baquerizo, E.; Espinoza-Andaluz, M.; Yánez-Pazmiño, W. Preface. In Computer and Communication Engineering, First International Conference, Proceedings of the ICCCE 2018, Guayaquil, Ecuador, 25–27 October 2018; Springer: Berlin/Heidelberg, Germany, 2019; p. 959. [Google Scholar] [CrossRef]
- Zhou, S.; Jones, C.B. Shape-Aware Line Generalisation With Weighted Effective Area. In Developments in Spatial Data Handling, Proceedings of the 11th International Symposium on Spatial Data Handling, Leicester, UK, 23–25 August 2004; Springer: Berlin/Heidelberg, Germany, 2006; pp. 369–380. [Google Scholar] [CrossRef]
- Available online: https://pro.arcgis.com/en/pro-app/latest/tool-reference/cartography/simplify-line.htm (accessed on 7 December 2023).
- Wang, Z.; Müller, J.C. Line Generalization Based on Analysis of Shape Characteristics. Cartogr. Geogr. Inf. Sci. 1998, 25, 3–15. [Google Scholar] [CrossRef]
- Lu, M.; Chen, B.; Liao, X.; Yue, T.; Yue, H.; Ren, S.; Li, X.; Nie, Z.; Xu, B. Forest Types Classification Based on Multi-Source Data Fusion. Remote Sens. 2017, 9, 1153. [Google Scholar] [CrossRef]
- Shao, G.; Wu, J. On the Accuracy of Landscape Pattern Analysis Using Remote Sensing Data. Landsc. Ecol. 2008, 23, 505–511. [Google Scholar] [CrossRef]
- R Core Team. R: A Language and Environment for Statistical Computing; R Foundation for Statistical Computing: Vienna, Austria, 2023; Available online: https://www.R-project.org/ (accessed on 7 December 2023).
- Wood, S.N. Generalized Additive Models: An Introduction with R, 2nd ed.; Chapman and Hall/CRC: Boca Raton, FL, USA, 2017. [Google Scholar]
- Breheny, P.; Burchett, W. Package ‘Visreg’: Visualization of Regression Models. R J. 2017, 9, 56–71. [Google Scholar] [CrossRef]
- Allouche, M.K.; Moulin, B. Amalgamation in Cartographic Generalization Using Kohonen’s Feature Nets. Int. J. Geogr. Inf. Sci. 2005, 19, 899–914. [Google Scholar] [CrossRef]
- Wang, H.L.; Wu, F.; Zhang, L.L.; Deng, H.Y. The Application of Mathematical Morphology and Pattern Recognition to Building Polygon Simplification. Acta Geod. Cartogr. Sin. 2005, 34, 269–276. [Google Scholar]
- Wang, X.; Liu, S. Vehicle Trajectory Optimization Based on Limiting Average Algorithm. IEEE Access 2021, 9, 9595–9599. [Google Scholar] [CrossRef]
- Badea, G.; Eng, P.; Bucharest, E. On the Generalization Algorithms Applied in Gis Environment. 2021, pp. 15–22. Available online: https://www.researchgate.net/publication/342658887_On_the_Generalization_Algorithms_Applied_in_GIS_Environment (accessed on 7 December 2023).
- Gökgöz, T.; Sen, A.; Memduhoglu, A.; Hacar, M. A New Algorithm for Cartographic Simplification of Streams and Lakes Using Deviation Angles and Error Bands. ISPRS Int. J. Geo-Inf. 2015, 4, 2185–2204. [Google Scholar] [CrossRef]
- Alves, M.; Santo, D.; De Oliveira, F.H. Algorithms for Automated Line Generalization in GIS. In Proceedings of the Twenty-Eighth Annual ESRI User Conference, San Diego, CA, USA, 4–8 August 2008. [Google Scholar]


Disclaimer/Publisher’s Note: The statements, opinions and data contained in all publications are solely those of the individual author(s) and contributor(s) and not of MDPI and/or the editor(s). MDPI and/or the editor(s) disclaim responsibility for any injury to people or property resulting from any ideas, methods, instructions or products referred to in the content. |
© 2023 by the authors. Licensee MDPI, Basel, Switzerland. This article is an open access article distributed under the terms and conditions of the Creative Commons Attribution (CC BY) license (https://creativecommons.org/licenses/by/4.0/).
Share and Cite
Melichová, Z.; Pekár, S.; Surový, P. Benchmark for Automatic Clear-Cut Morphology Detection Methods Derived from Airborne Lidar Data. Forests 2023, 14, 2408. https://doi.org/10.3390/f14122408
Melichová Z, Pekár S, Surový P. Benchmark for Automatic Clear-Cut Morphology Detection Methods Derived from Airborne Lidar Data. Forests. 2023; 14(12):2408. https://doi.org/10.3390/f14122408
Chicago/Turabian StyleMelichová, Zlatica, Stano Pekár, and Peter Surový. 2023. "Benchmark for Automatic Clear-Cut Morphology Detection Methods Derived from Airborne Lidar Data" Forests 14, no. 12: 2408. https://doi.org/10.3390/f14122408
APA StyleMelichová, Z., Pekár, S., & Surový, P. (2023). Benchmark for Automatic Clear-Cut Morphology Detection Methods Derived from Airborne Lidar Data. Forests, 14(12), 2408. https://doi.org/10.3390/f14122408