
Evaluating the Effect of Vegetation Index Based on Multiple Tree-Ring Parameters in the Central Tianshan Mountains

 , , ,
, , ,
Abstract
:1. Introduction
2. Materials and Methods
2.1. Study Area
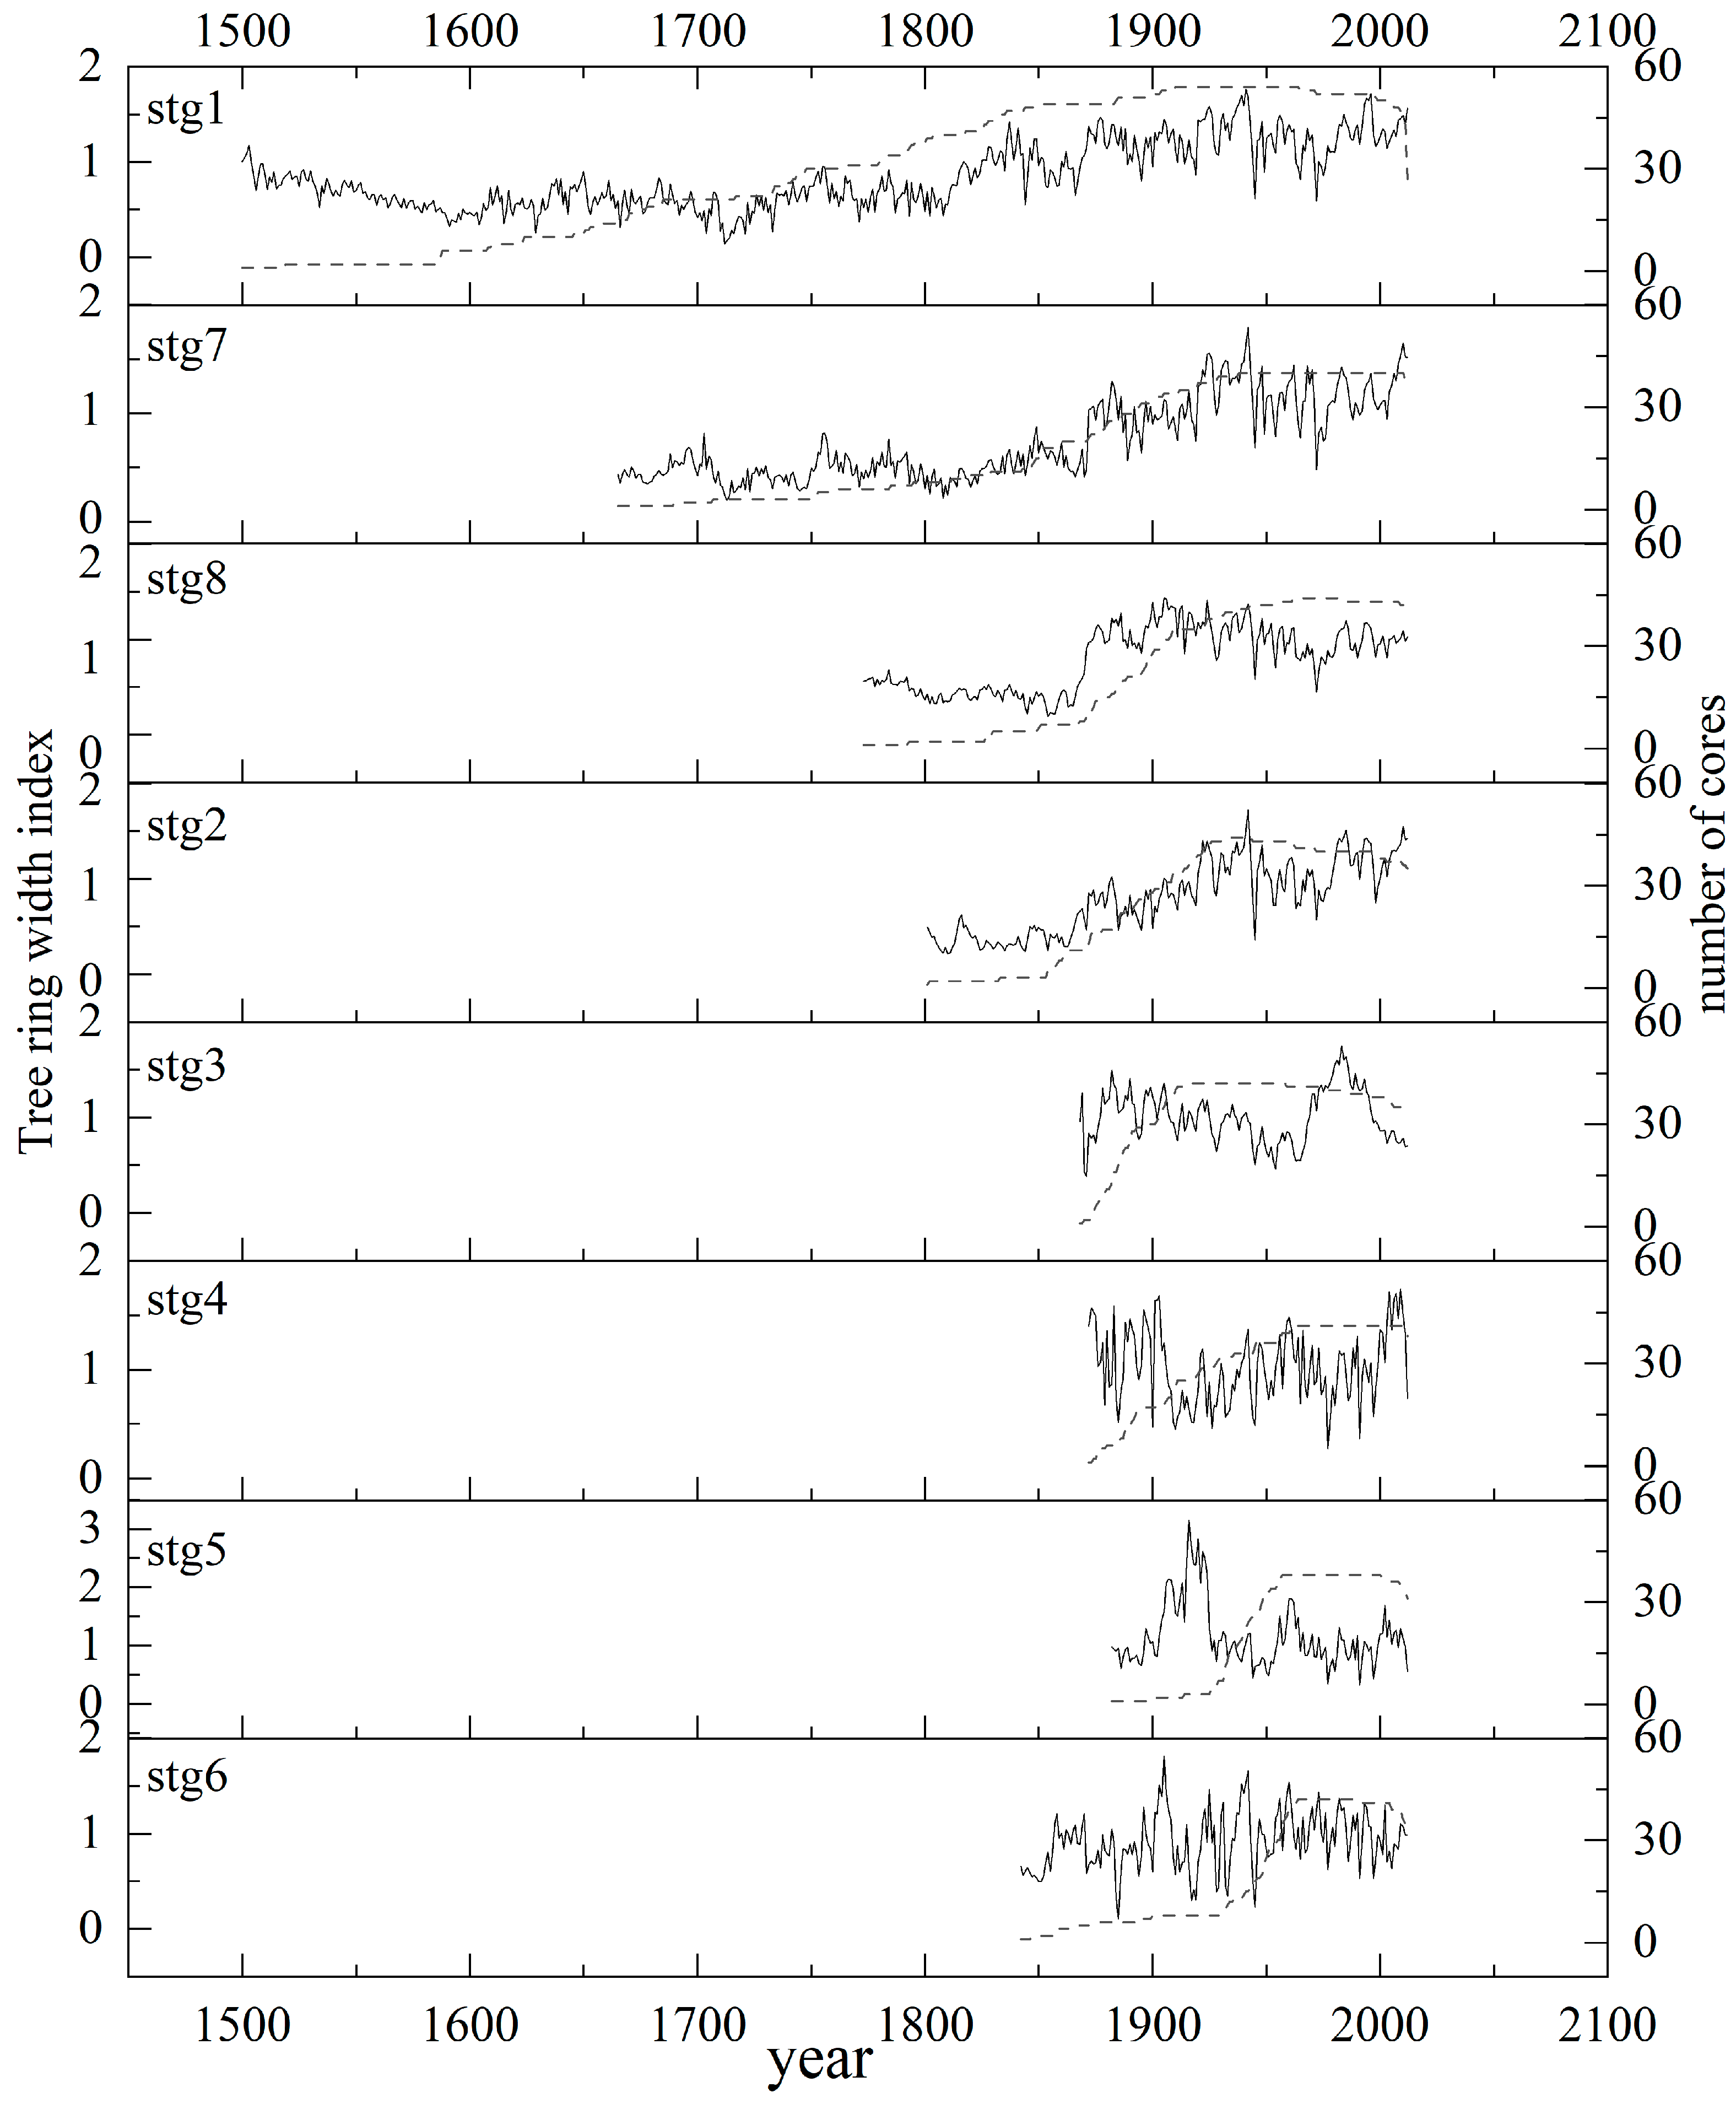
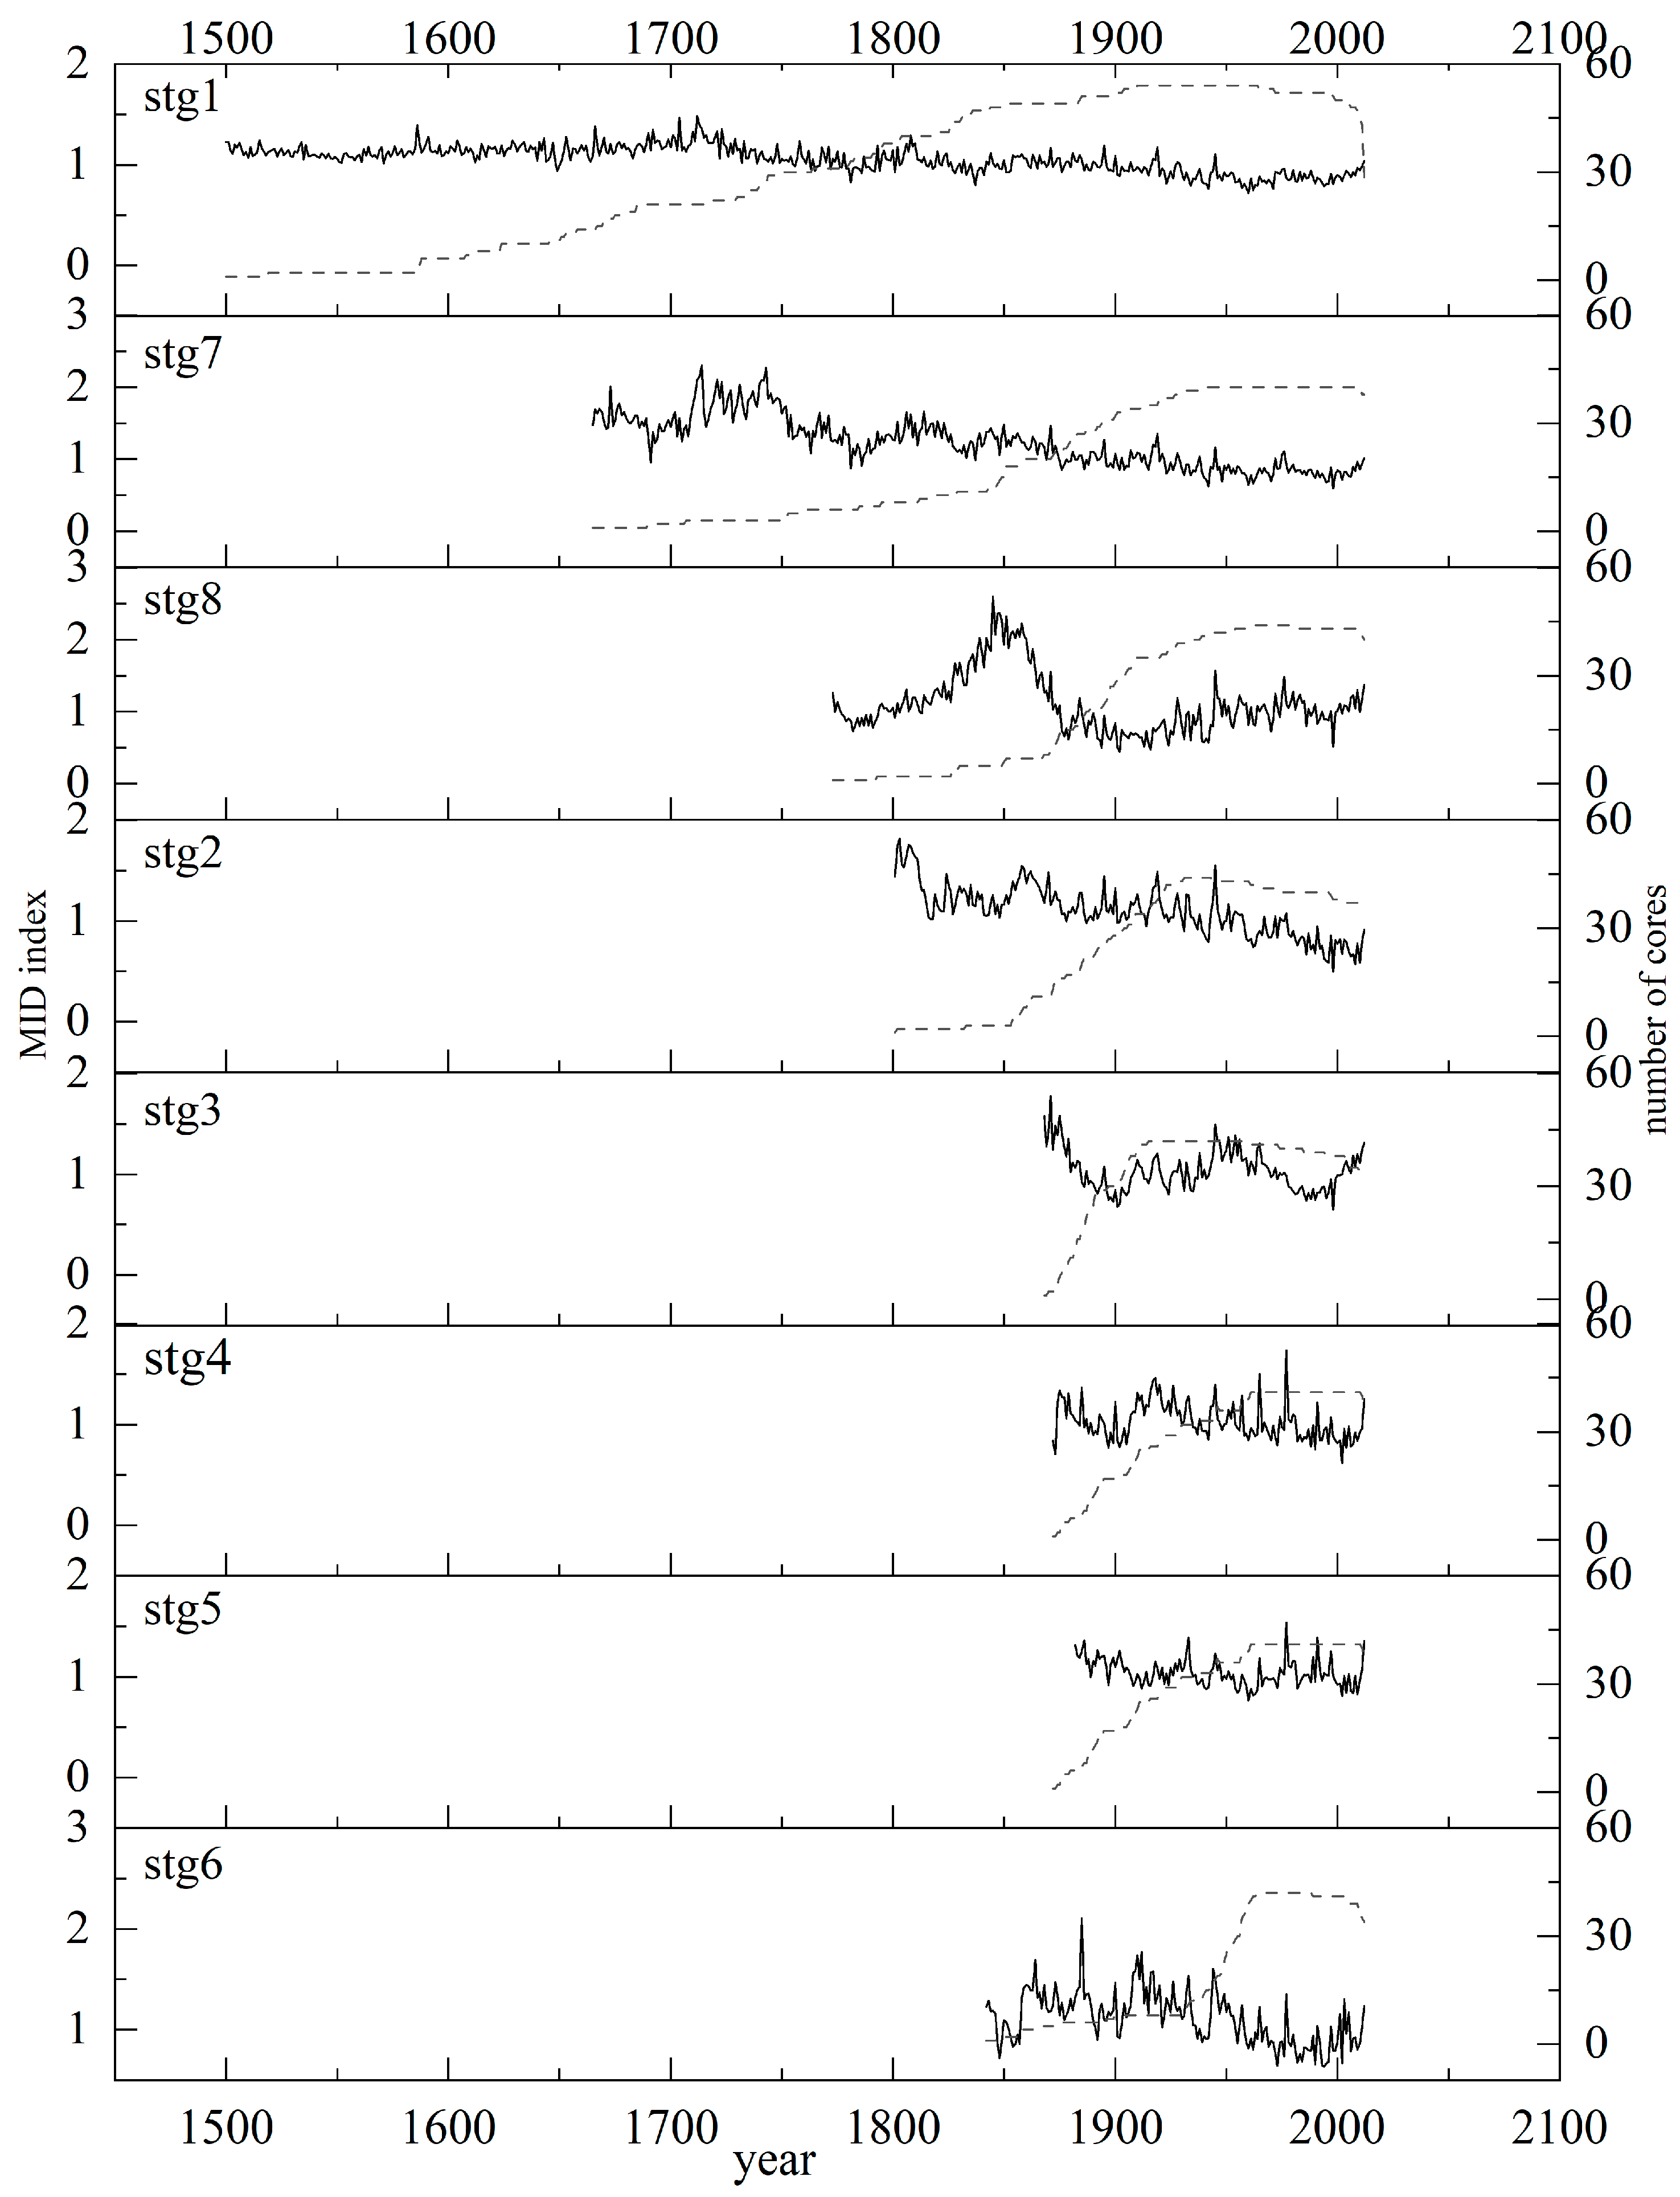
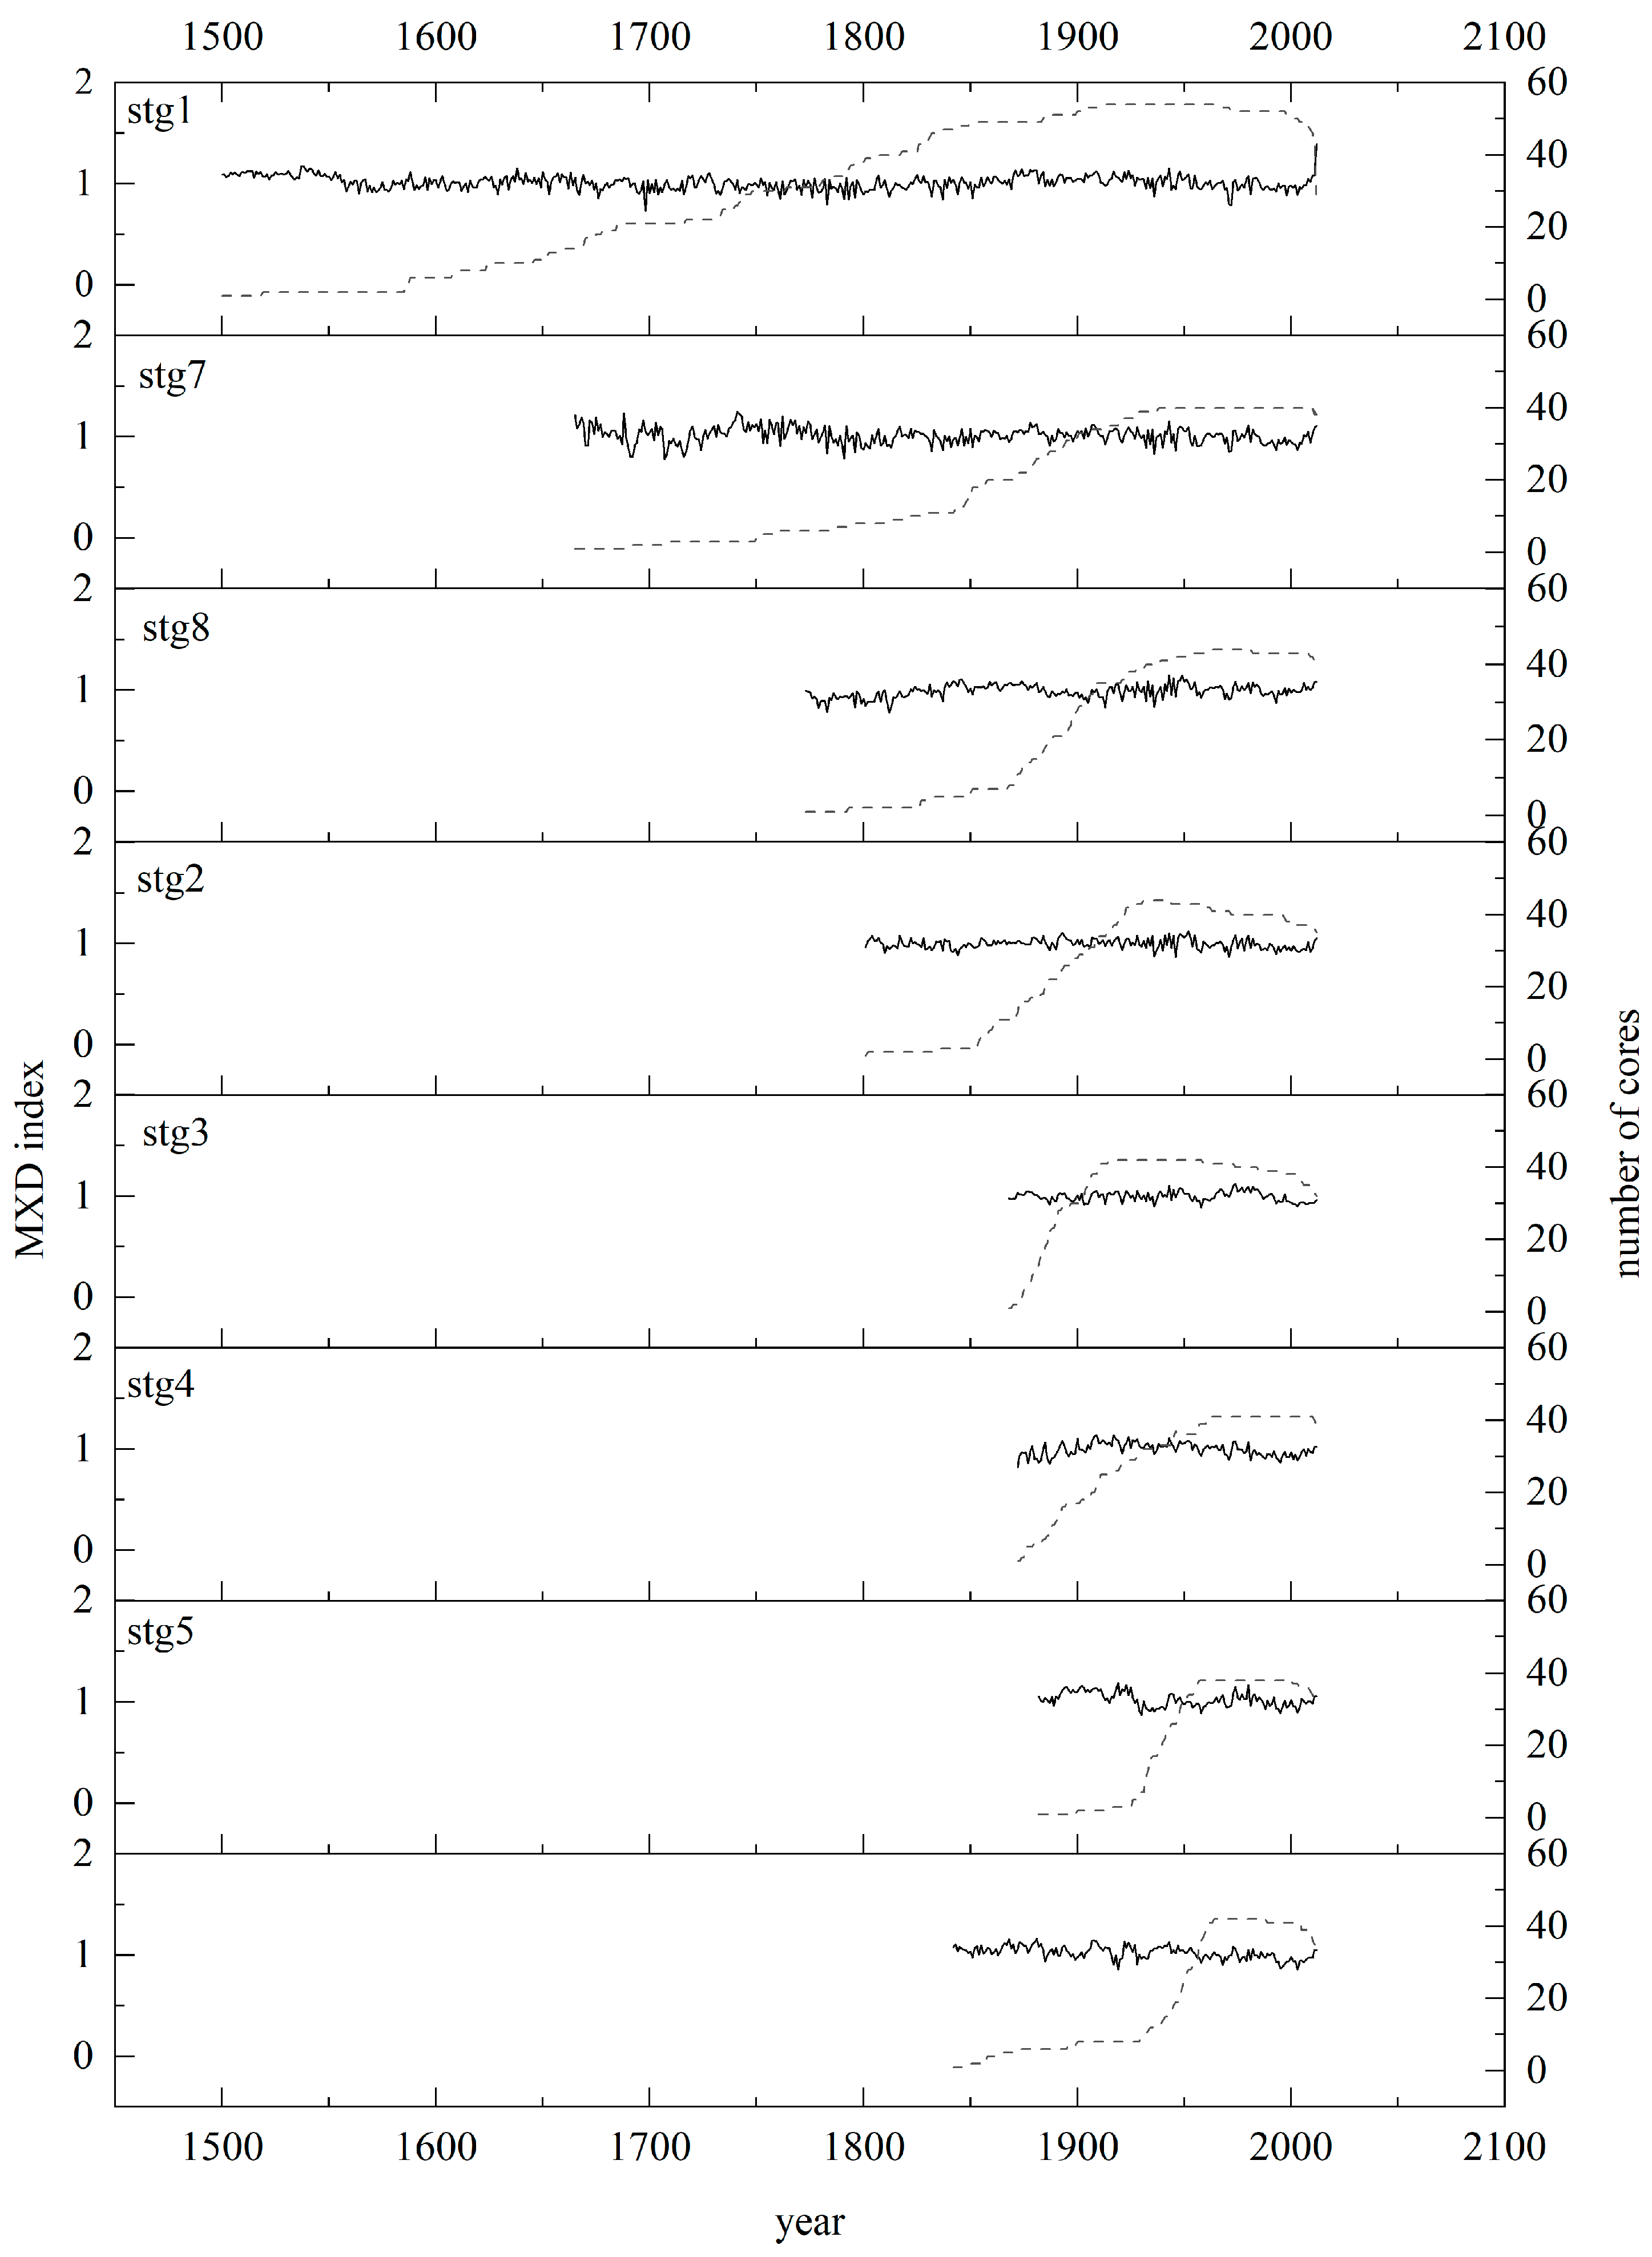
2.2. Tree-Ring Data
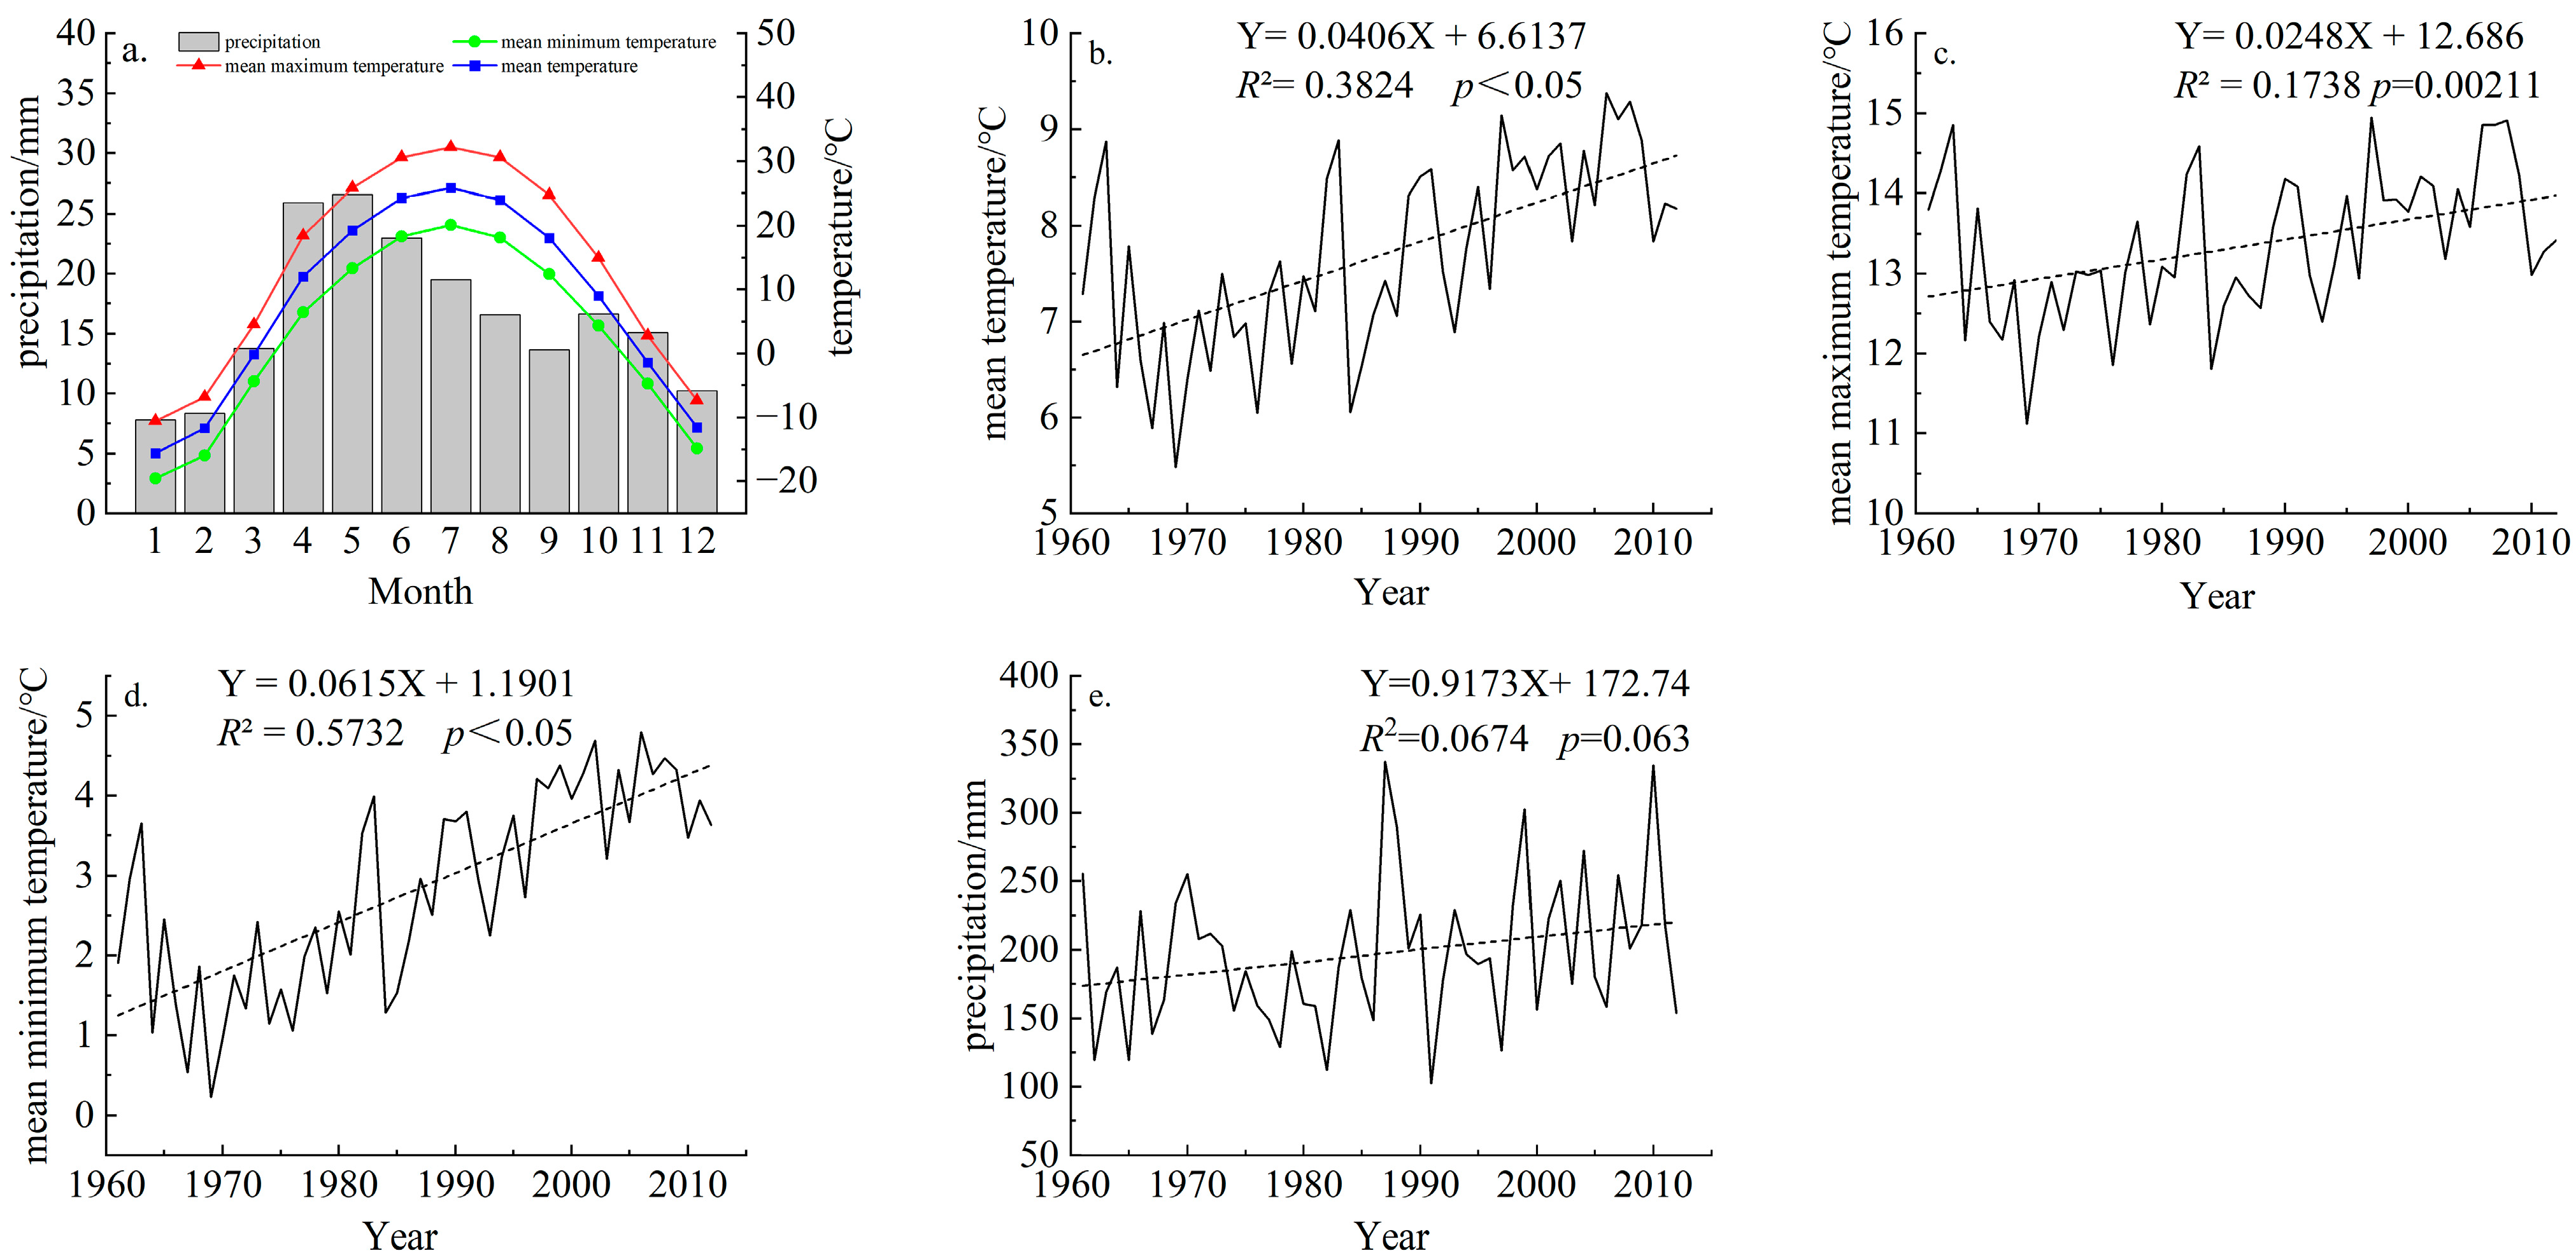
2.3. Meteorological Data
2.4. NDVI Data
2.5. Statistical Analyses
3. Results
3.1. Statistical Characteristics of Chronologies
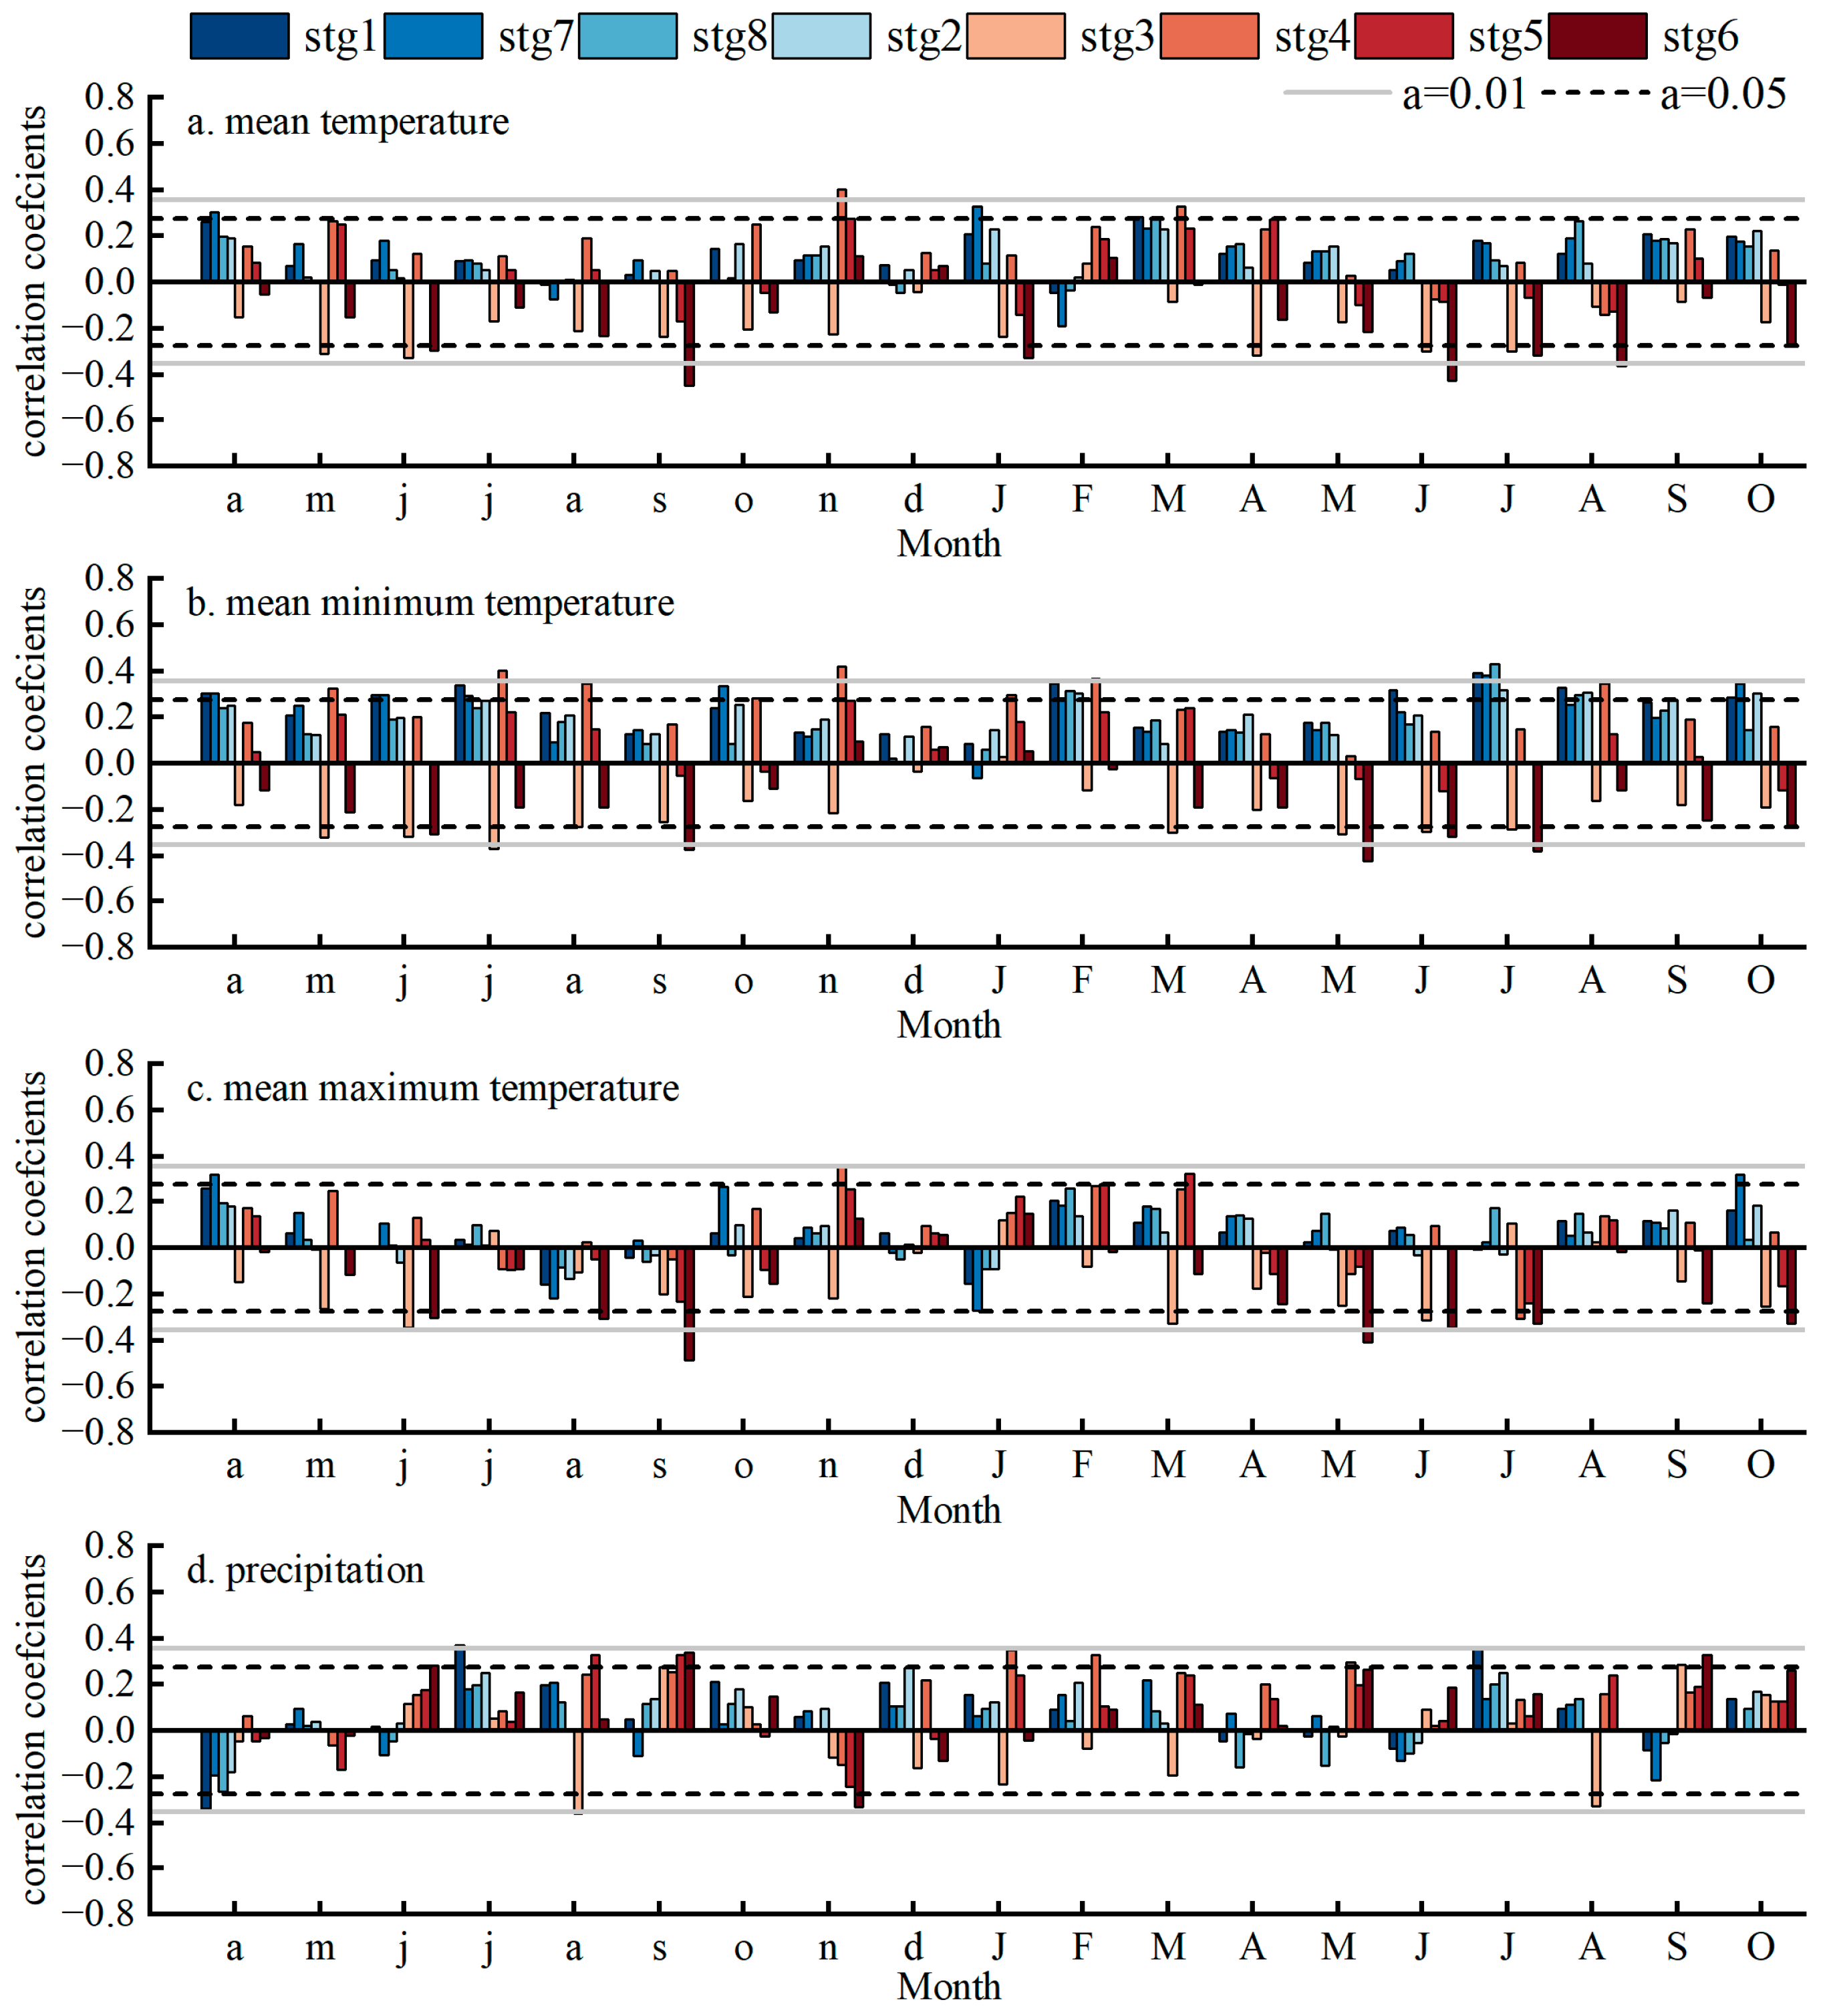
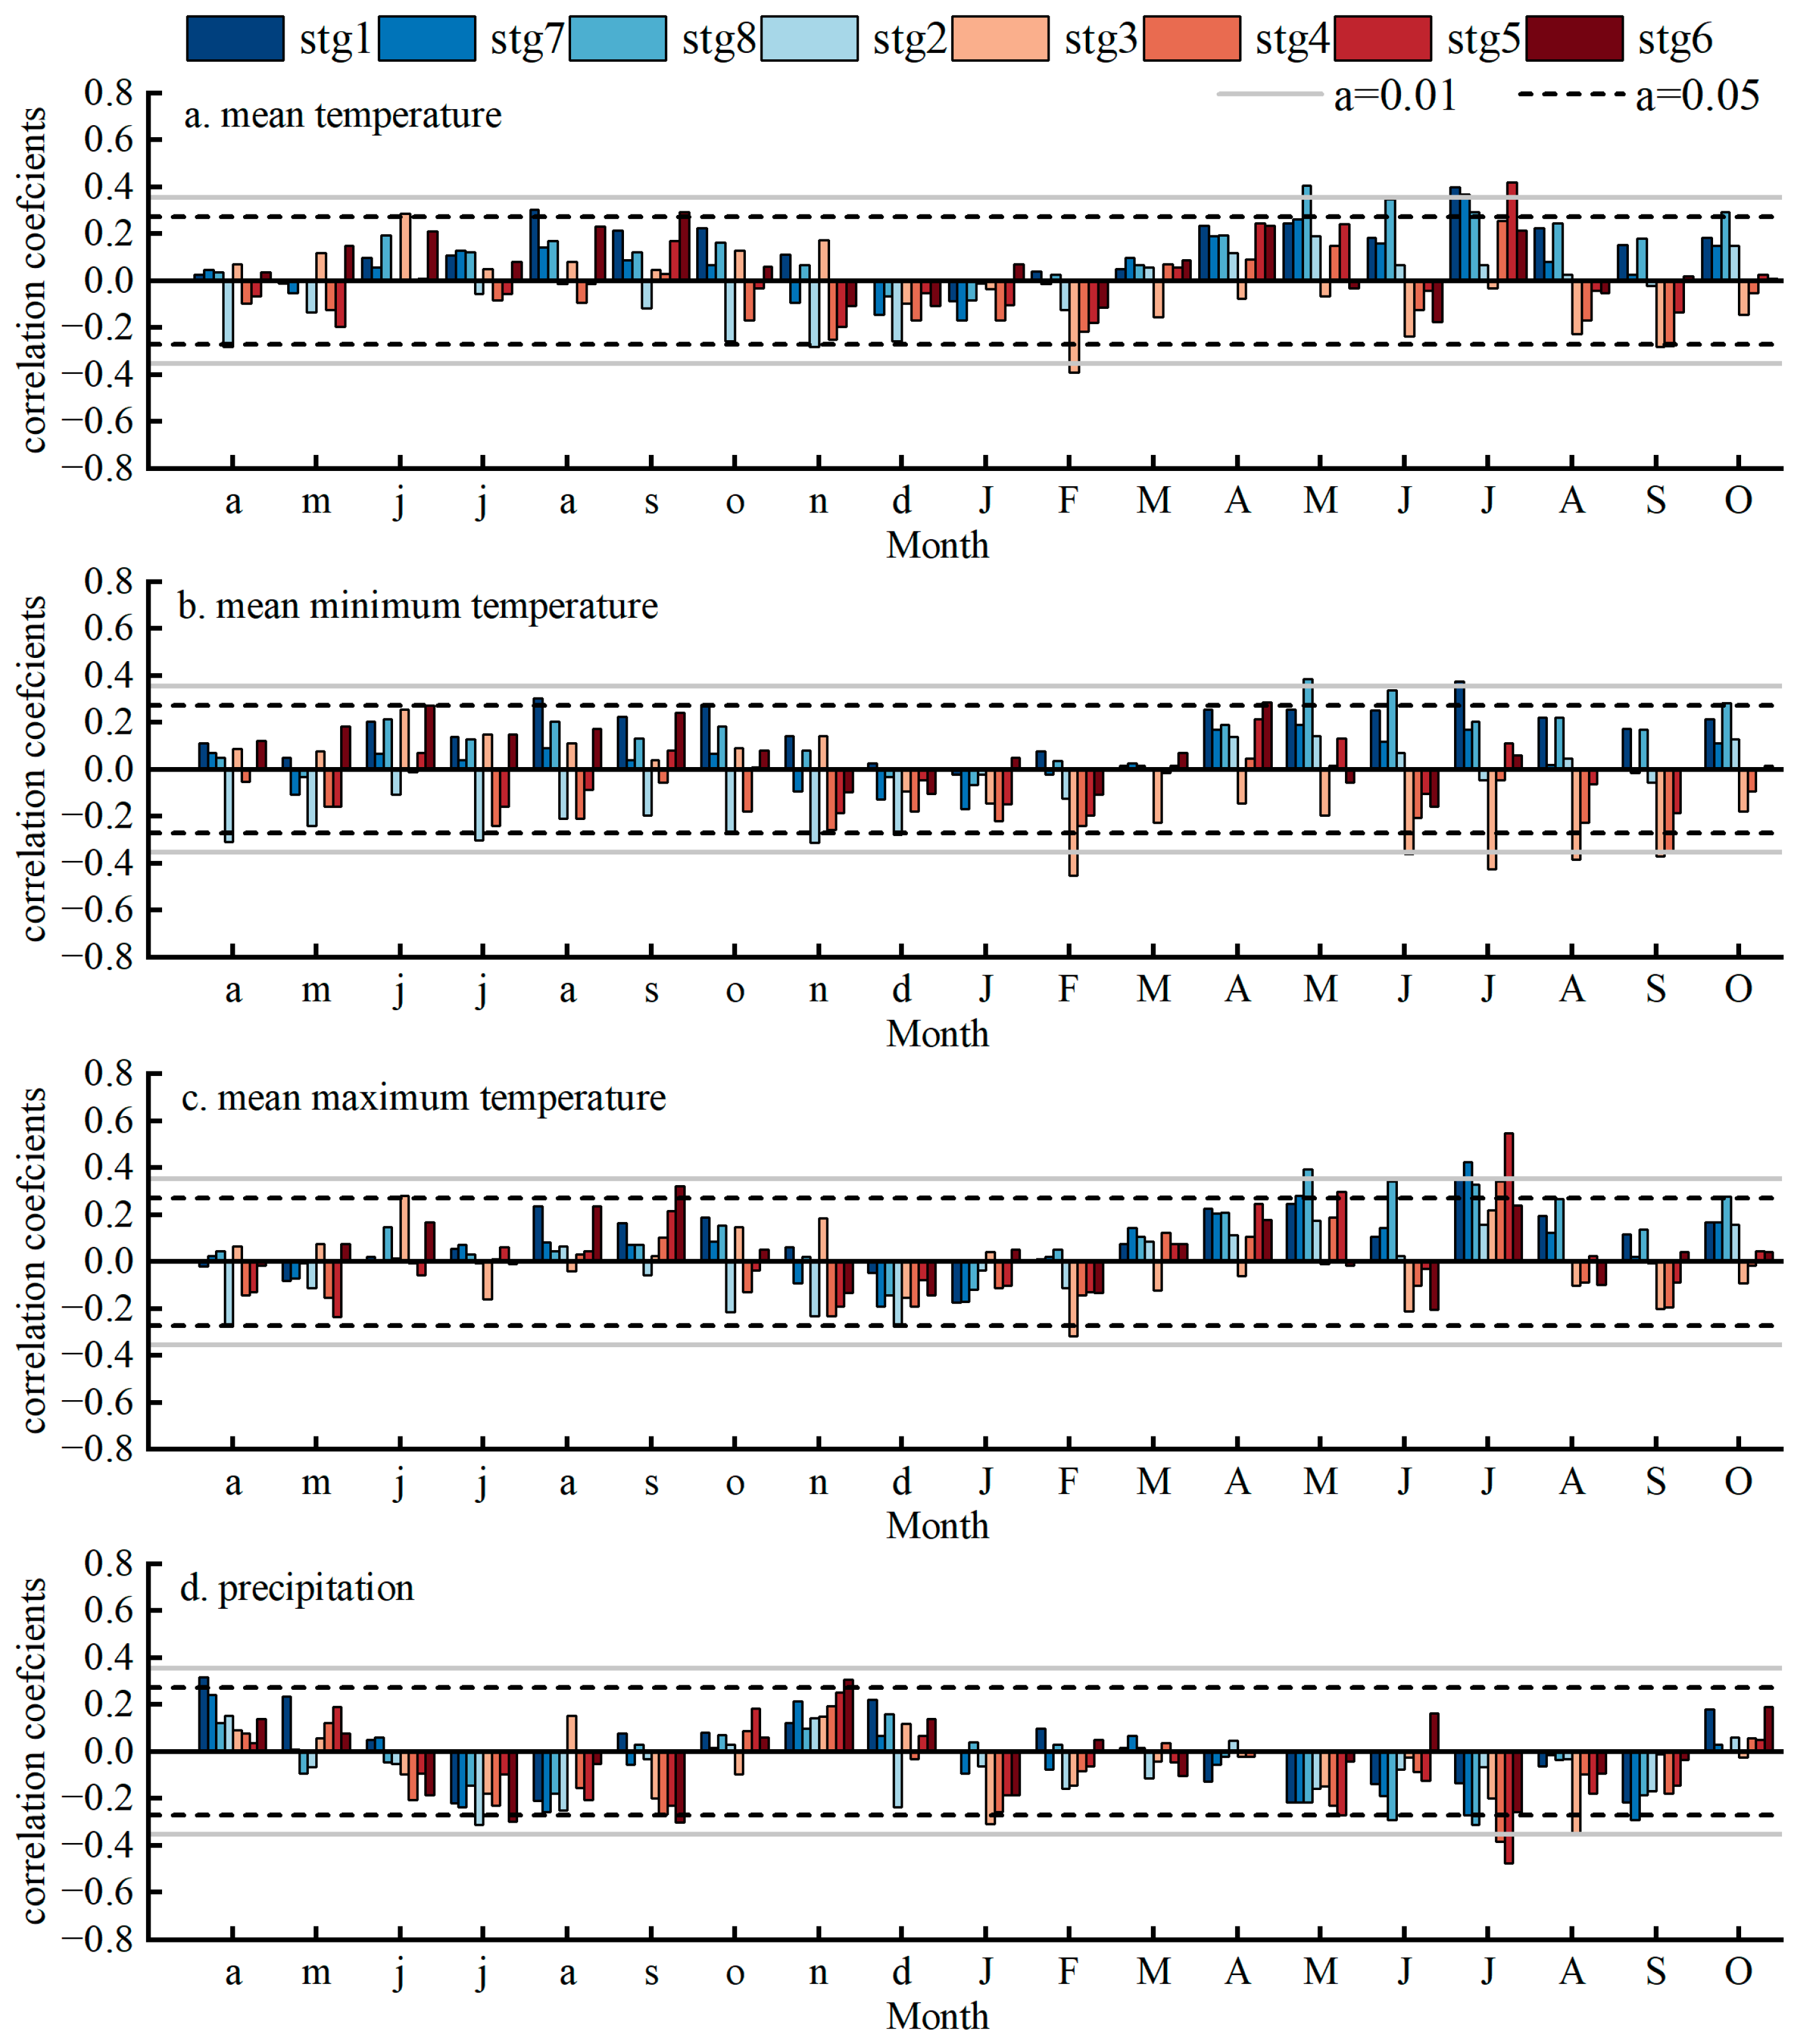
3.2. Effects of Temperature and Precipitation on Forest Growth
3.3. Relationships between Tree-Ring Parameters and NDVI
4. Discussion
4.1. Factors Affecting the Relationships between Tree-Ring Parameters and NDVI
4.2. Relationships between Tree-Ring Parameters and NDVI with Different Spatial Resolutions
5. Conclusions
Author Contributions
Funding
Data Availability Statement
Conflicts of Interest
References
- Berner, L.T.; Beck, P.S.A.; Bunn, A.G.; Goetz, S.J. Plant response to climate change along the forest-tundra ecotone in northeastern Siberia. Glob. Chang. Biol. 2013, 19, 3449–3462. [Google Scholar] [CrossRef] [PubMed]
- Camarero, J.J.; Gutiérrez, E. Wood density of silver fir reflects drought and cold stress across climatic and biogeographic gradients. Dendrochronologia 2017, 45, 101–112. [Google Scholar] [CrossRef]
- Babst, F.; Bouriaud, O.; Papale, D.; Gielen, B.; Janssens, I.A.; Nikinmaa, E.; Ibrom, A.; Wu, J.; Bernhofer, C.; Kostner, B.; et al. Above-ground woody carbon sequestration measured from tree rings is coherent with net ecosystem productivity at five eddy-covariance sites. New Phytolodist. 2014, 201, 1289–1303. [Google Scholar] [CrossRef] [PubMed]
- Van Breugel, M.; Ransijn, J.; Craven, D.; Bongers, F.; Hall, J.S. Estimating carbon stock in secondary forests: Decisions and uncertainties associated with allometric biomass models. For. Ecol. Manag. 2011, 262, 1648–1657. [Google Scholar] [CrossRef]
- Miyeni, R.B.; Hall, F.G.; Sellers, P.J.; Marshak, A.L. The interpretation of spectral vegetation indexes. IEEE Trans. Geosci. Remote Sens. 1995, 33, 481–486. [Google Scholar]
- Erasmi, S.; Klinge, M.; Dulamsuren, C.; Schneider, F.; Hauck, M. Modelling the productivity of Siberian larch forests from Landsat NDVI time series in fragmented forest stands of the Mongolian forest-steppe. Environ. Monit. Assess. 2021, 193, 200. [Google Scholar] [CrossRef]
- Levesque, M.; Andreu-Hayles, L.; Smith, W.K.; Williams, A.P.; Hobi, M.L.; Allred, B.W.; Pederson, N. Tree-ring isotopes capture interannual vegetation productivity dynamics at the biome scale. Nat. Commun. 2019, 10, 742. [Google Scholar] [CrossRef]
- Zhang, T.; Zhang, R.; Lu, B.; Mambetov, B.T.; Kelgenbayev, N.; Dosmanbetov, D.; Maisupova, B.; Chen, F.; Yu, S.; Shang, H.; et al. Picea schrenkiana tree-ring chronologies development and vegetation index reconstruction for the Alatau Mountains, Central Asia. Geochronometria 2018, 45, 107–118. [Google Scholar] [CrossRef]
- Camarero, J.J.; Franquesa, M.; Sangüesa-Barreda, G. Timing of drought triggers distinct growth responses in holm oak: Implications to predict warming-induced forest defoliation and growth decline. Forests 2015, 6, 1576–1597. [Google Scholar] [CrossRef]
- Wang, M.Y.; Luo, Y.; Zhang, Z.Y. Recent advances in remote sensing of vegetation phenology: Retrieval algorithm and validation strategy. Natl. Remote Sens. Bull. 2020, 26, 431–455. [Google Scholar] [CrossRef]
- Rouse, J.W.; Haas, R.H.; Schell, J.A. Monitoring vegetation systems in the Great Plains with ERTS. In Third Earth Resources Technology Satellite-1 Symposium, Proceedings of a Symposium, Goddard Space Flight Center, Washington, DC, USA, 10–14 December 1973; NASA: Washington, DC, USA, 1974; Volume 351, pp. 309–317. [Google Scholar]
- Huete, A.; Didan, K.; Miura, T. Overview of the radiometric and biophysical performance of the MODIS vegetation indices. Remote Sens. Environ. 2002, 83, 195–213. [Google Scholar] [CrossRef]
- Kauth, R.J.; Thomas, G.S. The tasselled cap a graphic description of the spectra temporal development of agriculture crops as seen by Landsat. In Proceedings of the 2nd International Symposium on Machine Processing of Remotely Sensed Data, West Lafayette, IN, USA, 29 June–1 July 1976. [Google Scholar]
- Lopatin, E.; Kolström, T.; Spiecker, H. Determination of forest growth trends in Komi Republic (northwestern Russia): Combination of tree-ring analysis and remote sensing data. Boreal Environ. Res. 2006, 11, 341–353. [Google Scholar]
- Liang, E.Y.; Eckstein, D. Dendrochronological Potential of the Alpine Shrub Rhododendron nivale on the South-Eastern Tibetan Plateau. Ann. Bot. 2009, 104, 665–670. [Google Scholar] [CrossRef] [PubMed]
- Pettorelli, N.; Vik, J.O.; Mysterud, A.; Gaillard, J. Using the satellite-derived NDVI to assess ecological responses to environmental change. Trends Ecol. Evol. 2005, 20, 503–510. [Google Scholar] [CrossRef] [PubMed]
- Gamon, J.A.; Kovalchuck, O.; Wong, C.Y.S. Monitoring seasonal and diurnal changes in photosynthetic pigments with automated PRI and NDVI sensors. Biogeosciences 2015, 12, 4149–4159. [Google Scholar] [CrossRef]
- Furusawa, T.; Koera, T.; Siburian, R.; Wicaksono, A.; Matsudaira, K.; Yoshinori, I. Time-series analysis of satellite imagery for detecting vegetation cover changes in Indonesia. Sci. Rep. 2023, 13, 8437. [Google Scholar] [CrossRef]
- Mao, D.; Wang, Z.M.; Luo, L.; Ren, C.Y. Integrating AVHRR and MODIS data to monitor NDVI changes and their relationships with climatic parameters in Northeast China. Int. J. Appl. Earth Obs. Geoinf. 2012, 18, 528–536. [Google Scholar] [CrossRef]
- Vivar-Vivar, E.D.; Pompa-García, M.; Rodríguez-Trejo, D.A.; Leyva-Ovalle, A.; Wehenkel, C.; Carrillo-Parra, A.; García-Montiel, E.; Moreno-Anguiano, O. Drought responsiveness in two Mexican conifer species forming young stands at high elevations. For. Syst. 2021, 30, e012. [Google Scholar] [CrossRef]
- Fensholt, R.; Proud, S.R. Evaluation of Earth Observation based global long term vegetation trends Comparing GIMMS and MODIS global NDVI time series. Remote Sens. Environ. 2012, 199, 131–147. [Google Scholar] [CrossRef]
- Huang, S.; Tang, L.N.; Hupy, J.P.; Wang, Y.; Shao, G.F. A commentary review on the use of normalized difference vegetation index (NDVI) in the era of popular remote sensing. J. For. Res. 2020, 32, 1–6. [Google Scholar] [CrossRef]
- Decuyper, M.; Chávez, R.O.; Cufar, K.; Estay, S.A.; Clevers, J.G.P.W.; Prislan, P.; Gricar, J.; Crepinsek, Z.; Merela, M.; de Luis, M. Spatio-temporal assessment of beech growth in relation to climate extremes in Slovenia—An integrated approach using remote sensing and tree-ring data. Agric. For. Meteorol. 2020, 287, 107925. [Google Scholar] [CrossRef]
- Andreu-Hayles, L.; Gaglioti, B.V.; Berner, L.T.; Levesque, M.; Anchukaitis, K.J.; Goetz, S.; D’Arrigo, R. A narrow window of summer temperatures associated with shrub growth in Arctic Alaska. Environ. Res. Lett. 2020, 15, 105012. [Google Scholar] [CrossRef]
- Bonney, M.T.; He, Y.H. Temporal connections between long-term Landsat time-series and tree-rings in an urban–rural temperate forest. Int. J. Appl. Earth Obs. Geoinf. 2021, 103, 102523. [Google Scholar] [CrossRef]
- Tonelli, E.; Vitali, A.; Malandra, F.; Camarero, J.J.; Colangelo, M.; Nole, A.; Ripullone, F.; Carrer, M.; Urbinati, C. Tree-ring and remote sensing analyses uncover the role played by elevation on European beech sensitivity to late spring frost. Sci. Total Environ. 2023, 857, 159239. [Google Scholar] [CrossRef]
- Kaufmann, R.K.; D’arrigo, R.D.; Paletta, L.F.; Tian, H.Q.; Jolly, W.M.; Myneni, R.B. Identifying climatic controls on ring width: The timing of Correlations between The Timing Rings and NDVI. Earth Interact. 2008, 12, 114. [Google Scholar] [CrossRef]
- Wu, Q.Q.; Zhang, X.; Xu, S.X.; Yang, X.H.; Liu, Y.S.; Li, H.Z.; Shi, Z.J. Climatic responses of NDVI and tree growth in the arid areas of inland Asia and their influencing factors. J. Desert Res. 2022, 42, 1–10. [Google Scholar]
- Vicente-Serrano, S.M.; Martin-Hernandez, N.; Camarero, J.J.; Gazol, A.; Sanchez-Salguero, R.; Pena-Gallardo, M.; El Kenawy, A.; Dominguez-Castro, F.; Tomas-Burguera, M.; Gutierrez, E.; et al. Linking tree-ring growth and satellite-derived gross primary growth in multiple forest biomes. Tempor-Scale Matters. Ecol. Indic. 2020, 108, 105753. [Google Scholar] [CrossRef]
- Bhuyan, U.; Zang, C.; Vicente-Serrano, S.M.; Menzel, A. Exploring relationships among tree-ring growth, climate variability, and seasonal leaf activity on varying timescales and spatial resolutions. Remote Sens. 2017, 9, 526. [Google Scholar] [CrossRef]
- Vicente-Serrano, S.M.; Camarero, J.J.; Olano, J.M.; Martin-Hernandez, N.; Pena-Gallardo, M.; Tomas-Burguera, M.; Gazol, A.; Azorin-Molina, C.; Bhuyan, U.; El Kenawy, A.A. Diverse relationships between forest growth and the Normalized Difference Vegetation Index at a global scale. Remote Sens. Environ. 2016, 187, 14–29. [Google Scholar] [CrossRef]
- Brehaut, L.; Danby, R.K. Inconsistent relationships between annual tree ring-widths and satellite-measured NDVI in a mountainous subarctic environment. Ecol. Indic. 2018, 91, 698–711. [Google Scholar] [CrossRef]
- Coulthard, B.L.; Touchan, R.; Anchukaitis, K.J.; Meko, D.M.; Sivrikaya, F. Tree growth and vegetation activity at the ecosystem-scale in the eastern Mediterranean. Environ. Res. Lett. 2017, 12, 084008. [Google Scholar] [CrossRef]
- Wen, Y.; Jiang, Y.; Jiao, L.; Hou, C.X.; Xu, H. Inconsistent relationships between tree ring width and normalized difference vegetation index in montane evergreen coniferous forests in arid regions. Trees 2022, 36, 379–391. [Google Scholar] [CrossRef]
- Yuan, K.Y.; Xu, H.L.; Zhang, G.P. Is There Spatial and Temporal Variability in the Response of Plant Canopy and Trunk Growth to Climate Change in a Typical River Basin of Arid Areas. Water 2022, 14, 1573. [Google Scholar] [CrossRef]
- Speer, J.H. Fundamentals of Tree-Ring Research; The University of Arizona Press: Tucson, AZ, USA, 2010. [Google Scholar]
- Holmes, R.L. Computer-assisted quality control in tree-ring dating and measurement. Tree Ring Bull. 1983, 43, 68–78. [Google Scholar]
- Cook, E.R. A Time Series Analysis Approach to Tree-Ring Standardization; The University of Arizona: Tucson, AZ, USA, 1985. [Google Scholar]
- Fritts, H.C. Tree Rings and Climate; Academic Press: London, UK, 1976; p. 567. [Google Scholar]
- Cook, E.R.; Krusic, P.J. Program ARSTAN: A Tree-Ring Standardization Program Based on Detrending and Autoregressive Time Series Modeling, with Interactive Graphics; Lamont-Doherty Earth Observatory, Columbia University: New York, NY, USA, 2005; p. 5. [Google Scholar]
- Wigley, T.M.L.; Briffa, K.R.; Jones, P.D. On the average value of correlated time series, with applications in dendroclimatology and hydrometeorology. J. Clim. Appl. Meteorol. 1984, 23, 201–213. [Google Scholar] [CrossRef]
- Wang, Z. Plant Physiology; China Agriculture Press: Beijing, China, 2010; pp. 314–368. [Google Scholar]
- Jiao, L.; Ma, L.; Zhang, T.W.; Wang, S.J. Changes of mean minimum temperature in June–July since 1798 in central Altay Mountain recorded by tree rings. Acta Ecol. Sin. 2021, 41, 1944–1958. [Google Scholar]
- Shang, J.X.; Shi, Z.J.; Gao, J.X.; Xu, L.H.; Lü, S.H.; Feng, C.Y.; Wang, L.X. Response of tree-ring width of Pinus sylvestris var. mongolica to climate change in Hulunbuir sand land, China. Acta Ecol. Sin. 2012, 32, 1077–1084. [Google Scholar] [CrossRef]
- Zhang, Q.; Yu, R.D.; Zheng, H.W. Response Analysis of Larix sibirica to Climate Warming at Different Elevations in the Eastern Tianshan Mountains. Bull. Bot. Res. 2018, 38, 14–25. [Google Scholar]
- Chen, F.; Yuan, Y.; Wei, W. Chronology development and climate response analysis of Schrenk Spruce (Picea schrenkiana) tree-ring parameters in the Urumqi River basin, China. Geochronometria 2010, 36, 17–22. [Google Scholar] [CrossRef]
- Hauck, M.; Klinge, M.; Erasmi, S.; Dulamsuren, C. No Signs of Long-term Greening Trend in Western Mongolian Grasslands. Ecosystems 2023. [Google Scholar] [CrossRef]
- Xu, P.P.; Fang, W.; Zhou, T.; Zhao, X.; Luo, H.; Hendrey, G.; Yi, C.X. Spatial Upscaling of Tree-Ring-Based Forest Response to Drought with Satellite Data. Remote Sens. 2019, 11, 2344. [Google Scholar] [CrossRef]
- Correa-Díaz, A.; Gómez-Guerrero, A.; Vargas-Hernández, J.J.; Rozenberg, P.; Horwath, W.R. Long-term wood micro-density variation in alpine forests at Central México and their spatial links with remotely sensed information. Forests 2020, 11, 452. [Google Scholar] [CrossRef]
- Andreu-Hayles, L.; D’Arrigo, R.; Anchukaitis, K.J.; Beck, P.S.A.; Frank, D.; Goetz, S. Varying boreal forest response to Arctic environmental change at the Firth River, Alaska. Environ. Res. Lett. 2011, 6, 045503. [Google Scholar] [CrossRef]
- D’Arrigo, R.D.; Malmstrom, C.M.; Jacoby, G.C.; Jacoby, G.C.; Los, S.O.; Bunker, D.E. Correlation between Maximum Latewood Density of Annual Tree Rings and NDVI Based Estimates of Forest Productivity. Int. J. Remote Sens. 2000, 21, 2329–2336. [Google Scholar] [CrossRef]
- Bunn, A.G.; Hughes, M.K.; Kirdyanov, A.V.; Losleben, M.; Shishov, V.V.; Berner, L.; Oltchev, A.; Vaganov, E.A. Comparing forest measurements from tree rings and a space-based index of vegetation activity in Siberia. Environ. Res. Lett. 2013, 8, 035034. [Google Scholar] [CrossRef]
- Mašek, J.; Tumajer, J.; Lange, J.; Kaczka, R.; Fiser, P.; Treml, V. Variability in Tree-ring Width and NDVI Responses to Climate at a Landscape Level. Ecosystems 2023. [Google Scholar] [CrossRef]
- Huo, Y.X.; Gou, X.H.; Liu, W.H. Climate–growth relationships of Schrenk spruce (Picea schrenkiana) along an altitudinal gradient in the western Tianshan mountains, northwest China. Trees 2017, 31, 429–439. [Google Scholar] [CrossRef]
- Jiao, L.; Jiang, Y.; Wang, M.C. Responses to climate change in radial growth of Picea schrenkiana along elevations of the eastern Tianshan Mountains, northwest China. Dendrochronologia 2016, 40, 117–127. [Google Scholar] [CrossRef]


| Site | Latitude (N) | Longitude (E) | Elevation (m) | Aspect | Slope (°) | Canopy Density | No. of Trees/Cores |
|---|---|---|---|---|---|---|---|
| stg 1 | 43°52′59.5″ | 85°30′56.1″ | 2606 | N | 47 | 0.1 | 27/54 |
| stg 7 | 43°53′02.7” | 85°31′11.7″ | 2531 | NW | 40 | 0.3 | 20/40 |
| stg 8 | 43°53′06.63” | 85°31′09.46″ | 2400 | NE | 35 | 0.5 | 22/44 |
| stg 2 | 43°53′11.5″ | 85°31′4.4″ | 2318 | NE | 35 | 0.3 | 22/44 |
| stg 3 | 43°53′25.6″ | 85°31′4.8″ | 2206 | NE | 20 | 0.3 | 21/42 |
| stg 4 | 43°53′54.7″ | 85°31′0.8″ | 2095 | ENE | 45 | 0.2 | 21/41 |
| stg 5 | 43°54′10.3″ | 85°31′11.4″ | 1942 | NNW | 20 | 0.3 | 19/38 |
| stg 6 | 43°54′42.2″ | 85°31′17.2″ | 1761 | N | 30 | 0.2 | 21/42 |
| Statistic | stg 1 | stg 7 | stg 8 | stg 2 | stg 3 | stg 4 | stg 5 | stg 6 |
|---|---|---|---|---|---|---|---|---|
| Chronology length | 513 | 350 | 242 | 213 | 146 | 142 | 132 | 172 |
| Mean index (MI) | 0.842 | 0.744 | 0.796 | 0.801 | 1.007 | 1.039 | 1.148 | 0.919 |
| Mean sensitivity (MS) | 0.159 | 0.166 | 0.121 | 0.152 | 0.119 | 0.268 | 0.236 | 0.262 |
| Standard deviation (SD) | 0.339 | 0.368 | 0.332 | 0.377 | 0.278 | 0.384 | 0.538 | 0.302 |
| First-order autocorrelation (AC1) | 0.878 | 0.911 | 0.931 | 0.911 | 0.849 | 0.564 | 0.818 | 0.556 |
| Mean within-tree correlation | 0.474 | 0.645 | 0.640 | 0.533 | 0.569 | 0.719 | 0.664 | 0.645 |
| Signal-to-noise ratio (SNR) | 11.357 | 10.694 | 19.295 | 12.305 | 19.921 | 14.796 | 7.721 | 17.032 |
| Expressed population signal (EPS) | 0.919 | 0.914 | 0.951 | 0.925 | 0.952 | 0.937 | 0.885 | 0.945 |
| The first principal component (PC#1) | 30.3 | 38.6 | 48.9 | 58.1 | 47.7 | 41.0 | 29.6 | 49.5 |
| First year of SSS > 0.85 | 1646 | 1819 | 1851 | 1861 | 1875 | 1886 | 1932 | 1900 |
| Statistic | stg 1 | stg 7 | stg 8 | stg 2 | stg 3 | stg 4 | stg 5 | stg 6 |
|---|---|---|---|---|---|---|---|---|
| Chronology length | 513 | 350 | 242 | 213 | 146 | 142 | 132 | 172 |
| Mean index (MI) | 1.056 | 1.228 | 1.108 | 1.099 | 1.036 | 1.029 | 1.039 | 1.114 |
| Mean sensitivity (MS) | 0.064 | 0.105 | 0.149 | 0.102 | 0.097 | 0.136 | 0.101 | 0.141 |
| Standard deviation (SD) | 0.128 | 0.352 | 0.416 | 0.260 | 0.202 | 0.185 | 0.135 | 0.261 |
| First-order autocorrelation (AC1) | 0.755 | 0.889 | 0.883 | 0.817 | 0.743 | 0.416 | 0.434 | 0.669 |
| Mean within-tree correlation | 0.318 | 0.368 | 0.377 | 0.321 | 0.316 | 0.406 | 0.436 | 0.462 |
| Signal-to-noise ratio (SNR) | 8.891 | 5.679 | 5.140 | 4.742 | 5.879 | 16.250 | 6.235 | 5.645 |
| Expressed population signal (EPS) | 0.899 | 0.850 | 0.837 | 0.826 | 0.855 | 0.942 | 0.862 | 0.850 |
| The first principal component (PC#1) | 30.9 | 29.2 | 30.7 | 26.3 | 33.2 | 42.4 | 25.0 | 25.4 |
| First year of SSS > 0.85 | 1651 | 1847 | 1872 | 1874 | 1882 | 1884 | 1933 | 1934 |
| Statistic | stg 1 | stg 7 | stg 8 | stg 2 | stg 3 | stg 4 | stg 5 | stg 6 |
|---|---|---|---|---|---|---|---|---|
| Chronology length | 513 | 350 | 242 | 213 | 146 | 142 | 132 | 172 |
| Mean index (MI) | 47 | 40 | 35 | 35 | 20 | 45 | 20 | 30 |
| Mean sensitivity (MS) | 0.057 | 0.070 | 0.051 | 0.047 | 0.036 | 0.046 | 0.045 | 0.044 |
| Standard deviation (SD) | 0.070 | 0.083 | 0.066 | 0.053 | 0.049 | 0.065 | 0.072 | 0.064 |
| First-order autocorrelation (AC1) | 0.392 | 0.351 | 0.480 | 0.233 | 0.543 | 0.590 | 0.670 | 0.595 |
| Mean within-tree correlation | 0.430 | 0.398 | 0.490 | 0.412 | 0.396 | 0.405 | 0.381 | 0.335 |
| Signal-to-noise ratio (SNR) | 9.884 | 9.295 | 8.979 | 13.395 | 11.008 | 9.406 | 5.901 | 5.157 |
| Expressed population signal (EPS) | 0.908 | 0.903 | 0.900 | 0.931 | 0.917 | 0.904 | 0.855 | 0.838 |
| The first principal component (PC#1) | 29.4 | 30.5 | 37.3 | 38.5 | 37.1 | 33.8 | 23.9 | 25.0 |
| First year of SSS > 0.85 | 1651 | 1819 | 1874 | 1858 | 1879 | 1888 | 1933 | 1934 |
Disclaimer/Publisher’s Note: The statements, opinions and data contained in all publications are solely those of the individual author(s) and contributor(s) and not of MDPI and/or the editor(s). MDPI and/or the editor(s) disclaim responsibility for any injury to people or property resulting from any ideas, methods, instructions or products referred to in the content. |
© 2023 by the authors. Licensee MDPI, Basel, Switzerland. This article is an open access article distributed under the terms and conditions of the Creative Commons Attribution (CC BY) license (https://creativecommons.org/licenses/by/4.0/).
Share and Cite
Song, J.; Zhang, T.; Fan, Y.; Liu, Y.; Yu, S.; Jiang, S.; Guo, D.; Hou, T.; Guo, K. Evaluating the Effect of Vegetation Index Based on Multiple Tree-Ring Parameters in the Central Tianshan Mountains. Forests 2023, 14, 2362. https://doi.org/10.3390/f14122362
Song J, Zhang T, Fan Y, Liu Y, Yu S, Jiang S, Guo D, Hou T, Guo K. Evaluating the Effect of Vegetation Index Based on Multiple Tree-Ring Parameters in the Central Tianshan Mountains. Forests. 2023; 14(12):2362. https://doi.org/10.3390/f14122362
Chicago/Turabian StyleSong, Jinghui, Tongwen Zhang, Yuting Fan, Yan Liu, Shulong Yu, Shengxia Jiang, Dong Guo, Tianhao Hou, and Kailong Guo. 2023. "Evaluating the Effect of Vegetation Index Based on Multiple Tree-Ring Parameters in the Central Tianshan Mountains" Forests 14, no. 12: 2362. https://doi.org/10.3390/f14122362
APA StyleSong, J., Zhang, T., Fan, Y., Liu, Y., Yu, S., Jiang, S., Guo, D., Hou, T., & Guo, K. (2023). Evaluating the Effect of Vegetation Index Based on Multiple Tree-Ring Parameters in the Central Tianshan Mountains. Forests, 14(12), 2362. https://doi.org/10.3390/f14122362