Article

Distinct Impact of Drought on Radial Growth at Different Heights and Parts of Populus euphratica in the Oasis at the Hinterland of the Taklimakan Desert

1
College of Ecology and Environment, Xinjiang University, Urumqi 830017, China
2
Key Laboratory of Oasis Ecology, Xinjiang University, Urumqi 830017, China
3
College of Geography and Remote Sensing Science, Xinjiang University, Urumqi 830017, China
*
Author to whom correspondence should be addressed.
Forests 2023, 14(12), 2338; https://doi.org/10.3390/f14122338
Submission received: 16 October 2023 / Revised: 14 November 2023 / Accepted: 20 November 2023 / Published: 29 November 2023
(This article belongs to the Special Issue Response of Tree Rings to Climate Change and Climate Extremes)

Abstract

:
Warming and persistent droughts may exacerbate drought stress in water-scarce areas, thereby negatively affecting tree growth. When riparian plants in arid regions experience severe drought stress, they sacrifice non-dominant branches with less competitive sap flow to improve the sap flow of dominant branches and thus ensure strong plant growth. Populus euphratica is one of the most dominant tree species in the riparian forest ecosystems of inland river basins in arid zones and is a reliable indicator of ecological change because of its diversity in growth and environment. To understand the adaptability of P. euphratica to the environment, the relationship between radial growth and meteorological factors, the growth decline and resistance of different heights and components of P. euphratica, as well as the resilience and resilience after recession were investigated. The results indicated that tree-ring width decreased gradually with increasing height and branching class of P. euphratica. Growth decreased at the bottom of the stem earlier than at the middle and top. Temperature, precipitation, and the Palmer drought index contributed to the growth at the bottom of P. euphratica, while precipitation contributed to growth at the top. The decline in the P. euphratica growth change rate was highly synchronized across heights and parts, with relatively high declines at the bottom and top. There were no significant differences in the recovery values for different heights and parts of P. euphratica, but the resistance, resilience, and relative resilience for the bottom and top were significantly lower than those for the other components, indicating vulnerability in the bottom and top of P. euphratica to drought. The relative resilience gradually decreased with the increase in branching class, and that of the secondary lateral branches at different heights was the lowest. In conclusion, the sensitivity of the top and lateral branches of P. euphratica to drought would cause the phenomenon of “breaking its arm” under drought disturbance in the future.

1. Introduction

The dramatic increase in greenhouse gas emissions since the beginning of the industrial revolution has led to global warming. Global temperatures are likely to continue to increase throughout the century, followed by more severe, widespread, and irreversible global impacts [1,2]. An IPCC (Intergovernmental Panel on Climate Change) report confirmed that the average global temperature rose by 0.85 °C from 1880 to 2012. Global warming has rapidly accelerated in recent decades, especially at high altitudes [3]. Increasing temperatures are accompanied by significant changes in global precipitation patterns, leading to extreme climate events such as severe droughts, with potential impacts on plant growth, phenology, distribution, and ecosystem services [4,5]. The arid zone of northwest China is located within the mid-latitudes and consists of the Gobi Desert and its surrounding arid zone. These areas represent fragile ecosystems and are sensitive to climate change, making the region a key site for studying the environmental impacts of global climate change [6]. Warming and persistent drought may exacerbate drought stress in water-scarce areas, thereby negatively affecting tree growth [7]. Irreversible damage, such as defoliation and dieback, occurs when a tree’s physiological damage exceeds a certain threshold [8]. In response to harmful environmental factors, such as drought and heat, trees may reduce their vigor or growth rate, experience a decline in growth, and die.
Tree growth serves as an indicator of tree vitality and capacity to adapt to environmental pressures [9]. The recovery of trees following stress is a protracted process that may entail time lags or legacy effects [10,11]. Tree-ring width (TRW) provides a continuous and high-resolution record of tree growth that accurately reflects environmental changes during growth [12]. Tree chronologies have been widely utilized in studies investigating forest resilience to drought [13]. Prolonged drought may reduce the resilience of trees owing to hydraulic failure [14,15] or carbon starvation [16]. If accumulated stress surpasses a tree’s threshold, it may result in irreversible damage and ultimately lead to the tree’s decline or mortality [17,18]. Moreover, the chronology of trees can be used to retrospectively detail their growth for each preceding year, ascertain their age, and comprehend the temporal manifestations of processes such as growth, branching, and flowering [19].
Most dendrochronological studies utilize core and disc measurements of ring width at breast height (1.3 m above ground) because this height is characterized by a relatively stable radial growth pattern and many rings [20,21]. Radial growth at breast height, which is influenced by various climatic factors, is often used as an indicator of the overall stem growth pattern [22]. Factors such as tree condition, natural environment, and physiological conditions can affect the stem, resulting in differences in radial growth at different stem heights [23]. In addition, the relationship between the radial growth response and climatic elements varies among trees with different stem heights. Chhin [24] studied the relationship between the radial growth of P. thunbergii Parl. at different stem heights and climatic factors and demonstrated that the growth of the lower part of the stem was mainly influenced by temperature and moisture conditions during the growing season in the year of tree-ring formation; by contrast, the growth of the upper part was more influenced by environmental conditions during the year of growing. Maaten [22] analyzed differences in radial growth responses to climate change in different stems of A. alba Mill. and P. abies (L.) Karst. at different elevations. They found that high temperatures in early summer reduced the growth of high-elevation fir in the upper stem portion, whereas high temperatures in summer limited the growth of high-elevation A. alba and P. abies growth, especially at breast height. For trees at lower elevations, both high summer temperatures and low precipitation reduced stem growth, with a greater impact on growth at breast height. Zhang [21] discovered that the sensitivity of P. schrenkiana tree-ring width to climatic elements was stronger at a height of 10 m on the stem than at other heights.
Moreover, a plant’s ability to withstand drought stress is heavily dependent on its water transport system, which encompasses the root, stem, and leaf structures. Studies have demonstrated that in favorable water conditions, plants compete for light, heat, and nutrients by augmenting their hydraulic conductivity [25]. The hypothesis of branch connection limitation has been confirmed in studies on the hydraulic structure of woody plants. This hypothesis suggests that dominant apical branches have stronger hydraulic conductivity than lateral branches because they control the sap flow of branch connections [26]. To maintain their viability, riparian plants actively reduce the water transport capacity of twigs to compete for the limited water delivered by the root system. They prioritize supplying water to the top branches to ensure a sufficient supply [27]. When riparian plants in arid regions experience severe drought stress, they tend to sacrifice non-dominant branches with less competitive sap flow to enhance the sap flow of the dominant branches and ensure optimal plant growth [28]. Therefore, it is imperative to evaluate the lateral branch growth of P. euphratica and its response to climatic factors to comprehensively understand plant growth adaptations. Although tree-ring widths can detail growth distribution patterns across different periods and components, there remains a relative dearth of research about radial growth within plant branching systems. In general, analyses of climatic responses to tree growth based on different stem heights are limited and have mostly focused on coniferous forests. Other tree species, such as temperate broadleaf forests, have received less attention, and it remains unclear whether they exhibit differential responses to temperature changes.
As one of the most dominant tree species in riparian forest ecosystems of inland river basins in arid zones, P. euphratica is a reliable indicator of ecological change owing to its diverse growth rates and environmental adaptability [29]. The growth of P. euphratica is influenced by various environmental factors, including groundwater, surface water, and temperature. Groundwater is pivotal in the growth of P. euphratica [30,31]. Previous studies have primarily focused on reconstructing past groundwater depth data or examining the relationship between groundwater and radial growth using tree chronology. However, a comprehensive investigation of the factors influencing P. euphratica growth under sufficient groundwater resources and the response of P. euphratica growth at different stem heights and lateral branches to climate change has not been conducted. Therefore, this study examined the response of P. euphratica radial growth to climate change across different stem heights and components using tree chronology analysis.
The Daliyaboyi Oasis is situated in the Tarim Basin of China and is an alluvial oasis formed by the deep penetration of the Keriya River into the hinterland of the Taklamakan Desert [31]. The oases remain in a ‘pristine’ state with minimal anthropogenic disturbance in this region, which distinguishes them from most of the extant modern oases in Central Asia [32]. P. euphratica is a dominant species in the oasis and is indispensable to protecting it and maintaining the stability of riparian ecosystems. Moreover, P. euphratica can provide valuable information on long-term environmental changes. However, most studies have focused on the impact of hydrological factors on P. euphratica growth, leaving a gap in the literature regarding individual P. euphratica growth responses at different stem heights. Therefore, we hypothesized that P. euphratica growth and growth response to drought can vary at different heights and in different parts of the plant, with the bottom and top of P. euphratica being relatively sensitive to drought. The objectives of this study were to evaluate differences in growth, rates of growth change, and recovery from drought across heights and parts of P. euphratica and to explore the vulnerability of P. euphratica to drought.

2. Materials and Methods

2.1. Study Area

The Daliyaboyi Oasis is located in the Taklimakan Desert of China’s hinterland at 38°16′ N/38°37′ N, 81°41′ E/82°20′ E, marking the last oasis of the Keriya River, the second largest river on the southern margin of the Tarim Basin [31]. The oasis has an area of approximately 342 km2 and elevations of 1100–1300 m, with a typical warm temperate arid climate [32] and significant diurnal temperature differences. The region experiences dust storms and highly variable weather [31], with an annual precipitation of less than 10 mm and a potential evaporation rate of 2480 mm [33]. The interior of the oasis is characterized by reticular fluvial deposition resulting from the scouring of the Keriya River [31]. The vegetation of the oasis is primarily dominated by P. euphratica, Tamarix chinensis, and Phragmites australis, exhibiting simple structures and types with limited distributions, which are typical characteristics of desert ecosystems [33]. Sandy soils constitute the predominant soil type in the oases.

2.2. Experimental Design and Sample Collection

The experiment was conducted in June 2021 within a P. euphratica community located adjacent to the main perennial river (the river has water year round), situated in the southern region of the Daliyaboyi Oasis at a distance of 150 m from the riverbank. A 50 × 50 m sample square was established, which was dominated by P. euphratica, with a few T. chinensis instances. The number of individual P. euphratica in the sample was 51, the average tree height was 17.72 m, the average diameter at breast height was 55.84 cm, the average crown width was 7.43 × 5.92 m, and the cover was 97.5%. Three P. euphratica that were healthy, structurally characterized, and unshaded at 5–10 m were selected in the sample site (Figure 1).
The three plants were sampled from the bottom 1 m to the top 8 m of the stem using a 5 mm increment borer (Haglöf increment borer, Torsång, Sweden), and two cores were collected at each height. Based on the determined branch order, primary and secondary lateral branches of different heights were collected from the cores and discs at the bases of the tree samples (Table 1). The P. euphratica plants were divided into three parts according to the distance of the primary lateral branches from the ground, as follows: bottom—from 0–4 m, containing the stem bottom (STB), primary lateral branches at the bottom of the stem (PLB), and secondary lateral branches of primary lateral branches at the bottom of the stem (SLB); middle—between 4–6.5 m, including the stem middle area (STM), primary lateral branches at the middle of the stem (PLM), and secondary lateral branches of primary lateral branches at the middle of the stem (SLM). Top: between 6.5–8 m, containing the stem’s top area (STT) and primary lateral branches at the top of the stem (PLT). The grouping basis is shown in Figure 2.
Table 1. Information on sampling points. Note: sample size refers to the number of cores collected. For example, indicates 16 cores collected at 8 different heights; indicates 16 cores collected at 8 different primary lateral branches. Two cores were collected per height, per lateral branch.
Sample TreesLongitude and LatitudeHeight (m)Diameter at Breast Height (cm)Canopy (m)Age (a)
First tree38°21′23.19″ N
81°51′36.32″ E
11.7839.36.47 × 6.5250
Second tree11.6341.47.09 × 5.8760
Third tree11.5148.67.43 × 6.0256
Different partsStemPrimary lateral branchSecondary lateral branch
Sample treesSample sizeDiameter range (cm)Sample sizeDiameter range (cm)Sample sizeDiameter range (cm)
First tree16 10.2~39.316 5~14144~10
Second tree1615.5~41.4166~19124~7
Third tree169.4~48.6185~22224~13
CategoryFull TitleAbbreviation
Characteristics of ring chronologyTree-ring widthTRW
Ring width indexRWI
Basal area incrementBAI
Standardized chronologySTD
Standard deviationSD
Different parts of Populus euphraticaBottom of stemSTB
Primary lateral branches at the bottom of the stemPLB
Secondary lateral branches of primary lateral branches at the bottom of the stemSLB
Middle of stemSTM
Primary lateral branches at the middle of the stemPLM
Secondary lateral branches of primary lateral branches at the middle of the stemSLM
Top of stemSTT
Primary lateral branches at the top of the stemPLT
SoilSoil water contentSWC
Drought indexPalmer drought severity indexPDSI
Indicators of drought responseResistanceRt
RecoveryRc
ResilienceRs
Relative resilienceRRs

2.3. Gravimetric Soil Water Content, Groundwater Depth, and Meteorological Data

In June 2021, soil samples were collected by soil drilling method near the plant samples, stratified every 20 cm, 3 replicates per layer until the water was produced. The soil sample was placed in an aluminum box and brought back to the laboratory to measure the gravimetric soil water content (SWC) by oven drying method (hereafter referred to as SWC). Depth to groundwater data were obtained from the groundwater level monitoring well closest to the sampling site (2.7 km from the sampling site) and included data from 2013–2021.
Meteorological data for the study area were obtained from grid-point meteorological data from the Royal Netherlands Meteorological Institute data-sharing website (http://climexp.knmi.nl (accessed on 20 March 2023)). Monthly temperature, precipitation (CRUTS4.06 grid point dataset with 0.5° × 0.5° resolution), and Monthly Palmer Drought Index (PDSI) data (CRU self-calibrating PDSI grid point dataset with 0.5° × 0.5° resolution) for 1961–2021 were acquired. Based on monthly men precipitation, temperature, and PDSI data from 1961–2021, annual (average of January through December of each year) and multi-year monthly mean (average of each month in the 1961–2021 period) precipitation and temperature data, as well as the average of PDSI from April of the previous year through October of the current year, were calculated.
The PDSI serves as a measure of drought severity as well as a measure of hydrologic drought [34,35]. It can “establish drought” and has greater persistence [36]. In addition, Alley [37] analyzed the relationship between the PDSI and regional runoff and groundwater indices and showed that the groundwater index is the most conservative indicator of the end of a drought. Together with that, the groundwater depth at the sampling sites of this study is within the range of suitable burial depth for P. euphratica growth. Therefore, drought severity and duration were not represented by the groundwater index. However, the PDSI is used as the main indicator to reflect the severity of drought and measure hydrological drought in this paper.
To analyze the adaptability of tree growth to extreme drought, the year with an average PDSI ≤ −1 from October of the previous year to April of the current year was set as the drought year [38] concerning the national standard of Meteorological Drought Rating (GB/T20481–2017). To understand the variation pattern of adaptive capacity over time, years with −2 < PDSI ≤ −1 were set as light drought years, years with −3.0 < PDSI ≤ −2 were set as medium drought, years with −4.0 < PDSI ≤ than −3.0 were set as severe drought and years with PDSI ≤ −4 were set as exceptional drought (Figure 3).

2.4. Tree-Ring Width, Chronology, and Basal Area Increment

The collected cores were processed in the laboratory according to common tree chronology treatment methods and subsequently fixed, dried, sanded, polished, and visually dated under a microscope [7]. TRW was measured (accuracy 0.001 mm) using a LINTABTM6 (RINNTECH, Heidelberg, Germany) measuring system. The dating and measurement results were verified using the COFECHA program. The negative exponential function in the ARSTAN program was used to remove tree growth trends and obtain the ring width index (RWI) for the three studied trees at different heights and different parts of the stem [39,40]. The basal area increment (BAI) was calculated using Equation (1) [41]:
B A I t = π ( R t 2 R t 1 2 )
where R is the tree radius and n   i s the year of tree-ring formation.

2.5. Vulnerability to Drought

The resistance (Rt), recovery (Rc), resilience (Rs), and relative resilience (RRs) of tree growth to extreme drought can reflect a tree’s drought adaptability [7]. The response of P. euphratica to drought was quantified using the BAI approach. The following four metrics have been described for the responses of trees to drought [7,42].
Rt is the ratio in tree growth between a drought event and before the drought event and represents the ability of trees to maintain growth under drought stress. Rc is the ratio in tree growth between a drought event and after a drought event, characterizing the ability of trees to recover their normal growth after being subjected to drought stress. Rs is the ratio in tree growth before and after a drought event, characterizing the ability of trees to recover to previous growth levels after a drought event. RRs are the weighted amount of damage to Rs during a drought [7]. The indicators were calculated as follows:
R t = B A I D / B A I P r e
R c = B A I P o s t / B A I D
R S = B A I P o s t / B A I P r e
R R S = ( B A I P o s t B A I D ) / B A I P r e
where BAID is the average BAI during the drought event, and BAIpre and BAIpost are the average BAI during the 3-year period before and after the drought event, respectively. In this study, the adaptation of growth at different heights and in different parts of P. euphratica to drought events was analyzed using BAI at the base, middle, and top of the stem.
The radial growth change rate of trees was used to determine whether growth depression occurred in P. euphratica and was calculated as follows [43]:
G C i = M 2 M 1 M 1
where GCi is the radial growth change rate for each of the 5 years before and after the tree was evaluated in the year i. To minimize the effect of growth changes in individual years on the detection of growth inhibition events, the radial growth change rate of P. euphratica was calculated as a sliding average over 5 years, and M1 and M2 represent the average of the tree-ring width indices for the initial 5 years (including the current year) and the final 5 years (excluding the current year), respectively. A radial growth change of less than –25% indicates growth inhibition and decline, whereas a change of more than 75% indicates growth release [44].

2.6. Data Analysis

The growing season of P. euphratica is from April to October, and studies have shown that the response of tree growth to post-climatic changes has a “hysteresis effect” [30]. Therefore, in this study, climate factors and tree-ring chronology from April of the previous year to October of the current year were selected for a correlation analysis. Pearson correlation coefficients were calculated using the SPSS 25 statistical software (IBM, Inc., Armonk, NY, USA). The plotting process was executed using the Origin 2021 Plotting and Statistics software (OriginLab Corp., Northampton, MA, USA) for data visualization and analysis.

3. Results

3.1. Soil Water Content and Groundwater Depth at Sampling Points

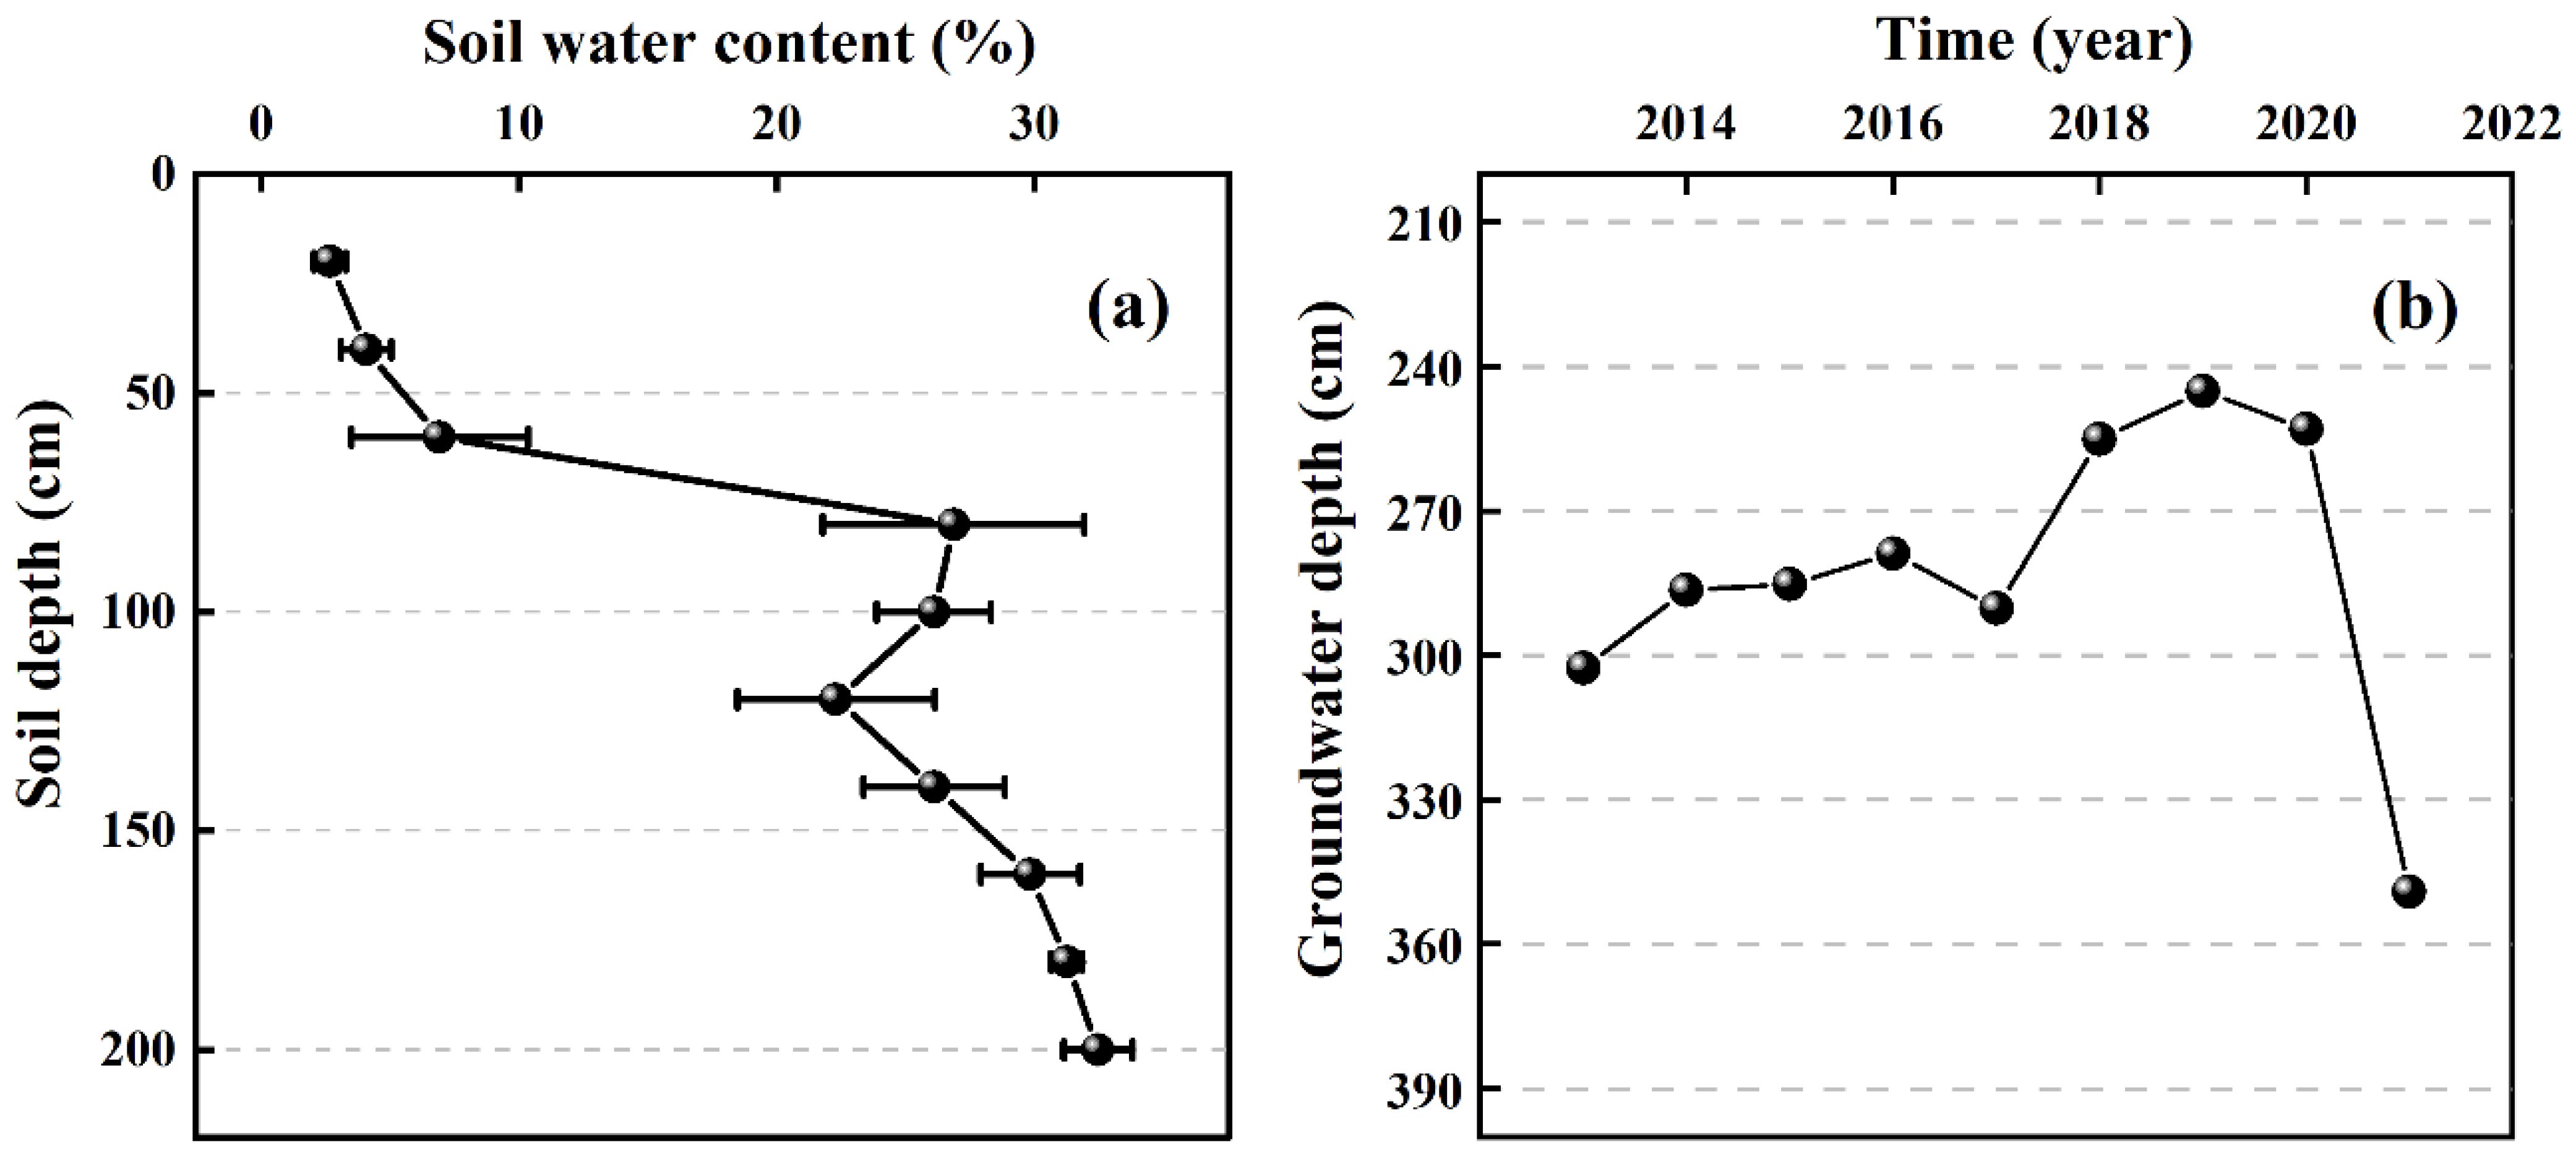
The soil water content (SWC) at the sampling sites increased with increasing depth. The variation in SWC ranged from 1.95% to 34.19%, with a mean value of 20.85% (Figure 4a). Groundwater depth at the sampling site was 2 m. Data from the nearest groundwater bathymetry observation point at the sampling site showed that the groundwater bathymetry became progressively shallower (3.03–2.45 m) from 2013 to 2020, and then declined in 2021, to 3.49 m, a long period of time at a level suitable for the growth of Euonymus (2–4 m) (Figure 4b).

3.2. Changes in Meteorological Factors

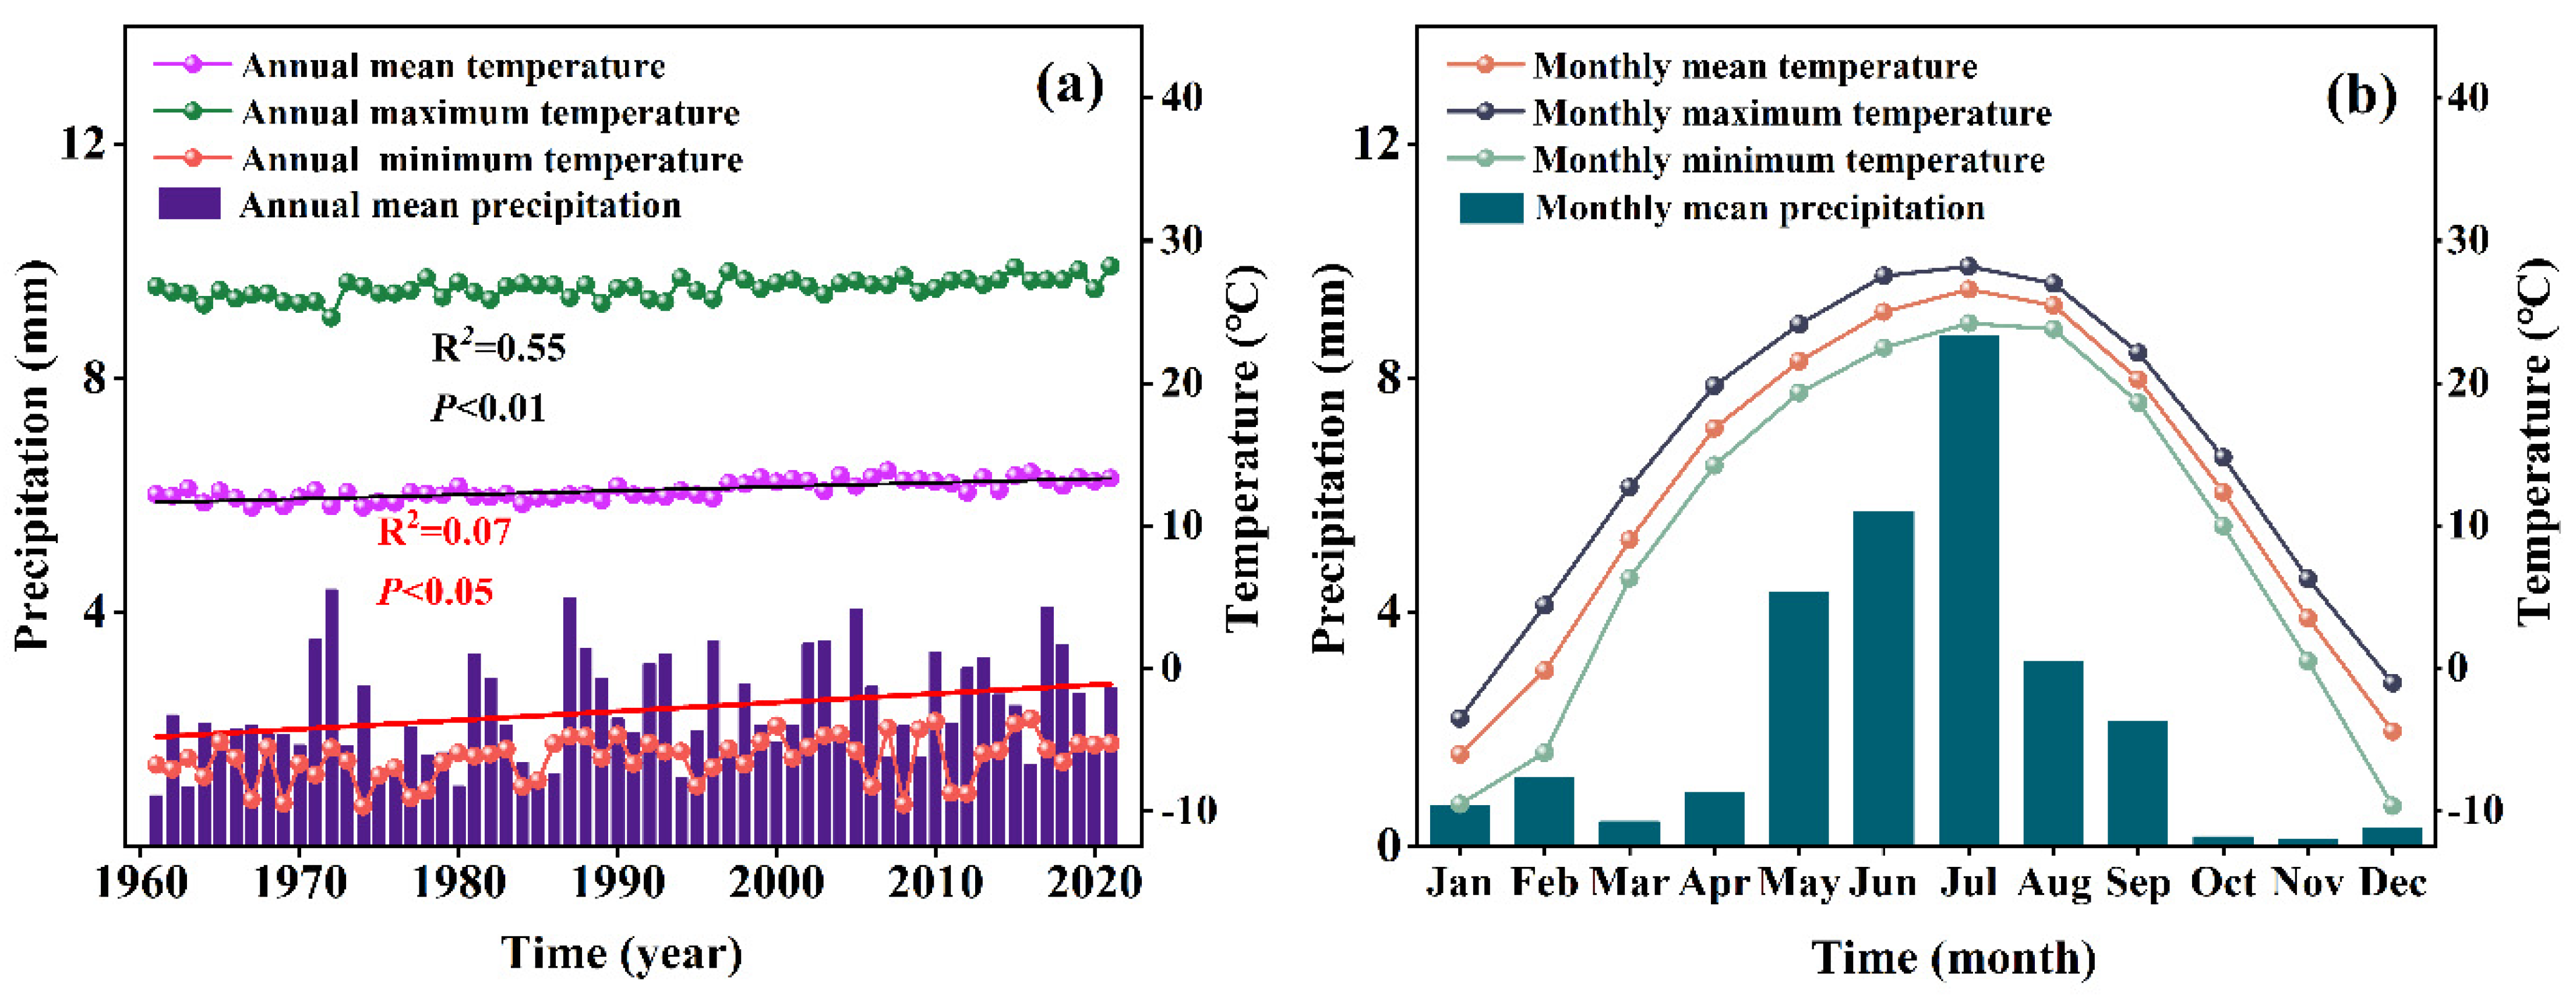
From 1961 to 2021, the total annual precipitation of the Daliyaboy Oasis was 141.8 mm, with an average annual precipitation of 2.3 mm and large fluctuations in precipitation, and recorded wet and dry years. The total annual precipitation showed a significant increasing trend at a rate of 0.015 mm/a (R2 = 0.07, p < 0.05) (Figure 5a). The mean annual temperature varied between 11.3 °C and 13.9 °C with a significant upward trend (R2 = 0.550, p < 0.01), with a rate of increase of 0.03 °C/a (Figure 5a). According to the national standards of the Meteorological Drought Rating (GB/T20481–2017), 1984, 1990–1991, 1994–1995, and 1997 were classified as light drought years; 1967–1969, 1973–1975, 2007–2008, and 2020 were classified as medium drought years; 1963–1966, 1970, 1976–1980 and 1985 were classified as heavy drought years; and 1961 and 1986 were classified as exceptional drought years (Figure 3). Meteorological data from 1961–2021 indicated local warming and humidification. Increases in PDSI values ranged from −4.70 to 2.95, and there were no severe or exceptional drought events after 1986 (Figure 3).

3.3. Tree-Ring Width and Chronology

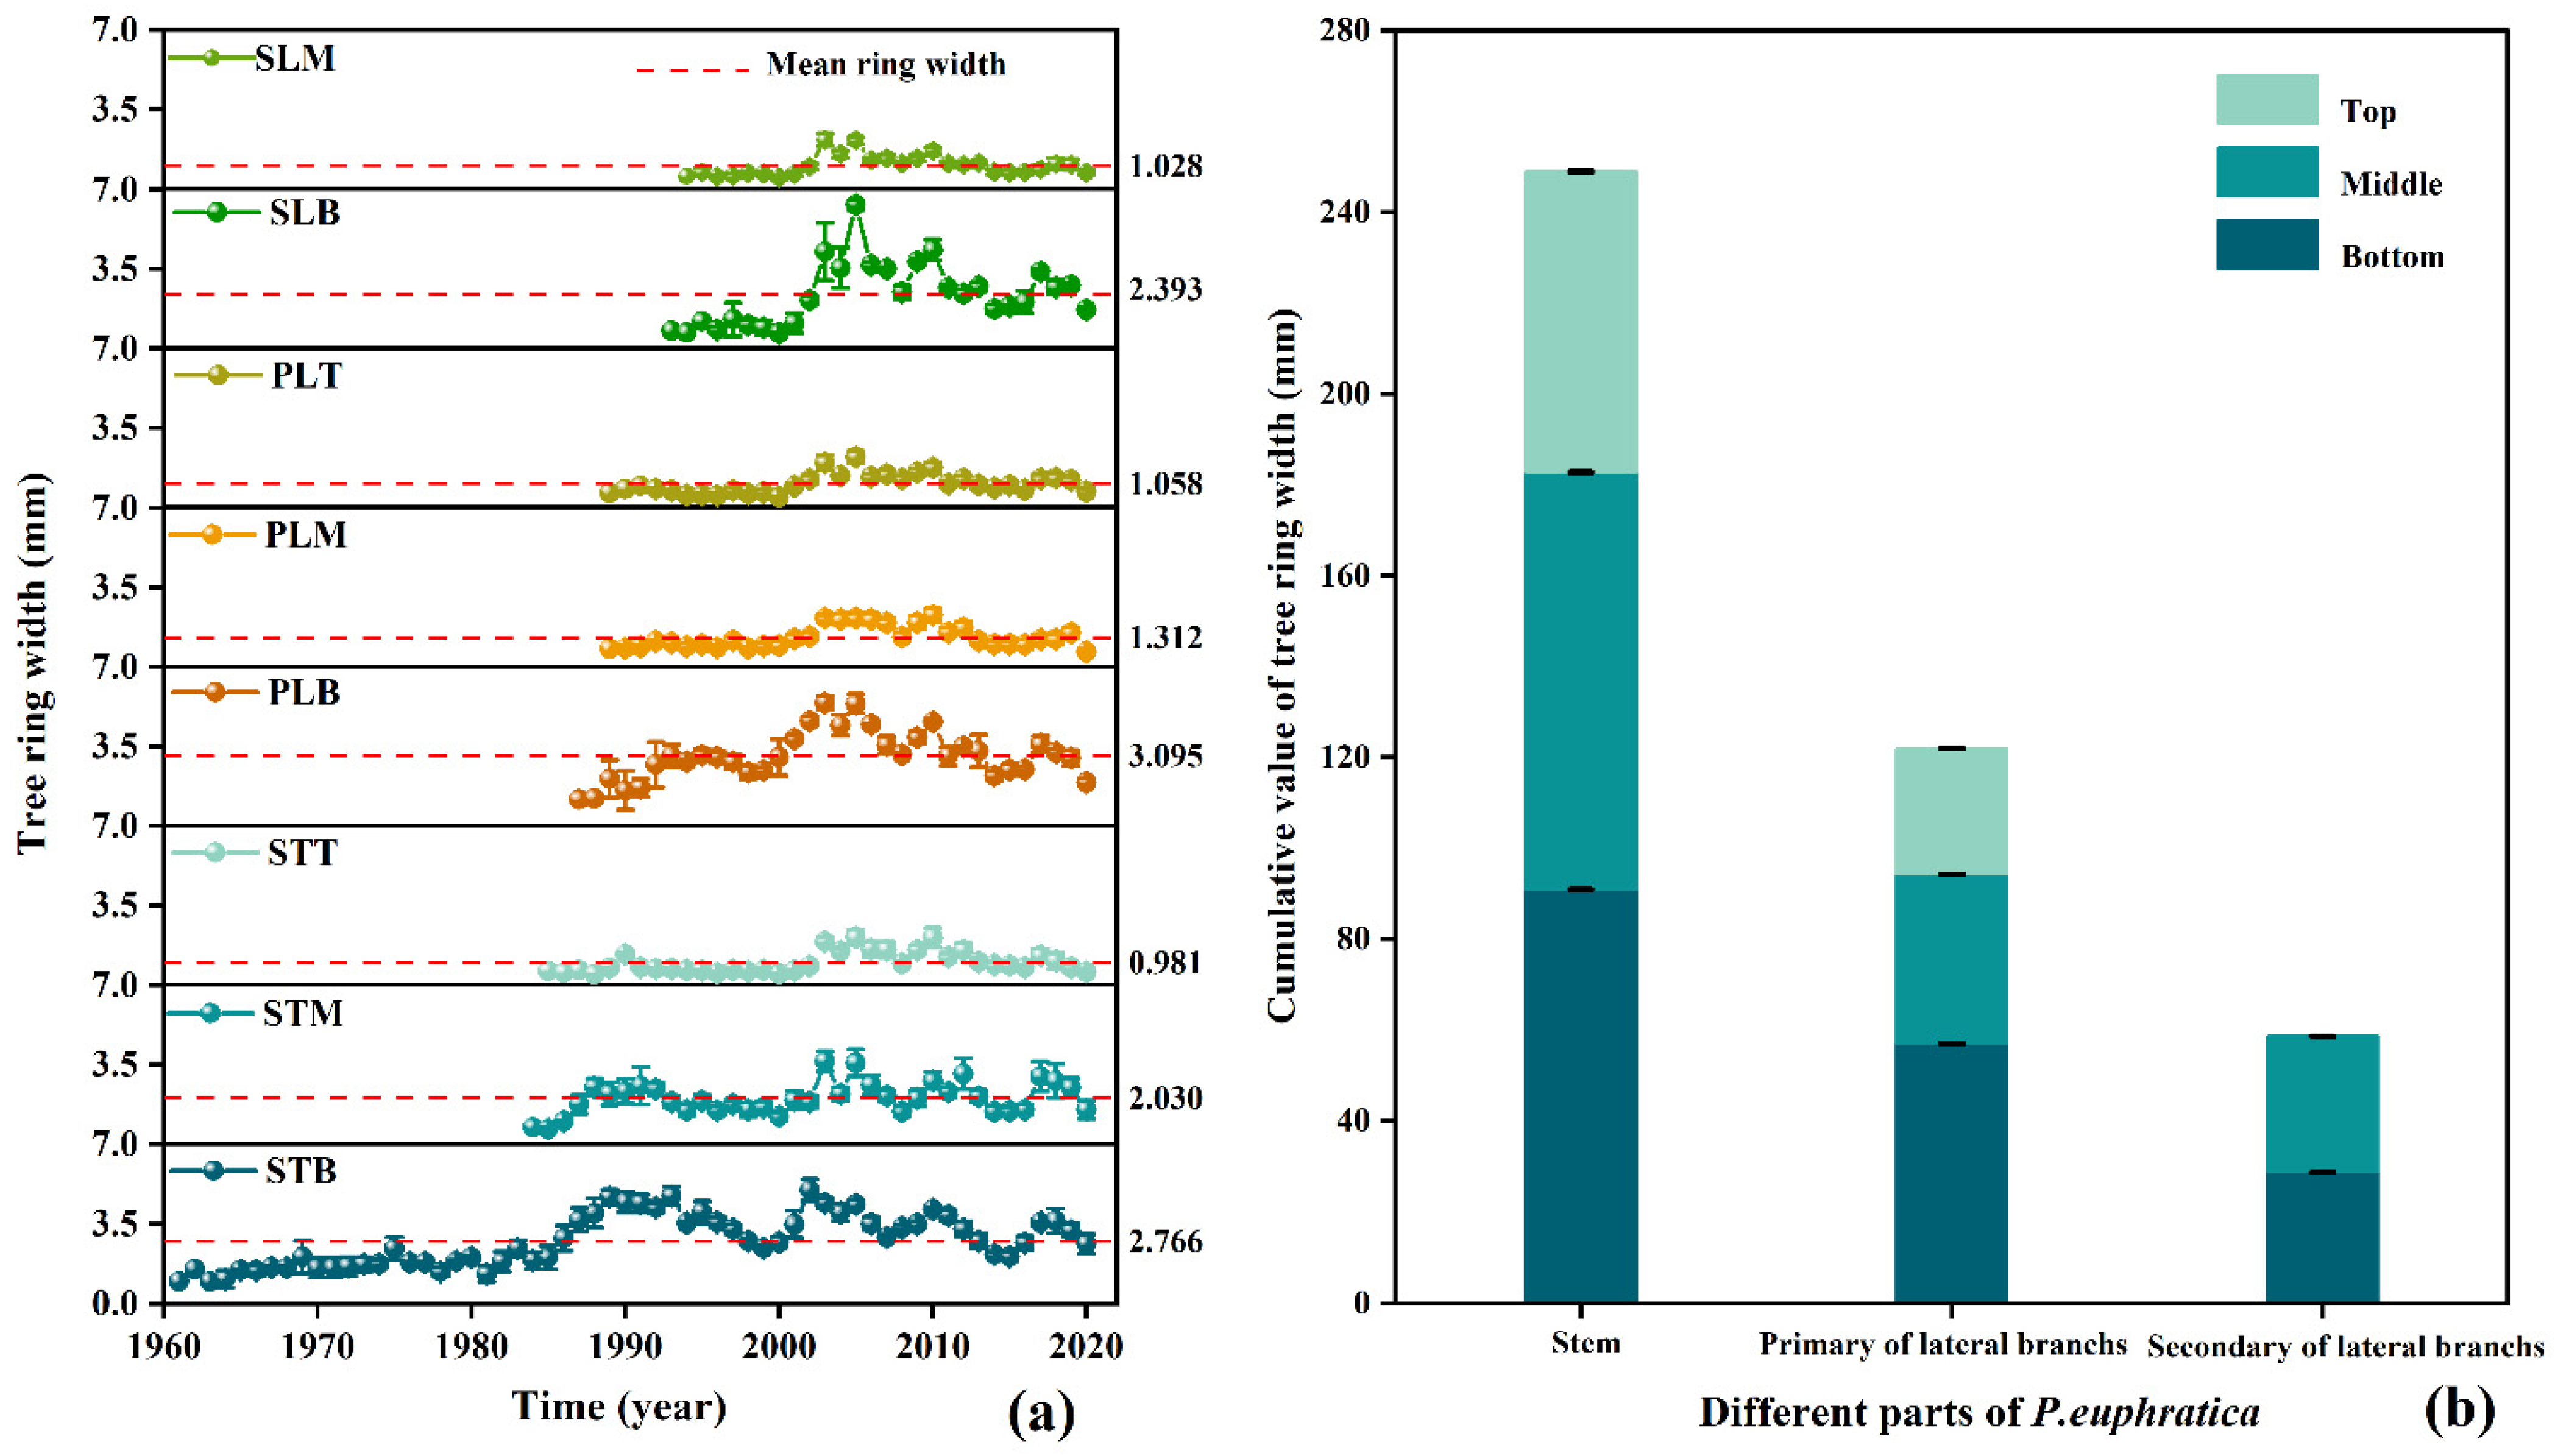
The TRW was narrowest in the years when growth began and became progressively wider with age. The variation in TRW of the different parts and different heights was generally consistent, with the widest ring width occurring in 2005. The TRW decreased gradually as the branching class of different parts of P. euphratica increased and as the tree height increased (Figure 6a, mean ring width). Interannual fluctuations in the TRW were more variable in different parts of the bottom, and flatter in the middle and top (Figure 6a). The cumulative value of TRW of the stem and primary lateral branches of P. euphratica decreased with increasing height, with the cumulative value of TRW of the stem decreasing from 90.945 mm at the bottom to 66.245 mm at the top. The cumulative value of TRW of the primary lateral branches decreased from 56.987 mm at the bottom to 27.768 mm at the top, and the cumulative value of TRW of the secondary lateral branches increased from 28.795 mm at the bottom to 29.828 mm in the middle (Figure 6b).
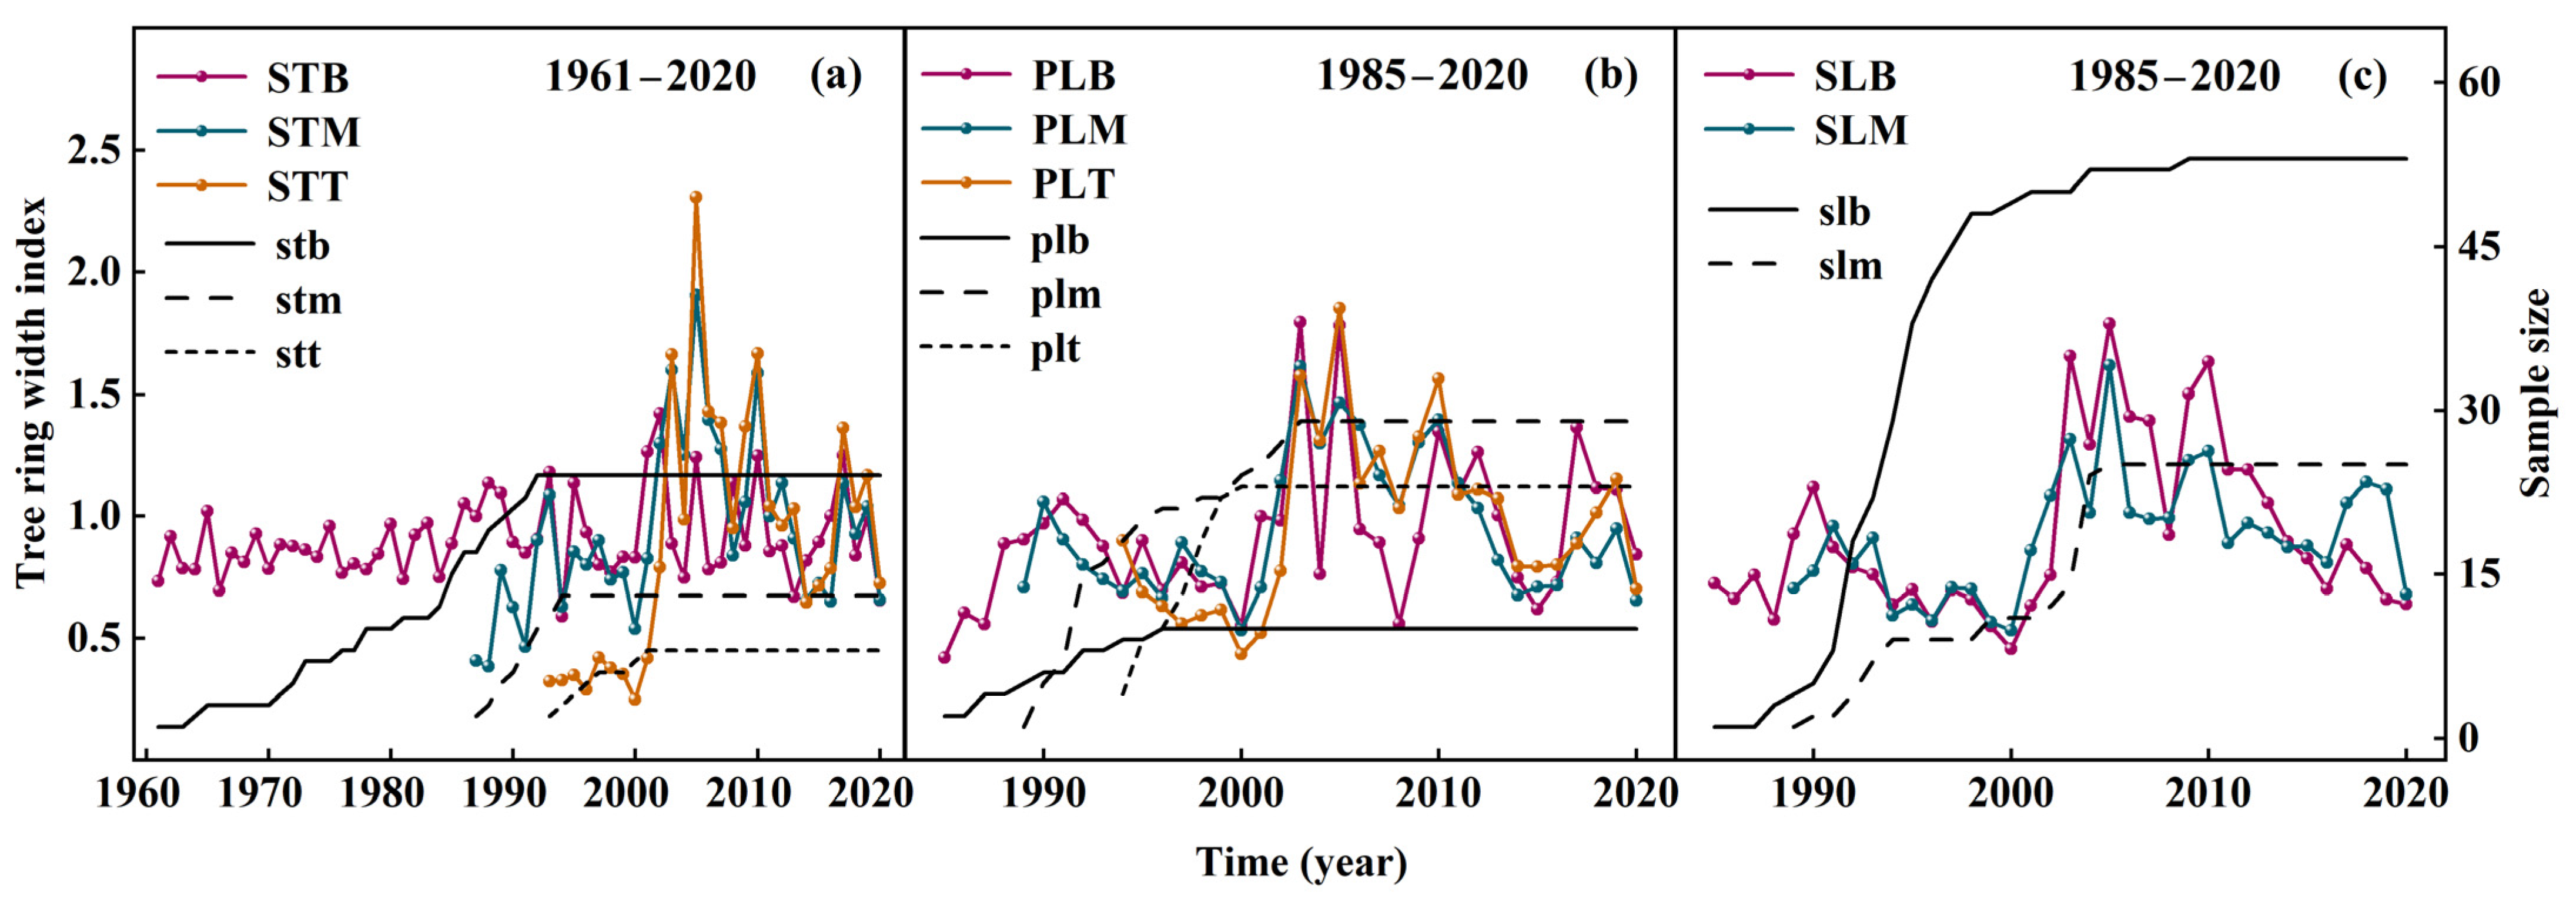
The variations in RWI were highly consistent among different heights of the stem (STB, STM, and STT, Figure 7a), primary lateral branches (PLB, PLM, and PLT, Figure 7b), and secondary lateral branches (SLB and SLM, Figure 7c). Growth trends were consistent across different heights and parts, with the smallest RWI occurring in 2000 (Figure 7).

3.4. Radial Growth of P. euphratica in Relation to Climatic Variables

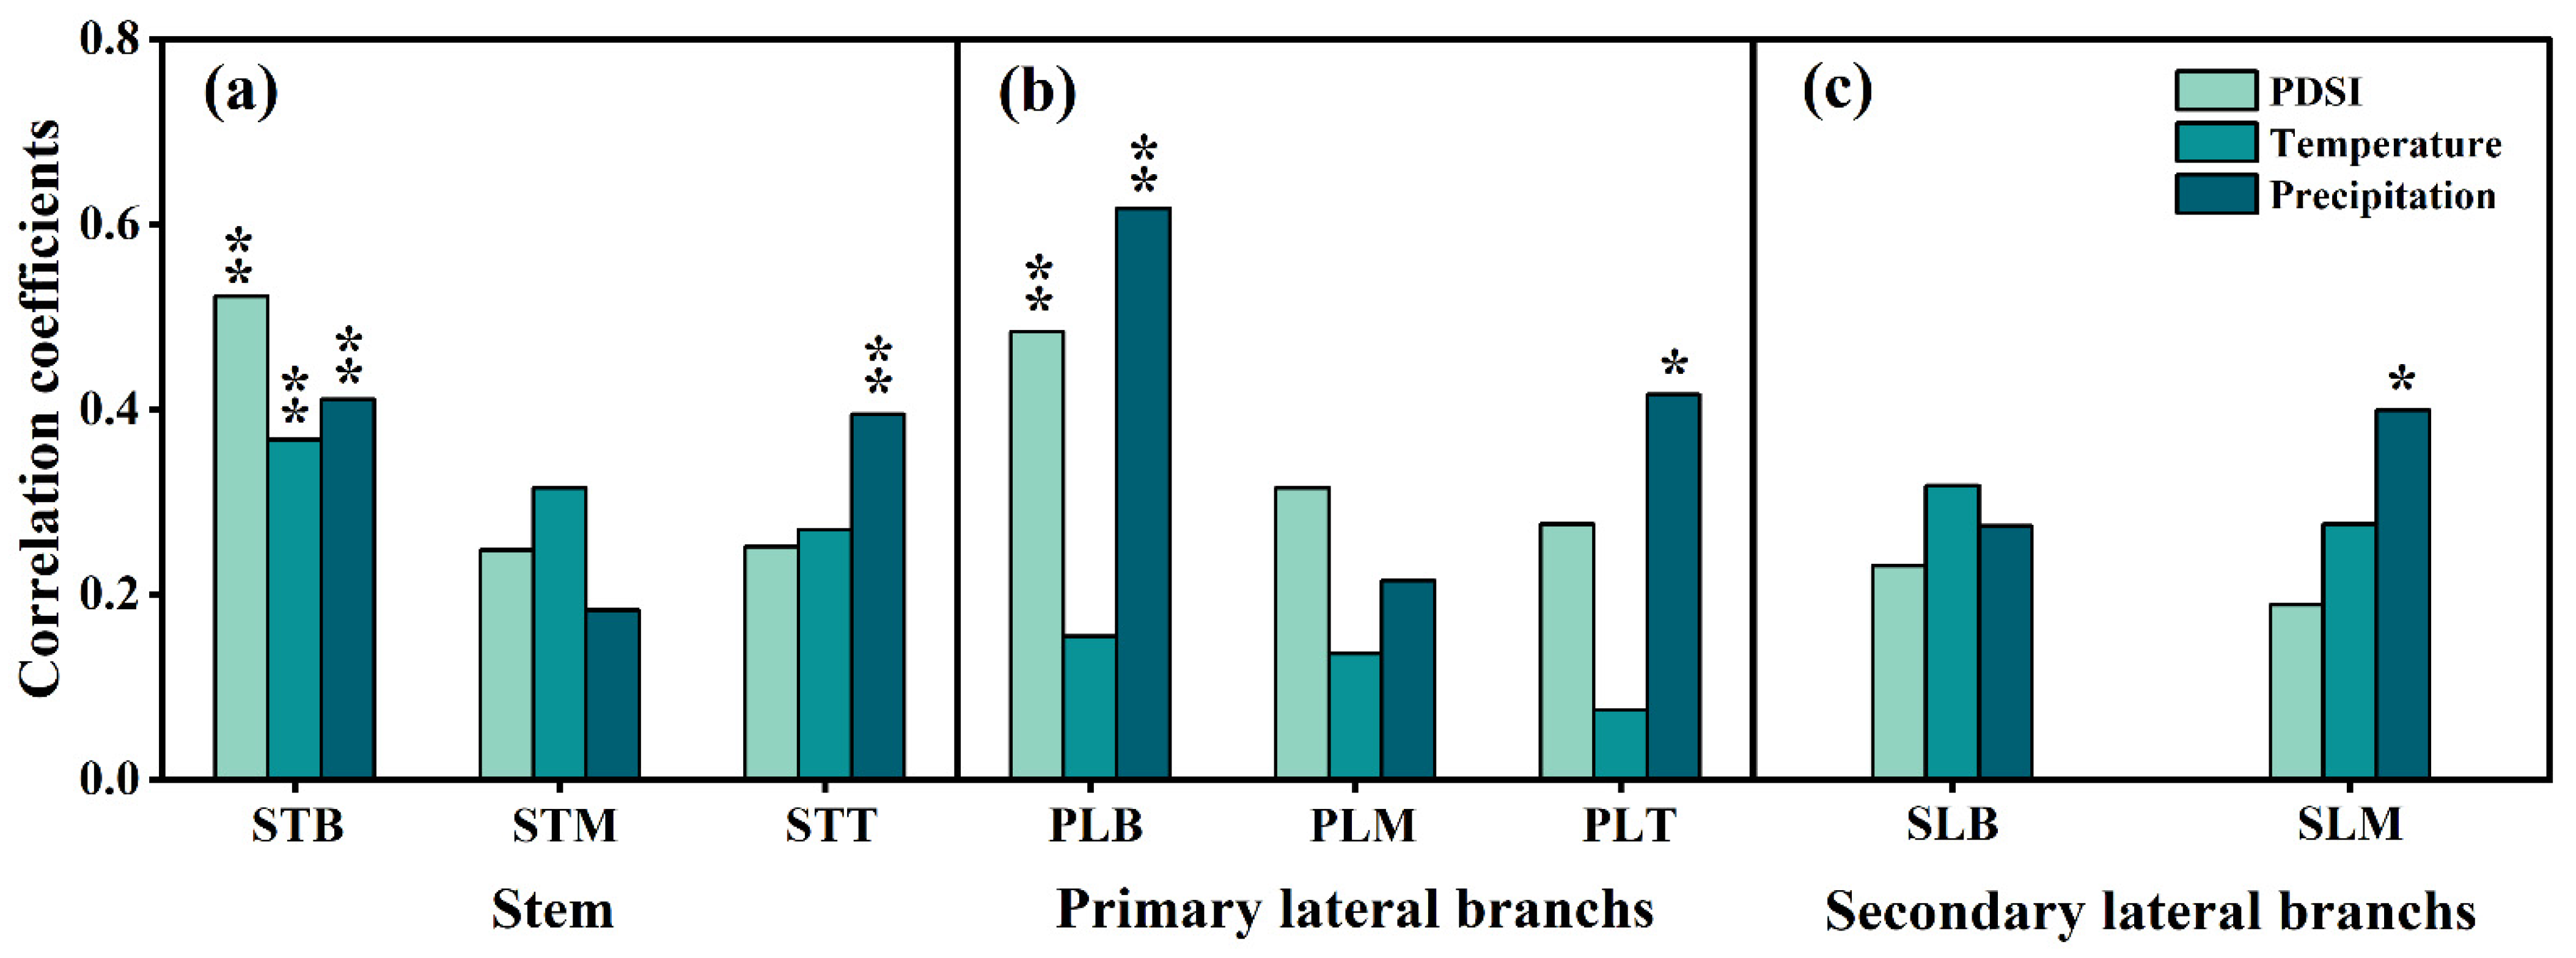
The TRW of STB was significantly correlated with PDSI, temperature, and precipitation (p < 0.01). The TRW of STT was significantly correlated with precipitation (p < 0.01) (Figure 8a). The TRW of PLB was significantly correlated with PDSI and precipitation (p < 0.01), and the TRW of PLT was significantly correlated with precipitation (p < 0.05) (Figure 8b). The TRW of SLM was positively correlated with the mean annual precipitation (p < 0.05) (Figure 8c).
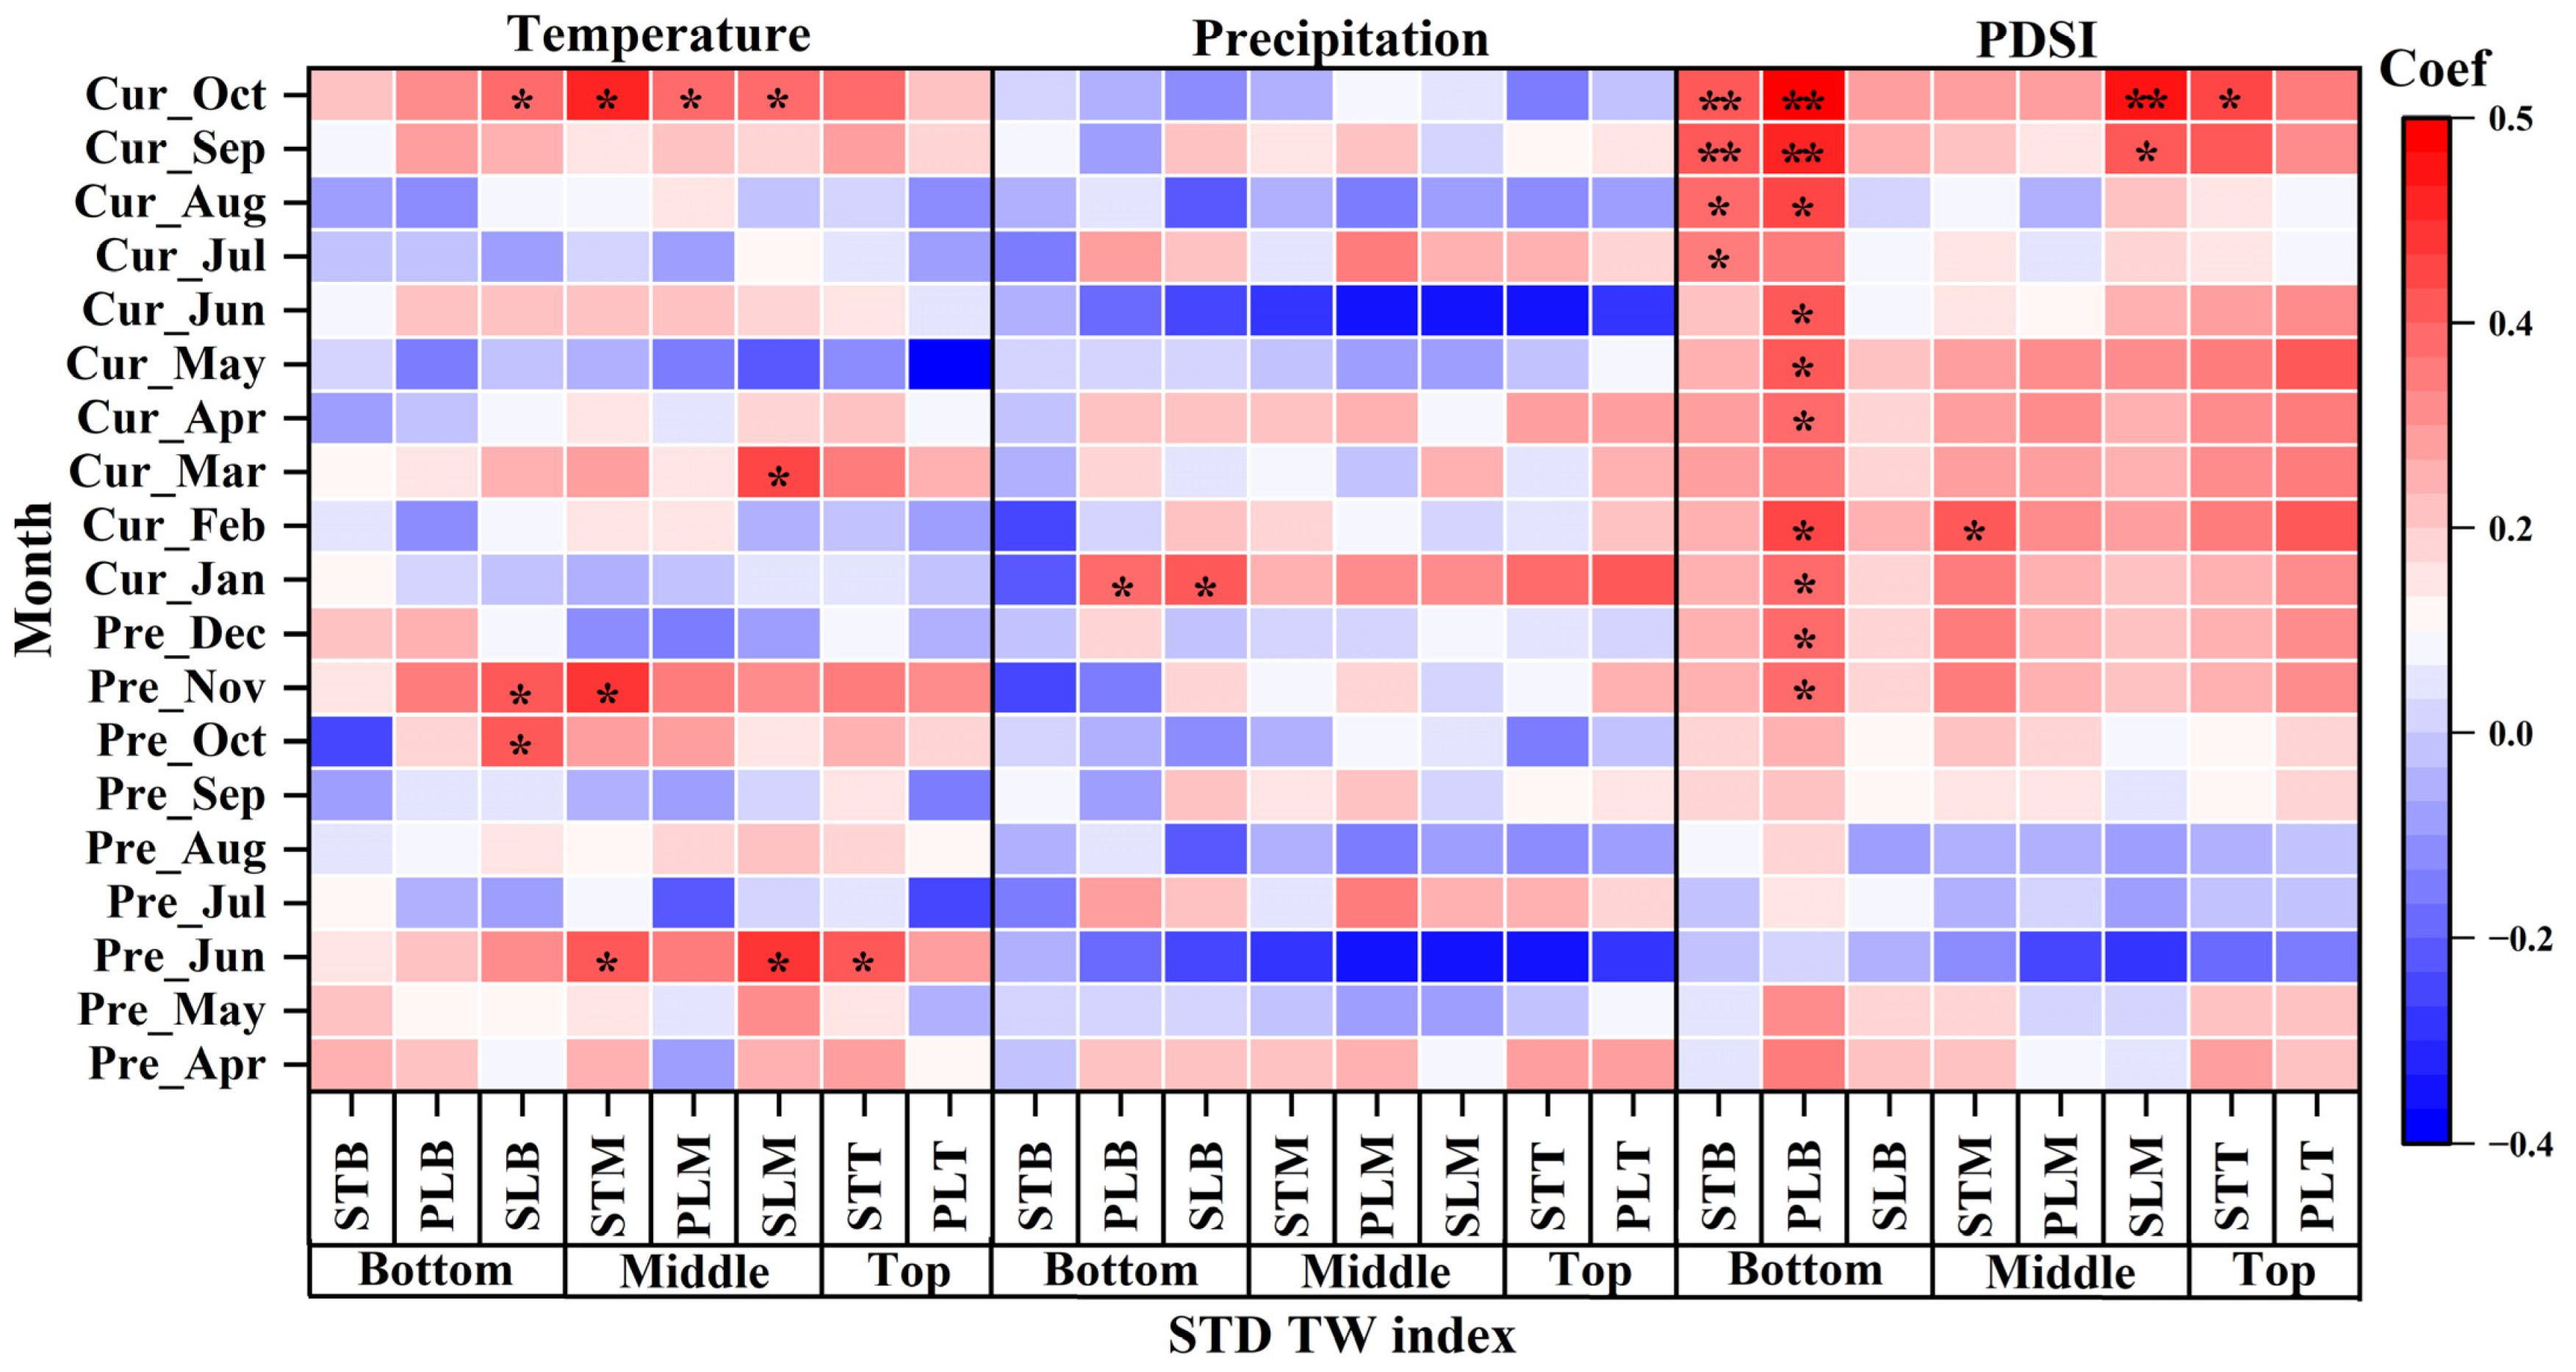
The RWI of SLB, STM, PLM, and SLM was positively correlated with the temperature in October of that year (p < 0.05), the RWI of STM, SLM, and STT were positively correlated with the temperature in June of the previous year (p < 0.05), and the RWI of SLB and STM were positively correlated with the temperature of the previous November (Figure 9, left).
There was a positive correlation between the RWI of SLB and the temperature in October of the previous year, and the RWI of SLM was positively correlated with the temperature in March of that year. The RWI of the PLB and SLB were positively correlated with precipitation in January of that year (p < 0.05) (Figure 9, middle).
The RWI of STB was positively correlated with PDSI in July–October of that year (p < 0.01). Positive correlations were observed between PDSI and RWI of PLB in November–December of the previous year and in January–February, April–June, and August–October of the current year (p < 0.01). The RWI of SLM was positively correlated with PDSI in September–October of that year (p < 0.05 and p < 0.01) (Figure 9, right).

3.5. Growth Decline of P. euphratica at Different Heights and Parts

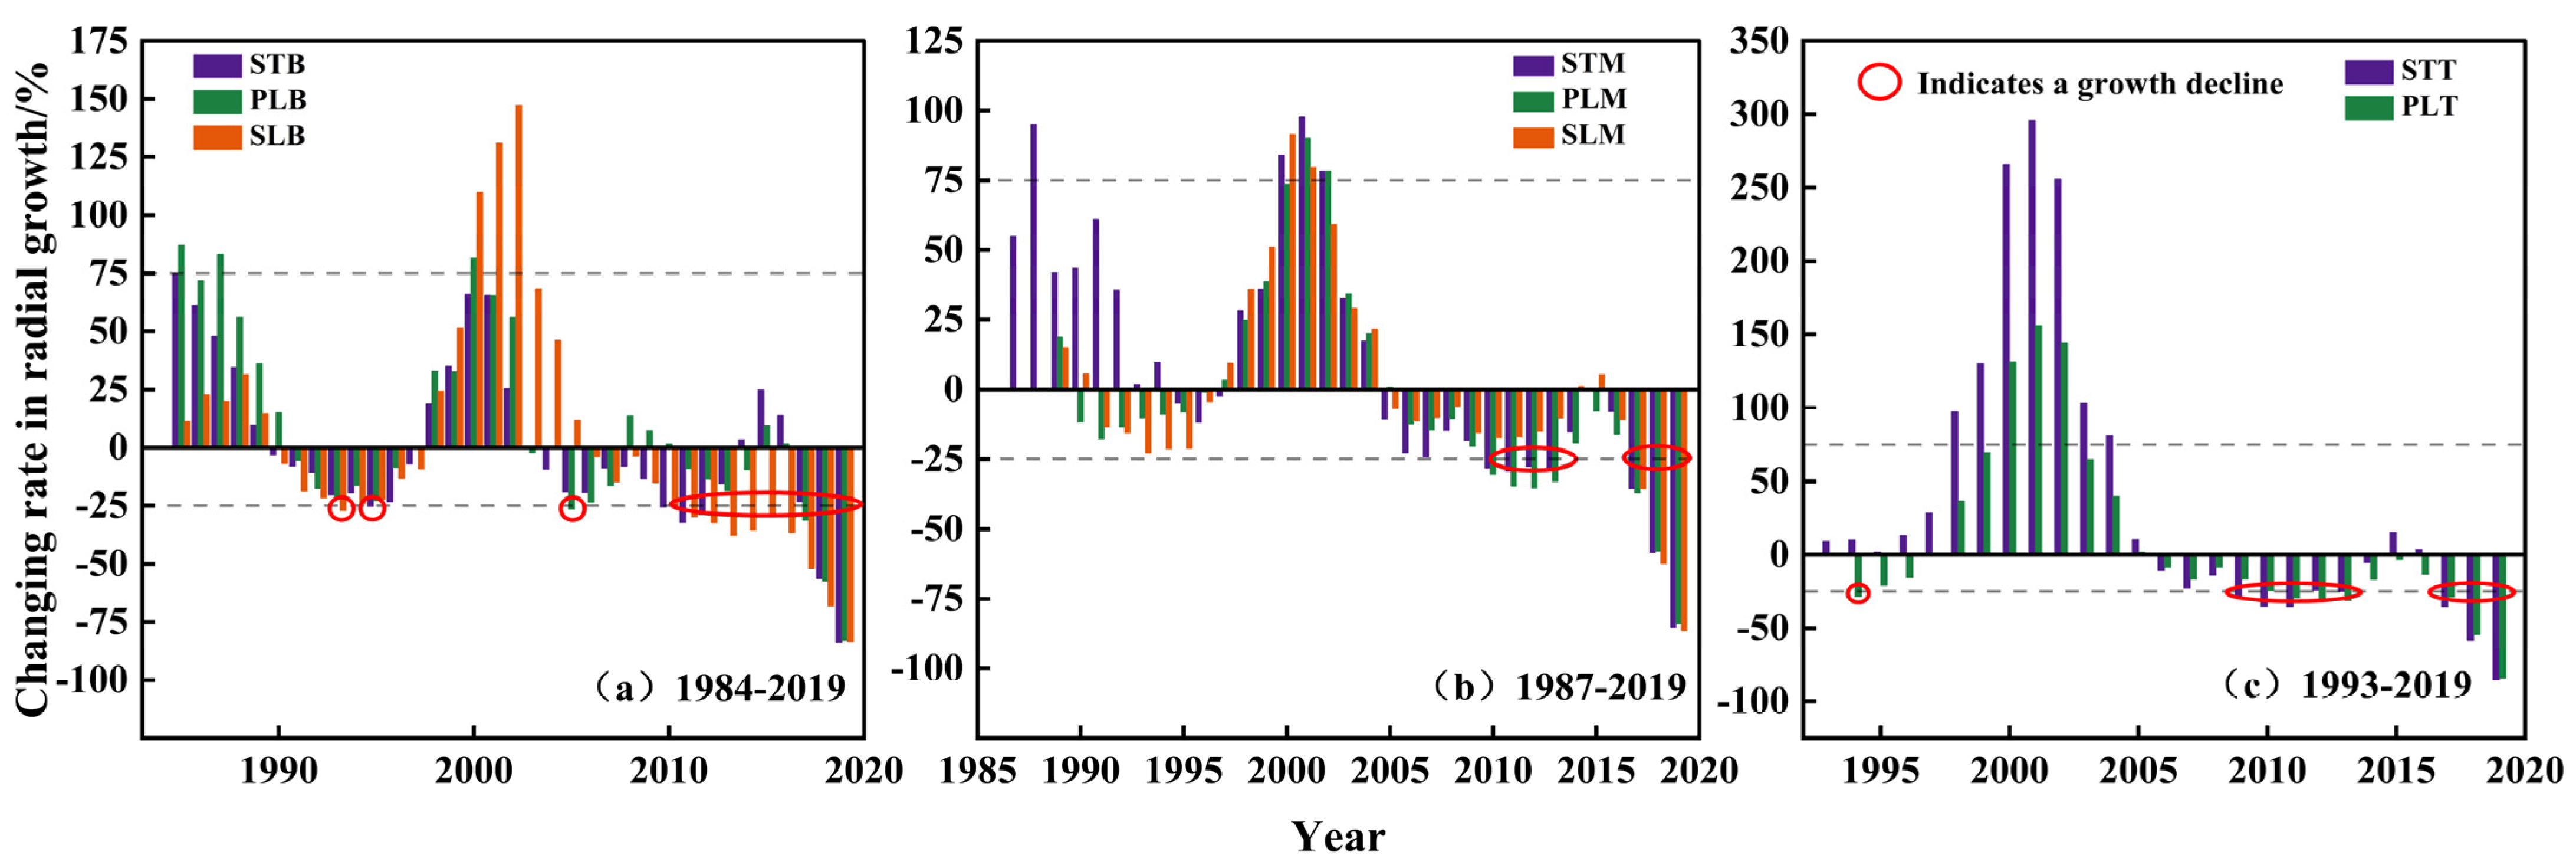
Between 1990–1997 and 2005–2019, plants of P. euphratica at different heights experienced varying degrees of growth decline. Growth increased in 1998–2004. The increase and decrease in the growth of plants of different heights and different parts were essentially synchronized. The radial growth change rates of different parts of the bottom ranged from −25.26% to −83.79%, with STB and SLB being the most pronounced. The growth recession in the middle ranged from −27.56% to −86.37%, with STM and PLM being the most pronounced. The growth recession in the top ranged from −24.27% to −85.71%, with STT being more pronounced than PLT. Primary/secondary lateral branches at the bottom and top of the P. euphratica stem showed a higher degree of growth decline than in the middle (Figure 10).

3.6. Adaptation of Different Parts of P. euphratica to Drought

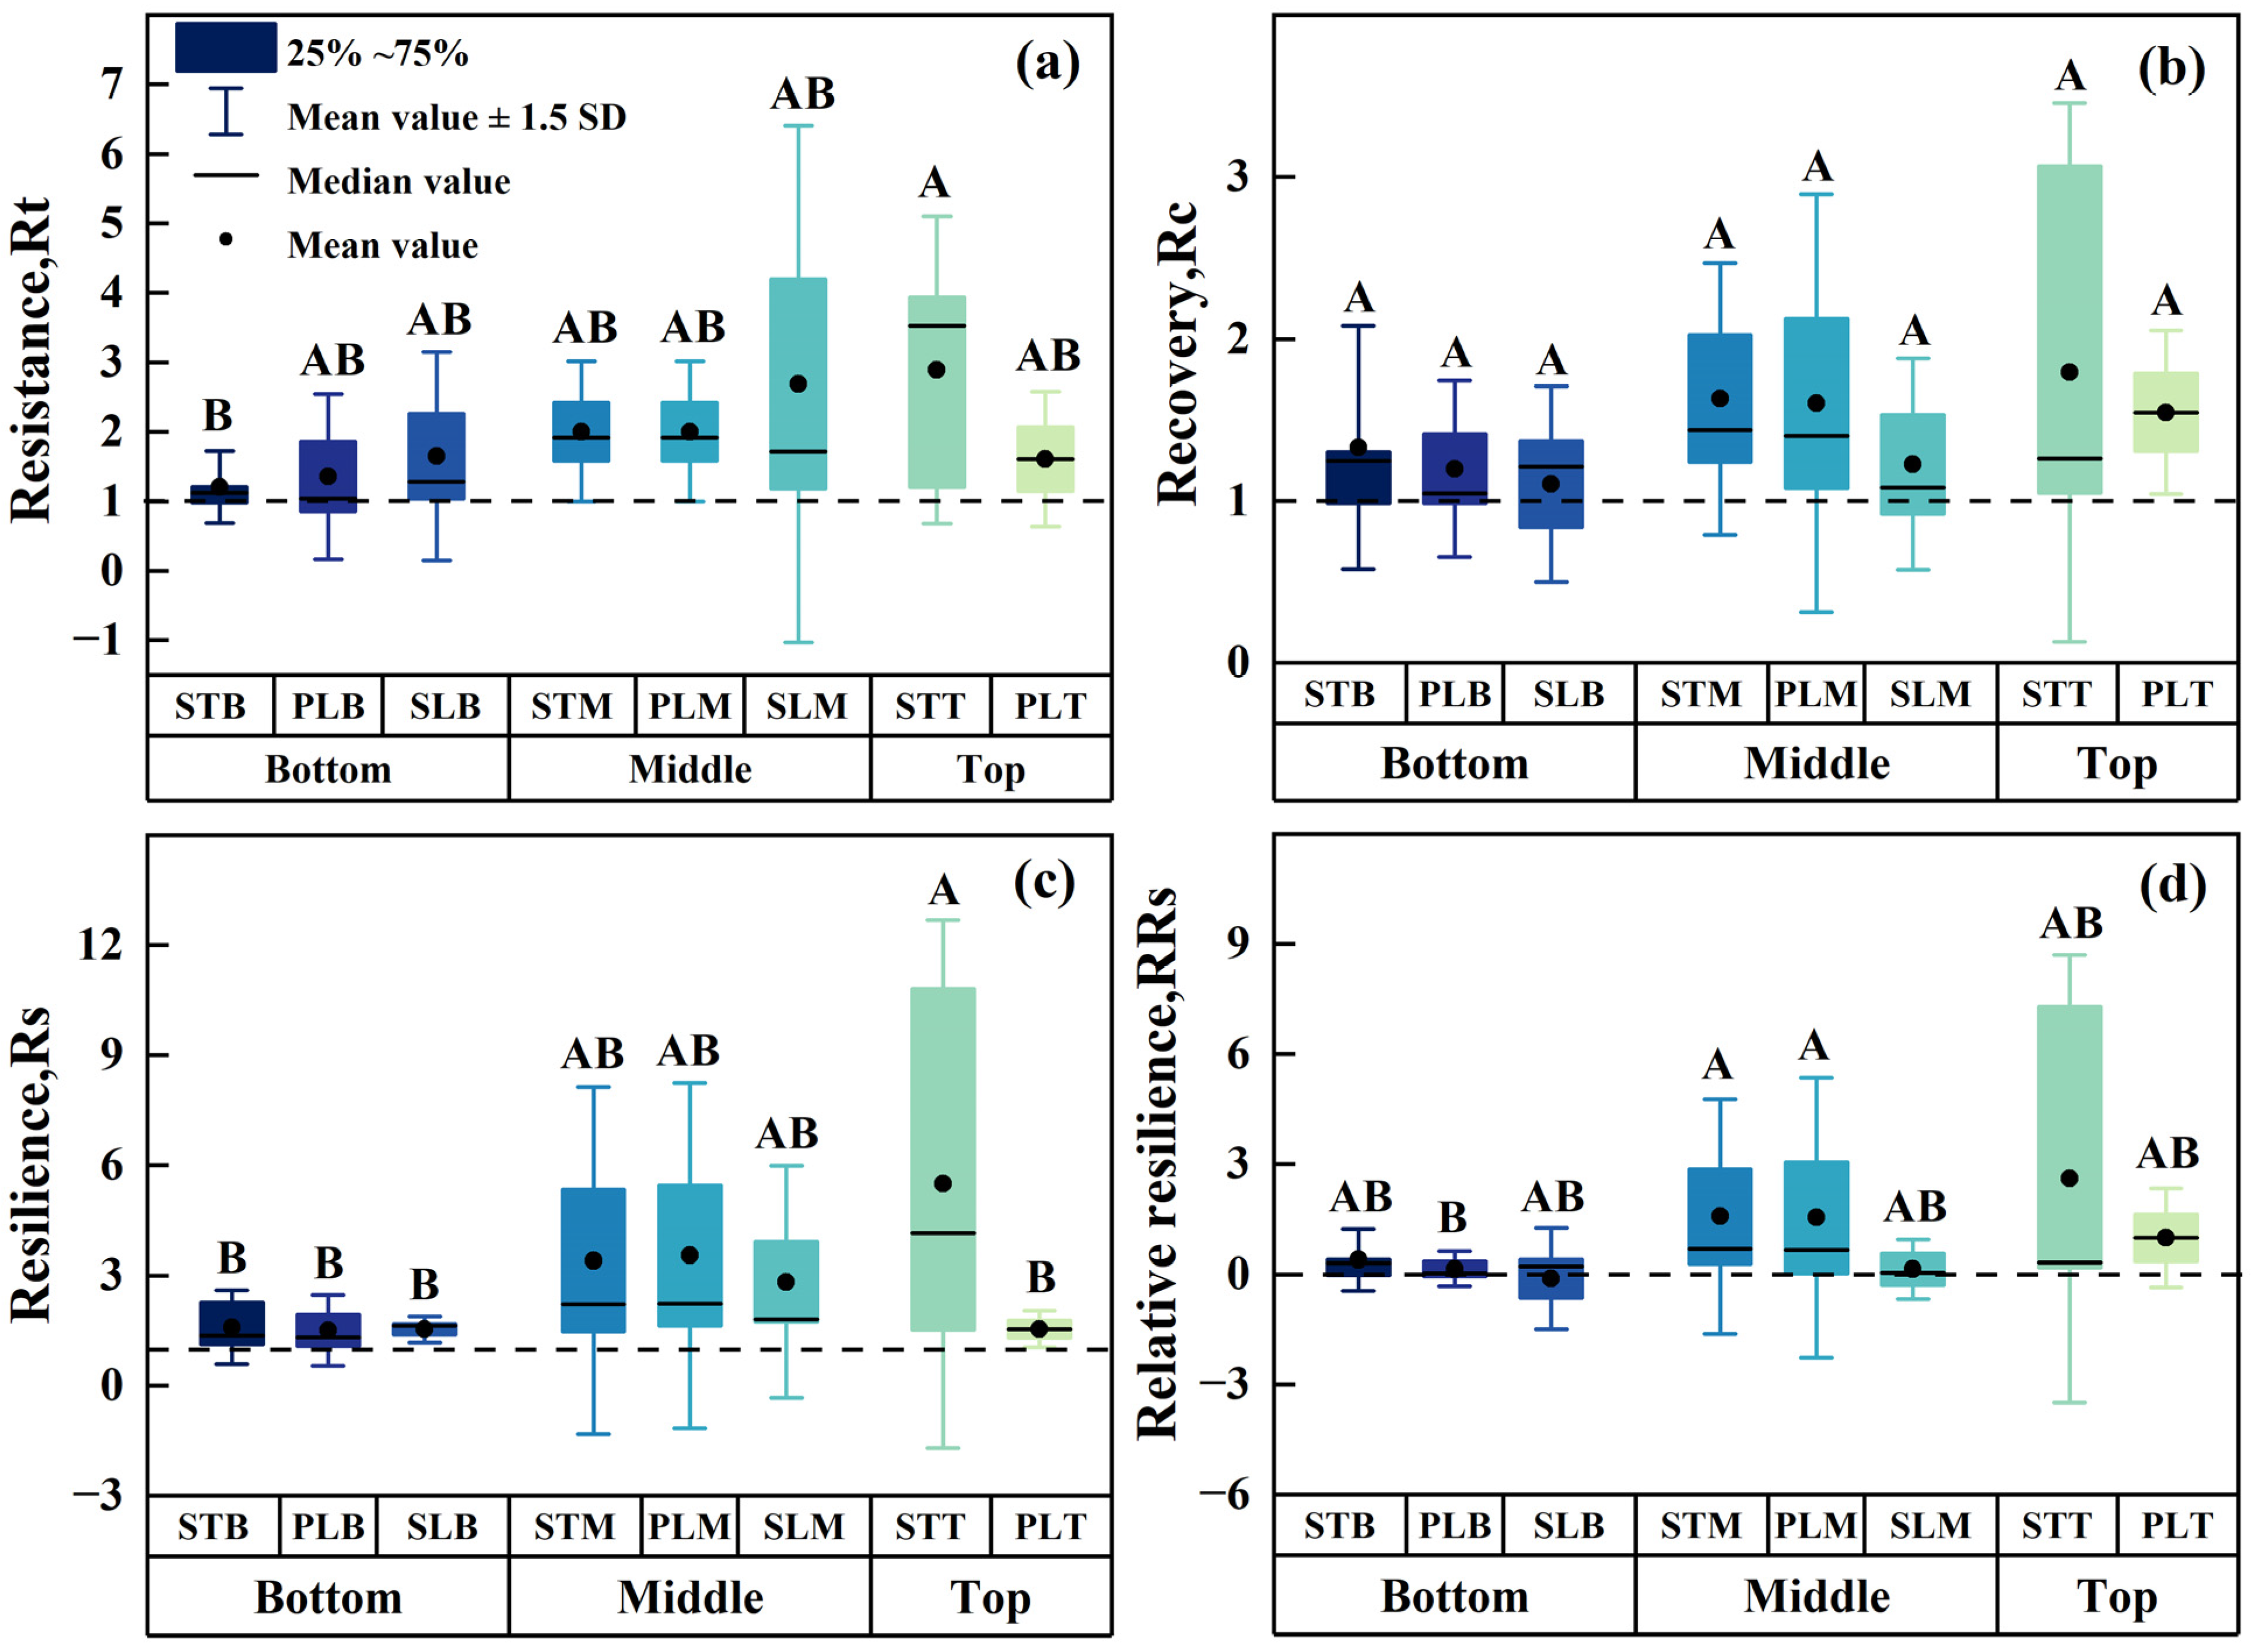
The BAI data were analyzed for Rt, Rc, Rs, and RRs during the drought event. As tree height and branching class increased, Rt first increased and then decreased, and Rt > 1. The Rt differed significantly between the STB and STT (p < 0.05)(Figure 11a). Rc, Rs, and RRs increased with tree height and decreased with branching class and Rc > 1 (Figure 11b–d). There were no significant differences between the different heights of P. euphratica and different parts in terms of Rc (p < 0.05) (Figure 11b). Significant differences were found in Rs between different parts at the bottom and middle of P. euphratica (p < 0.05) (Figure 11c).

4. Discussion

4.1. Meteorological Factors and Radial Growth

At the beginning of the 21st century, the climate of northwest China was changing from warm and dry to warm and wet [6]. Zhang [6] analyzed the process and scale characteristics of climate humidification in the northwest arid zone of China using satellite remote sensing, field observations, and coupled models and found that the temperature and precipitation increased significantly from 1961 to 2018. Temperature and precipitation in our study area showed a significant increasing trend, at rates of 0.03 °C/a and 0.015 mm/a, respectively, from 1961 to 2020 (Figure 5). The PDSI trend in the study area was severe drought → moderate drought → light drought, and there were no exceptional or severe drought years after 1986 (Figure 3). The climate change observed in the study area is consistent with the trend of climate change in the Northwest Arid Zone, and there is a clear phenomenon of “warming and humidification”. Although there was an increasing trend in precipitation in the study area, an increase in temperature increased evaporation and offset the increase in precipitation. Therefore, the climate in the study area is significantly “warmer” than “wetter”.
Factors such as a tree’s condition, natural environment, and physiological conditions can affect the stem, resulting in differences in radial growth at different stem heights [23]. In the present study, the TRW at different stem heights increased and then decreased with time. The TRW of the primary and secondary lateral branches of P. euphratica varied consistently at different heights (Figure 6a). We argue that diameter growth during tree growth is a result of the processes of new sapwood replenishment and conversion of old sapwood into core wood, and therefore trees as a complete system have consistent growth trends at different heights of the stem and lateral branches of TRW. Gartner [45] showed that the TRW of torch pines was positively correlated with stem height. In the present, the TRW of P. euphratica increased from the STB to the STM and then decreased at the STT (Figure 6b). Yu [20] showed an increase followed by a decrease in the TRW of torch pines with stem height, which is consistent with the results of the present study. The results of Zhang [46] on the radial growth characteristics of red pines at different tree heights on Changbai Mountain showed that the trends of TRW variation based on height were mostly the same, and the TRW variation was most obvious at the base and top (0.3, 1.3, and 20 m). In the present study, the TRW at the STB, STM, and STT of the stem of P. euphratica were highly undulating (Figure 6a). The results of the analysis of the variation in TRW of different parts of P. euphratica at different heights showed that the variation patterns of TRW of the stem, primary, and secondary lateral branches of P. euphratica at different heights were relatively consistent (Figure 6a). Variations in the PLM, SLM, and PLT annual cycle widths became increasingly stable over time (Figure 6a). The TRW of the primary and secondary lateral branches of P. euphratica were smaller than those of their stems (Figure 6b). The TRW of the primary lateral branches of P. euphratica gradually decreased with increasing height. Previous studies have shown that in trees with physiologically active branches, the TRW of the branch is greater at the base of the stem; as the tree matures, the lower branches become less physiologically active or even begin to die, and the maximum growth point moves upward [47]. In the present study, the TRW of the secondary lateral branches increased with height (Figure 6b). Farrar [48] showed that TRW is relatively narrow at the apical internode, reaches its first maximum at the branch with the highest number of leaves, and then decreases at the lower part of the canopy. The variation in TRW with stem height is controlled by growth hormone production, distribution, and nutrient flow [49]. In a simulation study of meristematic growth in Pinus sylvestris, Ford [50] showed that as branches elongate, leaves move farther away from the stem. Additional leaves require additional branches to support them, and the potential biomass exported from branches to the stem first increases with the number of leaves and then decreases with the amount of support required. An increase in the number of branches and leaves reduces the number of photosynthetic products exported to the main stem, resulting in less stem growth than lateral branch growth [50]. This is inconsistent with the results of the present study, in which the stem growth was greater than that of the lateral branches. The differences in tree species and the areas where the trees grow may lead to different resource allocation (exchange) patterns between the stem and lateral branches in the aboveground parts, resulting in differences in growth allocation. However, differences in biomass allocation can be explained by the typical pipe model theory of the existence of a linear relationship between the part of the tree stem cross-section with conductive capacity and the corresponding number of supporting leaves [51]. The part of the tree stem cross-section with conduction capacity is the sapwood, which implies that the relationship between the sapwood area and the number of responsive leaves, as well as the difference between the sapwood area of the stem and the lateral branches, may be the key factors contributing to the differences in the growth of different parts of the tree.

4.2. Relationship between Radial Growth and Meteorological Factors

Analysis of the correlation between different heights and different parts of P. euphratica and meteorological factors showed that radial growth rates at varying heights and distinct parts of the stem responded to different degrees of climate change. The TRW at the STB of P. euphratica was highly significantly and positively correlated with annual mean PDSI, temperature, and precipitation (Figure 8). This correlation with temperature is consistent with the results of a previous study [30]. There was no significant correlation between the TRW at breast height of the stem of P. euphratica and the mean annual precipitation in a previous study [30], which is inconsistent with the results of this study. In this study, the TRW at the STT and the PLT of P. euphratica were significantly affected by precipitation (Figure 8a,b). Although P. euphratica grows in a warm temperate continental climate zone with sparse precipitation, precipitation has an effect on the growth of the STB, PLB, STT, PLT, and SLM.
Correlations between different heights and different parts RWI of P. euphratica and climatic factors from April of the previous year to October of the current year showed no significant correlation between the STB of P. euphratica and temperature (Figure 9, left). Previous studies have shown that the RWI at the breast height of the stem of P. euphratica was negatively correlated with the temperature in September of the previous year. This indicates that growth at the bottom of the stem of P. euphratica is not limited by temperature [52]. The correlation with temperature showed that the lateral branches in the middle and top of the stem were more sensitive to temperature than the bottom of the stem, and the temperature in June of the previous year had a certain “hysteresis effect” on the growth of STM, SLM, and STT in the current year. Correlation with precipitation showed that the RWI of primary/secondary lateral branches at the bottom of the stem of P. euphratica was significantly and positively correlated with precipitation in January of that year (Figure 9, middle). This may have resulted from low precipitation in the study area, which does not contribute much to tree growth [52]. The RWI at the STB was significantly correlated with PDSI in spring and summer (Figure 9, right). When temperature is no longer a limiting factor for tree growth, the limiting role of moisture as well as the correlation between it and PDSI becomes increasingly prominent [44]. Climate change affects the growth of the top of the stem of trees differently from that at breast height [24] and the top of the stem is less sensitive to climate change [22].

4.3. Growth Decline and Response to Drought

Tree growth decline events can be determined from a tree’s radial growth history. Studies have shown that the occurrence of growth depression in trees is a sign of growth decline, and prolonged growth depression indicates that trees are definitively experiencing growth decline [53]. Different degrees of growth decline occurred in the different components of P. euphratica growth from 1984 to 2019 (Figure 10). The timing of growth decline in the stem, primary lateral branches, and secondary lateral branches occurred with some degree of synchronization throughout the growth period. Growth declined at the base of P. euphratica in 1993, 1995, 2005, and 2010–2019. Figure 5a demonstrates that the average temperature in the study area consistently increased from 1961 to 2019. High temperatures and low precipitation increase the intensity of drought and enhance the effects of water stress on physiological processes that are detrimental to the formation and storage of photosynthetic products in trees [54,55]. SLB underwent growth decline more frequently and was more sensitive to drought than STB and PLB (Figure 10a). Figure 10b indicates that a growth decline occurred in the central portions of P. euphratica from 2010 to 2013 and from 2017 to 2019. Growth decline occurred most frequently in the STM and PLM, with synchronous growth decline occurring in different parts in response to drought from 2017 to 2019 (Figure 10b). Growth decline occurred in different parts of the top of P. euphratica in 1994, 2009–2013, and 2017–2019, and growth decline occurred most frequently in the PLT, indicating a greater sensitivity to drought and a strong synchronization in drought responses (Figure 10c). Growth decline occurred simultaneously at the bottom, middle, and top of P. euphratica from 2010 to 2013 and from 2017 to 2019. Studies on forest decline on the Tibetan Plateau have found that recent forest decline is associated with increased drought frequency owing to climate warming [56]. In the present study, more than 30 drought events occurred between 1961 and 2020 (Figure 3), and a growth decline occurred in different parts of P. euphratica corresponding to the occurrence of drought events. Thus, different parts of P. euphratica undergo growth decline owing to drought events. Sensitivity to drought was higher at the middle and top of P. euphratica than at the bottom.
Global tree degradation and mortality affect forest health and ecological services [57]. Decreases or increases in forest mortality may be related to thresholds that affect the specific components of a tree’s ability to recover its growth performance before stress [7]. Under drought stress, some trees adapt through internal regulatory mechanisms, and growth resumes once the stress disappears [58]. In the present study, there were no significant differences between the Rc values of the different parts of P. euphratica (Figure 11b). There was a significant difference between the Rt values in the STB and STT P. euphratica (Figure 11a). The Rt at the bottom of P. euphratica was lower than those at the middle and top (Figure 11a), which shows that growth in the middle and top of the stem of P. euphratica was more sensitive to drought events, and therefore showed a higher resistance to drought events (Figure 11a). Zhou [30] studied the relationship between the radial growth of P. euphratica at breast height and groundwater and temperature and showed that temperature was the main limiting factor for P. euphratica growth when the groundwater burial depth was less than 6 m. Additionally, the frequency of young/moderate drought events was high (10 occurrences) in the study area from 1984 to 2019 (Figure 3). Thus, repeated mild to moderate drought events increased tree resistance to extreme drought stress [59]. In addition to the Rt of PLT, that of lateral branches was higher than that of the stems (Figure 11a). Young trees exhibit a higher Rt than mature wood [60], including that the Rt of trees may be age dependent. Tree resistance is related to water use efficiency, and trees in areas with inadequate water availability have reduced resistance to drought [61]. The groundwater burial depth in the P. euphratica growing area in this study was shallower than that suitable for P. euphratica growth (Figure 4b), with no water stress. Thus, the Rt of P. euphratica showed moisture-independent variation at different heights and parts. In this study, the resilience of the top of P. euphratica was higher than that of the bottom and middle. As the height of the stem increased, Rc increased; the Rc of the primary lateral branches was largest at the top and smallest at the bottom, and the Rc of the middle of the secondary lateral branches was larger than that of the bottom (Figure 11b). Studies have found that physiological damage caused by prolonged drought, such as xylem embolism, reduced reserve or preventative capacity, pest attack, and infection, may reduce the resilience of trees to subsequent drought [62]. The results of Zhou [27] on the xylem hydraulic conductivity and embolism of P. euphratica and its response to drought stress showed that riparian plants adapt to mild drought stress by limiting the xylem hydraulic conductivity of branches to coordinate plant growth. In this study, the Rc at the top of the stem (STT) was the highest. Studies have shown that plants compete for additional light, heat, and nutrient resources by increasing their hydraulic conductivity in well-watered environments [25]. P. euphratica improves the chances of plant survival by increasing the competitiveness of dominant branches and sacrificing non-dominant branches, thereby optimizing the resilience of the whole plant [27].
Tree growth resilience is the ability to restore an original growth rate after being disturbed by extreme events [63]. The values of Rs < 1 reflect the persistent impact of extreme events. In this study, the Rs values of different parts of P. euphratica increased with height and were consistently greater than 1, except for PLT (Figure 11c). This indicated that all parts of P. euphratica, except for the top lateral branches, recovered their pre-disturbance growth rates following an extreme event disturbance.
RRs are defined as Rs weighted by the damage that occurred during a drought. RRs are <0 if the growth rate after a drought event is lower than that during the drought event [7]. In the present study, the RRs decreased in different parts of P. euphratica, indicating that the trees were subjected to drought stress, accumulating from the stem to the secondary lateral branches and from the bottom to the middle. The RRs of P. euphratica SLB was <1 (Figure 11d), indicating that the growth rate of P. euphratica lateral branches was lower than the growth rate during drought. An RRs < 0 indicates that trees experience long-term stress, which leads to loss of vigor and growth decline [64]. The gradual decrease in RRs, which eventually became <0 in the secondary lateral branches, indicated the vulnerability of P. euphratica lateral branches to drought. The combined results proved that the hypothesis that the resistance of the lateral branches of P. euphratica would be higher than that of the stem was valid, but the hypothesis that the recovery force of the lateral branches and the recovery elasticity would be higher than those of the stem was not valid.
Drought is one of the most serious challenges facing species and ecosystems. Drought tolerance is related to water relations in plants [65]. Water relations in plants maintain healthy branches, and prolonged drought conditions for plant growth may affect water relations [66]. Stomatal conductance, hydraulic properties, and water status determine water relations in branches [67]. Past studies have shown that hydraulic properties are related to plant drought resistance [68]. The results of this study showed that growth decline occurred in the top and top branches of the stem of P. euphratica (Figure 10). And the lateral branches of P. euphratica were weaker than the stem in restoring pre-drought growth after drought (Figure 11). This may be related to the sensitivity of water status and water transport efficiency, as well as xylem hydraulic conductivity to drought at different heights and in different parts of P. euphratica [66], or since the physiological activity of apical branches relative to lateral branches can be explained by the lower photosynthesis of last ones because of shading. In conclusion, the effect of drought on the dynamic balance between water supply, water status, and water transport efficiency of P. euphratica is one of the main reasons for the “broke its arm” of P. euphratica under future drought stress.

5. Conclusions

TRW decreased gradually with increasing height and branching class of P. euphratica. Growth declines at the bottom of the stem earlier than at the middle and top. Temperature, precipitation, and PDSI contributed to the growth of the bottom of P. euphratica, while precipitation contributed to the growth of the top. P. euphratica growth change rate decline was highly synchronized across heights and parts, with relatively high declines at the bottom and top. There were no significant differences in the Rc values for different heights and parts of P. euphratica, but the Rt, Rs, and RRs values for the bottom and top were significantly lower than those for the other components, indicating the vulnerability of the bottom and top of P. euphratica to drought. The RRs gradually decreased with the increase in branching class, and the RRs values of the secondary lateral branches at different heights were the lowest. The sensitivity of the bottom and top lateral branches of P. euphratica to drought ultimately leads to their growth decline or even death. Therefore, when drought stress occurs P. euphratica preferentially abandons bottom and top lateral branches and increases resource utilization efficiency to offset the effects of drought on P. euphratica growth.

Author Contributions

Conceptualization, Q.S., Y.D. and F.Z.; investigation, A.A., Y.W., L.P. and H.S.; writing—original draft preparation, A.A.; writing—review and editing, A.A. and Y.D. All authors have read and agreed to the published version of the manuscript.

Funding

This work was funded by the National Natural Science Foundation of China (Nos. U1703237; 32160260 and 31800613).

Data Availability Statement

Data are contained within the article.

Acknowledgments

Special thanks go to the Urumqi Desert Meteorological Research Institute of the China Meteorological Administration for providing us with experimental support. We are also grateful to the government of Daliyaboyi Township, Xinjiang, China, for its strong support of scientific research and to our driver, Ali, who drove us through the Taklamakan Desert.

Conflicts of Interest

The authors declare no conflict of interest.

References

  1. Allen, C.; Macalady, A.; Chenchouni, H.; Bachelet, D.; McDowell, N.; Vennetier, M.; Kitzberger, T.; Rigling, A.; Breshears, D.; Hogg, E.; et al. A global overview of drought and heat–induced tree mortality reveals emerging climate change risks for forests. For. Ecol. Manag. 2010, 4, 660–684. [Google Scholar] [CrossRef]
  2. Wang, J.; Xu, C.; Hu, M.; Li, Q.; Yan, Z.; Jones, P. Global land surface air temperature dynamics since 1880. Int. J. Climatol. 2018, 38, e466–e474. [Google Scholar] [CrossRef]
  3. IPCC. Climate change: Synthesis report. In Contribution of Working Groups, I, II and III to the Fifth Assessment Report of the Intergovernmental Panel on Climate Change; Core Writing Team; Pachauri, R., Meyer, L., Eds.; IPCC: Geneva, Switzerland, 2014; p. 151. [Google Scholar]
  4. Liu, H.; Williams, A.; Allen, C.; Guo, D.; Wu, X.; Anenkhonov, O.; Badmaeva, N. Rapid warming accelerates tree growth decline in semi–arid forests of Inner Asia. Glob. Chang. Biol. 2013, 19, 2500–2510. [Google Scholar] [CrossRef] [PubMed]
  5. Thackeray, S.; Henrys, P.; Hemming, D.; Bell, J.; Botham, M.; Burthe, S.; Helaouet, P.; Johns, D.; Jones, I.; Leech, D.; et al. Phenological sensitivity to climate across taxa and trophic levels. Nature 2016, 535, 241–245. [Google Scholar] [CrossRef]
  6. Zhang, Q.; Yang, J.; Wang, W.; Ma, P.; Lu, G.; Liu, X.; Fang, F. Climatic Warming and Humidification in the Arid Region of Northwest China: Multi–Scale Characteristics and Impacts on Ecological Vegetation. J. Meteorol. Res. 2021, 35, 113–127. [Google Scholar] [CrossRef]
  7. Sun, S.; Lei, S.; Jia, H.; Li, C.; Zhang, J.; Meng, P. Tree–Ring Analysis Reveals Density–Dependent Vulnerability to Drought in Planted Mongolian Pines. Forests 2020, 11, 98. [Google Scholar] [CrossRef]
  8. Jump, A.; Ruiz-Benito, P.; Greenwood, S.; Allen, C.; Kitzberger, T.; Fensham, R.; Martínez–Vilalta, J.; Lloret, F. Structural overshoot of tree growth with climate variability and the global spectrum of drought–induced forest dieback. Glob. Chang. Biol. 2017, 23, 3742–3757. [Google Scholar] [CrossRef]
  9. Dobbertin, M. Tree growth as indicator of tree vitality and of tree reaction to environmental stress: A review. Eur. J. For. Res. 2005, 124, 319–333. [Google Scholar] [CrossRef]
  10. Castagneri, D.; Battipaglia, G.; von Arx, G.; Pacheco, A.; Carrer, M. Tree–ring anatomy and carbon isotope ratio show both direct and legacy effects of climate on bimodal xylem formation in Pinus pinea. Tree Physiol. 2018, 38, 1098–1109. [Google Scholar] [CrossRef]
  11. Huang, M.; Wang, X.; Keenan, T.; Piao, S. Drought timing influences the legacy of tree growth recovery. Glob. Chang. Biol. 2018, 24, 3546–3559. [Google Scholar] [CrossRef]
  12. Gao, S.; Liu, R.; Zhou, T.; Fang, W.; Yi, C.; Lu, R.; Zhao, X.; Luo, H. Dynamic responses of tree–ring growth to multiple dimensions of drought. Glob. Chang. Biol. 2018, 24, 5380–5390. [Google Scholar] [CrossRef] [PubMed]
  13. Bottero, A.; D’Amato, A.; Palik, B.; Bradford, J.; Fraver, S.; Battaglia, M.; Asherin, L. Density–dependent vulnerability of forest ecosystems to drought. J. Appl. Ecol. 2017, 4, 1605–1614. [Google Scholar] [CrossRef]
  14. Anderegg, W.R.L.; Kane, J.M.; Anderegg, L.D.L. Consequences of widespread tree mortality triggered by drought and temperature stress. Nat. Clim. Chang. 2012, 3, 30. [Google Scholar] [CrossRef]
  15. Liu, Y.; Wang, A.; An, Y.; Lian, P.; Wu, D.; Zhu, J.; Meinzer, F.; Hao, G. Hydraulics play an important role in causing low growth rate and dieback of aging Pinus sylvestris var. Mongolia trees in plantations of Northeast China. Plant Cell Environ. 2018, 41, 1500–1511. [Google Scholar] [CrossRef]
  16. Salmon, Y.; Torres-Ruiz, J.; Poyatos, R.; Martinez-Vilalta, J.; Meir, P.; Cochard, H.; Mencuccini, M. Balancing the risks of hydraulic failure and carbon starvation: A twig scale analysis in declining Scots pine. Plant. Cell. Environ. 2015, 38, 2575–2588. [Google Scholar] [CrossRef]
  17. Guada, G.; Camarero, J.; Sánchez, S.; Cerrillo, R. Limited growth recovery after drought-induced forest dieback in very defoliated trees of two pine species. Front. Plant Sci. 2016, 7, 418. [Google Scholar] [CrossRef] [PubMed]
  18. Colangelo, M.; Camarero, J.; Borghetti, M.; Gentilesca, T.; Oliva, J.; Redondo, M.; Ripullone, F. Drought and phytophthora are associated with the decline of Oak Species in Southern Italy. Front. Plant Sci. 2018, 9, 1595. [Google Scholar] [CrossRef]
  19. Heuret, P.; Meredieu, C.; Coudurier, T.; Courdier, F.; Barthélémy, D. Ontogenetic trends in the morphological features of main stem annual shoots of Pinus pinater Ait (Pinaceae). Am. J. Bot. 2006, 93, 1577–1587. [Google Scholar] [CrossRef]
  20. Yu, M.; Cheng, X.; He, Z.; Wu, T.; Yin, Z. Longitudinal Variation of Ring Width, Wood Density and Basal Area Increment in 26–Year–Old Loblolly Pine (Pinus taeda) Trees. Tree-Ring Res. 2014, 70, 137–144. [Google Scholar] [CrossRef]
  21. Zhang, T.; Huang, L.; Zhang, R.; Gao, Y.; Hu, D.; Yu, S.; Jiang, S. The impacts of climatic factors on radial growth patterns at different stem heights in Schrenk spruce (Picea schrenkiana). Trees 2020, 34, 163–175. [Google Scholar] [CrossRef]
  22. Maaten, M.; Bouriaud, O. Climate–growth relationships at different stem heights in silver fir and Norway spruce. Can. J. For. Res. 2012, 42, 958–969. [Google Scholar]
  23. Meng, S.; Lieffers, V.; Reid, D. Reducing stem bending increases the height growth of tall pines. J. Exp. Bot. 2006, 57, 3175–3182. [Google Scholar] [CrossRef] [PubMed]
  24. Chhin, S.; Hogg, E.H.; Lieffers, V.J.; Huang, S. Growth–climate relationships vary with height along the stem in lodgepole pine. Tree Physiol. 2010, 30, 335–345. [Google Scholar] [CrossRef] [PubMed]
  25. Nardini, A.; Pedà, G.; Rocca, N. Trade–offs between leaf hydraulic capacity and drought vulnerability: Morpho–anatomical bases, carbon costs and ecological consequences. New Phytolog. 2012, 196, 788–798. [Google Scholar] [CrossRef] [PubMed]
  26. Simcha, L.; Roni, A. Vascular differentiation in branch junctions of circular patterns and functional significance. Trees 1990, 4, 49–54. [Google Scholar]
  27. Zhou, H.; Chen, Y.; Li, W.; Ayup, M. Xylem hydraulic conductivity and embolism in riparian plants and their responses to drought stress in desert of Northwest China. Ecohydrology 2013, 6, 984–993. [Google Scholar] [CrossRef]
  28. Rice, K.; Matzner, S.; Byer, W.; Brown, J. Patterns of tree dieback in Queensland, Australia: The importance of drought stress and the role of resistance to cavitation. Oecologia 2004, 139, 190–198. [Google Scholar] [CrossRef]
  29. Li, Q.; Feng, Q.; Zhai, L. Study of the height growth dynamic based on tree-ring data in Populus euphratica from the lower reach of the Heihe River, China. Dendrochronologia 2010, 28, 49–64. [Google Scholar]
  30. Zhou, H.; Chen, Y.; Zhu, C.; Li, Z.; Fu, A. Climate change may accelerate the decline of desert riparian forest in the lower Tarim River, Northwestern China: Evidence from tree–rings of Populus euphratica. Ecol. Indicat. 2020, 111, 105997. [Google Scholar] [CrossRef]
  31. Shi, H.; Zhang, F.; Shi, Q.; Li, M.; Dai, Y.; Zhang, Z.; Zhu, C. Responses of arid plant species diversity and composition to environmental factors. J. For. Res. 2023, 34, 1723–1734. [Google Scholar] [CrossRef]
  32. Imin, B.; Dai, Y.; Shi, Q.; Guo, Y.; Li, H.; Nijat, M. Responses of two dominant desert plant species to the changes in groundwater depth in hinterland natural oasis, Tarim Basin. Ecol. Evol. 2021, 11, 9460–9471. [Google Scholar] [CrossRef] [PubMed]
  33. Shi, H.; Shi, Q.; Zhou, X.; Bilal, E.; Li, H.; Zhang, W.; Yasin, K. Effect of the competition mechanism of between co–dominant species on the ecological characteristics of Populus euphratica under a water gradient in a desert oasis. Glob. Ecol. Conserv. 2021, 27, e01611. [Google Scholar] [CrossRef]
  34. Havens, A.V.; Snow, W.B.; Horowitz, J.L.; Liu, C.S. Drought Frequency, Intensity, and Duration: Its Correlation to Streamflow and Its Impact Upon Synthetic Hydrology; New Jersey Water Resources Research Institute: New Brunswick, NJ, USA, 1968; p. 49. [Google Scholar]
  35. Draper, S.H.; Palmer, R.N.; Lettenmaier, D.P.; Burges, S.J. Water Resource System Reliability under Drought Conditions: The Seattle Water Supply System as a Case Study; Charles W. Harris Hydraulics Laboratory Technical Report No. 72; University of Washington: Seattle, DC, USA, 1981; p. 72. [Google Scholar]
  36. Alley, W.M. The Palmer Drought Severity Index: Limitations and Assumptions. J. Clim. Appl. Meteor. 1984, 23, 1100–1109. [Google Scholar] [CrossRef]
  37. Alley, W.M. The palmer drought severity index as a measure of hydrologic drought. J. Am. Water Resour. Assoc. 1985, 21, 105–114. [Google Scholar] [CrossRef]
  38. GB/T 20481–2017; Classification of Meteorological Drought. China Meteorological Administration: Beijing, China; Standards Press of China: Beijing, China, 2017.
  39. Cook, E.R.; Kairiukstis, L.A. Methods of Dendrochronology: Applications in the Environmental Sciences; Kluwer Academic Publishers: Alphen aan den Rijn, The Netherlands, 1990; p. 394. [Google Scholar]
  40. Stokes, M.A.; Smiley, T.L. An Introduction to Tree–Ring Dating; University of Arizona Press: Tucson, AZ, USA, 1968. [Google Scholar]
  41. Silva, L.C.; Anand, M.; Leithead, M.D. Recent widespread tree growth decline despite increasing atmospheric CO2. PLoS ONE 2010, 5, e11543. [Google Scholar] [CrossRef]
  42. Lloret, F.; Keeling, E.; Sala, A. Components of tree resilience: Effects of successive low-growth episodes in old ponderosa pine forests. Oikos 2011, 120, 1909–1920. [Google Scholar] [CrossRef]
  43. Nowacki, G.; Abrams, M. Radial–growth averaging criteria for reconstructing disturbance histories from presettlement–origin oaks. Ecol. Monogr. 1997, 67, 225–249. [Google Scholar] [CrossRef]
  44. Shen, J.; Li, S.; Huang, X.; Wang, S.; Su, J. Ecological resilience and growth degradation of Pinus Yunnanensis at different altitudes in Jinsha River Basin. Sci. Silvae Sin. 2019, 56, 1–11. [Google Scholar]
  45. Gartner, B.; North, E.; Johonson, G.; Singleton, R. Effects of live crown on vertical patterns of wood density and growth in Douglas-fir. Can. J. For. Res. 2002, 32, 439–447. [Google Scholar] [CrossRef]
  46. Zhang, X.; Gao, L.; Qiu, Y.; Guo, J. Characteristics of Korean pine (Pinus koraiensis) radial growth at different heights and its response to climate change on Changbai Mountain. Acta Ecol. Sinic. 2015, 5, 2978–2984. [Google Scholar]
  47. Peterson, D.; Arbaugh, M.; Robinson, L. Effects of ozone and climate on ponderosa pine (Pinus ponderosa) growth in the Colorado Rocky Mountains. Can. J. For. Res. 1993, 23, 1750–1759. [Google Scholar] [CrossRef]
  48. Farrar, J. Longitudinal variation in the thickness of the annual ring. For. Chron. 1961, 37, 323–349. [Google Scholar] [CrossRef]
  49. Larson, P. Stem Form Development of Forest Trees. For. Sci. 1963, 9 (Suppl. S2), a0001-42. [Google Scholar] [CrossRef]
  50. Ford, E.; Avery, A.; Ford, R. Simulation of branch growth in the Pinaceae: Interactions of morphology, phenology, foliage productivity, and the requirement for structural support, on the export of carbon. J. Theor. Biol. 1990, 146, 15–36. [Google Scholar] [CrossRef]
  51. Lehnebach, R.; Beyer, R.; Letort, V.; Heuret, P. The pipe model theory half a century on: A review. Ann. Bot. 2018, 121, 773–795. [Google Scholar] [CrossRef] [PubMed]
  52. Peng, X.; Xiao, S.; Cheng, G.; Xiao, H.; Tian, Q.; Zhang, Q. Human activity impacts on the stem radial growth of Populus euphratica riparian forests in China’s Ejina Oasis, using tree-ring analysis. Trees 2017, 31, 379–392. [Google Scholar] [CrossRef]
  53. Amoroso, M.; Daniels, L.; Larson, B. Temporal patterns of radial growth in declining Austrocedrus chilensis forests in Northern Patagonia: The use of tree-rings as an indicator of forest decline. For. Ecol. Manag. 2012, 265, 62–70. [Google Scholar] [CrossRef]
  54. Liang, E.; Leuschner, C.; Dulamsuren, C.; Wagner, B.; Hauck, M. Global warming-related tree growth decline and mortality on the north-eastern Tibetan plateau. Climat. Chang. 2015, 134, 163–176. [Google Scholar] [CrossRef]
  55. Ren, P.; Rossi, S.; Gricar, J.; Liang, E.; Cufar, K. Is precipitation a trigger for the onset of Xylo genesis in Juniperus przewalskii on the north-eastern Tibetan Plateau? Ann. Bot. 2015, 115, 629–639. [Google Scholar] [CrossRef]
  56. Fang, O.; Alfaro, R.; Zhang, Q. Tree rings reveal a major episode of forest mortality in the late 18th century on the Tibetan Plateau. Glob. Planet Chang. 2018, 163, 44–50. [Google Scholar] [CrossRef]
  57. Gauthier, S.; Bernier, P.; Kuuluvainen, T.; Shvidenko, A.; Schepaschenko, D. Boreal Forest health and global change. Science 2015, 349, 819–822. [Google Scholar] [CrossRef] [PubMed]
  58. Arend, M.; Sever, K.; Pflug, E.; Gessler, A.; Schaub, M. Seasonal photosynthetic response of European beech to severe summer drought: Limitation, recovery and post–drought stimulation. Agric. For. Meteorol. 2016, 220, 83–89. [Google Scholar] [CrossRef]
  59. Backhaus, S.; Kreyling, J.; Grant, K.; Beierkuhnlein, C.; Walter, J.; Jentsch, A. Recurrent mild drought events increase resistance toward extreme drought stress. Ecosystems 2014, 17, 1068–1081. [Google Scholar] [CrossRef]
  60. Rubio–Cuadrado, Á.; Camarero, J.; Aspizua, R.; Sánchez–González, M.; Gil, L.; Montes, F. Abiotic factors modulate post-drought growth resilience of Scots pine plantations and rear-edge Scots pine and oak forests. Dendrochronologia 2018, 51, 54–65. [Google Scholar] [CrossRef]
  61. Sánchez, S.R.; Camarero, J.J.; Rozas, V.; Génova, M.O.; José, M.; Arzac, A. Resist, recover or both? growth plasticity in response to drought is geographically structured and linked to intraspecific variability in pinus pinaster. J. Biogeogr. 2018, 45, 1126–1139. [Google Scholar] [CrossRef]
  62. Brodribb, T.; Powers, J.; Cochard, H.; Choat, B. Hanging by a thread? Forests and drought. Science 2020, 368, 261–266. [Google Scholar] [CrossRef]
  63. Folke, C.; Carpenter, S.; Walker, B.; Scheffer, M.; Elmqvist, T.; Gunderson, L.; Holling, C. Regime Shifts, Resilience, and Biodiversity in Ecosystem Management. Annu. Rev. Ecol. Evol. Syst. 2004, 35, 557–581. [Google Scholar] [CrossRef]
  64. De Grandpré, L.; Kneeshaw, D.; Perigon, S.; Boucher, D.; Marchand, M.; Pureswaran, D.; Girardin, M. Adverse climatic periods precede and amplify defoliator-induced tree mortality in eastern boreal North America. J. Ecol. 2019, 107, 452–467. [Google Scholar] [CrossRef]
  65. Engelbrecht, B.M.; Comita, L.S.; Condit, R.; Kursar, T.A.; Tyree, M.T.; Turner, B.L.; Hubbell, S.P. Drought sensitivity shapes species distribution patterns in tropical forests. Nature 2007, 447, 80. [Google Scholar] [CrossRef]
  66. Li, D.; Si, J.; Zhang, X. Comparison of Branch Water Relations in Two Riparian Species: Populus euphratica and Tamarix ramosissima. Sustainability 2019, 11, 5461. [Google Scholar] [CrossRef]
  67. Hetherington, A.M.; Woodward, F.I. The role of stomata in sensing and driving environmental change. Nature 2003, 424, 901. [Google Scholar] [CrossRef] [PubMed]
  68. Cochard, H.; Herbette, S.; Hernández, E.; Hölttä, T.; Mencuccini, M. The effects of sap ionic composition on xylem vulnerability to cavitation. J. Exp. Bot. 2009, 61, 275–285. [Google Scholar] [CrossRef] [PubMed]
Figure 1. Location of the study sites. (a) Daliyaboyi Oasis, (b) first tree, (c) second tree, (d) third tree. In Figure 1a, the purple circle is a nearby groundwater level observation well; the red circle is a sampling site; and the light blue horizontal line is the stream channel.
Forests 14 02338 g001
Figure 2. Stem and lateral branches are grouped according to the distance from the ground of the primary lateral branches. The number of primary lateral branches refers to the sum of the number of primary lateral branches of the three trees. The purple color indicates the distance of the primary lateral branches from the ground. STB, STM, and STT represent the bottom, middle, and top of the stem, respectively; PLB, PLM, and PLT represent the primary lateral branches at the bottom, middle, and top of the stem, respectively; and SLB and SLM represent the secondary lateral branches at the bottom and middle primary lateral branches of the stem, respectively.
Forests 14 02338 g002
Figure 3. Mean PDSI from April of the previous year to October of the current year. Red circles indicate extreme drought years.
Forests 14 02338 g003
Figure 4. Variation in the vertical profiles of soil water content, n = 3, mean ± SD (a) and groundwater depth (b) at sampling sites. SWC collected in June 2021. Groundwater depth data for 2013–2021.
Forests 14 02338 g004
Figure 5. Variation in annual mean temperature, annual maximum and minimum temperatures, and annual mean precipitation (a); monthly mean temperature, monthly maximum and minimum temperature, and monthly mean precipitation (b) in Daliyaboyi Oasis. The black line is the mean temperature trend; the red line is a precipitation trend.
Forests 14 02338 g005
Figure 6. Variation in the tree-ring width of different parts of P. euphratica (a) and cumulative tree-ring width from 1994 to 2020 (b). (a) n varies from 61 at the bottom to 27 at the top, mean ± SE, (b) n = 27, mean ± SE.
Forests 14 02338 g006
Figure 7. Tree-ring width indices of different components of P. euphratica. (a) Stem: STB, STM, and STT; (b) primary lateral branches: PLB, PLM, and PLT; (c) secondary lateral branches: SLB and SLM. Lowercase letters indicate the corresponding sample size.
Forests 14 02338 g007
Figure 8. Correlation of tree-ring width and mean annual climatic factors (* and ** denote p < 0.05 and p < 0.01, respectively); (a) different heights of the stem; (b) primary lateral branches of different heights; (c) secondary lateral branches of different heights.
Forests 14 02338 g008
Figure 9. Correlation between the tree ring index of P. euphratica and monthly climatic factors. Cur_month represents the current year of ring formation and Pre_month represents the climate variables during the year preceding ring formation (* and ** denote p < 0.05 and p < 0.01, respectively).
Forests 14 02338 g009
Figure 10. Change rate in radial growth of P. euphratica at different heights. (a) Change in radial growth rate of bottom of stem, primary lateral branches at the bottom of the stem, and secondary lateral branches of primary lateral branches at the bottom of the stem. (b) Change in the radial growth rate of the middle of the stem, primary lateral branches at the middle of the stem, and secondary lateral branches of primary lateral branches at the middle of the stem. (c) Change in the radial growth rate of the top of stem and primary lateral branches at the top of the stem. The dashed lines represent the 75% and −25% control lines.
Forests 14 02338 g010
Figure 11. Mean values of resistance (a), recovery (b), resilience (c), and relative resilience (d) of P. euphratica in different drought events. Different letters in the figure indicate the differences among Rt, Rc, Rs, and RRs of different parts of P. euphratica, with different letters indicating significant differences (p < 0.05) and the same letters indicating no significant differences (p < 0.05).
Forests 14 02338 g011
Disclaimer/Publisher’s Note: The statements, opinions and data contained in all publications are solely those of the individual author(s) and contributor(s) and not of MDPI and/or the editor(s). MDPI and/or the editor(s) disclaim responsibility for any injury to people or property resulting from any ideas, methods, instructions or products referred to in the content.