Article

Climate Change-Driven Cumulative Mountain Pine Beetle-Caused Whitebark Pine Mortality in the Greater Yellowstone Ecosystem

1
Department of Watershed Sciences, Utah State University, 5210 Old Main Hill, Logan, UT 84332, USA
2
USDA Forest Service, Rocky Mountain Region, Forest Health Protection, 1617 Cole Blvd. Bldg 17, Lakewood, CO 80401, USA
3
USDA Forest Service, Rocky Mountain Research Station, 860 N 1200 E, Logan, UT 84321, USA
4
Division of Migratory Birds, U. S. Fish and Wildlife Service, 1011 E. Tudor Rd., Anchorage, AK 99503, USA
*
Author to whom correspondence should be addressed.
Retired.
Forests 2023, 14(12), 2361; https://doi.org/10.3390/f14122361
Submission received: 3 October 2023 / Revised: 28 November 2023 / Accepted: 28 November 2023 / Published: 30 November 2023

Abstract

:
An aerial survey method called the Landscape Assessment System (LAS) was used to assess mountain pine beetle (Dendroctonus ponderosae)-caused mortality of whitebark pine (Pinus albicaulis) across the Greater Yellowstone Ecosystem (59,000 km2; GYE). This consisted of 11,942 km of flightlines, along which 4434 geo-tagged, oblique aerial photos were captured and processed. A mortality rating of none to severe (0–4.0 recent attack or 5.0–5.4 old attack) was assigned to each photo based on the amount of red (recent attack) and gray (old attack) trees visible. The method produced a photo inventory of 74 percent of the GYE whitebark pine distribution. For the remaining 26 percent of the distribution, mortality levels were estimated based on an interpolated mortality surface. Catchment-level results combining the photo-inventoried and interpolated mortality indicated that 44 percent of the GYE whitebark pine distribution showed severe old attack mortality (5.3–5.4 rating), 37 percent showed moderate old attack mortality (5.2–5.29 rating), 19 percent showed low old attack mortality (5.1–5.19 rating) and less than 1 percent showed trace levels of old attack mortality (5.0–5.09). No catchments were classified as recent attacks indicating that the outbreak of the early 2000’s has ended. However, mortality continues to occur as chronic sub-outbreak-level mortality. Ground verification using field plots indicates that higher LAS mortality values are moderately correlated with a higher percentage of mortality on the ground.

1. Introduction

In the Greater Yellowstone Ecosystem (GYE), whitebark pine (Pinus albicaulis) functions as a keystone and foundation species [1,2,3]. Whitebark pines provide vital ecosystem functions and services through the production of large, highly nutritious seeds that are a critical food resource to a wide array of wildlife species, including Clark’s nutcracker (Nucifraga columbiana), red squirrels (Tamiasciurus hudsonicusto), black bears (Ursus americanus), and the threatened Yellowstone grizzly bear (Ursus arctos horribilis) [1]. Mattson [4] found that female grizzlies were three times more likely to produce triplets (as opposed to singletons or twins) when and where they had access to abundant whitebark pine seeds, and that the availability of whitebark pine helped reduce human-caused mortality by attracting grizzly bears to remote high-elevation areas—farther away from people. Conversely, when whitebark pine seed crops are poor, grizzly bears died at about twice the rate as when seed crops are good [5]. Whitebark pine is able to establish in soil and climatic conditions too harsh for most other tree species [6,7]. Once established, it provides shelter and improves site conditions, enabling other less hardy local tree species to establish and increasing subalpine diversity [8]. Whitebark pine stands influence high-elevation forest hydrology by stabilizing soils, reducing soil erosion, prolonging snowpack, and delaying snowmelt, which reduces the potential for spring flash floods and provides higher stream flow in the summer months [1,9,10,11]. For these reasons, the health of whitebark pine forests is central to the health of the entire GYE.
Recently, a historically unprecedented decline in whitebark pine has been documented throughout the high-elevation forests of the GYE [12,13,14]. This dramatic decline can be attributed to a number of causes, including recent climate change-driven mountain pine beetle (Dendroctonus ponderosae; MPB) outbreaks, an invasive fungal pathogen that causes the disease known as white pine blister rust (Cronartium ribicola); more frequent and intense wildfires; and climate-induced drought [15]. These threats pose a substantial risk to the persistence of this keystone and foundational species and contributed to the US Fish and Wildlife Service listing whitebark pine as a threatened species, making it the most widely distributed tree to be listed under the Endangered Species Act [16].
Weather as an expression of climate has long been recognized as the primary limitation for MPB outbreaks [17,18]. Critical life history events, like synchronous emergence for mass-attacking host trees and winter survival, are directly driven by seasonal temperature patterns [19]. Because of this important relationship, and due to the economic impact of MPB outbreaks, a temperature-driven model was developed relating environmental temperature to critical life history events [20,21]. The resulting MPB life history model was incorporated within the BioSIM modeling platform [22], which allowed the prediction of critical MPB life history events across complex mountain landscapes [23]. Application of this model corroborated previous observations that the historical mountain climate in the Rocky Mountains was primarily responsible for limiting MPB distribution to montane climatic zones characterized by its primary hosts: lodgepole pine (Pinus contorta latifolia) and ponderosa pine (Pinus ponderosa).
Because of the unfavorably cold conditions found at higher elevations, the historic range of MPB was limited primarily to lower-elevation forests [18,24,25]. Consequently, whitebark pine forests have largely avoided past MPB outbreaks. Although occasional outbreaks occurred in whitebark pine at a higher elevation during anomalous warm periods, these outbreaks were short-lived and collapsed with the return to normal climatic regimes. An observation of a historic widespread outbreak event in the Sawtooth and White Cloud mountains of central Idaho that occurred in the 1930s is an example of such an anomalous event [26]. Motivated by this observation coincident with the first IPCC Climate Assessment in 1990 [27], simulations were initiated that indicated MPB outbreaks were increasingly likely in high-elevation whitebark pine forests with the level of warming predicted in the IPCC report [24,28]. In response, a network of high-elevation weather stations was established in 1994 on Railroad Ridge, a high-elevation (3050 m) site in the White Cloud Mountains. Warming temperatures during the next decade resulted in gradual improvement of conditions for MPB and successfully attacked trees began to appear across the landscape in 2003; by 2006, the previously pristine Railroad Ridge whitebark pine forests had virtually collapsed [29].
Since 1950, annual temperature in the GYE has risen significantly across the region [30]. Based on meteorological records from 43 National Weather Service weather stations spread across the GYE, the average mean annual air temperature in the GYE has warmed by 1.3 °C at a rate of 0.19 °C per decade between 1950 and 2018 [30]. Temperatures above 2100 m elevation in 2018 approach those commonly recorded between 1800 and 2100 m elevation in the mid-20th century [30].With the advent of a warming climate in the GYE [30,31], conspicuous patches of red (MPB-killed whitebark pines) began to appear across the GYE in 1999. Soon after, annual Aerial Detection Surveys (ADS) began to show dramatic increases in MPB-caused mortality in GYE whitebark pine. At first, resource managers had little reason to be alarmed due to previous short-lived outbreaks. However, by 2005, MPB-caused whitebark pine mortality was the highest in any one year since data collection began in 1947, killing an estimated 720,000 whitebark pine trees in one year alone [32]. By 2008, it was becoming clear that this outbreak was more severe and widespread than previously recorded outbreaks. This opinion was based on three observations: the level of mortality was uncharacteristically high, in some cases exceeding 95% of the cone-bearing trees in a stand; the spatial extent was occurring almost simultaneously across much of the GYE whitebark pine forests; and the temporal extent of this outbreak was extending far beyond the previously short-lived outbreaks.
In 2009, in an effort to determine the extent and severity of the ongoing MBP outbreak, an aerial survey method called the Landscape Assessment System (LAS) was used to assess MPB-caused mortality of whitebark pine across the GYE [13]. This cumulative mortality survey found that 95% of the GYE whitebark pine distribution had been impacted and that nearly half (46%) showed severe MPB-caused tree mortality [13]. The GYE experienced an increase in the cumulative growing degree days between 2006 and 2008 that likely contributed to the observed peak (highest number of infested trees) in whitebark mortality in 2009 [15]. Warm temperatures enabled MPBs to shift from a semivoltine (one generation per two years) to a univoltine (one generation every year) life cycle [12]. This increased reproductive output resulted in an exponential increase in whitebark pine mortality [12]. The 2009 LAS survey results indicated that the MPB-caused mortality that started in 1998 exceeded the frequencies, impacts, and ranges of any MBP outbreak documented in the GYE during the last 125 years [13]. Further evidence of the dramatic increase in MPB-associated mortality was found in the Greater Yellowstone Inventory and Monitoring Network’s data indicating a “substantial increase in recorded deaths of monitored trees from 2008 to 2009” [33]. This mortality resulted in “an overall reduction in the number of larger, reproducing trees and a shift to smaller-sized, typically non-reproducing trees in the remaining whitebark pine stands” [33].
Cold snaps, in fall or early spring, can lead to an MPB outbreak collapse [34]. In early October 2009, temperatures across the GYE plummeted to seasonally record-breaking lows, where −29 °C temperatures were common [35]. This widespread cold snap early in the season likely killed MBP larvae before they were able to become cold hardened [15,36]. Starting in 2011, the Greater Yellowstone Inventory and Monitoring Network’s monitoring program documented a decline in the annual count of newly MPB-killed whitebark pine along their monitoring transects [37]. Researchers associated with this monitoring program have suggested that, “the consequences of this weather event and a significantly depleted food supply (beetles had literally eaten themselves out of house and home) in many areas of the GYE likely returned mountain pine beetle populations to pre-warming or endemic levels” [33]. However, the question of how widespread this reduction in MPB populations remained unanswered due to the limited spatial extent of the field-monitored data.
The purpose of the present study was to document cumulative whitebark pine mortality across the entire GYE. Specifically, we addressed the following research questions: Is the reduction in MBP infestation rates of whitebark pine since 2009 widespread throughout the GYE, or is the outbreak ongoing in certain areas? In areas where the outbreak is ongoing, how much additional mortality has occurred since 2009? In areas where the outbreak has ended, how much post-outbreak mortality has occurred since 2009?

2. Materials and Methods
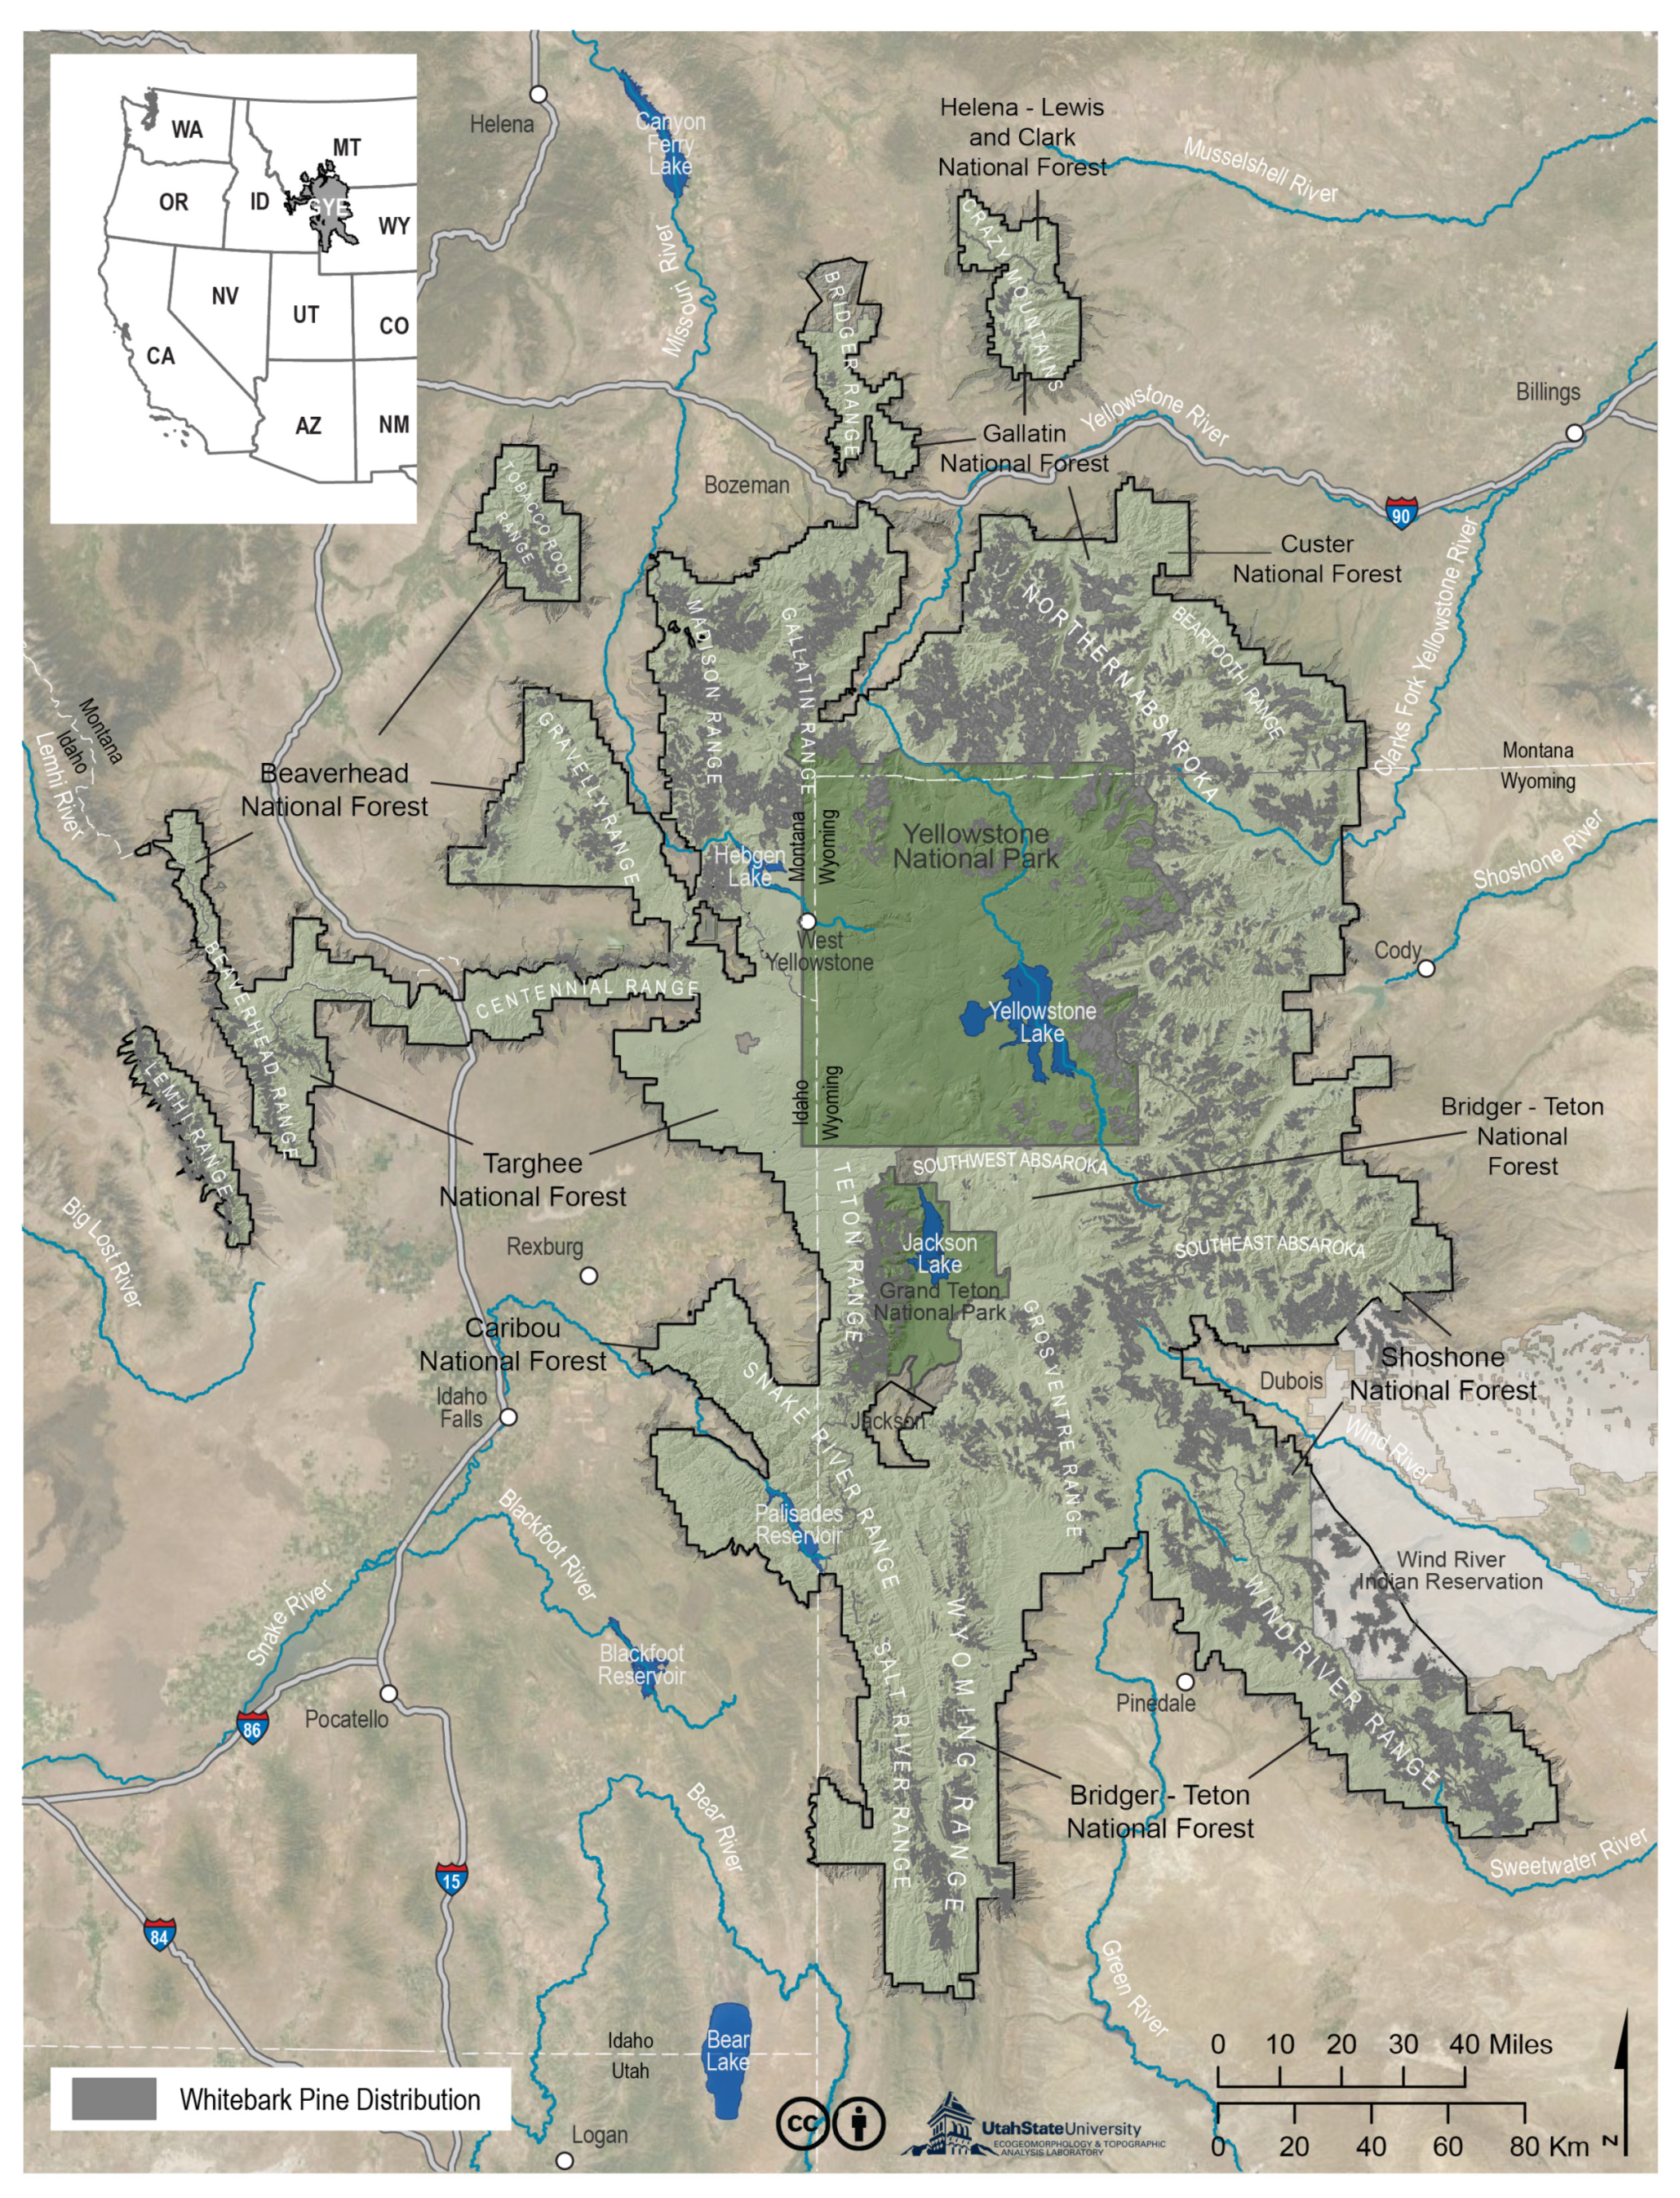
2.1. Study Area

The GYE is a large mountainous landscape covering 59,000 square km that is administratively complex, containing portions of three states, including south-central Montana, northwest Wyoming and southeast Idaho, USA; two national parks, Yellowstone and Grand Teton; six national forests, Custer Gallatin, Beaverhead, Bridger-Teton, Caribou-Targhee, Helena-Lewis and Clark and Shoshone; as well as Bureau of Land Management (BLM) lands; three national wildlife refuges; and various state administrative units and tribal lands (Figure 1). Throughout the GYE, at elevations greater than about 2000 m, coniferous forests are dominant [38]. Approximately 80% of Yellowstone National Park, which lies in the center of the GYE and encompasses ∼9000 square km is covered by lodgepole pine (Pinus contorta latifolia) forests [39]. Outside Yellowstone National Park, the GYE’s topography is more mountainous. Douglas fir (Pseudotsuga menziesiia glauca) and lodgepole pine are the most common species in the GYE montane zone, between approximately 2000 and 2500 m [38], while whitebark pine, the focal species of this study, dominates the drier and more sun-exposed slopes of the subalpine zone (above 2500 m). On wetter, less exposed sites, whitebark pine is a major species, but is successionally replaced by Engelmann spruce (Picea engelmannii) or shade-tolerant subalpine fir (Abies lasiocarpa). At the upper elevations of the subalpine zone, whitebark pine is dominant [32], and extensive contiguous climax forests are found within each of the 22 mountain ranges of the GYE (Figure 1). Stunted stands of whitebark pine and subalpine fir form the upper tree line [38]. According to the 2010 whitebark pine distribution map [40] there are an estimated 10,232 square km of whitebark pine within the GYE, representing 18% of the land cover.

2.2. Landscape Assessment System and Mountain Pine Beetle-Caused Mortality Rating System

LAS has been used to assess beaver dam building habitat [41], map riparian vegetation [42], and to assess whitebark pine mortality [13]. Macfarlane et al. [13] found that LAS combined with the mountain pine beetle-caused mortality rating system (MPBM Rating System) provided an effective assessment of cumulative MPB-caused whitebark pine mortality. For this project, we use the LAS and MPBM Rating System which assigns a numeric (0–5.4) mortality rating based on the proportion of dead trees visible in each aerial photo (Table 1; Figure S1) to document cumulative MPB-caused whitebark pine mortality across the GYE. Herein, we summarize the LAS approach that is described in more detail in Macfarlane et al. [13].

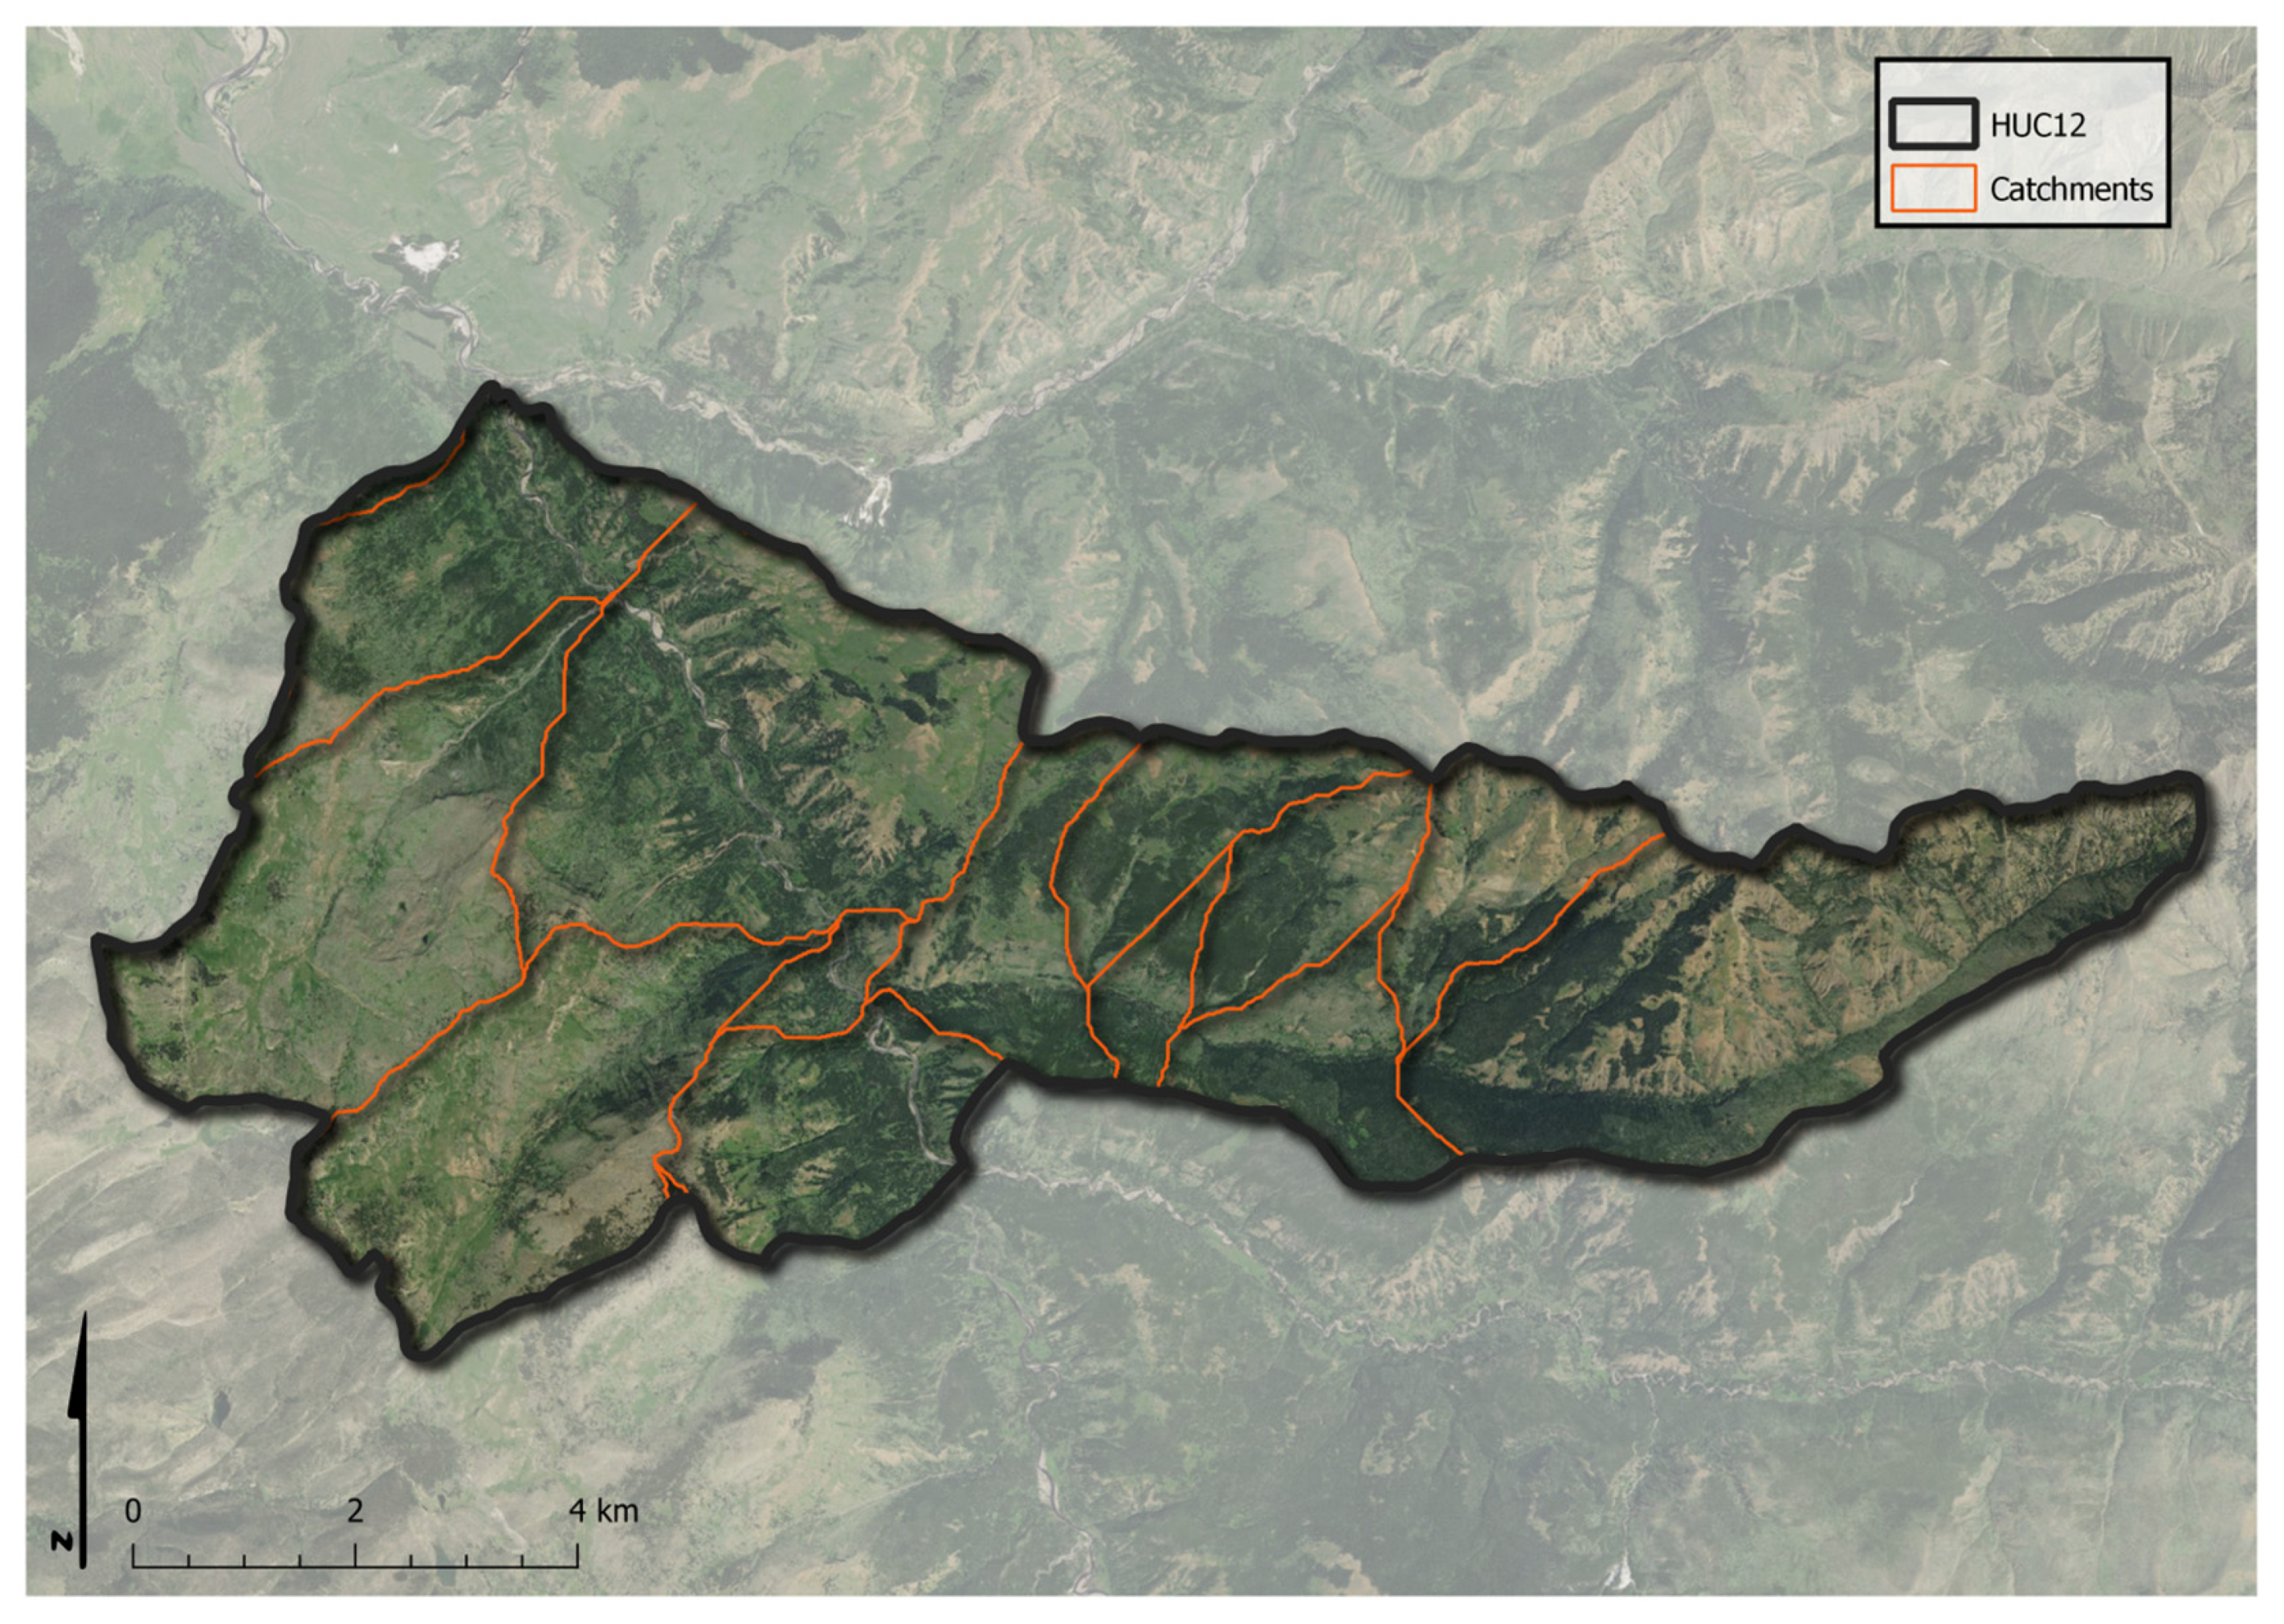
2.3. Spatial Scale of Landscape Assessment System

A catchment is the smallest area unit to be mapped as a discrete entity for this project. Catchment size is directly related to topographic relief: the greater the relief, the smaller the catchment size. Over 70 percent of the GYE whitebark pine distribution is located in mountainous topography and, therefore, the catchments in these landscapes are relatively small, ranging from 100 to 400 ha. The remainder of the study area is distributed on high plateaus where the topography is less complex and therefore the catchments are larger, ranging from 401 to 3000 ha.
A catchment proved to be an appropriate level of resolution to summarize mortality as well as an effective management unit size for implementing conservation and restoration strategies by the GYCC Whitebark Pine Subcommittee [43]. Catchments are subsets of the sub-watershed unit12-digit US Geological Survey Hydrologic Unit Code (HUC 12) and were delineated in ESRI ArcGIS 10.6 (© 1995–2020 ESRI) based on a 30-m digital elevation model (DEM) (Figure 2).

2.4. Landscape Assessment System Data Collection and Processing

LAS is a rapid aerial survey assessment approach that combines geo-tagged oblique photos, traditional aerial imagery (in Google Earth) and GIS-based post-processing to photographically document and map landscape-level conditions including complementary views of forest height, structure, and understory. In this application, the assessment of catchment-level mortality was conducted by “spatially joining” photo points and associated mortality values with catchment boundary spatial data.
The LAS data collection and processing workflow consisted of six steps: (1) flightline development; (2) over-flights and oblique aerial photo capture; (3) image processing; (4) photo point generation; (5) catchment-level photo generation; and (6) mortality assessment and mapping.

2.4.1. Flightline Development

Flightlines consisted of “contour flightlines” in which each catchment is “encircled by the aircraft” or “parallel fixed-width flightlines” in which the aircraft moved along parallel lines using a fixed line interval of 4.75 km (Figure S2). Contour flightlines were used in mountainous terrain and spaced and flown in a manner that provided complete photographic coverage of a given catchment. Parallel fixed-width flightlines were used in less mountainous terrain to provide complete coverage of a given catchment.

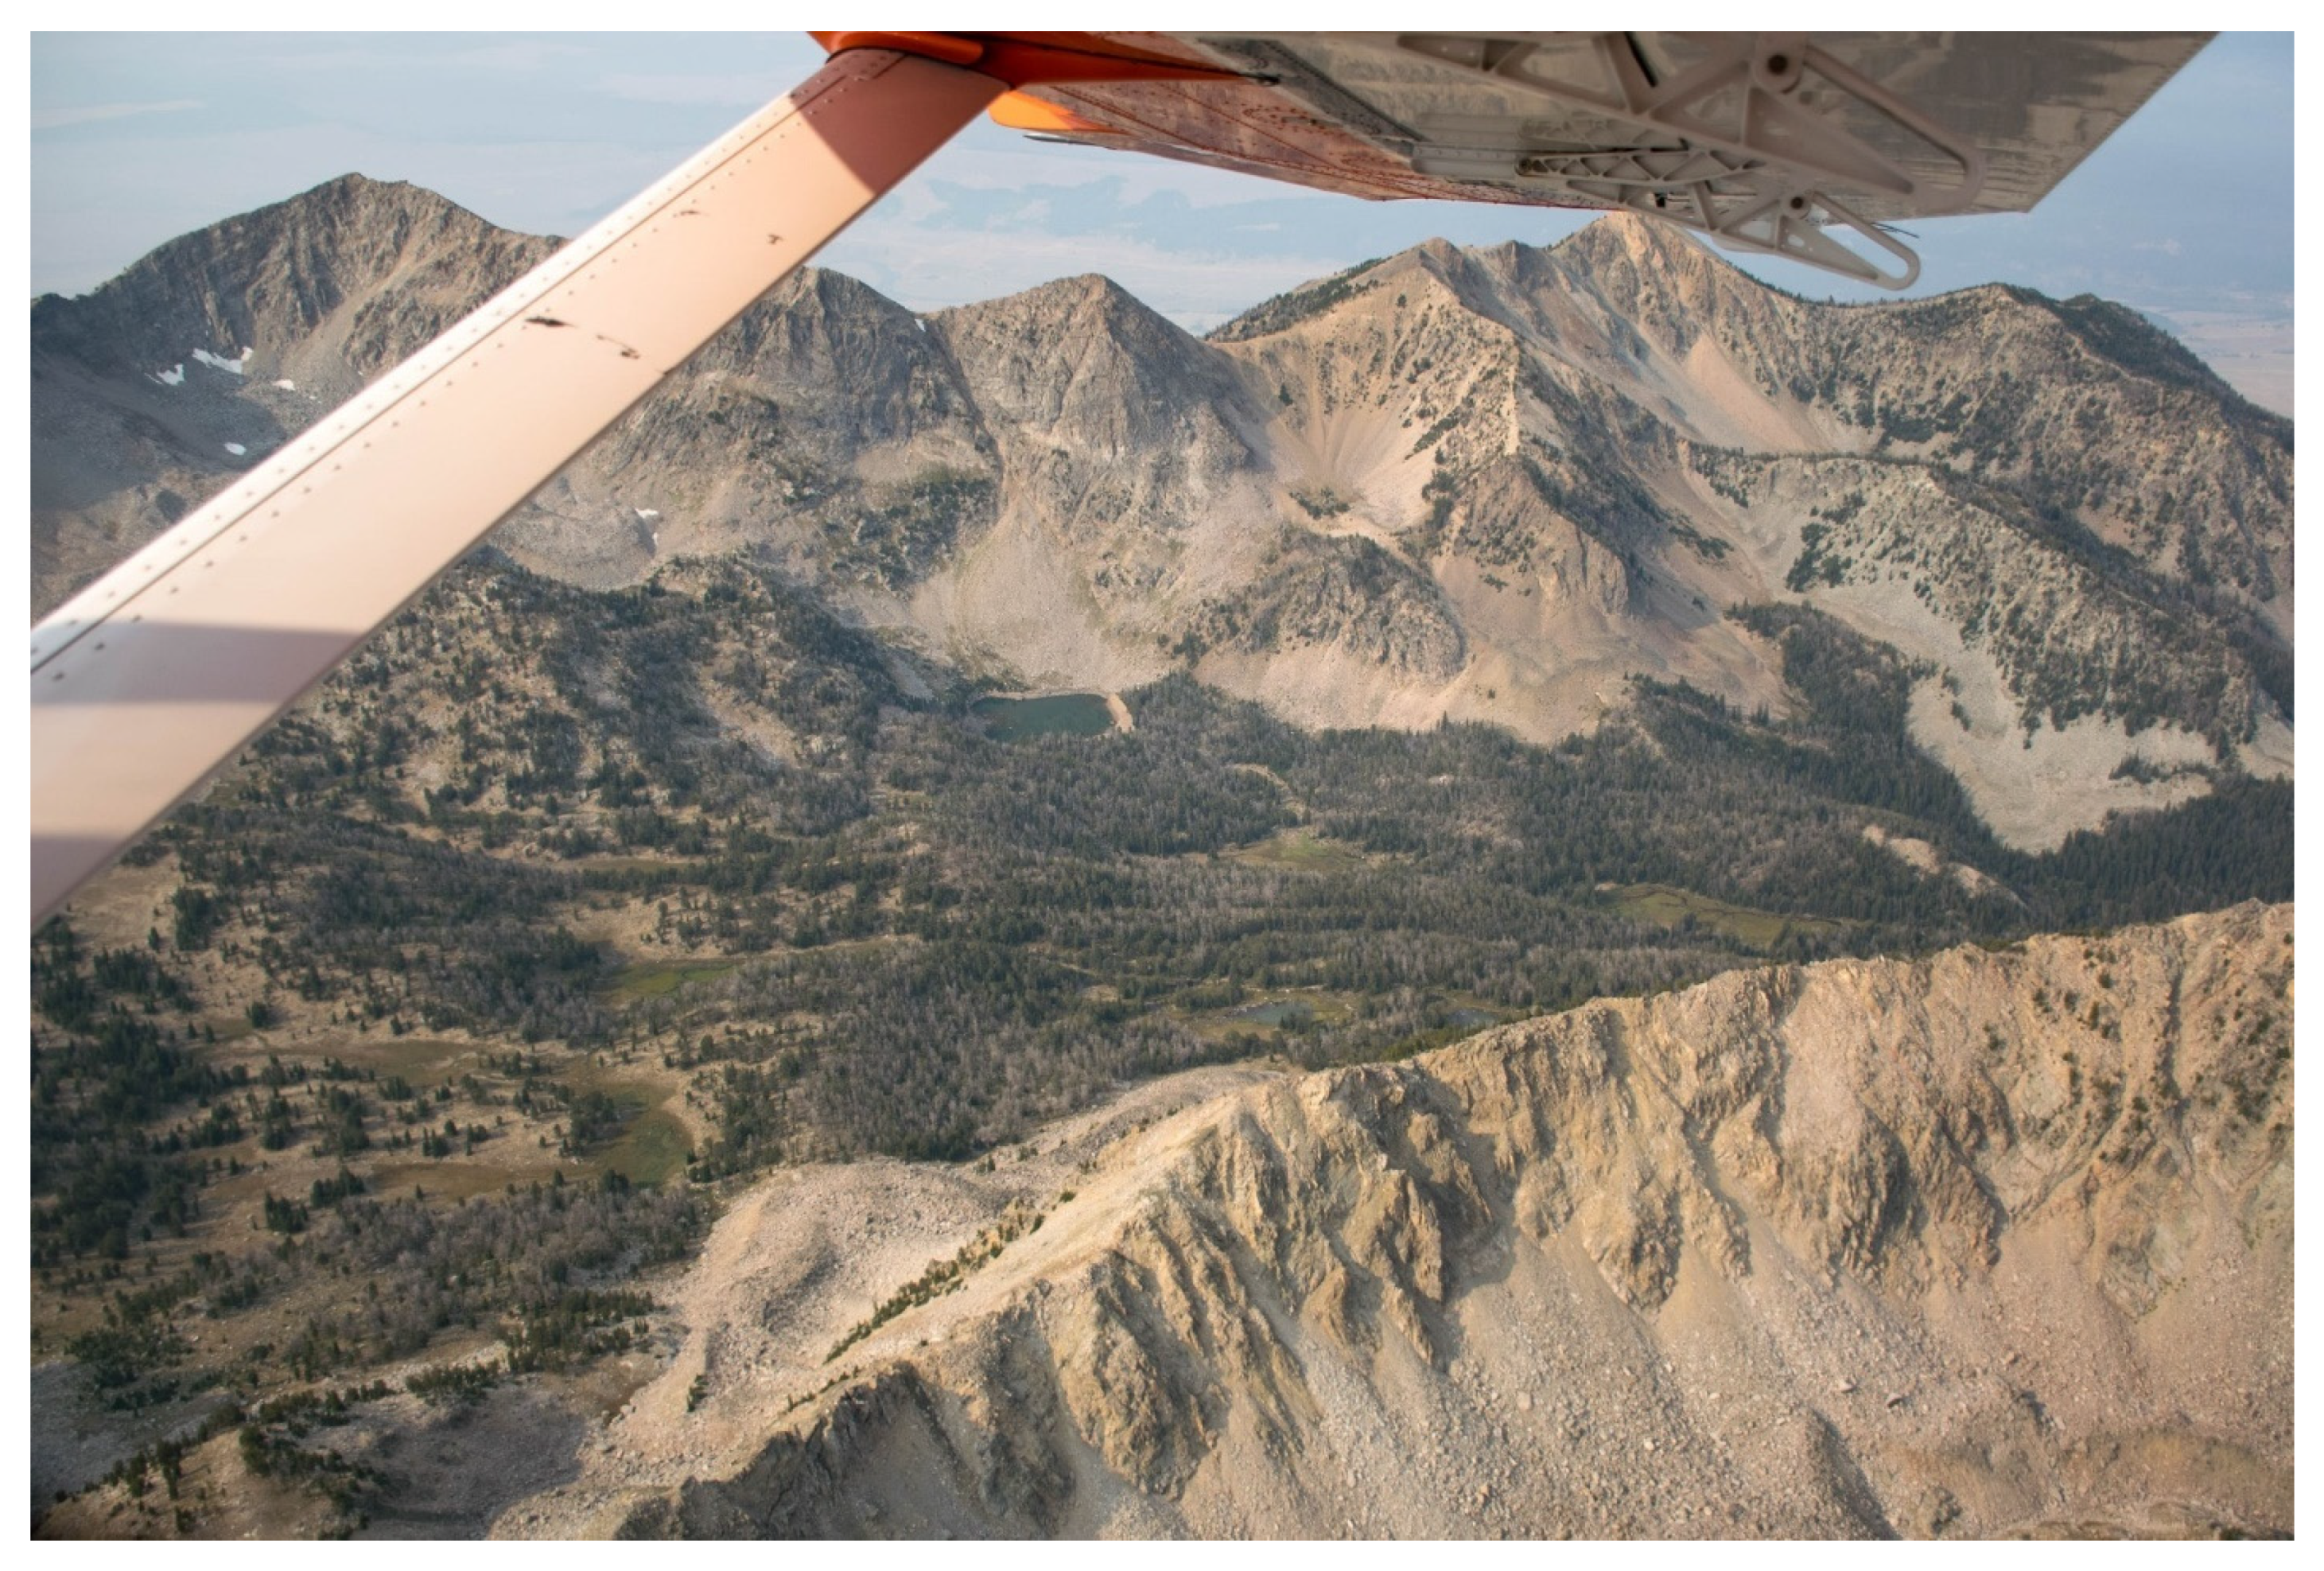
2.4.2. Over-Flights and Oblique Aerial Photo Capture

Low-flying airplane over-flights (300–500 m above ground level) were conducted by R. Spangler, a pilot and biologist, using a Quest Kodiak airplane. An airspeed of approximately 110 to 125 knots was used throughout the flights. A cumulative total of 11,942 km in flightlines were flown for the whitebark pine assessment. In 2018, skies were smoky due to extensive fires during the flight period and, therefore, flights were repeated in 2019 when skies were smoke free. Nikon D5300 GPS-enabled digital SLR cameras were used to capture 24.2-megapixel, geo-tagged, oblique aerial photographs. A two-observer technique was used onboard the airplane. The co-pilot observer, B. Howell, seated on the left side of the aircraft beside the pilot, visually ensured that the flightpath encircled the catchments in a manner that allowed the capture of multiple angles and oblique images along the flightlines. The photographer (B. Meyerson, R. Desantis, W. Macfarlane or C. Garlick) photo-documented the whitebark pines visible from the right side of the aircraft. GPS tracks from a handheld GPS device (Garmin GPSMAP 64 s GPS) uploaded to Garmin Basecamp software (Version 4.7.1, © 2008–2019) were used to geotag photos that had missing coordinates.
Each photo captured had a GPS coordinate and time stamp for the location and time at which the photo was captured. All data was recorded in the exchangeable image file format (EXIF). Each geo-tagged photo was recorded as point data and later used to assign mortality ratings to polygon (catchment-level) data.

2.4.3. Image Processing

Adobe Photoshop Lightroom (Version 3.0, © 2019–2020) was used to examine each photo for image quality. Many photos captured in 2018 were smoky due to extensive fires during the flight period. Additionally, some 2018 and 2019 photos were out of focus or contained reflections from the plane’s window. The photos with the most severe image quality issues (i.e., severe blurriness, dense haze/smoke, and out of focus), were discarded and those with less severe image quality issues were digitally enhanced. To reduce the effects of reflections from the plane’s window and smoke in the air, in Adobe Photoshop Lightroom, we reduced highlights to −60, and increased shadows up to +60, then used the whites and blacks to add contrast back into the photos. In photos with smoke, we also used the “dehaze” feature to improve image quality.

2.4.4. Photo Point Generation

RoboGEO (Version 5.6, © 2003–2010 Pretek, Inc., Stafford, VA, USA) was used to transfer the flightlines and geotagged photos to keyhole markup language (KML) format for use in Google Earth Pro (Version 7.3.2.5776 © 2019 Google, Inc., Menlo Park, CA, USA). This processing step generated “photo points” that identified the location (x, y and z coordinate) of each photo along the flightline.

2.4.5. Catchment-Level Photo Generation

Photographic coverage of catchments was determined by georeferencing aerial photos. Each photo was oriented to the viewpoint in Google Earth to mimic the location of the photo. Oriented photos were used to determine which catchments were “covered” by each photo with the resulting catchments termed “look-at points”. In cases where a photo covered more than one catchment, a duplicate row was added to the photo spreadsheet. Each new row became a duplicate of the original photo and represented an additional catchment-level photo. This resulted in the ‘overlapping’ of look-at points on top of the center of each catchment polygon; the number of overlapping look-at points reflected the number of photos (samples) taken of a given catchment. Ultimately, these catchment-level photos were used to assess whitebark pine mortality per catchment.

2.4.6. Mortality Assessment and Mapping

A pair of observers (G. Henry and C. Garlick) manually assigned mortality ratings using the MPBM Rating System (Table 1 and Figure S1). Computers with dual high-definition flat panel monitors were used for display. One monitor was used to display the appropriate look-at point and associated low-resolution aerial photo in Google Earth (termed “pop-ups”). The second monitor was used to display the respective high-resolution photo centered at the appropriate look-at point in Adobe Lightroom. Mortality levels were assigned at the catchment level by zooming in on the high-resolution photo, visually examining the photo for evidence of whitebark pine mortality, and then applying a single numeric (0–5.4) rating to both the photo and the associated look-at point based on the MPBM Rating System (Table 1 and Figure S1). The MPBM Rating System ranks MPB-caused whitebark pine mortality based on the proportion of dead trees visible in each aerial photo. In forests with active outbreaks, the amount of red (recent attack) and gray (older attack) whitebark pine was visually assessed and rated. The active outbreak ratings ranged from 0–4 with fraction categories (in steps of 0.25) to describe variation within major categories. Forests where the outbreak cycle had ended (no remaining red trees) were classified as old attack mortality, with ratings from 5 through 5.4, depending upon the amount of remaining green whitebark pine visible in the photo (Table 1 and Figure S1). Note that the nonnative fungus that causes the disease known as white pine blister rust does not cause all needles on a tree to turn red in a single year as MBP infestation does; therefore, misidentification of sources of mortality by observers was unlikely.
Both point and polygon whitebark pine mortality maps were generated in ESRI ArcGIS. Point map generation consisted of plotting the “stacked” look-at points and their associated averaged mortality values onto a project area map. Polygon map generation involved a GIS process that consisted of “spatially joining” the look-at point mortality classification and the catchment boundaries, then “clipping” the catchment extents by the whitebark pine distribution to form the catchment-level mortality map. For catchments not directly sampled by look-at points, a polygon layer was calculated using kriging that predicts mortality by computing a weighted average of nearby mortality values. The final polygon-based mortality map consisted of a combination of photo-inventoried and interpolated mortality values at the catchment-level.

2.5. Precision Assessment

Manual classification of MPB-caused mortality is inherently subjective because of observer variability and thus directly influences the repeatability (precision) of the resulting classifications. The precision of our classification method was assessed by randomly selecting a total of 382 aerial photos (9 percent of total photos), then having two observers independently classify mortality in each photo using the LAS method described above. Because it is more robust and conservative than the overall error rate, we used Cohen’s kappa statistics (0–1) to measure agreement between the observers’ classifications [44].

2.6. Accuracy Assessment

During the fall of 2021, the LAS survey was ground-verified by evaluating 16 randomly selected catchments stratified by easy road access and current LAS survey mortality categories. Within these catchments a total of 150 randomly selected plots were established, consisting of 9 plots within low LAS mortality catchments, 74 plots within moderate LAS mortality catchments, and 67 plots within severe LAS mortality catchments (Figure S3). The 2010 GYCC Whitebark Pine Subcommittee whitebark pine KML layer was used in Google Earth to help identify areas within each catchment that were likely comprised of dominant whitebark pine forest (where at least 50% of the trees are whitebark pine). While in the field, technicians walked along a random compass bearing until they reached a stand where whitebark pine was dominant. Upon reaching each plot, technicians measured out 11.3 m in four directions from the plot center to establish a 0,04 hafixed-radius plot. The following data was collected for each tree within the plot: (1) diameter at breast height (DBH) (1.37 m) above ground, (2) DBH class (<12.70 cm, 15.24–25.4 cm, 27.94–38.1 cm, 40.64–50.8 cm, and >50.8 cm), (3) species (whitebark pine or non-whitebark pine), (4) mortality status (grey/dead, red/active mortality or live), and (5) mortality cause (beetle or other). Additionally, counts of whitebark pine seedlings and saplings (>12.70 cm DBH and shorter than shoulder height) were recorded. Once a plot was completed, another random compass bearing was walked for at least 50 paces until another dominant whitebark pine stand was reached. In cases where whitebark pine were not encountered after 100 paces a new random compass bearing was followed. To compensate for aerial LAS’s inability to detect understory mortality, trees smaller than approximately 12.70 cm DBH, only trees greater than 12.70 cm DBH were evaluated in the accuracy assessment. To make the aerial and field-based mortality assessments more comparable and to explicitly compensate for the enormous spatial scale mismatch between the datasets (i.e., catchment scale vs. 0.04-ha plot scale), we averaged the mortality values across all field plots within a given catchment (generally 10 plots; 2 clusters of 5 plots).

3. Results

The resulting whitebark pine mortality assessment products were (1) oblique aerial photos, (2) look-at point mortality maps and KML point files with associated photo “pop-ups”, and (3) polygon (catchment-level) mortality maps and associated polygon shapefiles.

3.1. Oblique Aerial Photos

We determined that a total of 4434 oblique aerial photos were high enough quality for accurate mortality assessment (Figure 3). These photos were widely distributed along 11,942 km of flightlines covering the GYE-distribution of whitebark pine. This extensive photo inventory documented widespread severe post-outbreak cumulative whitebark pine mortality. The vast majority of the photos show extensive areas of dead (gray) whitebark pine forests. There were no photos that recorded recent attacks, indicating that the outbreak of the early 2000’s has ended. The 4434 photos classified by mortality ratings can be used to evaluate potential conservation and restoration areas for regeneration and recovery of whitebark pine populations.

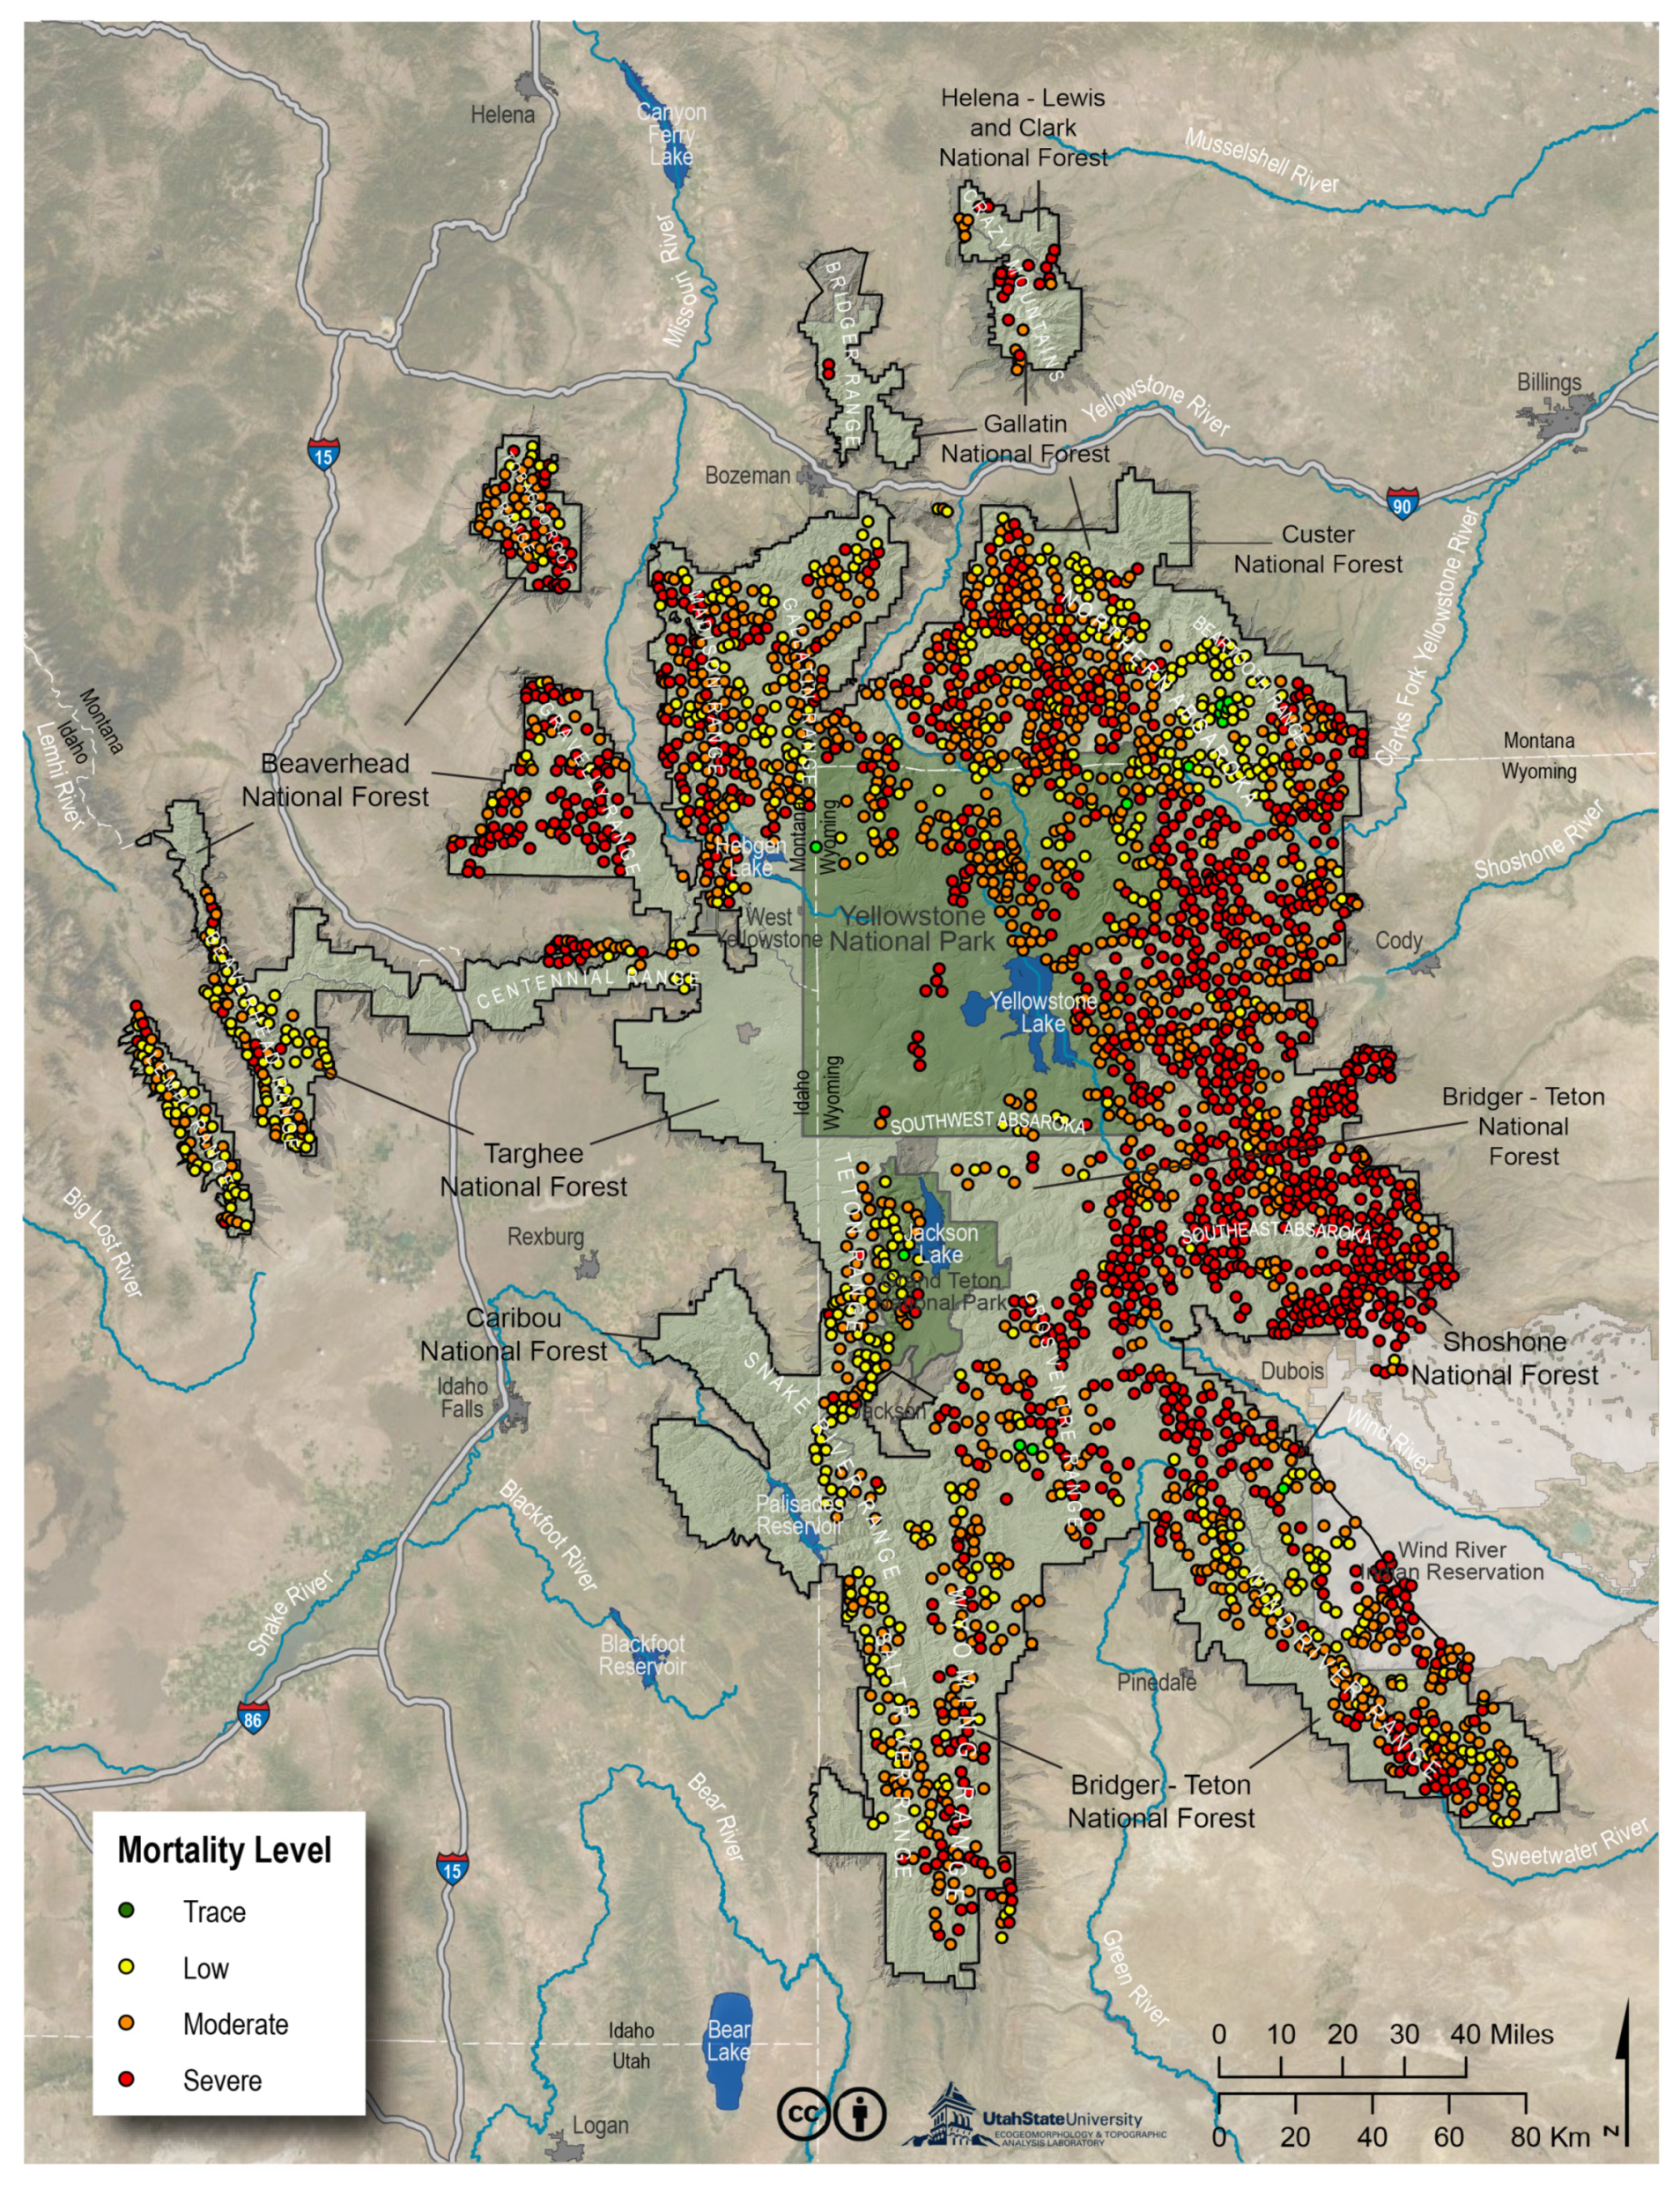
3.2. Point Level Mortality Data

The point-based mortality map displayed point level mortality ratings (5.0–5.4) and revealed clusters of mortality indicating strong spatial autocorrelation (i.e., areas closer together are more likely to have the same level of mortality than those far apart; Figure 4). Areas of severe mortality, shown as clusters of red points, indicate that an area has experienced outbreak levels of MPB populations. Severe mortality points are widespread across the GYE, especially in the Absaroka Range in the Shoshone National Forest east of Yellowstone National Park and the Gravelly Range in the northwest portion of the GYE. Areas of moderate mortality, shown as clusters of orange points, indicate that MPB populations did not reach outbreak levels. Moderate mortality points are scattered across the GYE, especially within Yellowstone National Park. Areas of low mortality, shown as clusters of yellow points, indicating areas that, at least for the present, remain as functioning whitebark pine forests. Low mortality points are less common, the Eastern Beartooth Plateau northeast of Yellowstone National Park is one such area. This area of refuge from MPB outbreaks, at least for the time being, corresponds to a location that has a colder microclimate. The Beartooth Plateau is the largest contiguous area above 3000 m in the Rocky Mountains [45]. This large, high plateau is extremely cold, with particularly long winters [46].
All documented residual forests (the forest that remains after an MPB outbreak) in the 2009 LAS survey were classified with severe (5.3 or greater) ratings, indicating that at that time the MPB infestations were consistently progressing to an outbreak stage. However, the 2018–2019 results not only documented residual forests with severe ratings but also documented residual forests with low (5.1–5.175) and moderate (5.2–5.275) mortality ratings, indicating MPB activity had stopped at sub-outbreak levels of mortality.

3.3. Catchment-Level Mortality Map

The project’s aerial photos intersected 2672 of the total 4689 catchments (74% by area). Another 10,522 ha (1% by area) were identified as wildfire-dominated mortality catchments and were excluded from the MPB-caused mortality analysis. For the remaining 2017 catchments (25% by area), a mortality surface was interpolated using kriging (Figure S4). Based on the results of the Global Moran’s I statistic and Ripley’s K-function, kriging was determined to be appropriate. A positive Moran’s I index of 0.82 was computed for the Global Moran’s I statistic, which evaluated whether the mortality pattern expressed was clustered, dispersed, or random; a statistically significant tendency toward clustering was indicated. The Ripley’s K-function also indicated that the mortality photo point data exhibited strong spatial dependence (feature clustering) over the entire GYE whitebark pine distribution. This strong spatial autocorrelation established that these data were appropriate for kriging.
The photo-inventoried and interpolated catchment-level mortality data were combined to generate GYE-wide mortality data. Similar to the point-based analysis, the catchment-level data revealed pervasive moderate to severe whitebark pine mortality across the vast majority (81 percent) of the GYE (Figure 5 and Figure 6). Severe mortality (44%) indicates catchments with widespread decline and collapse (near complete loss of mature cone bearing trees and regeneration that is imperiled by multiple threats, including blister rust and future MPB outbreaks) of this foundational and keystone species. All mortality was identified as old attack (gray phase), indicating that the outbreak has ended.

3.4. Precision Assessment

When two observers independently classified mortality on 382 aerial photos (9 percent of total photos) using the MPBM Rating System, the observed kappa statistic with linear weighting was 0.84, indicating almost perfect agreement. Landis and Koch [47] provide the following kappa ranges for strength of agreement: poor (0.00), slight (>0.00–0.20), fair (0.21–0.40), moderate (0.41–0.60), substantial (0.61–0.80), and almost perfect (0.81–1.00).

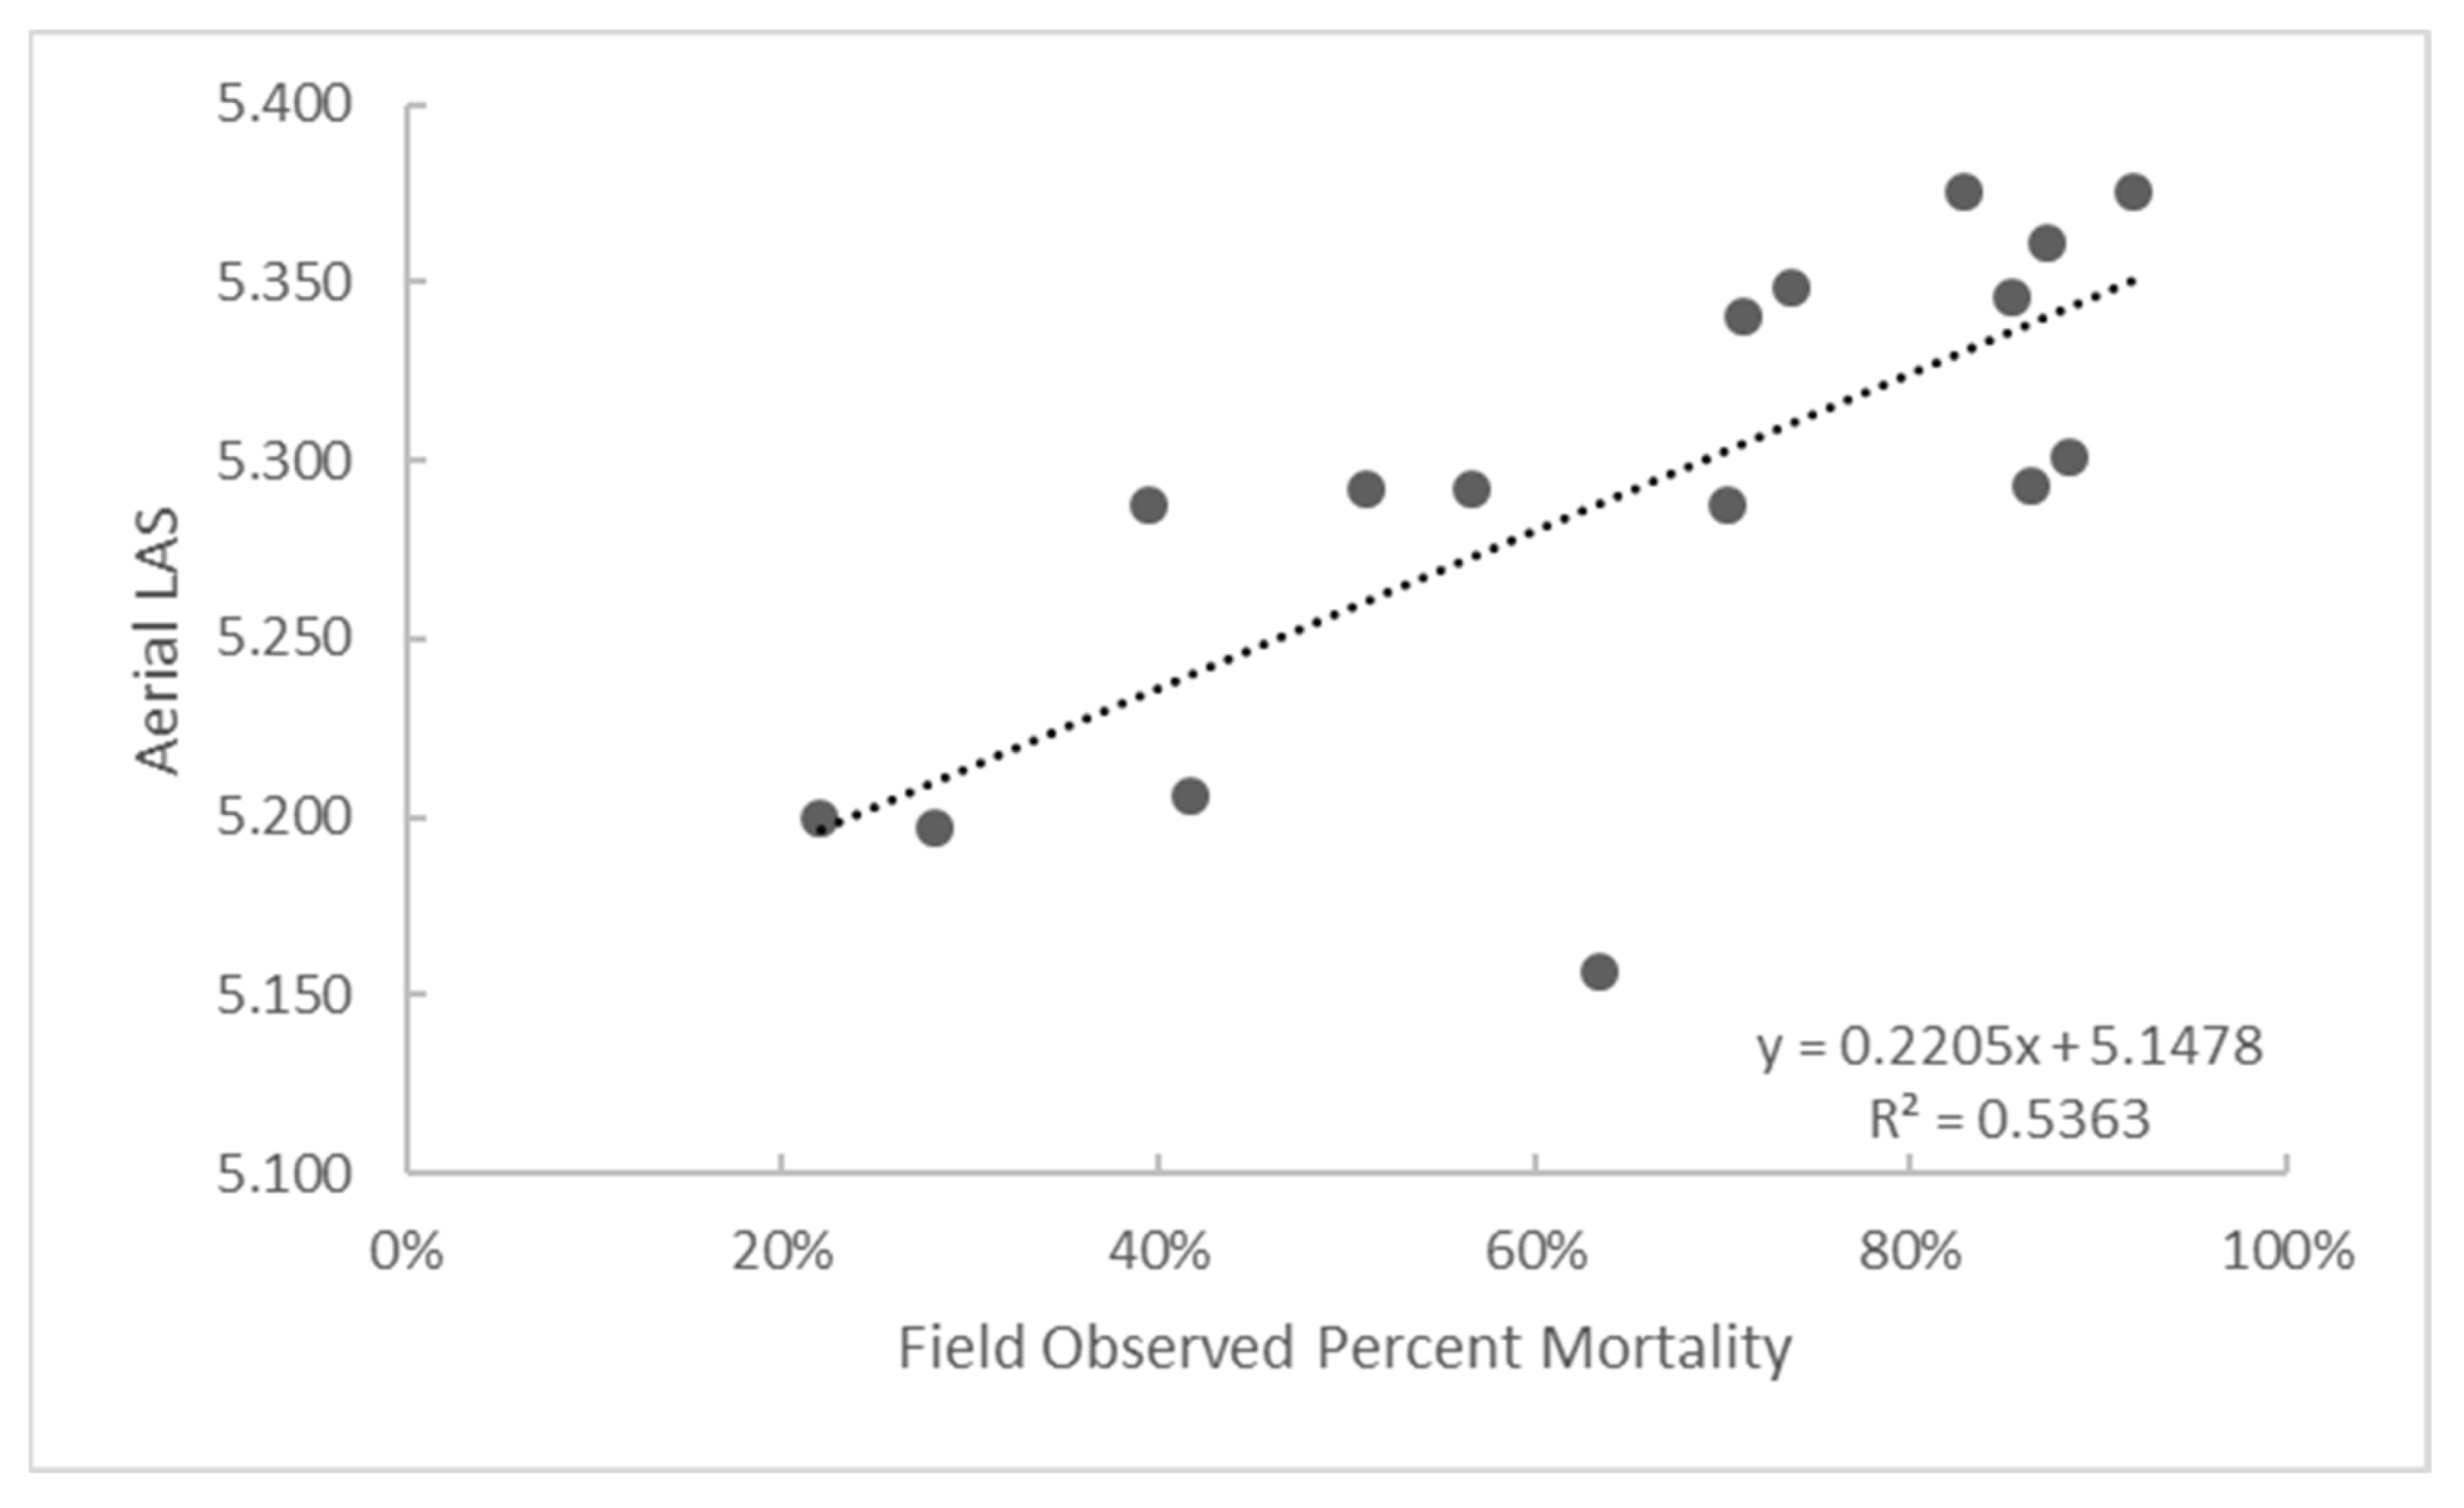
3.5. Accuracy Assessment

In general, when we compared the LAS survey mortality scores and field-based plot percent mortality data we found that as LAS survey mortality increases, so too does percent mortality on the ground. We found a moderate positive correlation (R2 = 0.5363) between LAS survey mortality scores and field-based percent mortality calculations, indicating a generally good agreement between aerial and ground mortality values (Figure 7). The exception was found in one of the sampled catchments on the Beartooth Plateau where only one cluster of five plots was sampled which had much higher percent mortality on the ground (63% mortality) compared to the low mortality level with a numeric rating of 5.2 assessed with the LAS survey at the catchment level.

4. Discussion

4.1. Accuracy Assessment Limitations

Our mortality accuracy assessment showed that averaged field-based percent mortality values per catchment and LAS mortality scores were only moderately positively correlated with each other. This modest level of correlation was likely due in part to our relatively small sample size, the spatial mismatch between field and aerial survey data, and the fact that a majority (56%) of the accuracy assessment catchments had LAS scores assigned to them by interpolation rather than directly sampled with photos. The vast spatial extent of the area (59,000 square km) combined with the fact that GYE whitebark pine occupies such remote and inaccessible habitat limited our data collection to 16 catchments in which a total of 150 mortality plots were assessed. In addition, the field-based mortality, on average, only consisted of 10 sample plots per catchment comprising a total of ~0.04 ha, whereas the minimum mapping unit for aerial LAS is a catchment ranging in size from 87 to 1887 ha. Given that the field data represents a much smaller area than the catchment, the field-based mortality data collected may not be representative of the mortality within the catchment as a whole, especially in catchments with high mortality heterogeneity. Moreover, it is likely that directly sampled catchments would have more accurate mortality scores compared to interpolated catchments. Thus, the associated correlation between the LAS survey scores and the field-based mortality percentages would have been more highly correlated if sampled catchments had been used for the accuracy assessment. Further fieldwork aimed at the collection of additional mortality plots is warranted as more funding becomes available and could be used to further assess the accuracy of the 2018–2019 LAS survey.

4.2. Examining Cumulative Mortality over Time

Examining both the 2009 LAS survey [13] and the 2018–2019 LAS survey (described herein) in terms of basic MPB population dynamics is insightful for understanding this historically unprecedented decline in whitebark pine. MPB populations fluctuate based on temperature and the availability of food (pines) within five major phases: endemic, incipient-outbreak, outbreak, collapse, and post-outbreak [48]. Endemic populations of MPB are defined as a low number of individuals that attack weak or stressed pines and were found throughout GYE whitebark pine prior to the onset of climate warming that began around 1998. Incipient-outbreak is the initial stages of an outbreak that may or may not progress to a full-blown outbreak. There are GYE-based examples of the incipient-outbreak phase from short-lived warming events in the 1930’s and 1970’s that resulted in short-lived outbreaks limited in spatial scale [26]. The population transitions from incipient to full-blown outbreak when favorable temperatures persist long enough; in this scenario, enough MBP individuals are produced that they overcome the defenses of large and healthy trees and the outbreak spreads with increasing number of infested trees. This full-blown outbreak phase was documented by the 2009 LAS survey that coincided with the timing of the MPB outbreak peak in the GYE [49] and showed severe active (red phase) whitebark pine mortality throughout the GYE. The collapse phase is characterized by a decreasing number of infested (red) trees and an increasing number of dead (gray) trees, and post-outbreak is the condition of the forest following an outbreak. Both the collapse phase and the post-outbreak phases were captured by the 2018–2019 LAS survey and illustrate that tree mortality continues to occur at an alarming rate even when MPB populations are at post-outbreak levels.
The 2009 LAS survey results are starkly different from the 2018–2019 LAS survey results. Whereas the 2009 LAS survey captured the peak of the active MPB outbreak, the 2018–2019 survey recorded no active-phase mortality or new severe mortality across the GYE. These findings support that the MBP collapse occurred in 2009 and was associated with the October cold snap [50]. However, the collapse did not bring an end to the mortality. In 2009, 5% of the catchments showed trace levels of mortality; however, by 2018–2019, trace levels of mortality had been reduced to only 1% of the catchments. This indicates that, since 2009, significant post-outbreak-level mortality has occurred in formerly healthy forests. In other words, beetles had not yet “eaten themselves out of house and home”, at least in some parts of the GYE. This lower-intensity but more insidious mortality will likely continue and could kill large swaths of remaining forest over time. In addition, with continued warming, another outbreak could occur in areas with enough live trees to support outbreak populations [21]. As such, we contend that resource managers should not “let their guards down” just because the GYE is not experiencing an MPB outbreak at the present time.
There are some limitations in comparing the 2009 survey to the 2018–2019 survey because there are substantial differences in the design and execution of the surveys. First, the 2018–2019 survey was not specifically designed as a repeat of the 2009 survey. Instead, the 2018–2019 survey was designed to document all forest mortality in the GYE, whereas the 2009 survey was focused exclusively on whitebark pine mortality. As such, the 2009 flight lines ran parallel to mountain ridges to exclusively capture high-elevation forest mortality. Conversely, the majority of the 2018–2019 flight lines were grid flight lines with fixed widths between them aimed to capture ecosystem-wide forest mortality, not just high-elevation forest mortality. In addition, 2018 was a severe fire season with very smoky skies that required higher flight heights for safe navigation in mountainous terrain. Although the imagery was a high enough quality to detect mortality rates, the higher flight heights and smokier imagery may have affected the mortality-rate accuracy. Additionally, the grid flight lines and higher flight heights of the 2018 flights resulted in photos that covered a much larger area so that a single photo captured multiple catchments, and subsequent photos overlapped one another, resulting in many photos documenting the same catchment. Thus, catchment-level mortality was based on averaging mortality values from each of the photos that intersected a given catchment. Conversely, in the 2009 survey, typically a single photo was captured per catchment and a mortality value was assigned to a catchment based on that one photo.

5. Conclusions

This work provides an accurate assessment of cumulative whitebark pine mortality and is a critical first step in formulating effective recovery strategies. The LAS aerial survey results presented here corroborate observations from a previous LAS aerial survey that documented cumulative whitebark pine mortality in 2009 at the peak of the MPB outbreak [13], and they further confirm that unprecedented mortality has occurred and continues to occur as chronic sub-outbreak-level mortality after the MPB outbreak ended. Given enough time, the insidious nature of sub-outbreak-level mortality can have the same devastating effect on forest health as an epidemic outbreak can have. Moreover, as climate once again becomes favorable for MPB, these sub-outbreak-level populations are capable of explosive population growth, especially in currently lightly to moderately affected forests, increasing the likelihood of future MPB outbreaks. Another benefit of this study is that we were able to identify and locate the few remaining forests where mortality is low and that are still fully functioning ecosystems, with living, mature, cone-bearing trees, to effectively prioritize our conservation efforts. Additionally, site-specific knowledge of forests with high and moderate levels of mortality will help us understand where we should strategically prioritize our restoration efforts and where restoration efforts may be less effective due to their higher risk of outbreaks in the face of a warming climate. It is our hope that the spatially explicit mortality information from this survey will be used to develop and implement effective recovery strategies that include both conservation and restoration efforts. The long-term consequences of this loss for this critical forest species warrants further investigation, documentation, and monitoring.

Supplementary Materials

The following supporting information can be downloaded at: https://www.mdpi.com/article/10.3390/f14122361/s1. Figure S1: mountain pine beetle-caused mortality rating system; Figure S2: 2018 and 2019 Landscape Assessment System (LAS) flightlines; Figure S3: ground-verification catchments and associated field-based mortality plots; Figure S4: photo-inventoried catchments, interpolated catchments, and fire mortality areas.

Author Contributions

Conceptualization, W.W.M. and J.A.L.; methodology, W.W.M., B.H., R.E.S. and J.A.L.; validation, W.W.M., A.L.S. and C.C.R.; formal analysis, W.W.M., B.H., J.A.L., A.L.S. and C.C.R.; data curation, W.W.M., A.L.S. and C.C.R.; writing—original draft preparation, W.W.M. and J.A.L.; writing—review and editing, W.W.M., J.A.L., B.H., R.E.S., A.L.S. and C.C.R.; visualization, W.W.M. and C.C.R.; supervision, W.W.M. and B.H.; project administration, W.W.M. and B.H.; funding acquisition, W.W.M. and B.H. All authors have read and agreed to the published version of the manuscript.

Funding

This research was funded by the U.S. Department of Agriculture U.S. Forest Service, grant number 17-CS-11020000-082. Additional funding was provided by the Greater Yellowstone Ecosystem Coordinating Committee Whitebark Pine Subcommittee.

Data Availability Statement

The data contained within this article are publicly available at the data repository found here: https://doi.org/10.26078/0n3a-mt47.

Acknowledgments

The authors would like to acknowledge two anonymous reviewers for their suggested edits, which greatly improved the article. We thank C. Garlick, G. Henry, B. Meyerson, and R. Desantis for their assistance in image collection and tree mortality classifications and B. Lalande and J. Ross for their assistance with data analyses.

Conflicts of Interest

The authors declare no conflict of interest. The funders had no role in the design of the study; in the collection, analyses, or interpretation of data; in the writing of the manuscript; or in the decision to publish the results.

References

  1. Tomback, D.F.; Arno, S.F.; Keane, R.E. (Eds.) Whitebark Pine Communities: Ecology and Restoration, 1st ed.; Island Press: Washington, DC, USA, 2001; ISBN 978-1-55963-718-3. [Google Scholar]
  2. Ellison, A.M.; Bank, M.S.; Clinton, B.D.; Colburn, E.A.; Elliott, K.; Ford, C.R.; Foster, D.R.; Kloeppel, B.D.; Knoepp, J.D.; Lovett, G.M.; et al. Loss of Foundation Species: Consequences for the Structure and Dynamics of Forested Ecosystems. Front. Ecol. Environ. 2005, 3, 479–486. [Google Scholar] [CrossRef]
  3. Resler, L.M.; Tomback, D.F. Blister Rust Prevalence in Krummholz Whitebark Pine: Implications for Treeline Dynamics, Northern Rocky Mountains, Montana, U.S.A. Arct. Antarct. Alp. Res. 2008, 40, 161–170. [Google Scholar] [CrossRef]
  4. Mattson, D.J. Causes and Consequences of Dietary Differences among Yellowstone Grizzly Bears (Ursus Arctos); University of Idaho: Moscow, ID, USA, 2000. [Google Scholar]
  5. Pease, C.M.; Mattson, D.J. Demography of the Yellowstone Grizzly Bears. Ecology 1999, 80, 957–975. [Google Scholar] [CrossRef]
  6. Tomback, D.F.; Linhart, Y.B. The Evolution of Bird-Dispersed Pines. Evol. Ecol. 1990, 4, 185–219. [Google Scholar] [CrossRef]
  7. Tomback, D.F.; Sund, S.K.; Hoffmann, L.A. Post-Fire Regeneration of Pinus albicaulis: Height–Age Relationships, Age Structure, and Microsite Characteristics. Can. J. For. Res. 1993, 23, 113–119. [Google Scholar] [CrossRef]
  8. Callaway, R.M. Competition and Facilitation on Elevation Gradients in Subalpine Forests of the Northern Rocky Mountains, USA. Oikos 1998, 82, 561–573. [Google Scholar] [CrossRef]
  9. Arno, S.F. Timberline: Mountain and Arctic Forest Frontiers, 1st ed.; Mountaineers Books: Seattle, WA, USA, 1984; ISBN 978-0-89886-085-6. [Google Scholar]
  10. Farnes, P. Snotel and Snow Course Data: Describing the Hydrology of Whitebark Pine Ecosystems (1990). In Proceedings of the Symposium on Whitebark Pine Ecosystems: Ecology and Management of a High Mountain Resource, Bozeman, MT, USA, 29–31 March 1989; pp. 302–304. [Google Scholar]
  11. Hann, W.J. Landscape and Ecosystem-Level Management in Whitebark Pine Ecosystems; U.S. Department of Agriculture Forest Service: Washington, DC, USA, 1990.
  12. Logan, J.A.; Macfarlane, W.W.; Willcox, L. Whitebark Pine Vulnerability to Climate-Driven Mountain Pine Beetle Disturbance in the Greater Yellowstone Ecosystem. Ecol. Appl. 2010, 20, 895–902. [Google Scholar] [CrossRef]
  13. Macfarlane, W.W.; Logan, J.A.; Kern, W.R. An Innovative Aerial Assessment of Greater Yellowstone Ecosystem Mountain Pine Beetle-Caused Whitebark Pine Mortality. Ecol. Appl. 2013, 23, 421–437. [Google Scholar] [CrossRef]
  14. Logan, J.A.; Macfarlane, W.W.; Willcox, L. Effective Monitoring as a Basis for Adaptive Management: A Case History of Mountain Pine Beetle in Greater Yellowstone Ecosystem Whitebark Pine. iForest Biogeosciences For. 2009, 2, 19. [Google Scholar] [CrossRef]
  15. Shanahan, E.; Irvine, K.M.; Thoma, D.; Wilmoth, S.; Ray, A.; Legg, K.; Shovic, H. Whitebark Pine Mortality Related to White Pine Blister Rust, Mountain Pine Beetle Outbreak, and Water Availability. Ecosphere 2016, 7, e01610. [Google Scholar] [CrossRef]
  16. Endangered and Threatened Wildlife and Plants; Threatened Species Status with Section 4(d) Rule for Whitebark Pine (Pinus Albicaulis). Available online: https://www.federalregister.gov/documents/2022/12/15/2022-27087/endangered-and-threatened-wildlife-and-plants-threatened-species-status-with-section-4d-rule-for (accessed on 21 November 2023).
  17. Safranyik, L. Effects of Climate and Weather on Mountain Pine Beetle Populations; Canadian Forest Service Publications: Sault Ste. Marie, ON, Canada, 1978; pp. 77–84. [Google Scholar]
  18. Amman, G.D. Population Changes of the Mountain Pine Beetle in Relation to Elevation. Environ. Entomol. 1973, 2, 541–548. [Google Scholar] [CrossRef]
  19. Jewett, J.T.; Lawrence, R.L.; Marshall, L.A.; Gessler, P.E.; Powell, S.L.; Savage, S.L. Spatiotemporal Relationships between Climate and Whitebark Pine Mortality in the Greater Yellowstone Ecosystem. For. Sci. 2011, 57, 320–335. [Google Scholar]
  20. Logan, J.A.; Amman, G.D. A Distribution Model for Egg Development in Mountain Pine Beetle. Can. Entomol. 1986, 118, 361–372. [Google Scholar] [CrossRef]
  21. Bentz, B.J.; Logan, J.A.; Amman, G.D. Temperature Dependent Development of the Mountain Pine Beetle (Coleoptera: Scolytidae) and Simulation of Its Phenology. Can. Entomol. 1991, 123, 1083–1094. [Google Scholar] [CrossRef]
  22. Régnière, J.; Cooke, B.J.; Bergeron, V. BioSIM: A Computer-Based Decision Support Tool for Seasonal Planning of Pest Management Activities; User’s Manual; Natural Resources Canada: Ottawa, ON, Canada, 1995; Volume 116, ISBN 978-0-662-24018-1.
  23. Logan, J.A.; Régnière, J.; Powell, J.A. Assessing the Impacts of Global Warming on Forest Pest Dynamics. Front. Ecol. Environ. 2003, 1, 130–137. [Google Scholar] [CrossRef]
  24. Logan, J.A.; Bentz, B.J. Model Analysis of Mountain Pine Beetle (Coleoptera: Scolytidae) Seasonality. Environ. Entomol. 1999, 28, 924–934. [Google Scholar] [CrossRef]
  25. Bentz, B.J.; Régnière, J.; Fettig, C.J.; Hansen, E.M.; Hayes, J.L.; Hicke, J.A.; Kelsey, R.G.; Negrón, J.F.; Seybold, S.J. Climate Change and Bark Beetles of the Western United States and Canada: Direct and Indirect Effects. Bioscience 2010, 60, 602–613. [Google Scholar] [CrossRef]
  26. Perkins, D.L.; Swetnam, T.W. A Dendroecological Assessment of Whitebark Pine in the Sawtooth–Salmon River Region, Idaho. Can. J. For. Res. 1996, 26, 2123–2133. [Google Scholar] [CrossRef]
  27. Houghton, J.T. Climate Change: IPCC Scientific Assessment. Published for the Intergovernmental Panel on Climate Change; Cambridge University Press: Cambridge, UK, 1990; p. 365. [Google Scholar]
  28. Logan, J.A.; Powell, J.A. Ghost Forests, Global Warming, and the Mountain Pine Beetle (Coleoptera: Scolytidae). Am. Entomol. 2001, 47, 160–173. [Google Scholar] [CrossRef]
  29. Logan, J.; Powell, J. Ecological Consequences of Climate Change Altered Forest Insect Disturbance Regimes. In Climate Warming in Western North America: Evidence and Environmental Effects; Wagner, F.H., Ed.; University of Utah Press: Salt Lake City, UT, USA, 2009; pp. 98–109. [Google Scholar]
  30. Westerling, A.L.; Hidalgo, H.G.; Cayan, D.R.; Swetnam, T.W. Warming and Earlier Spring Increase Western U.S. Forest Wildfire Activity. Science 2006, 313, 940–943. [Google Scholar] [CrossRef]
  31. Hostetler, S.; Whitlock, C.; Shuman, B.; Liefert, D.; Drimal, C.; Bischke, S. Greater Yellowstone Climate Assessment: Past, Present, and Future Climate Change in Greater Yellowstone Watersheds; Montana State University, Institute on Ecosystems: Bozeman, MT, USA, 2021; 260p. [Google Scholar] [CrossRef]
  32. Gibson, K. Mountain Pine Beetle Conditions in Whitebark Pine Stands in the Greater Yellowstone Ecosystem, 2006; Forest Health Protection Numbered Report 06-03; USDA Forest Service, Forest Health Protection Missoula Field Office: Missoula, MT, USA, 2006; pp. 1–7.
  33. Shanahan, E.K. SHORT: An Uncertain Future: The Persistence of Whitebark Pine in the Greater Yellowstone Ecosystem (U.S. National Park Service). Available online: https://www.nps.gov/articles/persistence-of-whitebark-pine-in-the-greater-yellowstone-ecosystem.htm (accessed on 2 May 2023).
  34. Powell, J.A.; Bentz, B.J. Connecting Phenological Predictions with Population Growth Rates for Mountain Pine Beetle, an Outbreak Insect. Landsc. Ecol. 2009, 24, 657–672. [Google Scholar] [CrossRef]
  35. Logan, J.A. Seeing (Less) Red: Bark Beetles and Global Warming. Ask an Ecologist (Blog); July 29, 2011; Ecotone: News and Views on Ecological Science. Available online: https://www.esa.org/esablog/2011/07/29/seeing-less-red-bark-beetles-and-global-warming/ (accessed on 1 October 2023).
  36. Dooley, E.M.; Six, D.L. Severe White Pine Blister Rust Infection in Whitebark Pine Alters Mountain Pine Beetle (Coleoptera: Curculionidae) Attack Density, Emergence Rate, and Body Size. Environ. Entomol. 2015, 44, 1384–1394. [Google Scholar] [CrossRef] [PubMed]
  37. Summary of Preliminary Step-Trend Analysis from the Interagency Whitebark Pine Long-term Monitoring Program—2004–2013|U.S. Geological Survey. Available online: https://www.usgs.gov/publications/summary-preliminary-step-trend-analysis-interagency-whitebark-pine-long-termmonitoring (accessed on 21 November 2023).
  38. Marston, R.A.; Anderson, J.E. Watersheds and Vegetation of the Greater Yellowstone Ecosystem. Conserv. Biol. 1991, 5, 338–346. [Google Scholar] [CrossRef]
  39. Romme, W.H.; Boyce, M.S.; Gresswell, R.; Merrill, E.H.; Minshall, G.W.; Whitlock, C.; Turner, M.G. Twenty Years After the 1988 Yellowstone Fires: Lessons About Disturbance and Ecosystems. Ecosystems 2011, 14, 1196–1215. [Google Scholar] [CrossRef]
  40. Bockino, N. and Macfarlane, W. Whitebark pine distribution and condition assessment for the Greater Yellowstone (Map). Cooperation with USDA Forest Service—Forest Health and Protection and Grand Teton National Park. In Whitebark Pine Strategy for the Greater Yellowstone Area; Greater Yellowstone Coordinating Committee: Bozeman, MT, USA, 2010; 41p. [Google Scholar]
  41. Macfarlane, W.W.; Wheaton, J.M.; Bouwes, N.; Jensen, M.L.; Gilbert, J.T.; Hough-Snee, N.; Shivik, J.A. Modeling the Capacity of Riverscapes to Support Beaver Dams. Geomorphology 2017, 277, 72–99. [Google Scholar] [CrossRef]
  42. Macfarlane, W.W.; McGinty, C.M.; Laub, B.G.; Gifford, S.J. High-Resolution Riparian Vegetation Mapping to Prioritize Conservation and Restoration in an Impaired Desert River. Restor. Ecol. 2017, 25, 333–341. [Google Scholar] [CrossRef]
  43. Ireland, K.B.; Hansen, A.J.; Keane, R.E.; Legg, K.; Gump, R.L. Putting Climate Adaptation on the Map: Developing Spatial Management Strategies for Whitebark Pine in the Greater Yellowstone Ecosystem. Environ. Manag. 2018, 61, 981–1001. [Google Scholar] [CrossRef]
  44. Congalton, R.G. Accuracy Assessment and Validation of Remotely Sensed and Other Spatial Information. Int. J. Wildland Fire 2001, 10, 321. [Google Scholar] [CrossRef]
  45. Turiano, T. Select Peaks of Greater Yellowstone: A Mountaineering History and Guide; Indomitus Books: Jackson, WY, USA, 2003; ISBN 978-0-9745619-0-5. [Google Scholar]
  46. Locke, W.W. Present Climate and Glaciation of Western Montana, USA. Arct. Alp. Res. 1989, 21, 234–244. [Google Scholar] [CrossRef]
  47. Landis, J.R.; Koch, G.G. An Application of Hierarchical Kappa-Type Statistics in the Assessment of Majority Agreement among Multiple Observers. Biometrics 1977, 33, 363–374. [Google Scholar] [CrossRef]
  48. Kunegel-Lion, M.; Lewis, M.A. Factors Governing Outbreak Dynamics in a Forest Intensively Managed for Mountain Pine Beetle. Sci. Rep. 2020, 10, 7601. [Google Scholar] [CrossRef]
  49. Buotte, P.C.; Hicke, J.A.; Preisler, H.K.; Abatzoglou, J.T.; Raffa, K.F.; Logan, J.A. Climate Influences on Whitebark Pine Mortality from Mountain Pine Beetle in the Greater Yellowstone Ecosystem. Ecol. Appl. 2016, 26, 2507–2524. [Google Scholar] [CrossRef]
  50. Dooley, E.M.; Six, D.L.; Powell, J.A. A Comparison of Mountain Pine Beetle (Coleoptera: Curculionidae, Scolytinae) Productivity and Survival in Lodgepole and Whitebark Pine after a Region-Wide Cold Weather Event. For. Sci. 2015, 61, 235–246. [Google Scholar] [CrossRef]
Figure 1. The project area is the Greater Yellowstone Ecosystem (GYE) located in south-central Montana, northwest Wyoming, and southeast Idaho, USA, covering 59,000 km2. The federal administrative areas of the GYE are shown, including two national parks and six national forests. The GYE’s 22 major mountain ranges are identified, and the 2011 Greater Yellowstone Coordinating Committee (GYCC) Whitebark Pine Subcommittee’s whitebark pine distribution map is shown in dark gray.
Forests 14 02361 g001
Figure 2. An example 12-digit US Geological Survey Hydrologic Unit Code (HUC 12) sub-watershed shown as a black polyline and example catchments shown as orange polylines.
Forests 14 02361 g002
Figure 3. Example photo showing catchment-level severe old attack mortality (gray trees) in the Madison Range of the GYE. Photo Credit: W. Macfarlane.
Forests 14 02361 g003
Figure 4. GYE-wide, point-based whitebark pine mortality map. The map displays the location and associated major mortality level of all oblique aerial photos (n = 4434). Major mortality level: Trace (5.0–5.075) represents a trace level of gray trees (green points). Low (5.1–5.175) represents the occasional spot of gray trees (yellow points). Moderate (5.2–5.275) represents multiple spots of gray trees (orange points). Severe (5.3–5.4) represents coalesced gray trees referred to as “ghost forests” (red points).
Forests 14 02361 g004
Figure 5. (A) Frequency distribution of catchments (n = 2672) by old attack mortality rating. Ratings indicate an increasing number of dead (gray) trees remaining after a mountain pine beetle attack in 0.25 intervals. The percentage of the total for each mortality rating is shown above the bars. (B) Frequency distribution of catchments (n = 2672) by major mortality level: Trace (5.0–5.075) represents a trace level of gray trees. Low (5.1–5.175) represents the occasional spot of gray trees. Moderate (5.2–5.275) represents multiple spots of gray trees. Severe (5.3–5.4) represents coalesced gray trees.
Forests 14 02361 g005
Figure 6. GYE-wide whitebark pine distribution catchment-level mortality map. The map displays mortality ratings of all 4689 catchments. The project’s aerial photos intersected 2672 of the total 4689 catchments (74% by area). Another 10,522 ha (1% by area) were identified as wildfire-dominated mortality and were excluded from the MPB-caused mortality analysis. For the remaining 2017 catchments (25% by area), a mortality surface was interpolated using kriging. Mortality ratings are grouped into major mortality levels: trace level of mortality (5.0–5.075, green), low mortality (5.1–5.75, yellow), moderate mortality (5.2–5.275, orange), and severe mortality (5.3–5.4, red). Catchments with severe post-outbreak mortality levels dominate the map, indicating pervasive decline and collapse of whitebark pine in these areas.
Forests 14 02361 g006
Figure 7. Simple linear regression analysis between LAS aerial survey-based mortality scores and averaged field-based catchment-level percent mortality of whitebark pine greater than 12.70 cm DBH.
Forests 14 02361 g007
Table 1. Mountain pine beetle mortality rating system for whitebark pine.
Numeric RatingMortality LevelDescription
0–0.75TraceGreen forest with trace levels of mortality. “Trace” mortality refers to a catchment that contains an occasional gray or red tree and there is no evidence of mortality expanding to neighboring trees.
1–1.75LowGreen forest with occasional spots of gray or red trees across the catchment. The increasing frequency of current year red spots is assessed with a 1.25, 1.5, and 1.75 rating. Red or gray spots do not show evidence of multi-year mountain pine beetle-caused mortality.
2–2.75ModeratePrimarily green forest with multiple spots of red and/or gray trees across the catchment. Spots show evidence of two or more years of subsequent mortality. The increasing magnitude of these spots is assessed with a 2.25, 2.5 and 2.75 rating.
3–4Severe Primarily red forest where spots of red and gray trees have coalesced across the catchment. A catchment may display a varying degree of coalescing spots ranging from initial coalescence, category 3, to increasing coalescence that is assessed with a 3.25, 3.5, 3.75 and 4 rating where essentially the entire whitebark pine overstory is red.
5.1–5.4Old attackOld attack mortality where a catchment may contain a varying degree of dead (gray) trees and remaining green forest after a mountain pine beetle attack. This variation is captured with a 5.0–5.4 rating based on the amount of dead and gray whitebark pine overstory. These mortality intensity values are equivalent to those found in the 0–4 categories (i.e., a 5.35 rating is equal to a 3.5 at the end of the outbreak cycle). Rating of 5.x pertains to an old attack (gray trees) as opposed to a 1–4 that indicates active attack (red trees).
Disclaimer/Publisher’s Note: The statements, opinions and data contained in all publications are solely those of the individual author(s) and contributor(s) and not of MDPI and/or the editor(s). MDPI and/or the editor(s) disclaim responsibility for any injury to people or property resulting from any ideas, methods, instructions or products referred to in the content.

