
Multi-Scale Effects of Landscape Pattern on Soundscape Perception in Residential Green Spaces


Abstract
:1. Introduction
2. Research Method
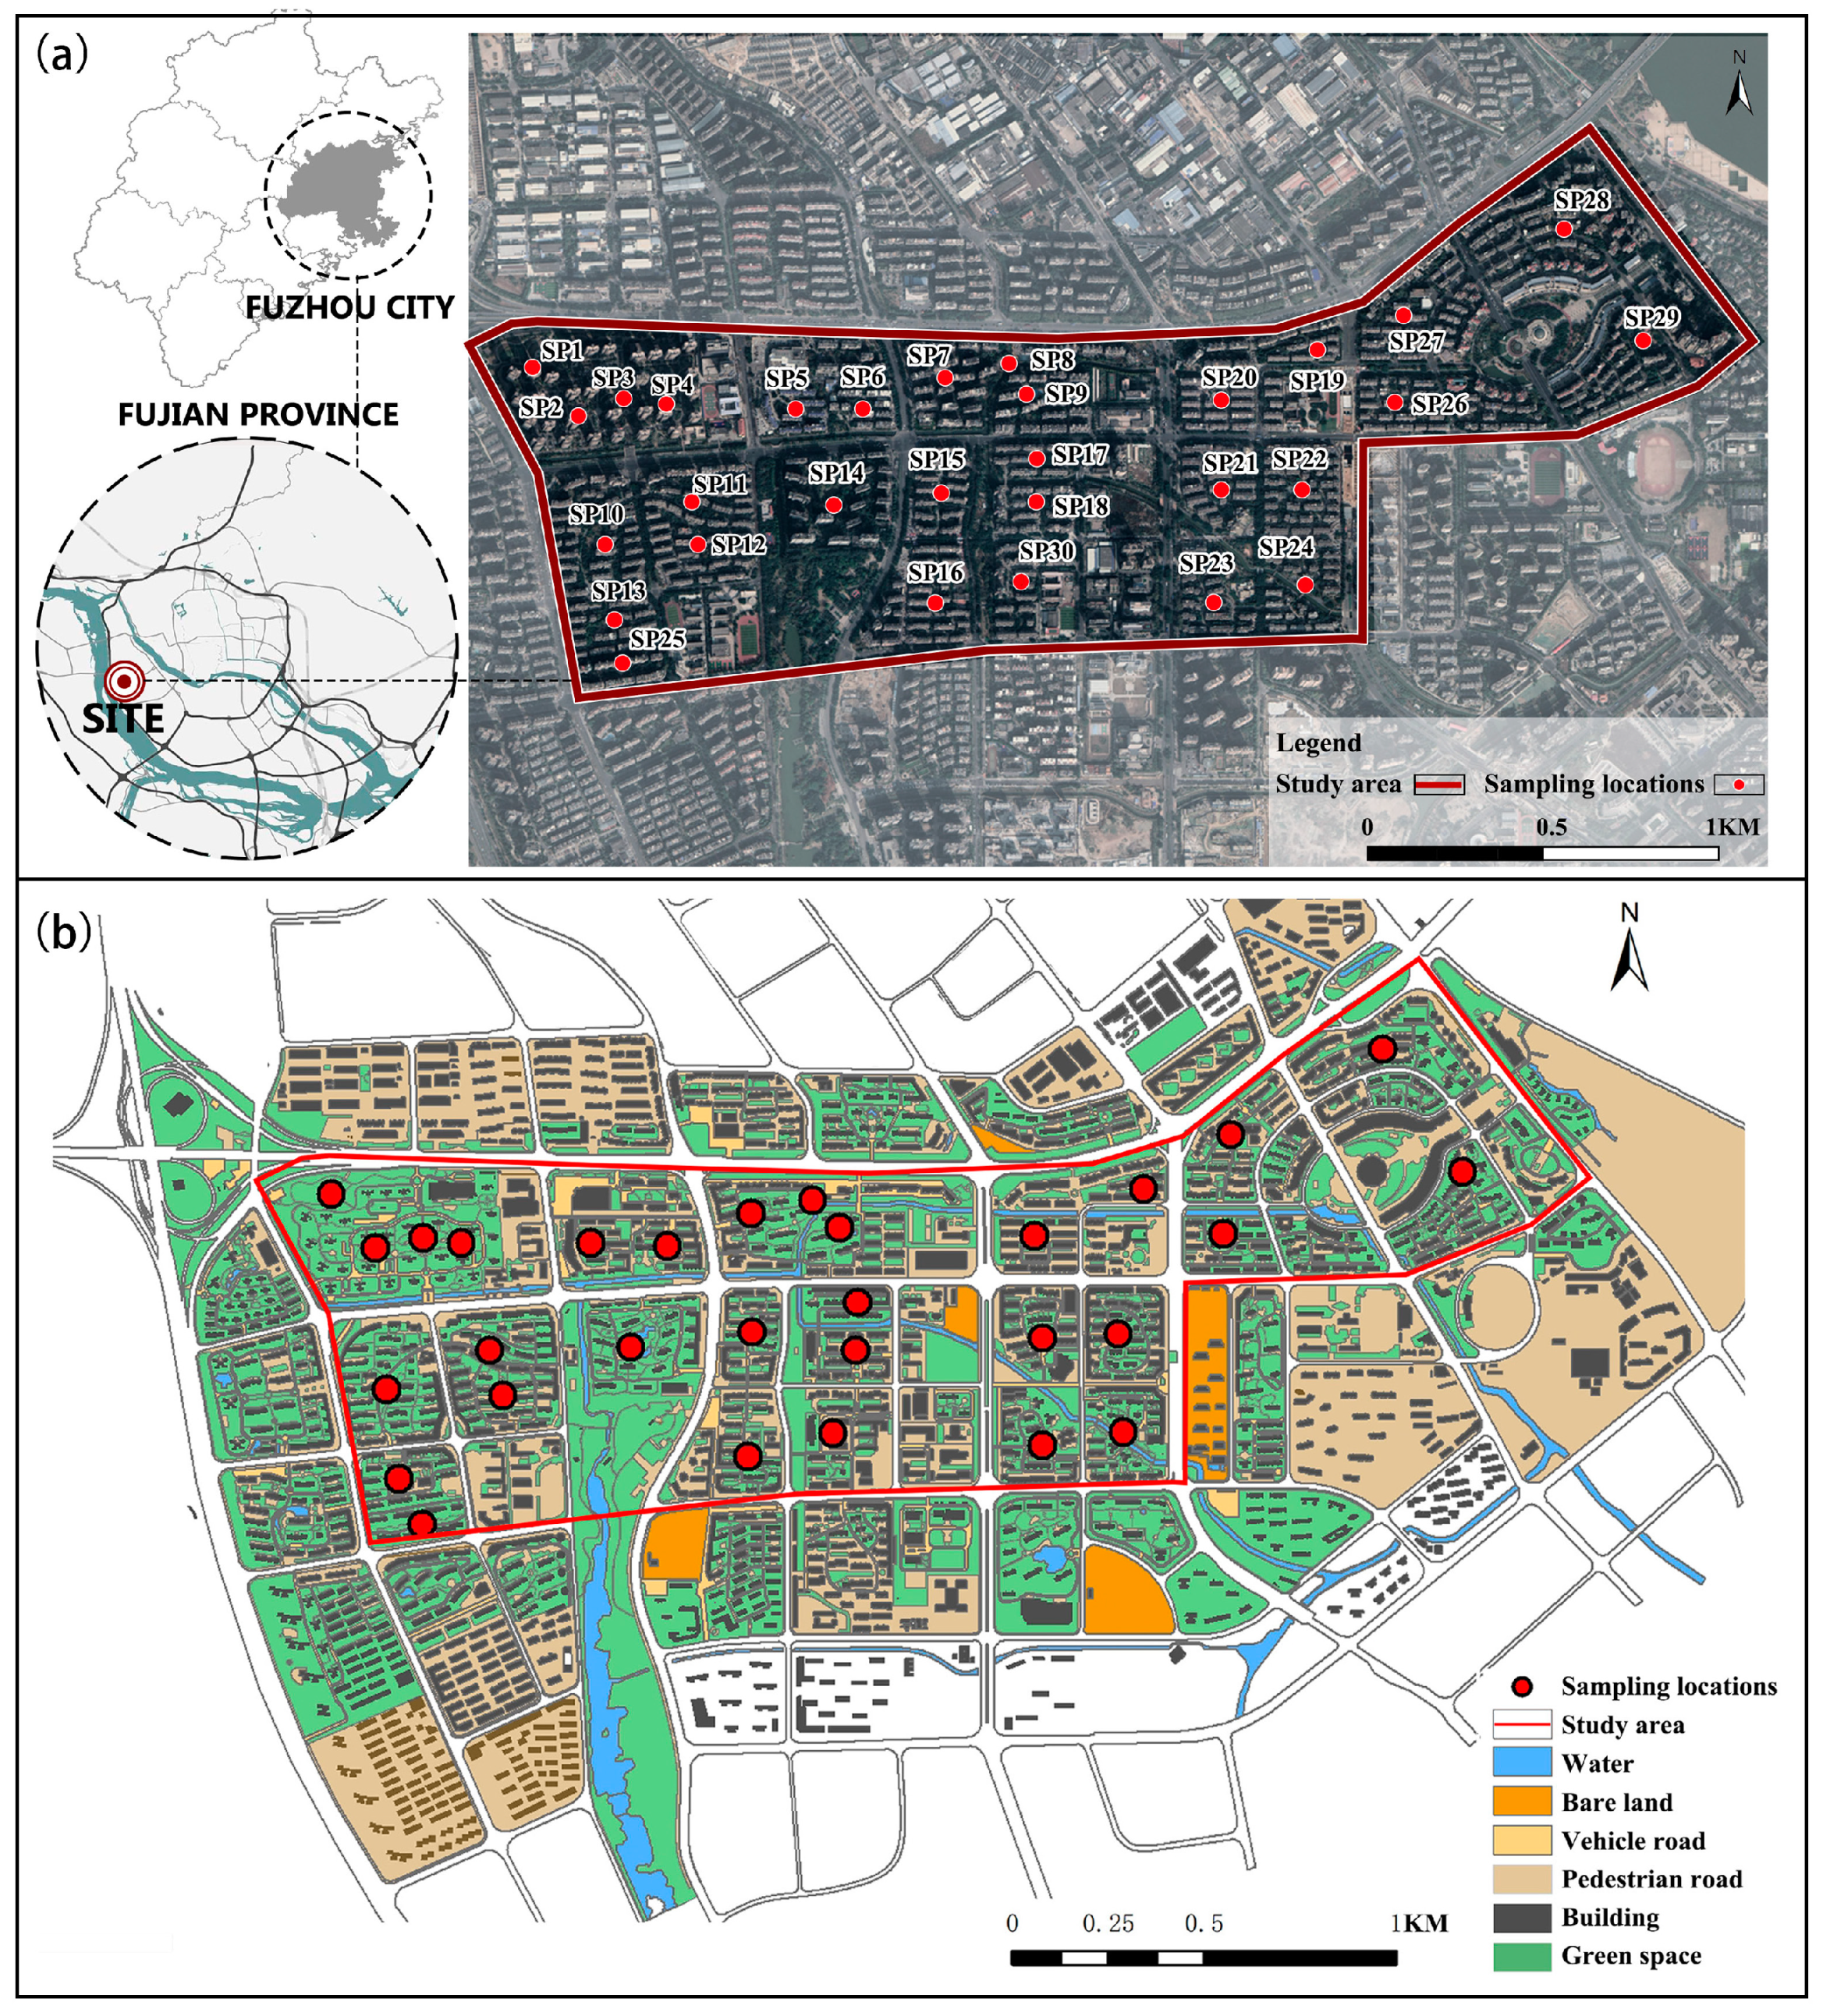
2.1. Study Area
2.2. Data Collection and Measurement
2.2.1. Landscape Spatial Data
2.2.2. Soundscape Perception Data
2.3. Statistical Analysis
3. Results
3.1. Basic Analysis
3.1.1. Sound Source Perception
3.1.2. Principal Component Analysis of Overall Soundscape Quality
3.2. Correlations between Landscape Indices of Different Land Use Types and Soundscape Perception Indicators
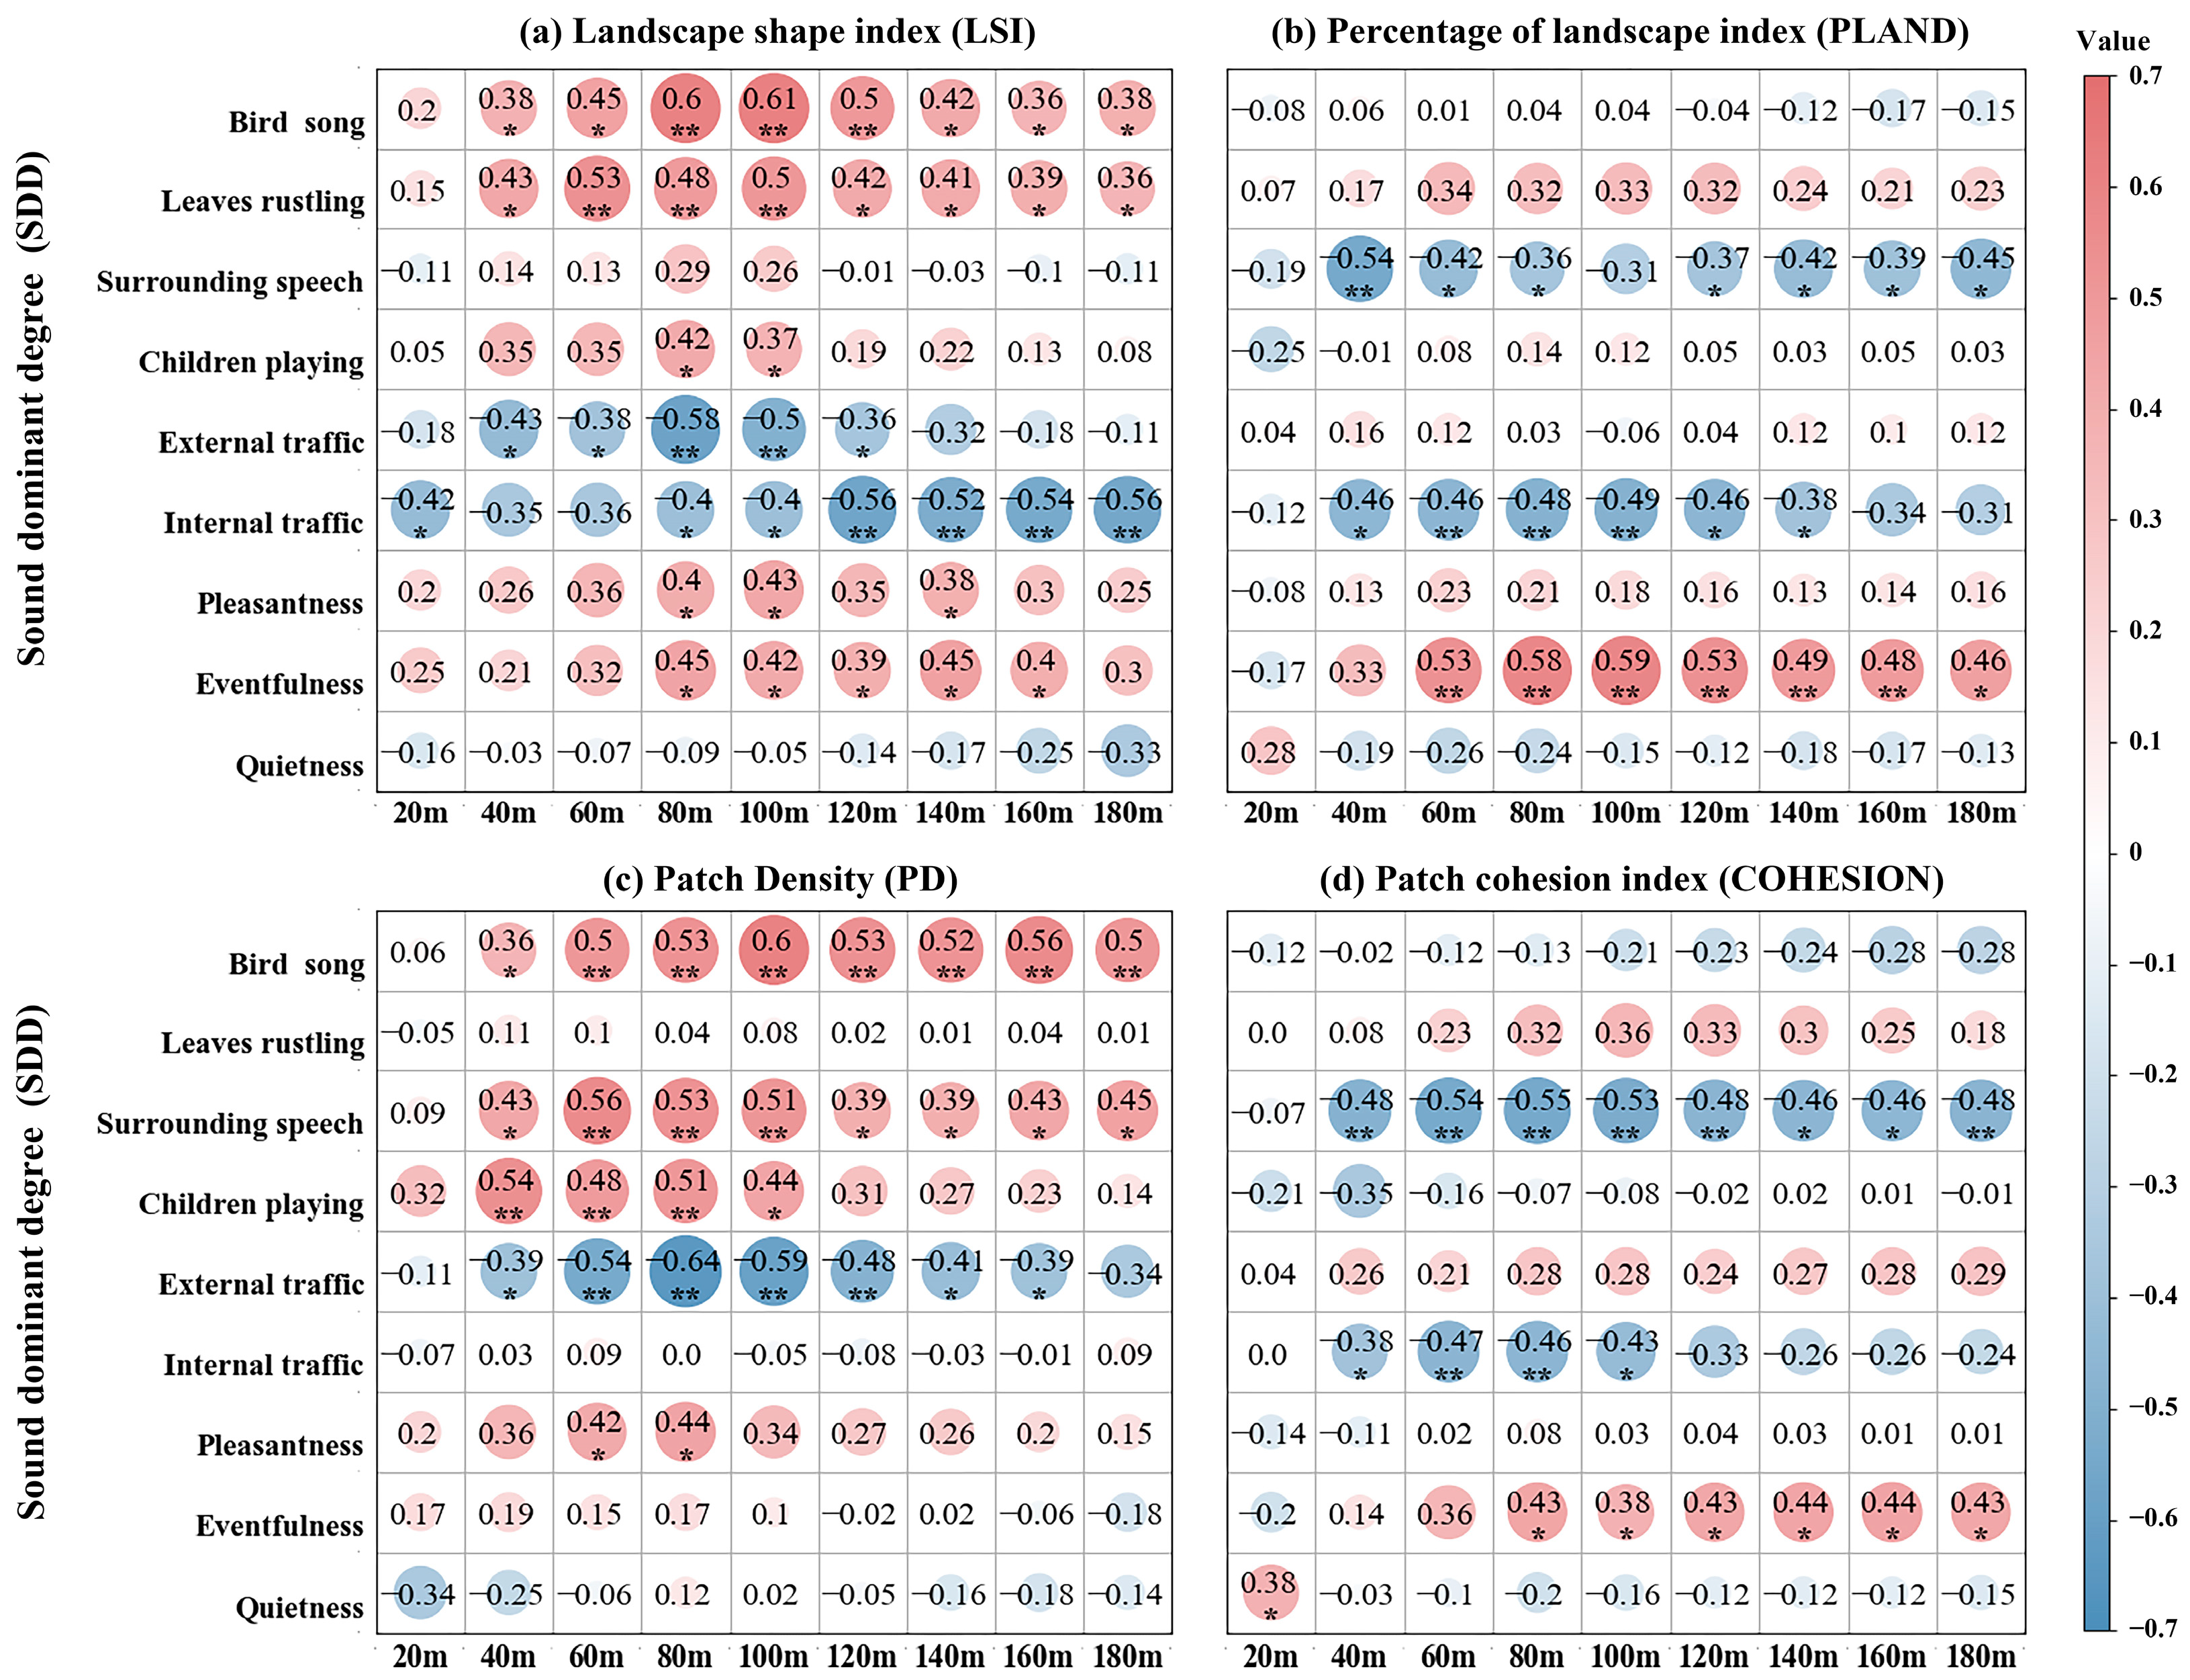
3.2.1. Vegetation
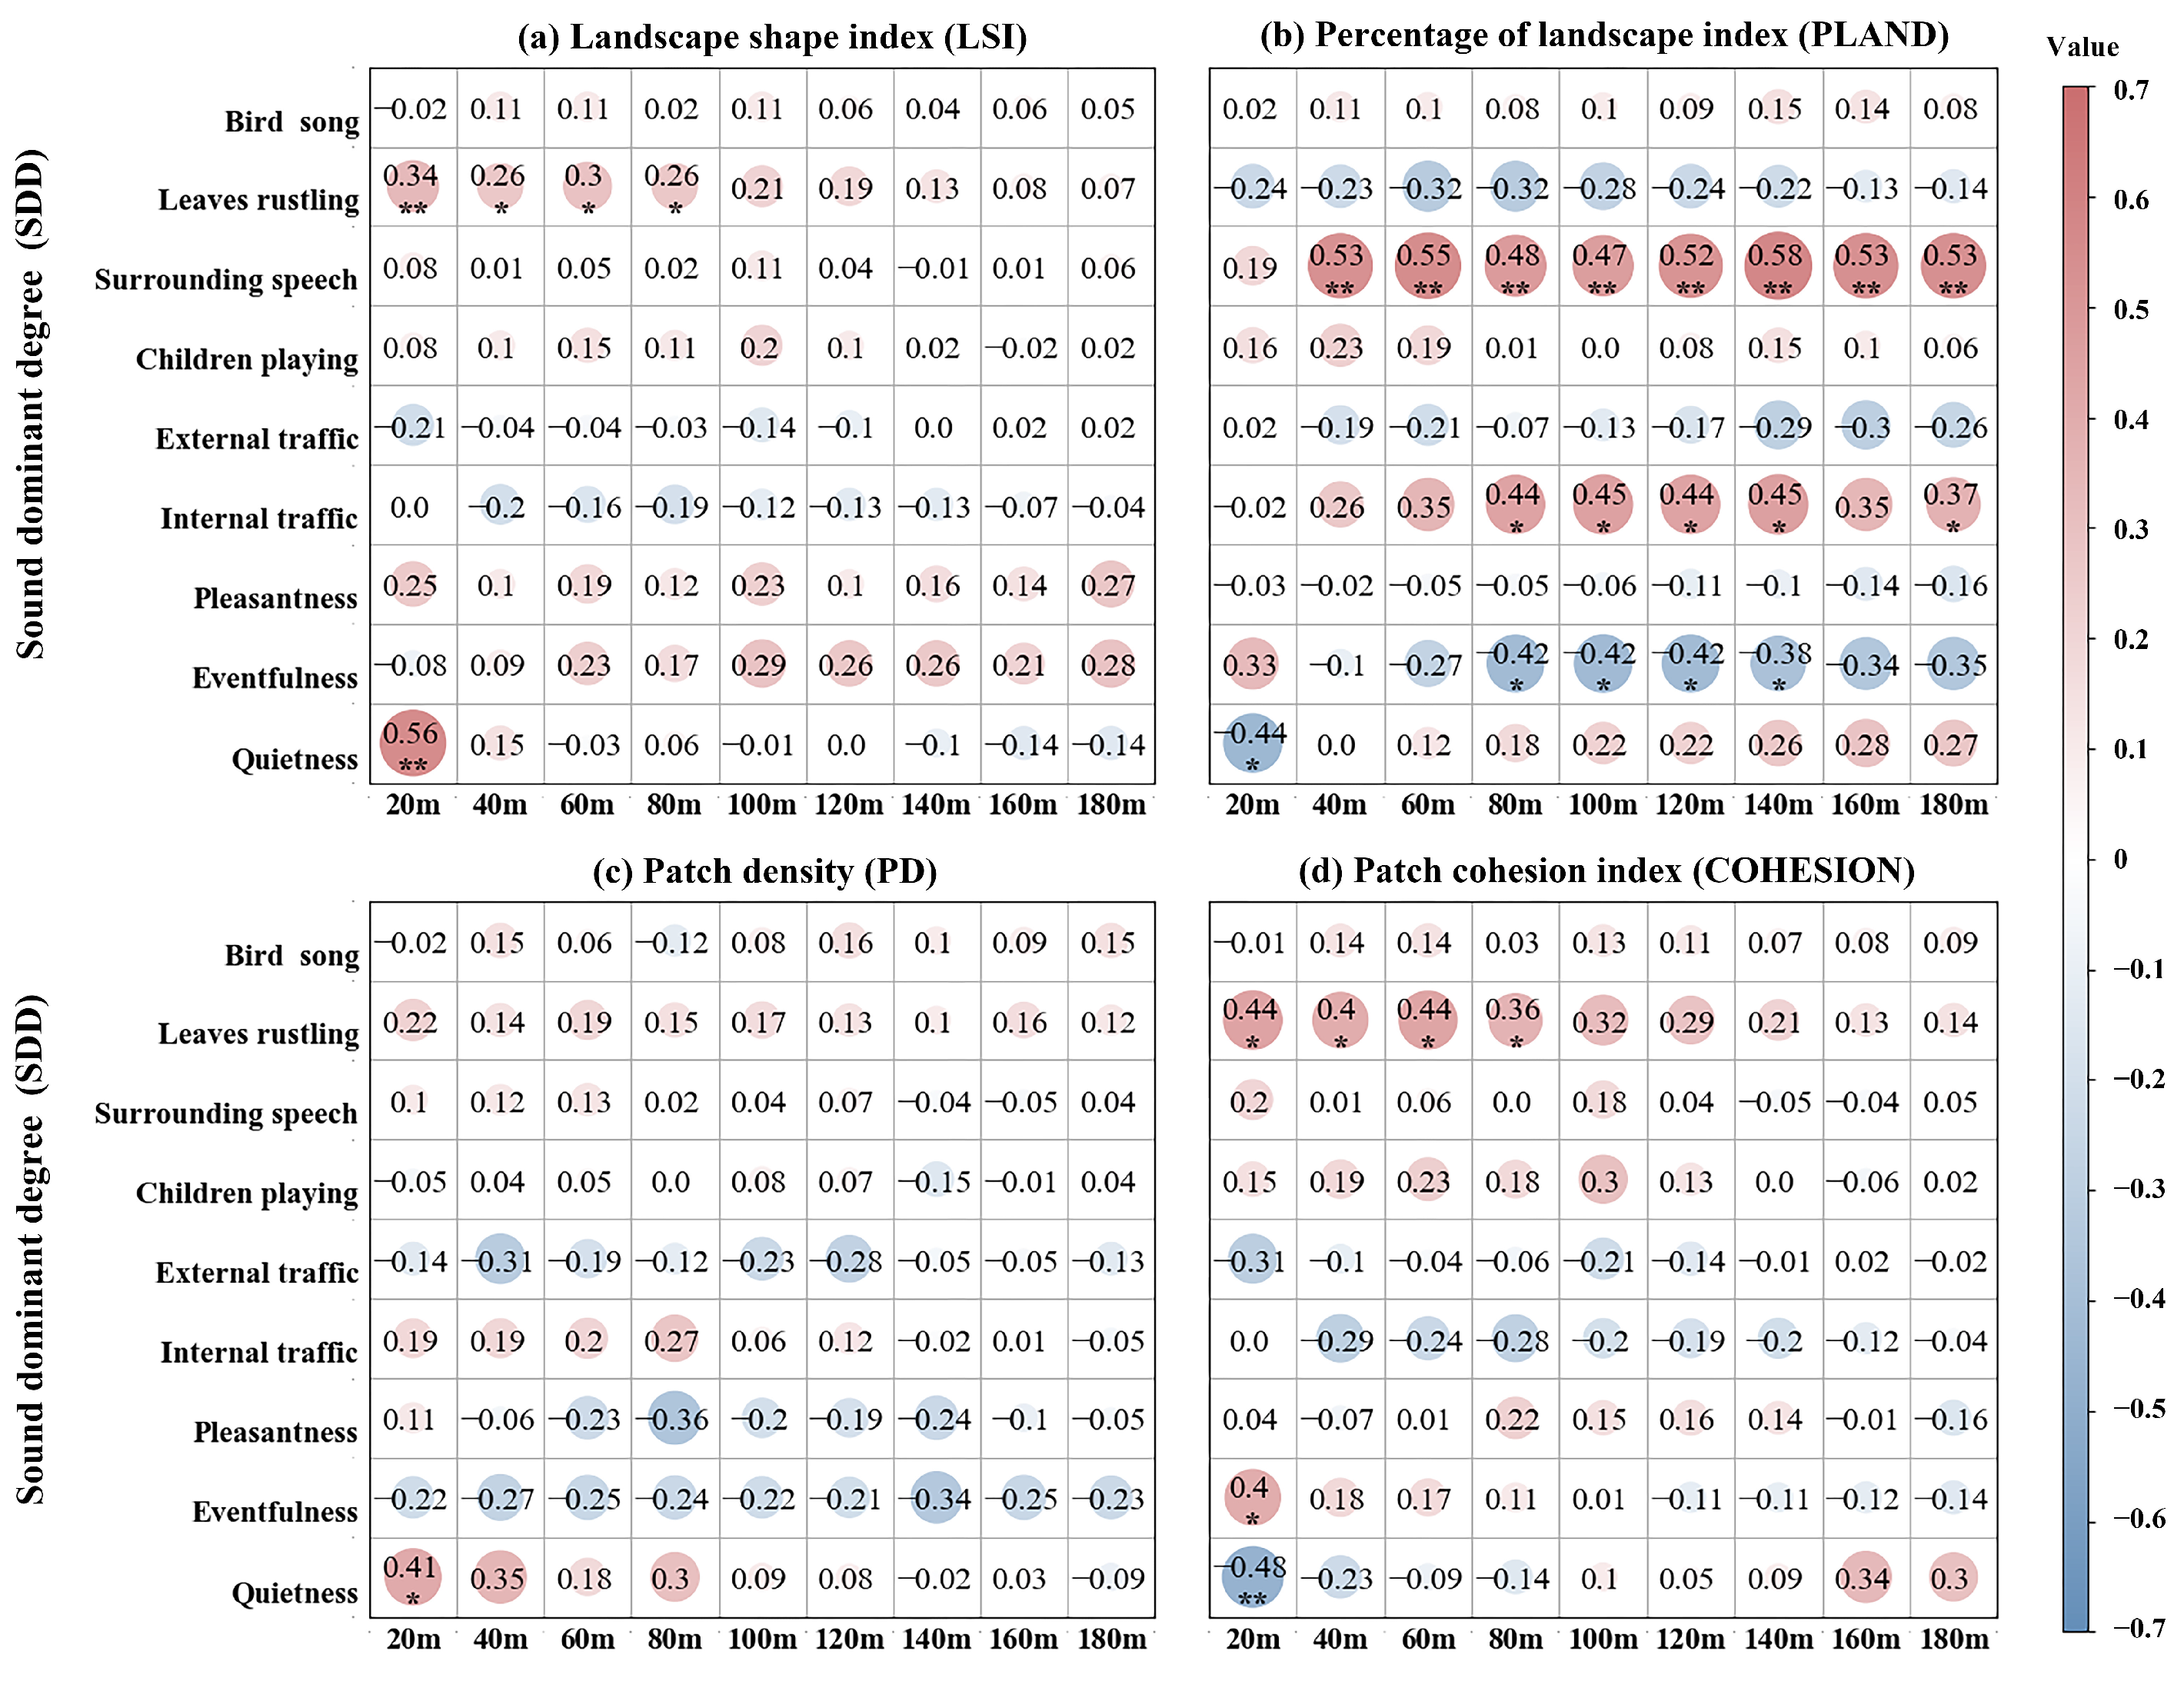
3.2.2. Buildings
3.2.3. Roads
3.3. Regression Models for Soundscape Perception Utilizing Multi-Scale Landscape Indices
3.3.1. Models for the Sound Dominant Degree of Sound Sources
3.3.2. Models for the Overall Soundscape Quality
4. Discussion
4.1. Typical Landscape Characteristics Associated with Soundscape Perception
4.2. Scale Effects of Landscape Pattern on Soundscape Perception
4.3. Limitations and Future Study
5. Conclusions
Supplementary Materials
Author Contributions
Funding
Data Availability Statement
Acknowledgments
Conflicts of Interest
References
- World Health Organization; Regional Office for Europe. Environmental Noise Guidelines for the European Region; World Health Organization: Geneva, Switzerland; Regional Office for Europe: Copenhagen, Denmark, 2018. [Google Scholar]
- Murphy, E.; King, E.A. Strategic environmental noise mapping: Methodological issues concerning the implementation of the EU Environmental Noise Directive and their policy implications. Environ. Int. 2010, 36, 290–298. [Google Scholar] [CrossRef] [PubMed]
- European Union. Directive 2002/49/EC of the European Parliament and the Council of 25 June 2002 relating to the assessment and management of environmental noise. Off. J. Eur. Communities 2002, 2002, L189. [Google Scholar]
- King, E.A.; Murphy, E.; Rice, H.J. Implementation of the EU environmental noise directive: Lessons from the first phase of strategic noise mapping and action planning in Ireland. J. Environ. Manag. 2011, 92, 756–764. [Google Scholar] [CrossRef] [PubMed]
- Raimbault, M.; Dubois, D. Urban soundscapes: Experiences and knowledge. Cities 2005, 22, 339–350. [Google Scholar] [CrossRef]
- Zhang, M.; Kang, J. Towards the Evaluation, Description, and Creation of Soundscapes in Urban Open Spaces. Environ. Plan. B Plan. Des. 2007, 34, 68–86. [Google Scholar] [CrossRef]
- ISO 12913-1; 2014 Acoustics—Soundscape—Part 1: Definition and Conceptual Framework. ISO: Geneva, Switzerland, 2014.
- Kang, J. From dBA to soundscape indices: Managing our sound environment. Front. Eng. Manag. 2017, 4, 184–192. [Google Scholar] [CrossRef]
- Abrantes, E. Perceiving, Navigating and Inhabiting: Performance design through sonic strategies. Perform. Res. 2021, 26, 31–38. [Google Scholar] [CrossRef]
- Aletta, F.; Kang, J. Towards an urban vibrancy model: A soundscape approach. Int. J. Environ. Res. Public Health 2018, 15, 1712. [Google Scholar] [CrossRef]
- Chen, Z.; Hermes, J.; Liu, J.; von Haaren, C. How to integrate the soundscape resource into landscape planning? A perspective from ecosystem services. Ecol. Indic. 2022, 141, 109156. [Google Scholar] [CrossRef]
- Mancini, S.; Mascolo, A.; Graziuso, G.; Guarnaccia, C. Soundwalk, Questionnaires and Noise Measurements in a University Campus: A Soundscape Study. Sustainability 2021, 13, 841. [Google Scholar] [CrossRef]
- ISO/TS 12913-2; 2018 Acoustics—Soundscape—Part 2: Data Collection and Reporting Requirements. ISO: Geneva, Switzerland, 2018.
- Tarlao, C.; Steffens, J.; Guastavino, C. Investigating contextual influences on urban soundscape evaluations with structural equation modeling. Build. Environ. 2021, 188, 107490. [Google Scholar] [CrossRef]
- Mygind, L.; Clark, G.M.; Bigelow, F.J.; Fuller-Tyszkiewicz, M.; Knibbs, L.D.; Mavoa, S.; Flensborg-Madsen, T.; Bentsen, P.; Lum, J.; Enticott, P.G. Green enrichment for better mind readers? Residential nature and social brain function in childhood. J. Environ. Psychol. 2023, 88, 102029. [Google Scholar] [CrossRef]
- Ahmed, S.M.; Mishra, G.D.; Moss, K.M.; Mouly, T.A.; Yang, I.A.; Knibbs, L.D. Association between residential greenspace and health-related quality of life in children aged 0–12 years. Environ. Res. 2022, 214, 113759. [Google Scholar] [CrossRef] [PubMed]
- Cummins, S.; Fagg, J. Does greener mean thinner? Associations between neighbourhood greenspace and weight status among adults in England. Int. J. Obes. 2012, 36, 1108–1113. [Google Scholar] [CrossRef] [PubMed]
- Wang, Z.P.; Wang, W. An empirical study on the impact of green spaces in residential areas on the mental health of residents under COVID-19. Landsc. Archit. Front. 2020, 8, 46–59. [Google Scholar] [CrossRef]
- Xiao, Y.; Miao, S.; Zhang, Y.; Chen, H.; Wu, W. Exploring the health effects of neighborhood greenness on Lilong residents in Shanghai. Urban For. Urban Green. 2021, 66, 127383. [Google Scholar] [CrossRef]
- Mediastika, C.E.; Sudarsono, A.S.; Kristanto, L.; Tanuwidjaja, G.; Sunaryo, R.G.; Damayanti, R. Appraising the sonic environment of urban parks using the soundscape dimension of visually impaired people. Int. J. Urban Sci. 2020, 24, 216–241. [Google Scholar] [CrossRef]
- Guo, L.H.; Cheng, S.; Liu, J.; Wang, Y.; Cai, Y.; Hong, X.C. Does social perception data express the spatio-temporal pattern of perceived urban noise? A case study based on 3,137 noise complaints in Fuzhou, China. Appl. Acoust. 2022, 201, 109129. [Google Scholar] [CrossRef]
- Singh, D.; Kumari, N.; Sharma, P. A review of adverse effects of road traffic noise on human health. Fluct. Noise Lett. 2018, 17, 1830001. [Google Scholar] [CrossRef]
- Tobías, A.; Recio, A.; Díaz, J.; Linares, C. Health impact assessment of traffic noise in Madrid (Spain). Environ. Res. 2015, 137, 136–140. [Google Scholar] [CrossRef]
- Dzhambov, A.M.; Markevych, I.; Hartig, T.; Tilov, B.; Arabadzhiev, Z.; Stoyanov, D.; Gatseva, P.; Dimitrova, D.D. Multiple pathways link urban green- and bluespace to mental health in young adults. Environ. Res. 2018, 166, 223–233. [Google Scholar] [CrossRef] [PubMed]
- Guo, X.; Liu, J.; Chen, Z.; Hong, X.-C. Harmonious Degree of Sound Sources Influencing Visiting Experience in Kulangsu Scenic Area, China. Forests 2023, 14, 138. [Google Scholar] [CrossRef]
- Liu, J.; Kang, J.; Behm, H.; Luo, T. Effects of landscape on soundscape perception: Soundwalks in city parks. Landsc. Urban Plan. 2014, 123, 30–40. [Google Scholar] [CrossRef]
- Brambilla, G.; Gallo, V.; Zambon, G. The Soundscape Quality in Some Urban Parks in Milan, Italy. Int. J. Environ. Res. Public Health 2013, 10, 2348–2369. [Google Scholar] [CrossRef] [PubMed]
- Hong, X.C.; Cheng, S.; Liu, J.; Dang, E.; Wang, J.B.; Cheng, Y. The Physiological Restorative Role of Soundscape in Different Forest Structures. Forests 2022, 13, 1920. [Google Scholar] [CrossRef]
- Matsinos, Y.G.; Mazaris, A.D.; Papadimitriou, K.D.; Mniestris, A.; Hatzigiannidis, G.; Maioglou, D.; Pantis, J.D. Spatio-temporal variability in human and natural sounds in a rural landscape. Landsc. Ecol. 2008, 23, 945–959. [Google Scholar] [CrossRef]
- Liu, J.; Kang, J.; Luo, T.; Behm, H.; Coppack, T. Spatiotemporal variability of soundscapes in a multiple functional urban area. Landsc. Urban Plan. 2013, 115, 1–9. [Google Scholar] [CrossRef]
- Liu, J.; Kang, J.; Behm, H.; Luo, T. Landscape spatial pattern indices and soundscape perception in a multi-functional urban area, Germany. J. Environ. Eng. Landsc. Manag. 2014, 22, 208–218. [Google Scholar] [CrossRef]
- Wu, J. Effects of changing scale on landscape pattern analysis: Scaling relations. Landsc. Ecol. 2004, 19, 125–138. [Google Scholar] [CrossRef]
- He, X.; Deng, Y.; Dong, A.; Lin, L. The relationship between acoustic indices, vegetation, and topographic characteristics is spatially dependent in a tropical forest in southwestern China. Ecol. Indic. 2022, 142, 109229. [Google Scholar] [CrossRef]
- Scarpelli, M.D.A.; Ribeiro, M.C.; Teixeira, C.P. What does Atlantic Forest soundscapes can tell us about landscape? Ecol. Indic. 2021, 121, 107050. [Google Scholar] [CrossRef]
- Sangermano, F. Acoustic diversity of forested landscapes: Relationships to habitat structure and anthropogenic pressure. Landsc. Urban Plan. 2022, 226, 104508. [Google Scholar] [CrossRef]
- Mao, Q.; Sun, J.; Deng, Y.; Wu, Z.; Bai, H. Assessing Effects of Multi-Scale Landscape Pattern and Habitats Attributes on Taxonomic and Functional Diversity of Urban River Birds. Diversity 2023, 15, 486. [Google Scholar] [CrossRef]
- Uebel, K.; Marselle, M.; Dean, A.J.; Rhodes, J.R.; Bonn, A. Urban green space soundscapes and their perceived restorativeness. People Nat. 2021, 3, 756–769. [Google Scholar] [CrossRef]
- Hedblom, M.; Heyman, E.; Antonsson, H.; Gunnarsson, B. Bird song diversity influences young people’s appreciation of urban landscapes. Urban For. Urban Green. 2014, 13, 469–474. [Google Scholar] [CrossRef]
- Li, J.; Zhang, Z.; Jing, F.; Gao, J.; Ma, J.; Shao, G.; Noel, S. An evaluation of urban green space in Shanghai, China, using eye tracking. Urban For. Urban Green. 2020, 56, 126903. [Google Scholar] [CrossRef]
- Liu, J.; Kang, J.; Luo, T.; Behm, H. Landscape effects on soundscape experience in city parks. Sci. Total Environ. 2013, 454–455, 474–481. [Google Scholar] [CrossRef] [PubMed]
- Hasegawa, Y.; Lau, S.-K. Comprehensive audio-visual environmental effects on residential soundscapes and satisfaction: Partial least square structural equation modeling approach. Landsc. Urban Plan. 2022, 220, 104351. [Google Scholar] [CrossRef]
- GB50180-2018; Standard for Urban Residential Area Planning and Design. Ministry of Housing and Urban-Rural Development, State Administration for Market Regulation: Beijing, China, 2018.
- Chen, Z.; Zhu, T.-Y.; Liu, J.; Hong, X.-C. Before Becoming a World Heritage: Spatiotemporal Dynamics and Spatial Dependency of the Soundscapes in Kulangsu Scenic Area, China. Forests 2022, 13, 1526. [Google Scholar] [CrossRef]
- Liu, J.; Xiong, Y.; Wang, Y.; Luo, T. Soundscape effects on visiting experience in city park: A case study in Fuzhou, China. Urban For. Urban Green. 2018, 31, 38–47. [Google Scholar] [CrossRef]
- Li, W.; Zhai, J.; Zhu, M. Characteristics and perception evaluation of the soundscapes of public spaces on both sides of the elevated road: A case study in Suzhou, China. Sustain. Cities Soc. 2022, 84, 103996. [Google Scholar] [CrossRef]
- Strohbach, M.W.; Lerman, S.B.; Warren, P.S. Are small greening areas enhancing bird diversity? Insights from community-driven greening projects in Boston. Landsc. Urban Plan. 2013, 114, 69–79. [Google Scholar] [CrossRef]
- Wong, J.S.Y.; Soh, M.C.K.; Low, B.W.; Kenneth, B.H.E. Tropical bird communities benefit from regular-shaped and naturalised urban green spaces with water bodies. Landsc. Urban Plan. 2023, 231, 104644. [Google Scholar] [CrossRef]
- Garizábal-Carmona, J.A.; Mancera-Rodríguez, N.J. Bird species richness across a Northern Andean city: Effects of size, shape, land cover, and vegetation of urban green spaces. Urban For. Urban Green. 2021, 64, 127243. [Google Scholar] [CrossRef]
- Dzhambov, A.M.; Dimitrova, D.D. Urban green spaces’ effectiveness as a psychological buffer for the negative health impact of noise pollution: A systematic review. Noise Health 2014, 16, 157. [Google Scholar] [CrossRef]
- Hong, J.Y.; Lam, B.; Ong, Z.-T.; Ooi, K.; Gan, W.-S.; Kang, J.; Yeong, S.; Lee, I.; Tan, S.-T. Effects of contexts in urban residential areas on the pleasantness and appropriateness of natural sounds. Sustain. Cities Soc. 2020, 63, 102475. [Google Scholar] [CrossRef]
- Liu, J.; Kang, J.; Behm, H. Birdsong as an element of the urban sound environment: A case study concerning the area of Warnemünde in Germany. Acta Acust. United Acust. 2014, 100, 458–466. [Google Scholar] [CrossRef]
- Kurze, U.J.; Anderson, G.S.J.N.; Principles, V.C.E. Applications. Outdoor sound propagation. In Noise and Vibration Control Engineering: Principles and Applications, 2nd ed.; Wiley: Hoboken, NJ, USA, 2006; pp. 119–144. [Google Scholar] [CrossRef]
- Han, X.; Huang, X.; Liang, H.; Ma, S.; Gong, J. Analysis of the relationships between environmental noise and urban morphology. Environ. Pollut. 2018, 233, 755–763. [Google Scholar] [CrossRef] [PubMed]
- Guedes, I.C.M.; Bertoli, S.R.; Zannin, P.H.T. Influence of urban shapes on environmental noise: A case study in Aracaju—Brazil. Sci. Total Environ. 2011, 412–413, 66–76. [Google Scholar] [CrossRef]
- Salomons, E.M.; Berghauser Pont, M. Urban traffic noise and the relation to urban density, form, and traffic elasticity. Landsc. Urban Plan. 2012, 108, 2–16. [Google Scholar] [CrossRef]
- Amaya-Espinel, J.D.; Hostetler, M.; Henríquez, C.; Bonacic, C. The influence of building density on Neotropical bird communities found in small urban parks. Landsc. Urban Plan. 2019, 190, 103578. [Google Scholar] [CrossRef]
- Benítez-López, A.; Alkemade, R.; Verweij, P.A. The impacts of roads and other infrastructure on mammal and bird populations: A meta-analysis. Biol. Conserv. 2010, 143, 1307–1316. [Google Scholar] [CrossRef]
- Cooke, S.C.; Balmford, A.; Johnston, A.; Newson, S.E.; Donald, P.F. Variation in abundances of common bird species associated with roads. J. Appl. Ecol. 2020, 57, 1271–1282. [Google Scholar] [CrossRef]
- Yu, W.L.; Kang, J. Relationship between traffic noise resistance and village form in China. Landsc. Urban Plan. 2017, 163, 44–55. [Google Scholar] [CrossRef]
- Aletta, F.; Kang, J.; Fuda, S.; Astolfi, A. The effect of walking sounds from different walked-on materials on the soundscape of urban parks. J. Environ. Eng. Landsc. Manag. 2016, 24, 165–175. [Google Scholar] [CrossRef]
- Payne, S.R.; Bruce, N. Exploring the Relationship between Urban Quiet Areas and Perceived Restorative Benefits. Int. J. Environ. Res. Public Health 2019, 16, 1611. [Google Scholar] [CrossRef] [PubMed]
- Ren, Z.; Jiang, B.; Seipel, S. Capturing and characterizing human activities using building locations in America. ISPRS Int. J. Geo-Inf. 2019, 8, 200. [Google Scholar] [CrossRef]
- Miller, S.A. Parents’ attributions for their children’s behavior. Child Dev. 1995, 66, 1557–1584. [Google Scholar] [CrossRef]
- Hong, J.Y.; Jeon, J.Y. Relationship between spatiotemporal variability of soundscape and urban morphology in a multifunctional urban area: A case study in Seoul, Korea. Build. Environ. 2017, 126, 382–395. [Google Scholar] [CrossRef]
- Sakieh, Y.; Jaafari, S.; Ahmadi, M.; Danekar, A. Green and calm: Modeling the relationships between noise pollution propagation and spatial patterns of urban structures and green covers. Urban For. Urban Green. 2017, 24, 195–211. [Google Scholar] [CrossRef]
- Irvine, K.N.; Devine-Wright, P.; Payne, S.R.; Fuller, R.A.; Painter, B.; Gaston, K.J. Green space, soundscape and urban sustainability: An interdisciplinary, empirical study. Local Environ. 2009, 14, 155–172. [Google Scholar] [CrossRef]
- Hewett, D. Sound Propagation in an Urban Environment; Oxford University: Oxford, UK, 2010. [Google Scholar]
- Wu, J.; Zou, C.; He, S.; Sun, X.; Wang, X.; Yan, Q. Traffic noise exposure of high-rise residential buildings in urban area. Environ. Sci. Pollut. Res. 2019, 26, 8502–8515. [Google Scholar] [CrossRef] [PubMed]
- Ow, L.F.; Ghosh, S. Urban cities and road traffic noise: Reduction through vegetation. Appl. Acoust. 2017, 120, 15–20. [Google Scholar] [CrossRef]
- Coensel, B.D.; Vanwetswinkel, S.; Botteldooren, D. Effects of natural sounds on the perception of road traffic noise. J. Acoust. Soc. Am. 2011, 129, EL148–EL153. [Google Scholar] [CrossRef]
- Wu, J.-G. Landscape Ecology: Pattern, Process, Scale and Hierarchy; Higher Education Press: Beijing, China, 2000. [Google Scholar]
- Jaszczak, A.; Pochodyła, E.; Kristianova, K.; Małkowska, N.; Kazak, J.K. Redefinition of Park Design Criteria as a Result of Analysis of Well-Being and Soundscape: The Case Study of the Kortowo Park (Poland). Int. J. Environ. Res. Public Health 2021, 18, 2972. [Google Scholar] [CrossRef]
- Hamilton, K.L.; Kaczynski, A.T.; Fair, M.L.; Lévesque, L. Examining the Relationship between Park Neighborhoods, Features, Cleanliness, and Condition with Observed Weekday Park Usage and Physical Activity: A Case Study. J. Environ. Public Health 2017, 2017, 7582402. [Google Scholar] [CrossRef]
- Lauro, E.D.; Falanga, M.; Lalli, L.T. The soundscape of the Trevi fountain in COVID-19 silence. Noise Mapp. 2020, 7, 212–222. [Google Scholar] [CrossRef]


| Primary Sound Category | Sound Source | Abbreviation |
|---|---|---|
| Natural Sound | Bird song | BS |
| Leaves rustling | LR | |
| Human Sound | Surrounding speech | SS |
| Children playing | CP | |
| Traffic Sound | External traffic | ET |
| Internal traffic | IT |
| Relative Rank | Scale |
|---|---|
| Small scale | 20 m, 40 m, and 60 m |
| Medium scale | 80 m, 100 m, and 120 m |
| Large scale | 140 m, 160 m, and 180 m |
| Land Use Type | Landscape Index | Abbreviation | Explanation |
|---|---|---|---|
| Vegetation | Percentage of landscape index of vegetation. | PLAND_VT | The relative proportion of vegetation patches in the entire landscape. |
| Patch density of vegetation. | PD_VT | The number of vegetation patches per unit area reflects the intensity of patch density. | |
| Landscape shape index of vegetation | LSI_VT | The degree of regularity of the shape of vegetation patches. | |
| Patch cohesion index of vegetation. | COHESION_VT | The connectivity of vegetation patches. | |
| Building | Percentage of landscape index of building. | PLAND_BD | The relative proportion of building patches in the entire landscape. |
| Patch density of building. | PD_BD | The number of building patches per unit area. | |
| Landscape shape index of building. | LSI_BD | The degree of regularity of the shape of building patches. | |
| Patch cohesion index of building. | COHESION_BD | The connectivity of building patches. | |
| Road | Percentage of landscape index of vehicular road. | PLAND_VR | The relative proportion of vehicular road patches in the entire landscape. |
| Patch density of vehicular road. | PD_VR | The number of vehicular road patches per unit area. | |
| Landscape shape index of vehicular road. | LSI_VR | The degree of regularity of the shape of vehicular road patches. | |
| Patch cohesion index of vehicular road. | COHESION_VR | The connectivity of vehicular road patches. | |
| Percentage of landscape index of pedestrian road. | PLAND_PR | The relative proportion of pedestrian road patches in the entire landscape. | |
| Patch density of pedestrian road. | PD_PR | The number of pedestrian road patches per unit area. | |
| Landscape shape index of pedestrian road. | LSI_PR | The degree of regularity of the shape of pedestrian road patches. | |
| Patch cohesion index of pedestrian road. | COHESION_PR | The connectivity of pedestrian road patches. |
| Common Factor | Factor | Component | ||
|---|---|---|---|---|
| 1 | 2 | 3 | ||
| F1 (soundscape pleasantness) | pleasant | 0.879 | ||
| harmonious | 0.729 | |||
| F2 (soundscape eventfulness) | eventful | 0.840 | ||
| vibrant | 0.747 | |||
| F3 (soundscape quietness) | quiet | 0.934 | ||
| comfortable | 0.632 | |||
| Dependent Variable | Independent Variable | Beta | VIF | t | R2 | F |
|---|---|---|---|---|---|---|
| Bird song SDD | 100 m-PD_VT | 0.53 | 1 | 3.311 ** | 0.256 | 10.963 ** |
| Surrounding speech SDD | 80 m-PD_VT | 1.082 | 2.973 | 7.736 ** | 0.849 | 23.013 ** |
| 80 m-PD_BD | 0.672 | 1.571 | 6.607 ** | |||
| 160 m-LSI_BD | 0.418 | 1.156 | 4.797 ** | |||
| 120 m-PD_VT | −1.046 | 3.862 | −6.564 ** | |||
| Children playing SDD | 40 m-PD_VT | 0.396 | 1.207 | 2.86 ** | 0.540 | 12.367 *** |
| 40 m-PLAND_BD | −0.535 | 1.291 | −3.739 ** | |||
| 120 m-LSI_BD | 0.478 | 1.496 | 3.104 ** | |||
| External traffic SDD | 20 m-COHESION_VR | 0.460 | 1.012 | 2.703 ** | 0.598 | 11.429 ** |
| 140 m-COHESION_BD | −0.619 | 1.012 | −3.632 ** | |||
| Internal traffic SDD | 100 m-LSI_BD | 0.363 | 1.003 | 2.242 ** | 0.399 | 8.646 ** |
| 120 m-LSI_VT | −0.586 | 1.003 | −3.620 * |
| Dependent Variable | Independent Variable | Beta | VIF | t | R2 | F |
|---|---|---|---|---|---|---|
| Pleasantness | 80 m-PLAND_VR | −0.506 | 1 | −2.988 ** | 0.227 | 8.927 ** |
| Eventfulness | 60 m-PLAND_BD | −1.023 | 1.828 | −5.431 ** | 0.728 | 13.492 ** |
| 100 m-COHESION_VT | −0.948 | 2.647 | −4.182 * | |||
| 140 m-PLAND_VT | 0.467 | 2.242 | −2.238 * | |||
| Quietness | 20 m-PD_PR | 0.406 | 1 | 2.354 * | 0.135 | 5.543 * |
Disclaimer/Publisher’s Note: The statements, opinions and data contained in all publications are solely those of the individual author(s) and contributor(s) and not of MDPI and/or the editor(s). MDPI and/or the editor(s) disclaim responsibility for any injury to people or property resulting from any ideas, methods, instructions or products referred to in the content. |
© 2023 by the authors. Licensee MDPI, Basel, Switzerland. This article is an open access article distributed under the terms and conditions of the Creative Commons Attribution (CC BY) license (https://creativecommons.org/licenses/by/4.0/).
Share and Cite
Liu, J.; Huang, Y.-J.; Chen, Z.; Hong, X.-C. Multi-Scale Effects of Landscape Pattern on Soundscape Perception in Residential Green Spaces. Forests 2023, 14, 2323. https://doi.org/10.3390/f14122323
Liu J, Huang Y-J, Chen Z, Hong X-C. Multi-Scale Effects of Landscape Pattern on Soundscape Perception in Residential Green Spaces. Forests. 2023; 14(12):2323. https://doi.org/10.3390/f14122323
Chicago/Turabian StyleLiu, Jiang, Yi-Jun Huang, Zhu Chen, and Xin-Chen Hong. 2023. "Multi-Scale Effects of Landscape Pattern on Soundscape Perception in Residential Green Spaces" Forests 14, no. 12: 2323. https://doi.org/10.3390/f14122323
APA StyleLiu, J., Huang, Y.-J., Chen, Z., & Hong, X.-C. (2023). Multi-Scale Effects of Landscape Pattern on Soundscape Perception in Residential Green Spaces. Forests, 14(12), 2323. https://doi.org/10.3390/f14122323