Abstract
Human soundscape perceptions exist through the perceived environment rather than the physical environment itself and are determined not only by the acoustic environment but also by the visual environment and their interaction. However, these relationships have mainly been established at the individual level, which may impede the efficient delivery of human-oriented considerations in improving the quality of large-scale urban spaces. Using the Chengdu Outer Ring Ecological Zone as an example, this study aims to develop an approach to predict human perceptions in large-scale urban green spaces. The site’s visual attributes, i.e., landscape composition, were calculated using space syntax and the quantum geographic information system (QGIS); its aural attributes, i.e., the sound level, were measured on site using a multi-channel signal analyzer; and its functional attributes, i.e., vitality, were documented through on-site observations and mapping. This was performed whilst obtaining people’s perceived soundscape through sound walks and a questionnaire-based on-site survey. The above environmental information was collected at micro-scale measurement spots selected within the site and then used together to formulate a model for predicting people’s soundscape perceptions in the whole site. The prediction results suggested that people’s perceived soundscape satisfaction increased as the distance from the ring road increased, and it gradually reached its highest level in the green spaces stretched outside the ring road. The prediction results of soundscape perception were then visualized using QGIS to develop planning and design implications, along with maps describing the site’s visual, aural, and functional features. Planning and design implications were suggested, including setting green buffers between noise sources and vulnerable areas; identifying and preserving areas with special visual and acoustic characteristics; employing sound shields around traffic facilities; and using natural landscapes to distract people’s attention from noise and to block their view of the source of noise. This study innovatively predicts individual-scale soundscape perception in large-scale UGSs based on environmental visual, aural, and functional characteristics through cross-level measurements, analyses, and model construction. By introducing a systematic perspective, the outcome of this study makes people’s soundscape perceptions more applicable in the planning and design practices of large-scale urban settings.
1. Introduction
Soundscape is regarded as an important indicator of environmental quality and is essential in constituting the landscape of urban green spaces (UGSs). Differentiated from ‘sound’ and the ‘acoustic/aural environment’, soundscape emphasizes the perceptual construct of sounds and is defined as “the acoustic environment as perceived or experienced and/or understood by a person or people, in context” [1]. This definition clarifies that the soundscapes of UGSs exist through human perception rather than the physical environment itself and, thus, are determined not only by the acoustic environment but also by the visual environment and their interaction. However, its essence as an individual perception limits its practical application in providing efficient planning and design instructions for large-scale urban spaces. This study intends to develop an approach to predict people’s soundscape perceptions in large-scale UGSs through cross-level measurements, analyses, and model construction, thus providing planning and design implications for improving the perceptual quality of large-scale urban spaces.
The perception of soundscape is formulated through a systematic process [2] and presented in multiple facets, among which perceived affective quality and physical acoustic information are the two major aspects. Perceived affective quality of soundscape was firstly proposed by Axelsson, Nilsson, and Berglund [3] as a two-dimensional model describing human perceived soundscape including four bipolar factors: pleasantness, eventfulness, calmness, and excitement. Many attempts have been made since to broaden the two-dimensional model. Excitement was replaced with vibrancy in a similar model with calmness as two underlying fundamental factors [4], while Aletta et al. [5] proposed that perceived affective quality could be measured by a three-dimensional model comprising pleasantness, eventfulness, and familiarity. A soundscape description tool including two axes, cacophony-hubbub and constant-temporal, which were developed to respectively present the numbers of sound sources and the levels of discordancy and variation within the soundscape perceived by people [6]. In addition to replacement, these basic factors have also been extended to incorporate more soundscape attributes. Axelsson, Nilsson, and Berglund enriched their two-dimensional model with eight unidirectional indicators: calm, pleasant, exciting, eventful, chaotic, annoying, monotonous, and uneventful [3]. The set of indicators was later included in the ISO 12913 [7] to unify soundscape perception descriptors and instruct soundscape evaluation. These perceived aural attributes of soundscapes are commonly evaluated using qualitative methods such as soundwalks, questionnaires, semantic analysis, and interviews [8]. Cao and Kang [9] used interviews and semantic analysis to explore how people perceived sound classification, sound appraisal (including sound features and psychological reactions), and soundscape preference in urban public spaces. Questionnaire-based surveys were employed in a study to evaluate the urban forest soundscape according to the eight perceptual attribute quality indicators outlined in ISO 12913 [7]. For similar studies, strict controls on experimental design and subject selection are required to ensure the accuracy of the obtained results, as these measurements are strongly influenced by individual perceptive differences [10] and the scope of settings [11].
In addition to perceptive attributes, physical parameters in relation to the acoustic environment, such as noise annoyance [12], sound level [13], and the composition and significance of sound sources [14], were also confirmed with effects on soundscape perceived by the individual. Noise annoyance was increased when the sound was regarded to have a negative impact on society [15] and was measured by loudness, sharpness, fluctuation strength, and impulsiveness in early research. After quantifiable acoustic instruments were invented, parameters (i.e., LAeq, LCeq, and LA10) that could be recorded and analyzed to indicate sound pressure levels, fluctuation difference, and dB change at low frequencies were widely applied in relevant acoustic studies. Soundscape composition is normally used to objectively reflect the existence of different sound sources. It is another important parameter used in predicting people’s soundscape perceptions, and it is often measured together with the loudness or significance of sound sources [16]. For studies evaluating soundscape perceptions through physical parameters, acoustic instruments such as digital acoustic recorders, spectrogram analyzers [17] and multi-channel signal analyzers [18] are commonly used to obtain and analyze the sound composition of the surrounding environment [14], the significance of sound sources [17], and the sound pressure level [13]. For example, recordings and EMuJoy software were used in a recent study to analyze the effect of sound sequence on soundscape emotions, focusing on three aspects of sound sources: the number of sound sources, changing trends in the number of sound sources (increment/decrement), and the category of the sound source [14]. The relationships between certain physical and psychoacoustic parameters (LAeq, LCeq, LA10, and LA90) and perceived soundscape composition parameters (perceived loudness of individual sound, perceived occurrences of individual sound, and soundscape diversity index) were investigated to develop a more effective way to design soundscapes in city parks [16]. Physical parameters were recorded with a Sony PCM-D50 sound recorder, while perceived soundscape composition parameters were obtained through sound walks. However, constrained by the accuracy and application scope of instruments, these relationships were primarily established at the individual level and are difficult to apply in predicting human perceptions in large-scale spaces. Some of them can even only be validated in laboratory settings.
In addition to aural aspects, environmental visual attributes can also influence soundscape perception [19]. The influences of visually perceived naturalness [20], waterscape [21], aesthetics [22], openness [23], layering and order [24], the visibility of noise sources [25], crowding [26], and maintenance level [27] have been proven in various contexts, such as urban forests [28], urban parks [29], urban public spaces, university campuses [30], and neighborhoods [31]. These indicators can generally be classified into perception type and physical type [32]. The perception type is normally measured and analyzed as qualitative indicators, while the physical type can be described both qualitatively and quantitatively. In a study of Chinese urban parks, the composition of landscape elements was calculated as percentages and considered an important factor in modeling soundscape perceptions [25]. Subjective soundscape attitudes were found to be directly influenced by visual indicators that physically described urban streets, including the street width, building height, and street width to building height in a study conducted with the help of 3D virtual reality [33]. The effects of visual attributes on soundscape perception have also been explored in studies investigating the interactions between visual and aural characteristics [34]. Scholars have found that a quiet environment with low sound pressure levels does not necessarily lead to high satisfaction with soundscape perception since visual information can supplement and enhance the meaning of the sound that people perceive [35,36], and vice versa [37]. High levels of environmental decibel values can significantly interfere with the process of perceiving visual environments, thus negatively affecting people’s overall perceived soundscapes [38]. In addition, the consistency between visual and aural attributes plays an important role in constituting people’s soundscape perceptions. When the two aspects are consistent, people are more likely to have better evaluations of environmental soundscapes [39]. Thus, it is essential to consider both the visual and aural attributes of an environment as well as their interaction in evaluating, modeling, and predicting individuals’ soundscape perceptions.
Though efforts have been made, most relationships were constructed within perceptual qualities. People’s perceived acoustic comfort was correlated with acceptability of the environment and preference to stay in an urban park context [6]. A study conducted in five different types of UGSs also found that perceived affective qualities of soundscape (PAQs) and perceived sensory dimensions of landscape (PSDs) could be used to measure overall soundscape satisfaction [6]. Very few studies have attempted to measure the soundscape perceptions of individuals based on the physical attributes of the environment, while relationships between subjective human experience and objective environmental indicators are actually key in delivering applicable design implications. Aletta, Kang, and Axelsson (2016) developed a conceptual framework for predictive soundscape models based on a literature review. Although it contained both physical and perceptive aural attributes, no visual indicator was considered. Also, these indicators were proposed to be measured with soundwalks, laboratory experiments, narrative interviews, and behavioral observations in the framework. Therefore, the application scope and practicality of the modeling results may be significantly constrained, and the results of applying the framework on a specific setting can rarely be used to provide insight for design improvements. This limitation was also observed in another model implementing perceptual aural attributes (e.g., ‘calm’ and ‘pleasant’) for a UK garden based on audio recordings of it [40]. Using physical, behavioral, social, demographical, and psychological factors as independent variables, an artificial neural network was employed to generate soundscape models accordingly. The outcome of this study still did not overcome the constraints on a research scale since the performance of the constructed models became worse as the number of sites increased.
Therefore, this study aims to establish a model to mathematically predict people’s perceived soundscapes in large-scale UGSs based on environmental visual, aural, and functional characteristics. Taking the Chengdu Outer Ring Ecological Park as the research site, its visual attributes, specifically the landscape composition, were calculated using space syntax and the quantum geographic information system (QGIS); its aural attributes, specifically the sound level, were measured using a professional acoustic apparatus; and its functional attributes, namely vitality, were documented through on-site observations and mapping. To obtain people’s perceived soundscapes, a questionnaire-based on-site survey was conducted during sound walks. Environmental data were collected at micro-scale measurement spots selected within the site and then used together to formulate a stochastic model. This was performed to investigate whether and how the model changed within different sound level ranges [41]. This model could not only disclose the correlation between environmental characteristics and human-perceived soundscapes but could also be used to predict people’s perceived soundscapes in large-scale UGSs. Environmental data were then collected at the site level and input into the constructed model to predict people’s perceived soundscapes in the site. The results were also visualized as a soundscape perception map to indicate where planning and design improvements should be introduced to enhance people’s soundscape experiences.
2. Materials and Methods
2.1. Research Site
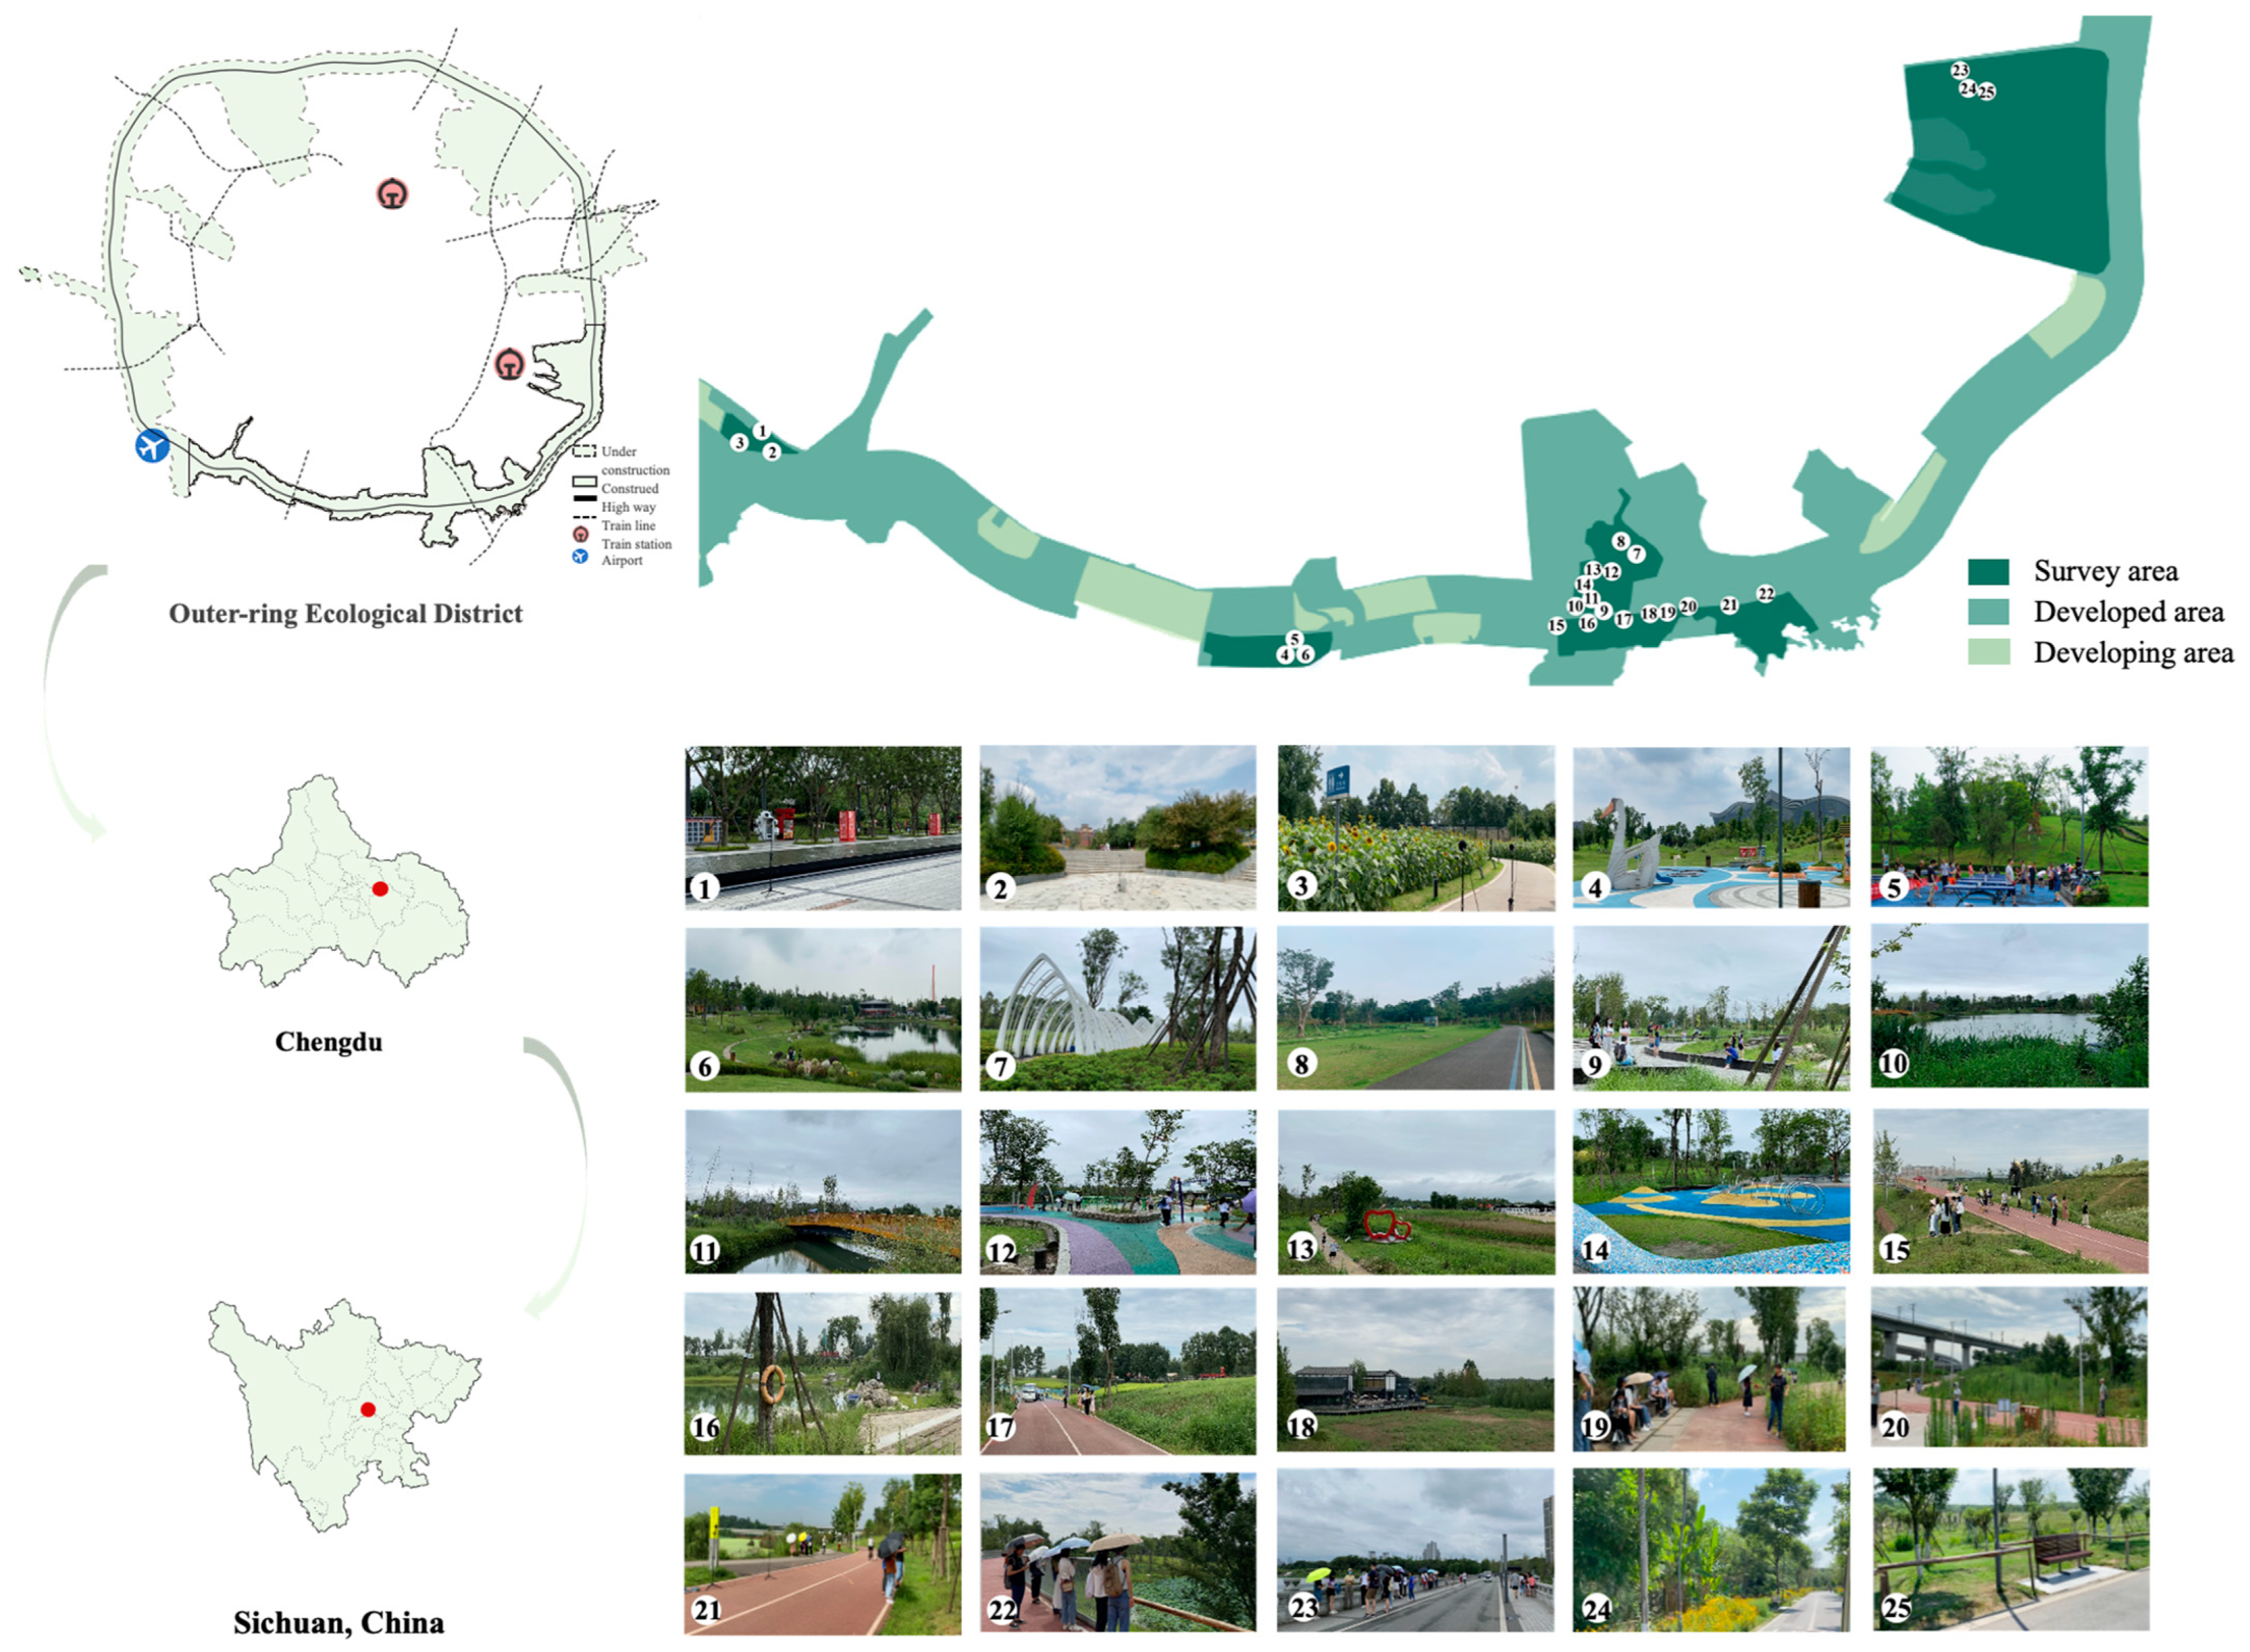
This study selected the Chengdu Outer Ring Ecological Zone (hereinafter referred as ‘the Zone’) as the research site, which is defined within 500 m on both sides of the Chengdu Outer Ring Road. The Zone covers an area of about 187.2 square km containing various land uses, such as green spaces, transportation, residences, commerce, and farmland. The planning objective of this project was to transform the Zone into a giant eco-park surrounding the inner city of Chengdu. To date, the southern part of the Zone has largely been built and widely praised by the public. However, it also suffers from noise issues. Traffic sounds from surrounding highways, railways, and Tianfu Airport, and mechanical sounds from nearby construction have seriously affected people’s landscape experiences. High-level development requirements and current noise problems make the Chengdu Outer Ring Ecological Zone an appropriate research site for this study (see Figure 1).

Figure 1.
Research site: Chengdu Outer Ring Ecological Park.
Measurement spots were selected to obtain people’s soundscape satisfaction evaluation results. At the spot scale, the influential indicators and mechanisms of people’s soundscape satisfaction were determined so that a model to predict people’s soundscape satisfaction for the whole site could be established. A total of 25 measurement spots were selected within the southern part of the site, which is built and open to the public. The selection was based on the following criteria: (1) the spots should present typical visual and acoustic features of the site and be distinct from one another; (2) an open view is required for each spot, along with enough space to allow participants to take free experiential walks without interfering with the acoustic recordings; and (3) the distance between measurement spots should be over 300 m to allow enough time for subjects to clear their heads before starting a new evaluation. Each measurement spot was delimited to a moderate size between 50 m × 50 m and 100 m × 100 m to ensure enough space for people to experience the environment without losing the sense of space [42] (see Figure 1).
2.2. Measurements
Visual landscape composition, sound pressure level, and functional vitality were determined as environmental indicators to explore whether and how they can affect human soundscape perceptions. Given that the study aimed to predict human soundscape perceptions in large-scale UGSs, the visual, aural, and functional characteristics were first measured for the 25 measurement spots. These were then used to construct a prediction model for the Chengdu Outer Ring Ecological Park.
2.2.1. Visual Landscape Composition
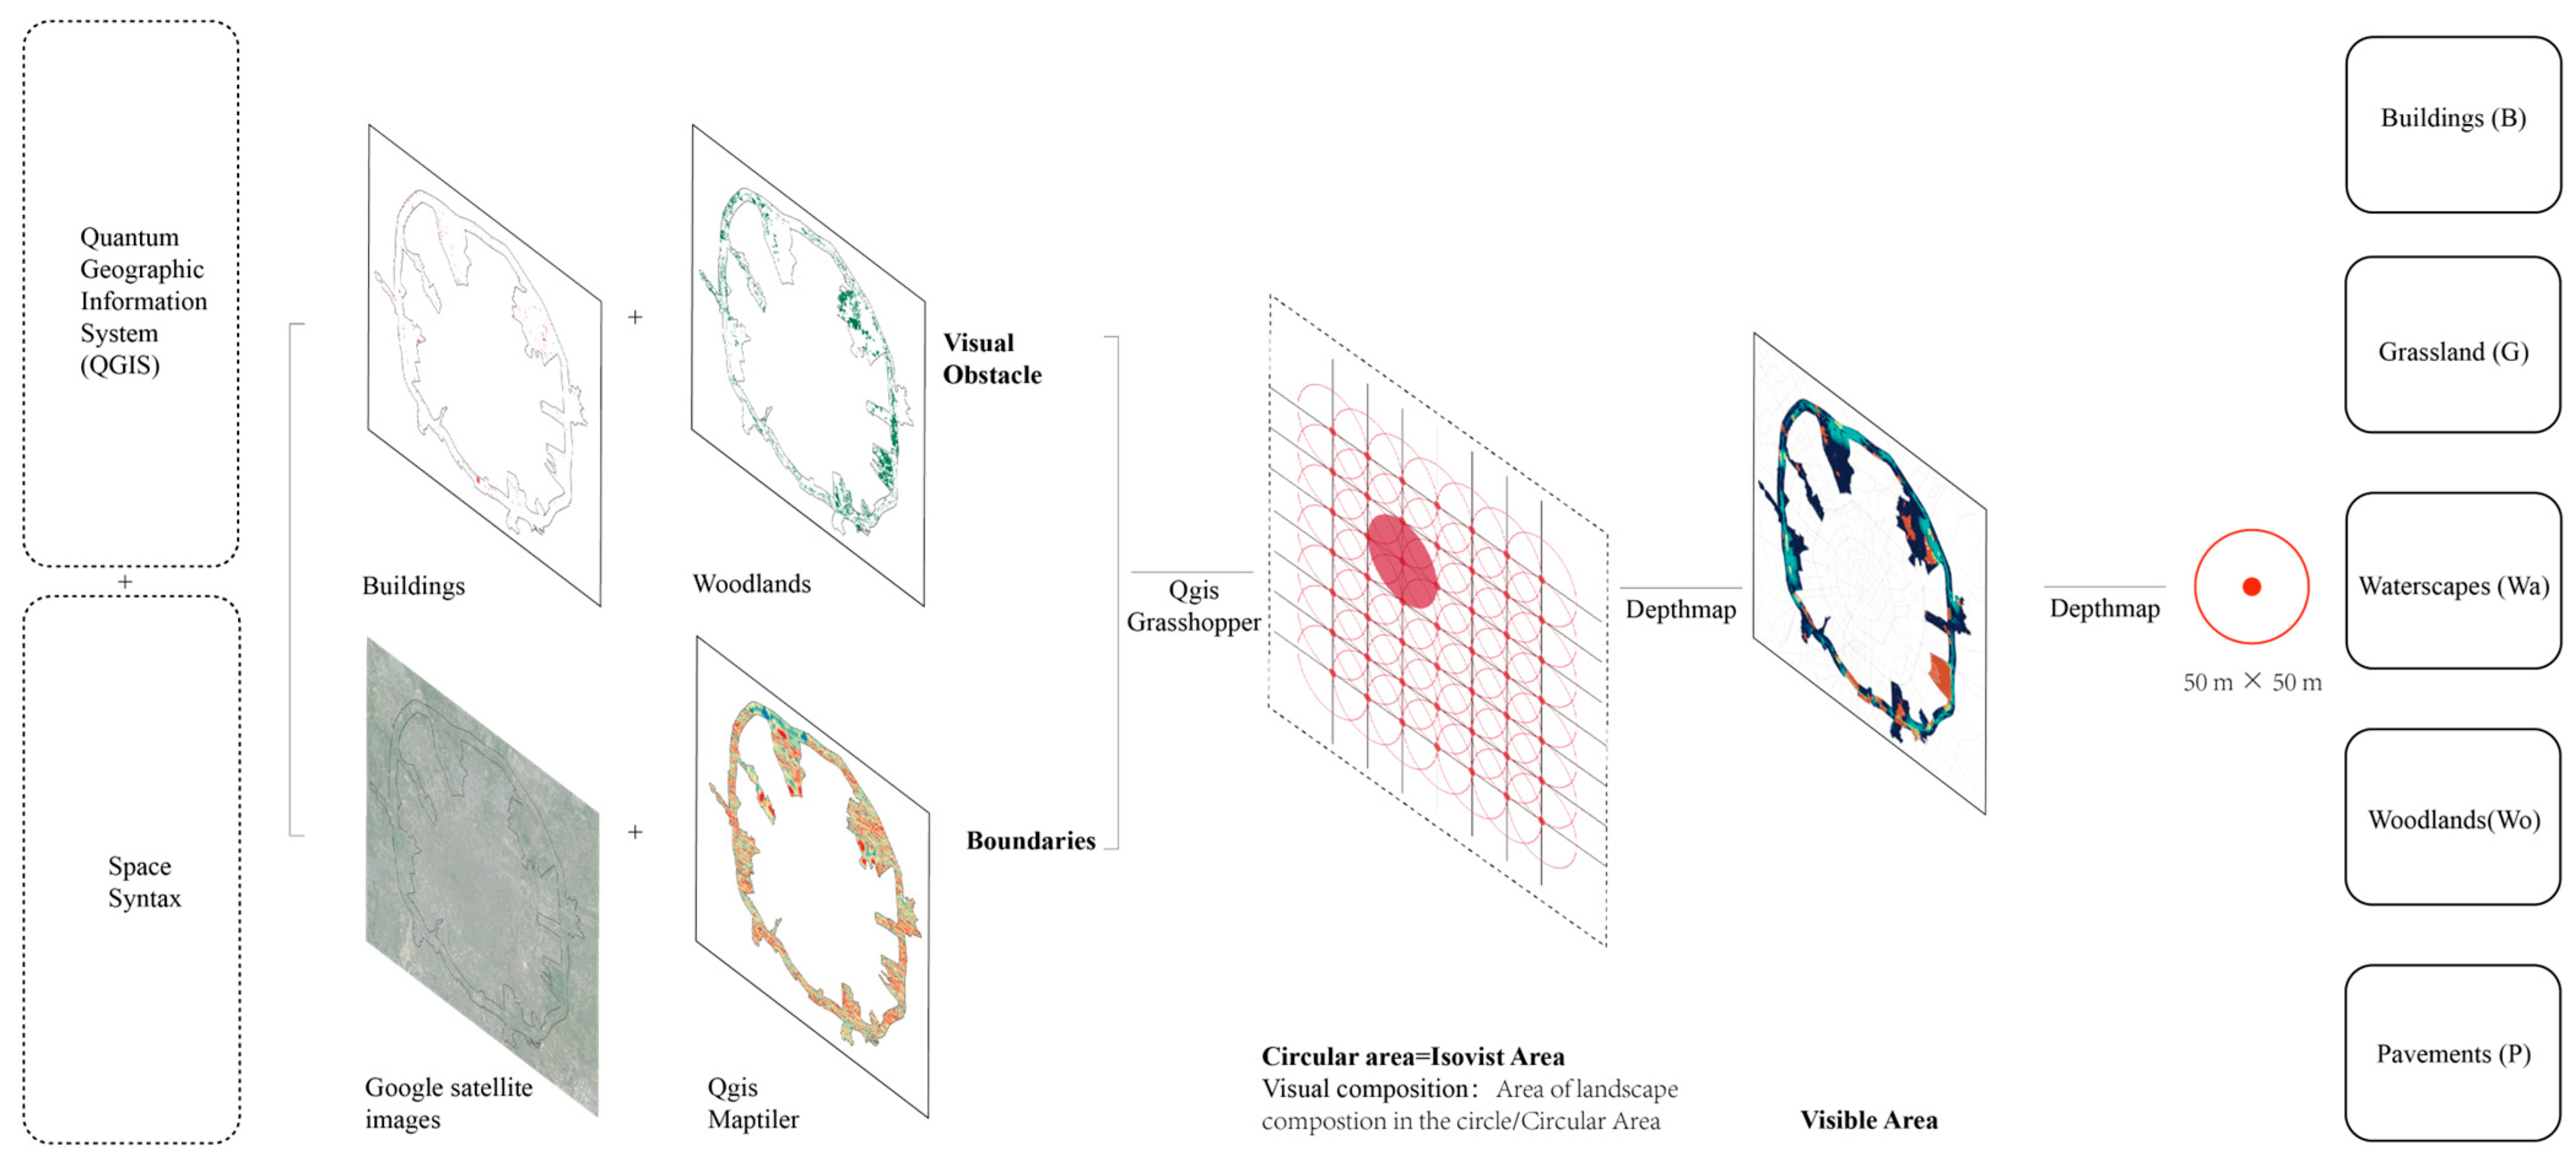
Visual landscape attributes were calculated from people’s perspectives rather than from the actual distribution of landscape elements. QGIS and space syntax were used to calculate the landscape composition people visually perceived at the site. According to the pilot study, five major landscape elements—woodland, buildings, grassland, waterscape, and pavement—existed within the site. Among which buildings and woodland were also taken as visual obstacles. Their boundaries were delimited using QGIS Maptiler and Google satellite images so that to identify areas that could be visually perceived by people. These visible areas were then analyzed in Depthmap over a 50 m × 50 m grid and imported into QGIS again to respectively calculate the areas of buildings (B), grassland (G), waterscape (Wa), woodland (Wo), and pavement (P) within each grid. Following this procedure, the visual landscape composition was first calculated for the whole site, and the composition of each measurement spot was then obtained from the overall calculation results based on its actual location and range (see Figure 2).
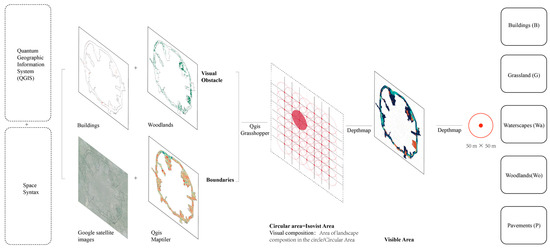
Figure 2.
Measuring visual landscape calculations of the site using space syntax and QGIS.
2.2.2. Sound Pressure Level
The equivalent continuous A-weighted sound pressure level (LAeq) was selected to objectively describe environmental sound levels. It is a widely used parameter in existing studies to indicate the environmental decibel value and variations in sound intensity [42] and has been confirmed to have evident effects on people’s soundscape perceptions [43]. Thus, sound pressure level was regarded as appropriate in objectively representing the aural attributes.
The sound level was first measured on a spot scale using a multi-channel signal analyzer (AWA6290L+). This acoustic instrument has proven to be effective in measuring and recording sound levels in outdoor environments owing to its multi-channel receptors and high sensitivity [44]. In the field measurements, it was used with a set of apparatus including two test microphones (AWA14423, frequency range 20–16,000 Hz, sensitivity about 40 mV/Pa), two preamplifiers (AWA14604, Integrated Circuits Piezoelectric, impedance conversion, frequency range 10–200 kHz, Gain 1), two 80 mm diameter wind balls, and two tripods (about 1.6 m high).
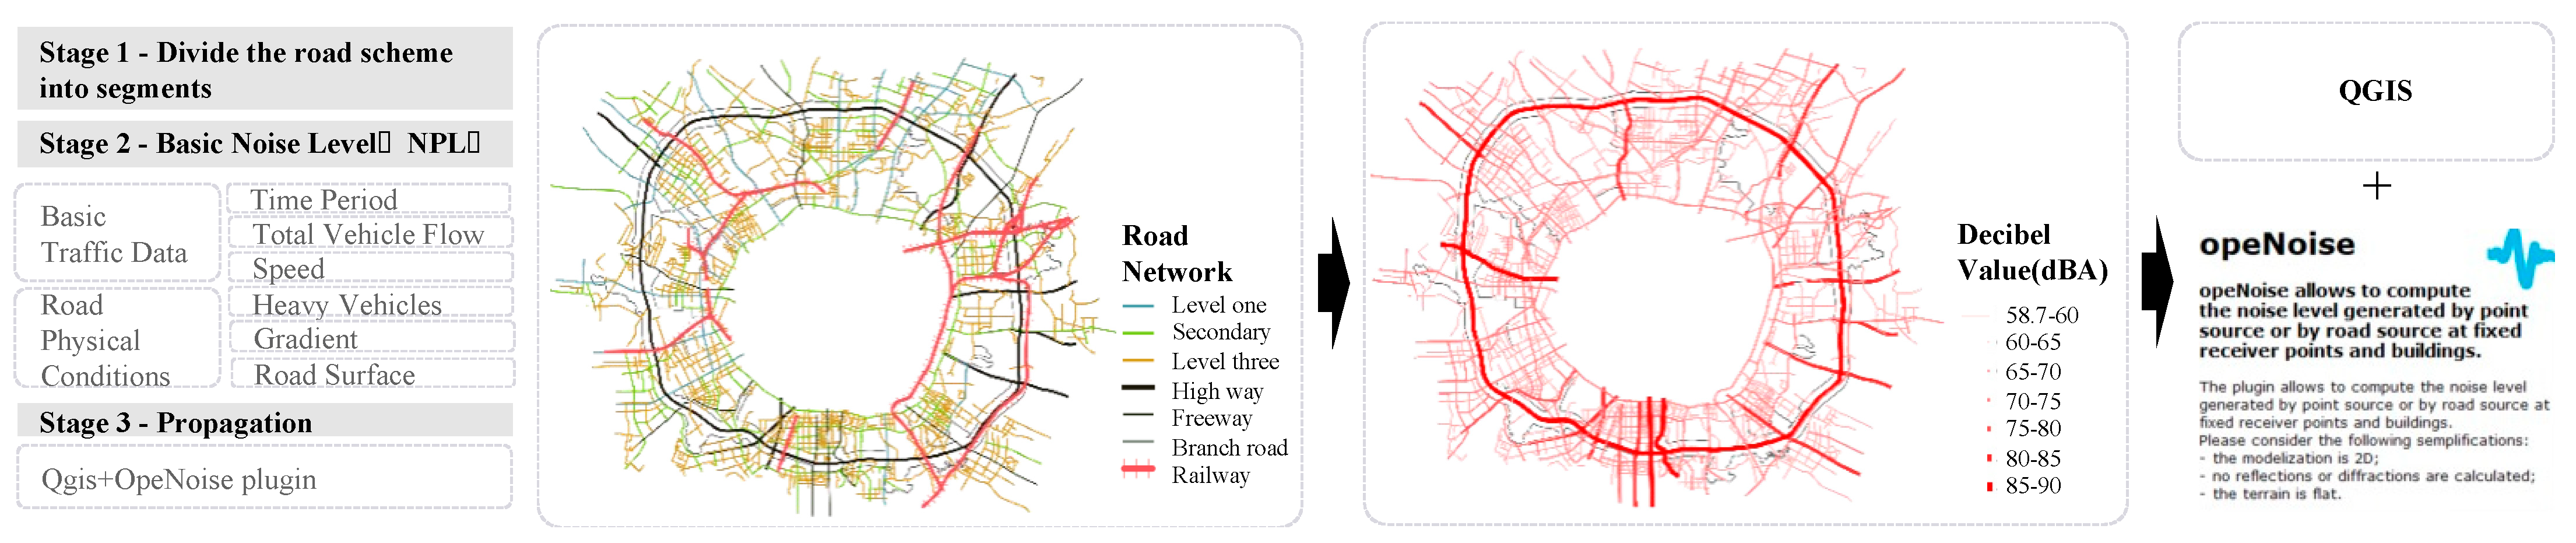
Considering the difficulty of instrumentally measuring the sound pressure level of the whole site, it was estimated based on the dominant sound source: traffic. The sound pressure level of traffic noise was calculated using the noise prediction model (NPL) [see http://resource.npl.co.uk/acoustics/techguides/crtn/ (accessed on 18 March 2022)]. It is an open-sourced model for calculating road traffic noise levels in non-complex situations [45]. Traffic volume data for the 30 urban roads that crossed the site and the penetration state of road pavement materials were retrieved from the Chengdu Communication Investment Company with their consent. Additionally, the proportion of heavy vehicles (Mean = 22%, SD = 2.87) in the traffic flow and active time period (18 h/day) was estimated through on-site investigation. This information was then entered into the NPL to calculate the decibel values for each road within a range of 10 m on both sides of its center line. The decibel values of the 30 roads generated by the NPL were then correlated with road hierarchy information and entered into QGIS to calculate the sound pressure level for the site’s entire traffic network. Referring to the principle of sound attenuation, the OpenNoise plugin in QGIS was used to predict and visualize the noise distribution within the entire site (see Figure 3).
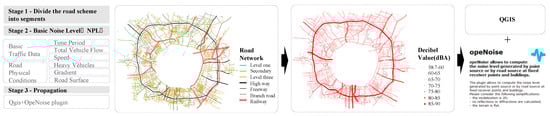
Figure 3.
Sound pressure level calculated using NPL, QGIS, and the OpeNoise plugin.
2.2.3. Functional Vitality
Functional vitality (V) was adapted from the notion of urban vitality. It refers to people and their activities observable in a specific space throughout varied time schedules and is the product of the number and duration of various activities [46]. This study revised the term to “functional vitality” and defined it as the diversity and intensity of activities occurring within different areas of the site. The measurement of this indicator could be used to illustrate human behavior attributes in response to environmental characteristics.
Functional vitality was initially measured at the spot scale through on-site observations and mapping conducted by four groups of trained surveyors. During the site’s open hours, surveyors ranked the diversity (total number of activity types) and intensity (total number of people) of each spot at two-hour intervals from 8:00 to 17:00 (10:00, 12:00, 14:00, and 16:00) using a five-level Likert scale (1–5, with 1 representing “not diverse/intensified at all” and 5 representing “strongly diverse/intensified”). The mean value of the four surveyors’ ratings was then calculated to determine the functional vitality for each measurement spot.
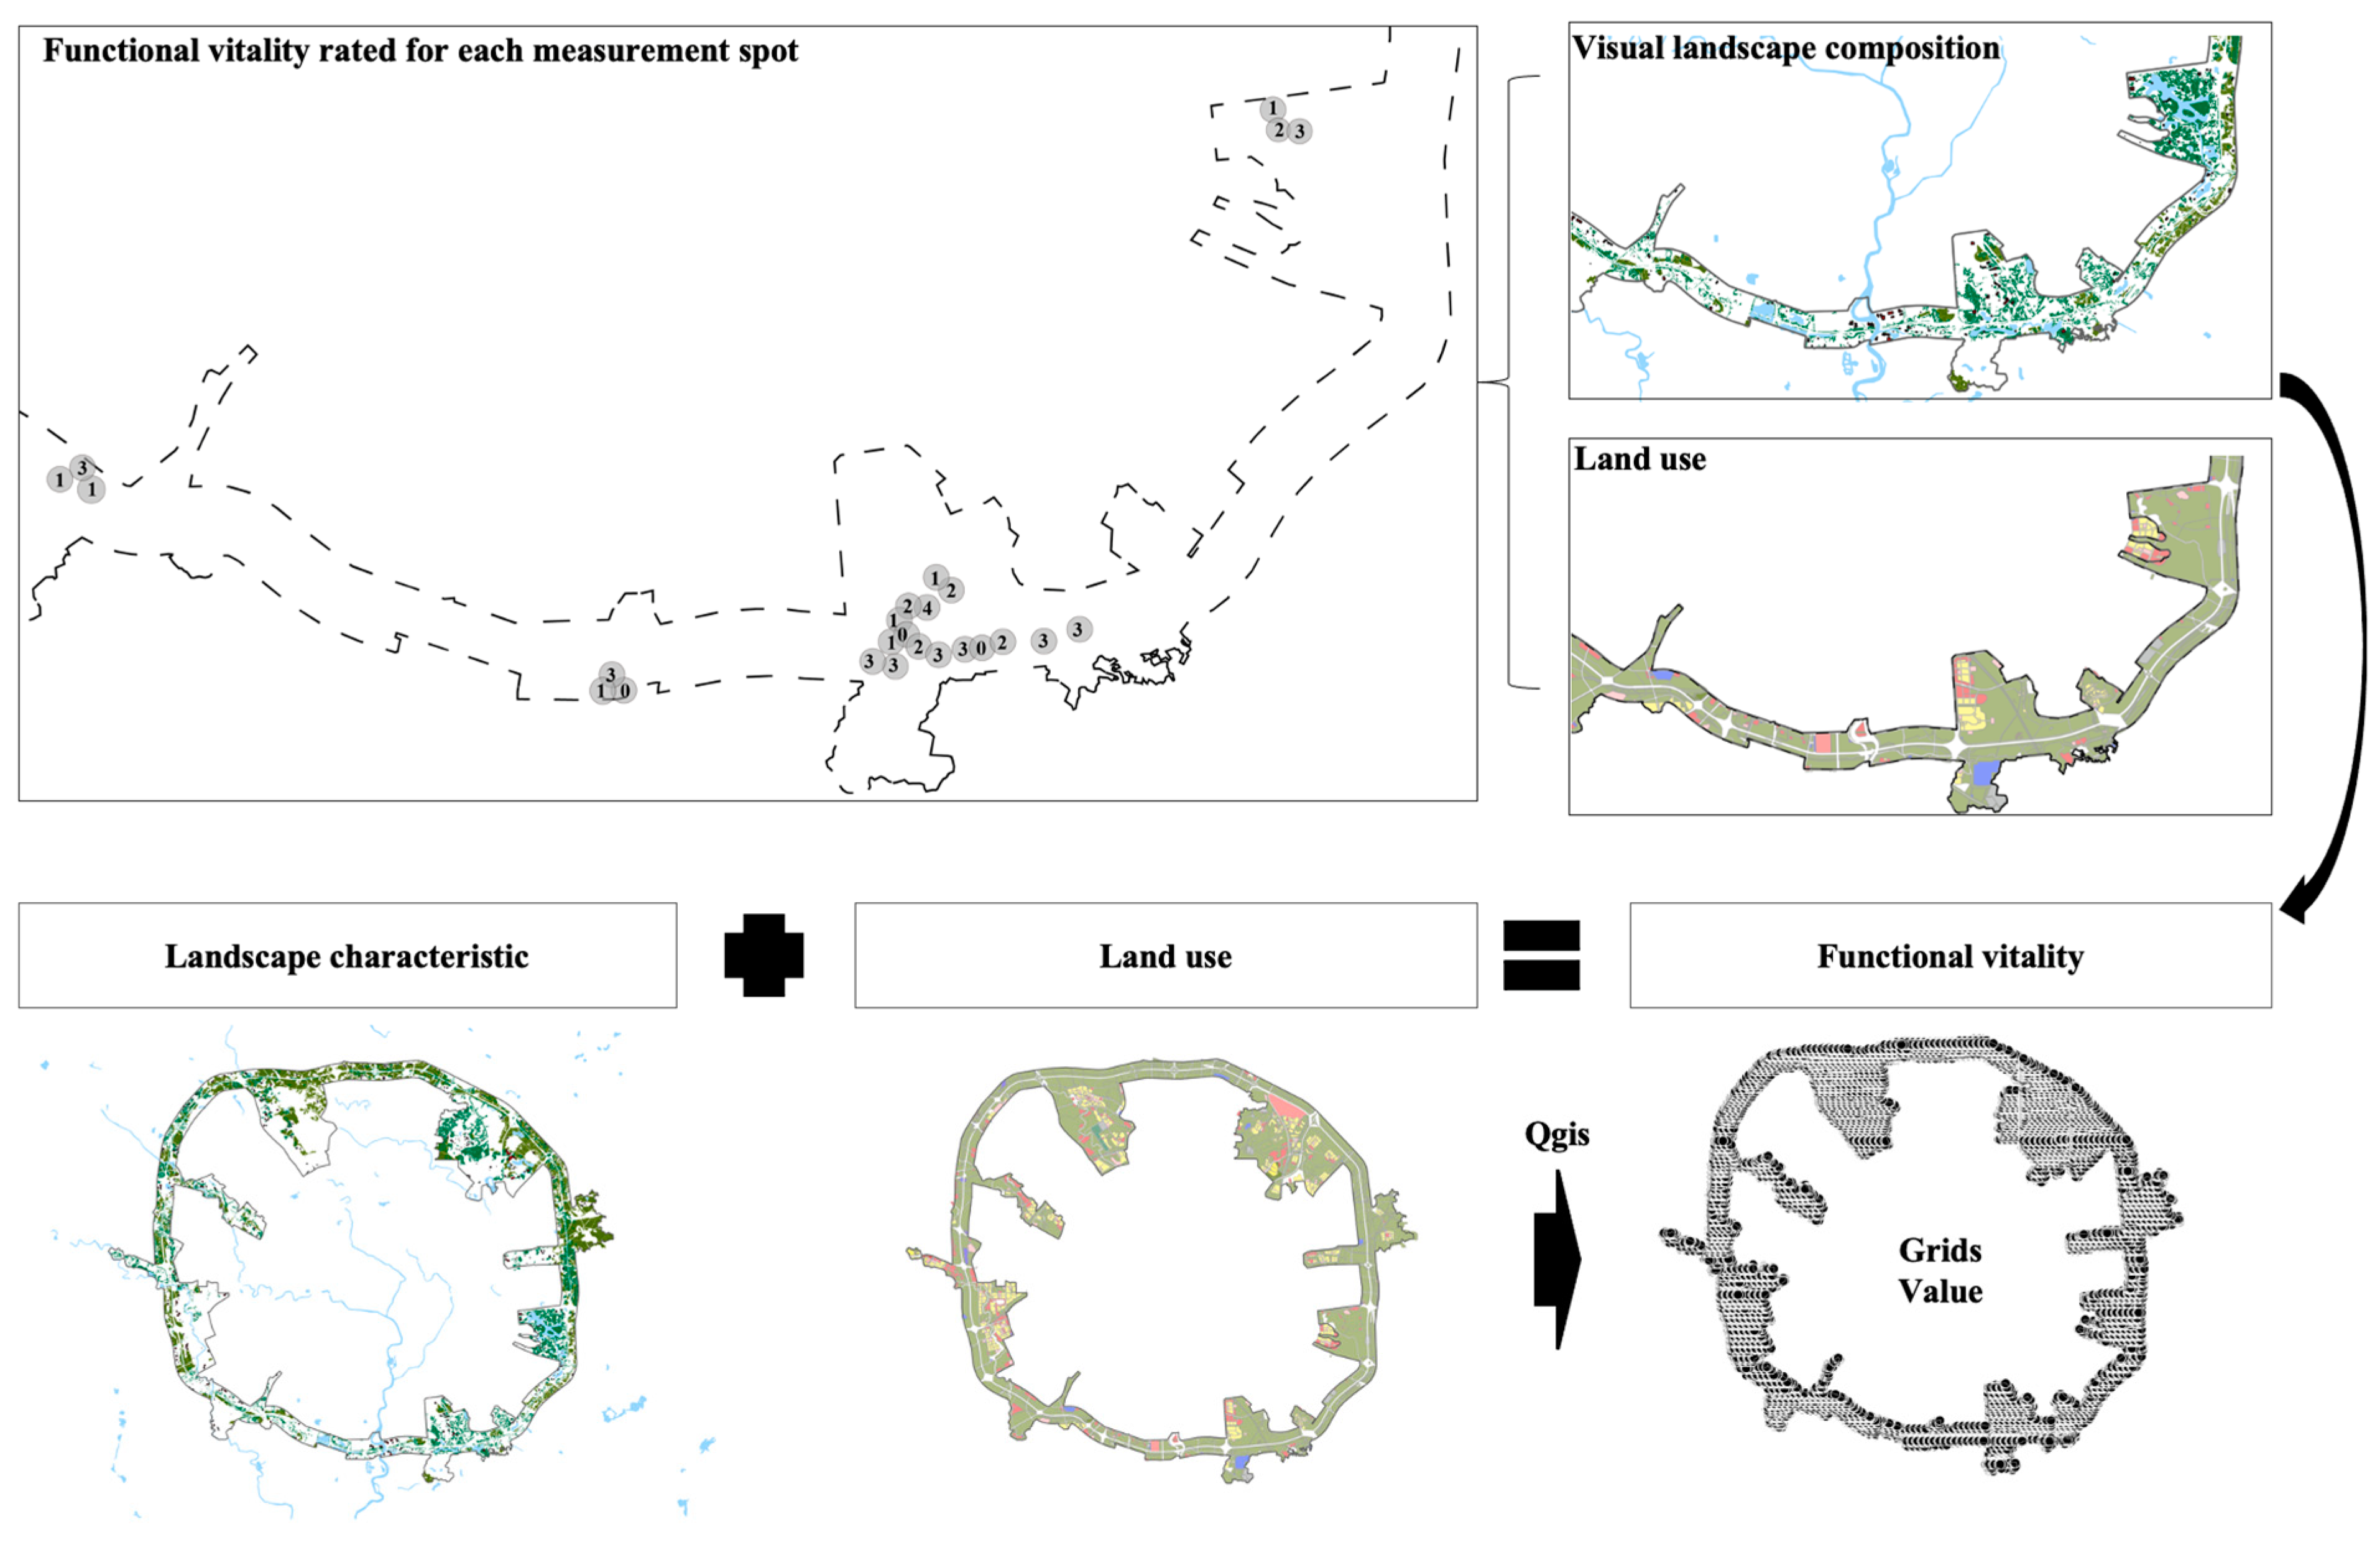
Given that spatial vitality can be influenced by environmental functions [47] and landscape characteristics [48], the functional vitality obtained for each measurement spot was first correlated with its land use and visual landscape composition. The same value of functional vitality was then assigned to grids with similar land uses and visual landscape compositions using QGIS to ascertain the functional vitality of the entire site (see Figure 4).
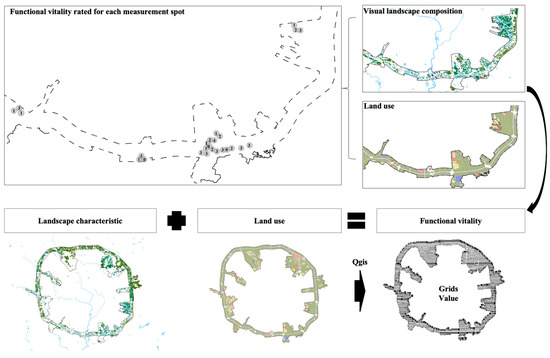
Figure 4.
Functional vitality of the site calculated based on spot vitality ratings, land uses, and visual landscape characteristics.
2.2.4. Satisfaction with Perceived Soundscape
People’s satisfaction with their perceived soundscape (S) was used to describe the overall soundscape perception in the site and was measured through a sound walk and questionnaire-based on-site survey conducted at each measurement spot. The questionnaire was designed as an online version in advance of the sound walk. It started with collecting subjects’ background information, including gender and age, to assess whether individual perceptual differences existed, followed by a question to investigate whether people were satisfied with their perceived soundscape in each experienced measurement spot, also using a five-level Likert scale (1–5, with 1 representing “strongly unsatisfied” and 5 representing “strongly satisfied”).
2.3. Data Collection
Data collection mainly occurred at the spot level to gather information related to sound pressure level, functional vitality, and human-perceived soundscape satisfaction. Based on previous soundscape studies, the total number of valid responses needed for relevant studies should exceed 100. Considering the number of spots, 20 local university students aged between 20 and 30 years with normal hearing and vision abilities were recruited to participate in the sound walk and questionnaire-based survey. Before performing the sound walk and survey, all participants went through a training process and provided informed consent.
The field survey was conducted on three sunny days in July 2021, with an air quality index below 60 and wind speeds under 5 m/s. The 20 subjects were evenly split into four groups and each group was led by one researcher. The routes taken by the four groups to traverse the 25 measurement spots were different and determined before starting the survey. The subjects were instructed to take a sound walk and individually wander within each measurement spot for five minutes to experience their surrounding environment. Afterwards, they completed the online questionnaire through a link provided by the researcher. Subjects were asked repeatedly to complete the sound walk and questionnaire survey at each of the 25 measurement spots, yielding a total of 500 responses. Data deemed as “noise”, such as incomplete questionnaires or those with identical ratings for every indicator, were manually removed. The final number of valid responses was 393 (approximately 16 per spot).
Another group of researchers recorded the environmental sound level at each spot using the multi-channel signal analyzer while the sound walk and questionnaire survey were being carried out. The set of equipment was positioned at the central point of each spot for recording. The sound pressure level of each spot was measured four times in accordance with the frequency of the sound walks conducted respectively by the four subject groups. For each measurement, the signal was firstly calibrated using a sound-level calibrator (AWA6021A, accuracy level 1) and then the formal recording was taken by the multi-channel signal analyzer (AWA6290L+) for a consecutive three minutes. Therefore, four sets of three-minute recordings (a total of 100 recordings) were collected for each spot and the sample frequency of each audio file was 96.0 kHz.
2.4. Data Analysis
Data analysis was conducted at the spot and site levels, while the prediction and visualization process was only undertaken at the site level.
At the spot level, metrics such as human-perceived soundscape satisfaction, sound pressure level, and functional vitality were collected. Human-perceived soundscape satisfaction was first checked for reliability and then presented as the mean value of the responses obtained at each spot. The sound data were analyzed using spectrum analysis incorporated in the SPL 1/3 octave bands analysis package of AWA6229 6.0 software. The analysis was performed on audio files to calculate the LAeq for each spot over the four sets of three-minute recordings. The average LAeq of each measurement spot represented the average of four sets of recordings and the average sound level recorded during three minutes. Regarding functional vitality, three steps were taken to determine the final value for each spot. First, the average of behavior diversity and intensity was rated by four surveyors at each measurement spot. Then, the average rating from the four surveyors was calculated. Given that observations and evaluations occurred in different time slots, the average functional vitality of the recorded slots was also determined. Therefore, the functional vitality represented the averages of the four surveyors’ ratings, intensity and diversity, and all recorded time slots.
Before model construction, the turning point in the sound level was first determined. Correlational analysis was then employed to identify indicators relevant to people’s satisfaction with the perceived soundscape. These relevant indicators were then used to formulate regression models to illustrate the relationships between people’s soundscape satisfaction and its influencing visual and aural attributes.
Information about visual landscape composition, sound pressure level, and functional vitality was obtained and calculated at the site level. These data were then incorporated into the previously generated stochastic model to predict the overall satisfaction of people with their perceived soundscape for the site. The sound perception results were subsequently visualized using QGIS to develop planning and design implications.
3. Results
3.1. Manipulation Checks
The internal consistency of people’s satisfaction responses was examined using Cronbach’s alpha [49] in SPSS V26.0. The results suggested that the reliability of the evaluated soundscape perceptions was consistently greater than 0.6, indicating the effectiveness of the obtained data. An independent samples t-test was also conducted based on gender groups to investigate whether any perceptual differences existed. The Levene test for variance equality showed values greater than 0.05, indicating homogeneity of variance. Additionally, the t-test results for the mean equation were all greater than 0.05, demonstrating that gender differences had no impact on individual perceived soundscapes.
3.2. Descriptive Analysis
General descriptions of the visual landscape, sound pressure level, functional vitality, and soundscape perception results measured at the spot level are shown in Table 1.

Table 1.
General descriptions of environmental attributes and human soundscape perceptions measured at the spot level.
The average satisfaction of people in terms of soundscape perception was rated as 3.46. People were most satisfied with their perceived soundscape in spot 7 (4.41/5.00) and least satisfied with spot 3 (2.57/5.00). Most measurement spots (21 out of 25) received ratings between 3.00 and 4.00. Three spots—spots 3 (2.57/5.00), 17 (2.65/5.00), and 19 (2.79/5.00)—were rated lower than 3.00. See Table 1.
3.2.1. Descriptive Analysis of Visual Landscape Composition
At the spot level, it was observed that the component of grassland (Mean = 55.45%) constituted the majority in almost all of the 25 measurement spots, followed by waterscape (Mean = 14.70%) and woodland (Mean = 11.70%). In most measurement spots, grassland accounted for over 50% of the landscape composition. The highest percentages of grassland appeared at spots 2 (88.27%), 3 (79.51%), 19 (77.70%), 5 (76.16%), 4 (74.85%), and 6 (74.56%). Only seven spots—8 (48.92%), 14 (46.64%), 18 (45.41%), 25 (33.49%), 24 (33.13%), 23 (30.56%), and 1 (20.89%)—had less than 50% grassland within their delimited areas. Among the 25 spots, spot 1 had the least component of grassland. In terms of another green landscape, woodland, it was negligible in spots 1 (0.96%), 2 (0.00%), 3 (0.00%), 4 (0.29%), 5 (0.21%), 6 (0.12%), 24 (0.00%), and 25 (0.03%), while spots 15 (34.15%), 22 (30.39%), 18 (28.27%), 12 (22.64%), 17 (21.51%), and 13 (20.61%) had relatively higher percentages of woodland. Waterscape was especially dominant in spots 23 (52.33%), 24 (48.43%), 25 (48.60%), 8 (27.71%), and 14 (21.66%). However, it was not a mandatory component for designing all spaces in UGSs; therefore, it was scarcely observed in spots 1 (0.00%), 2 (0.00%), 7 (0.00%), 12 (0.00%), 13 (0.00%), and 15 (0.84%). Pavement (Mean = 9.63%) and buildings (Mean = 1.60%) were the least dominant components in all of the measurement spots (see Table 1 and Figure 5).
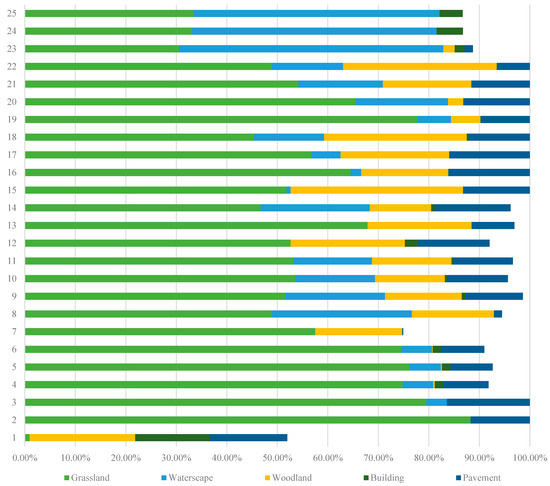
Figure 5.
Visual landscape composition of each measurement spot.
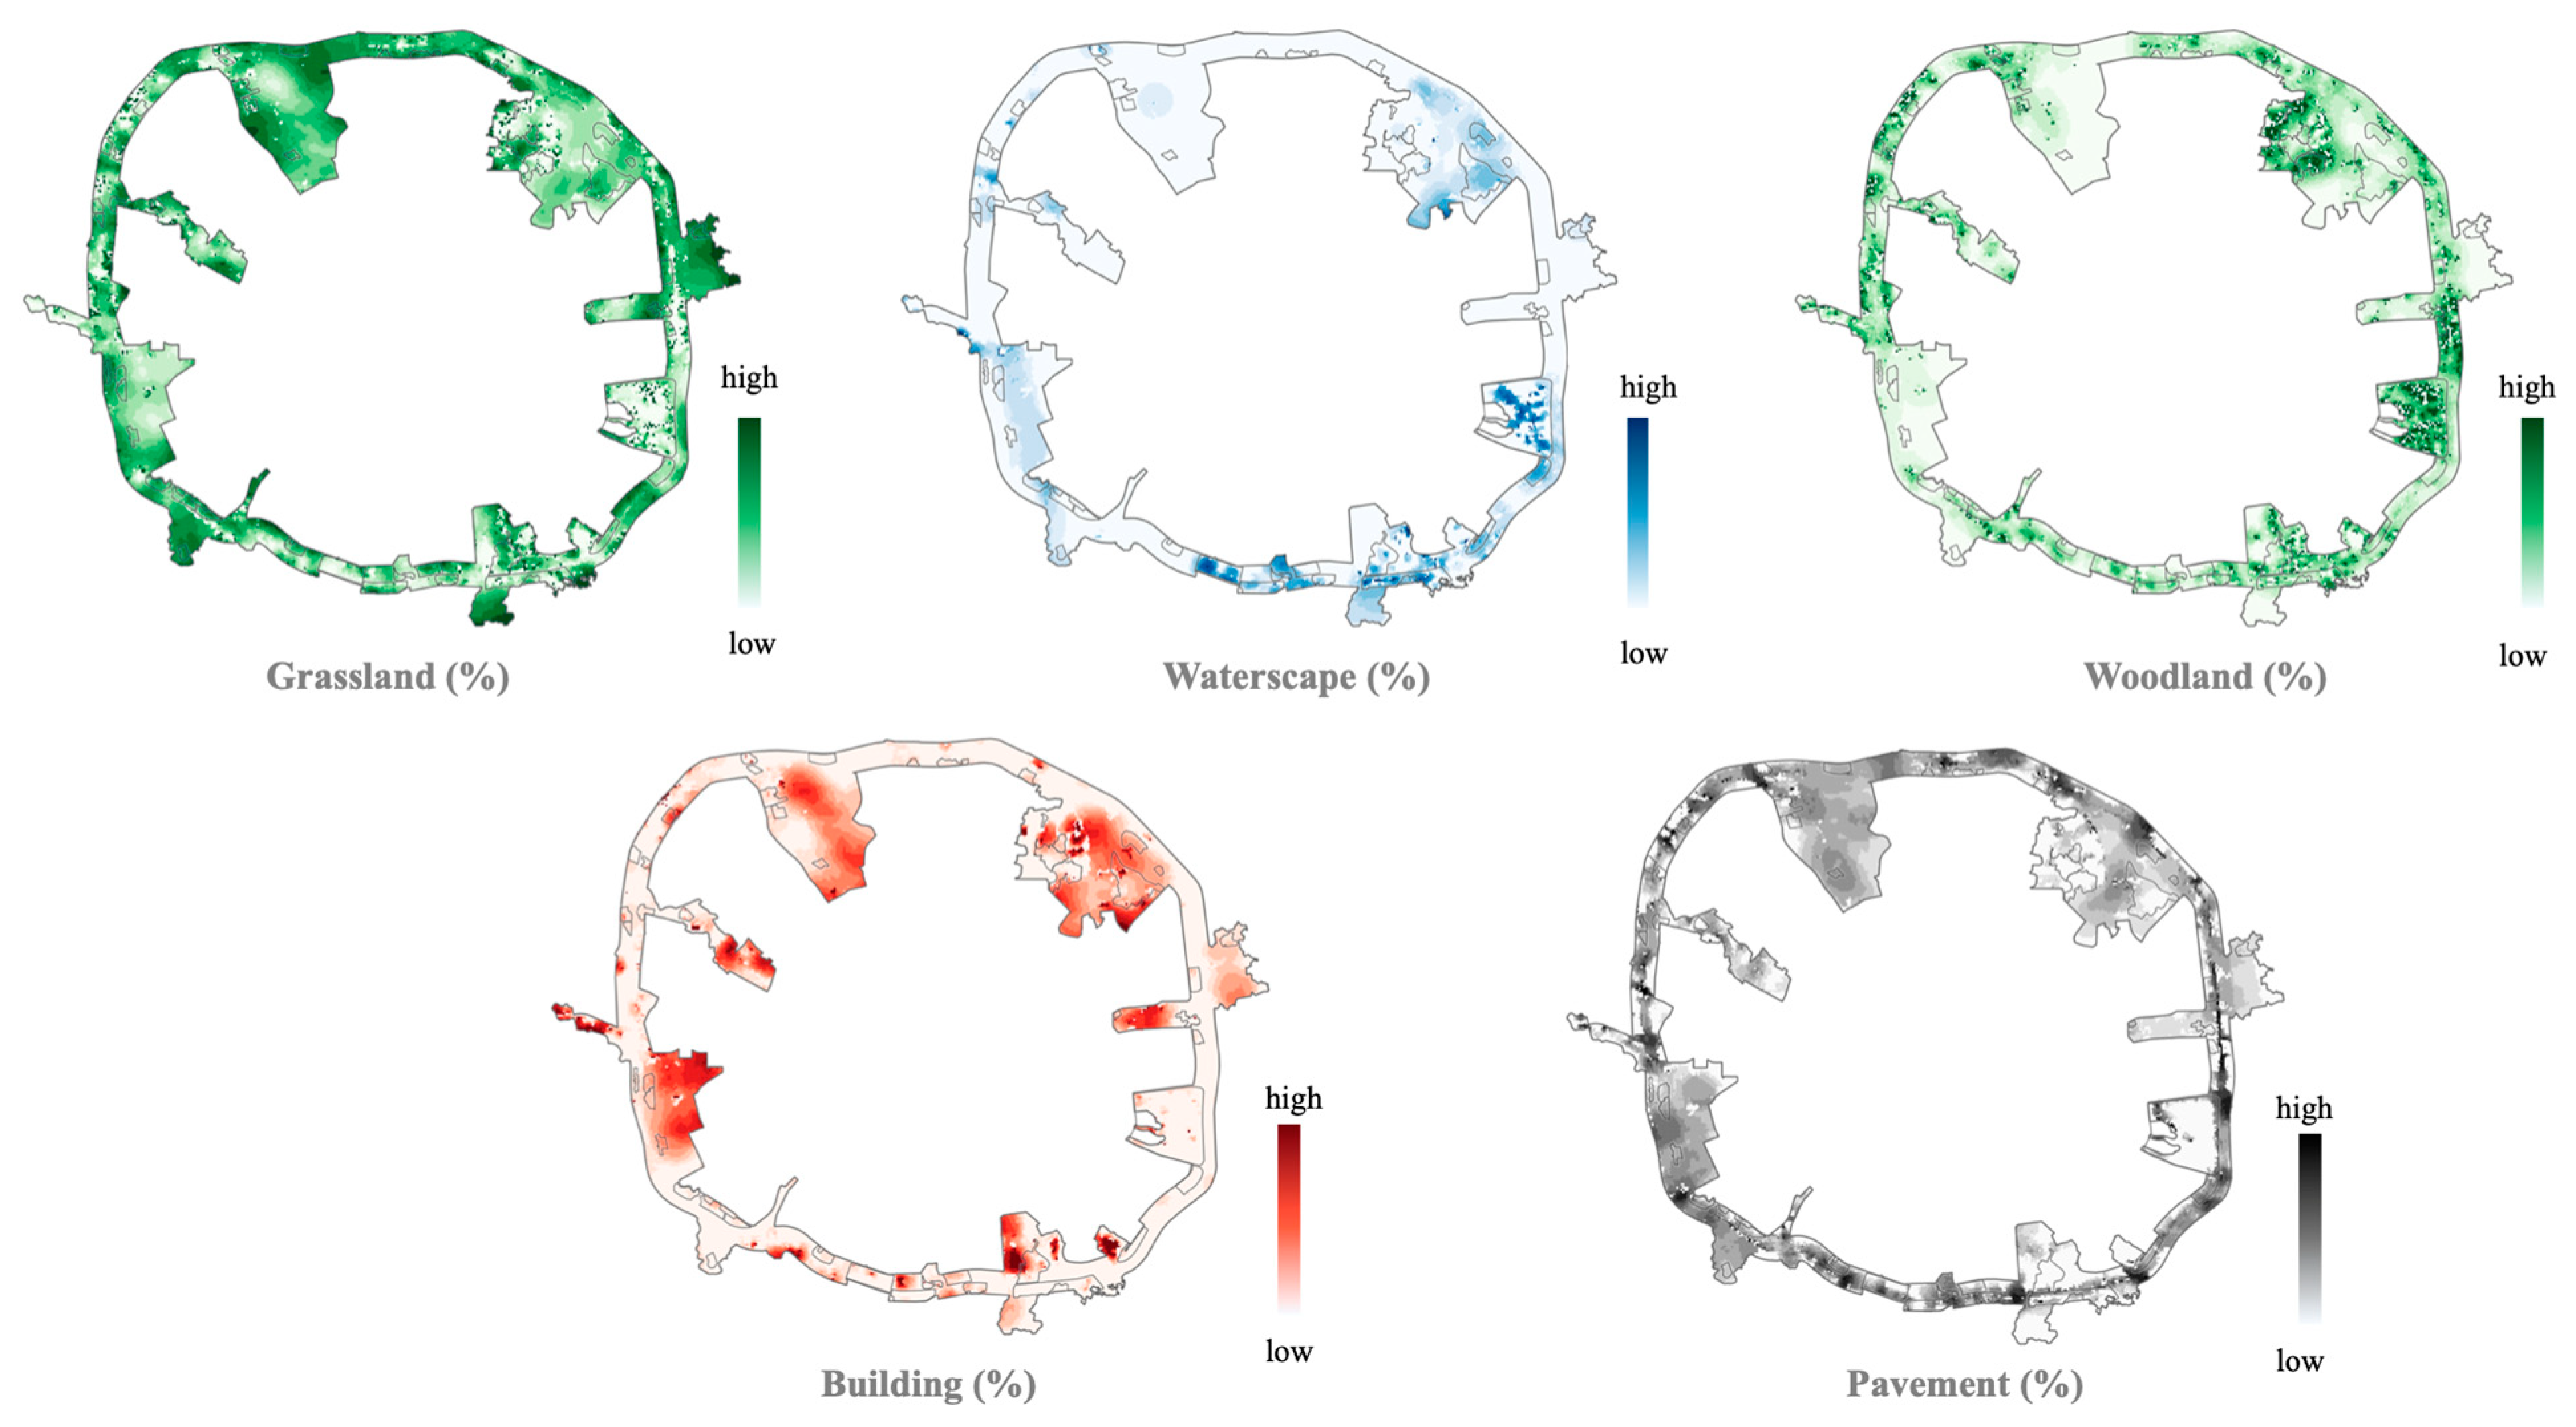
In general, grassland was evenly distributed within the site but had some obvious aggregations in the stretched spaces located at the inner side of the ring road. The distribution of woodland, however, was mostly scattered and showed an opposite trend to that of buildings. Waterscape was primarily observed in the southern part of the site, where the construction process was more advanced. Pavement in the site was composed of roads and trails and was therefore distributed along the ring road and also within the parks on the site (see Figure 6).

Figure 6.
Distribution of major visual landscape elements within the site.
3.2.2. Descriptive Analysis of Sound Pressure Levels
The average sound pressure level at the 25 measurement spots was 77.33 dBA. Twenty-three spots had decibel values exceeding the 70.00 dBA limit requested in the Standard of Sound Environment Quality (GB3096-2008). The sound levels at spots 9 (96.00 dBA) and 13 (90.00 dBA) surpassed 90.00 dBA and that at spot 14 even reached 100.00 dBA. Only three spots—spots 7 (66.00 dBA), 12 (69.00 dBA), and 24 (69.00 dBA)—had sound levels measured slightly lower than the 70 dBA limit. See Table 1 and Figure 7 for details.
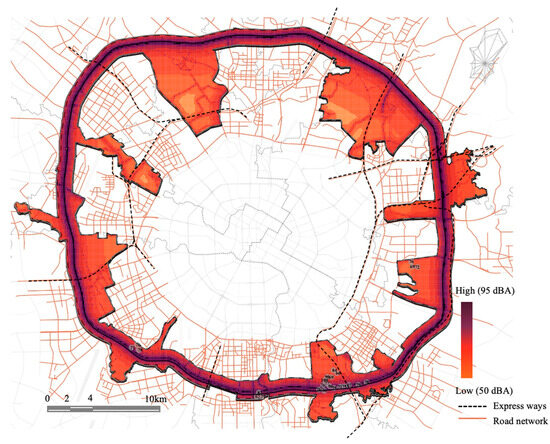
Figure 7.
Sound pressure levels calculated for the site.
The modeling and visualization results suggested that the sound pressure level (above 80.00 dBA) was extremely high within a 150 m range on both sides of the ring road. For the ring road itself, the sound pressure level exceeded 95.00 dBA. Additionally, the sound map clearly showed that the environmental sound pressure level decreased evenly with increasing distance from both sides of the ring road (see Figure 7).
3.2.3. Descriptive Analysis of Functional Vitality
Functional vitality was relatively low at the spot level, with an average of 1.91 (SD = 1.14). Almost all spots were rated lower than 3.00, with the exception of spot 12 (4.00/5.00). The majority were evaluated at 3.00 (nine spots: spots 1, 5, 15–18, 21, 25), followed by 2.00 (five spots: spots 7, 9, 13, 20, 24), and 1.00 (seven spots: spots 2–4, 8, 10, 14, 23). Additionally, three spots—spots 6, 11, and 19—were rated at 0.00 in terms of functional vitality. See Table 1 and Figure 8b.
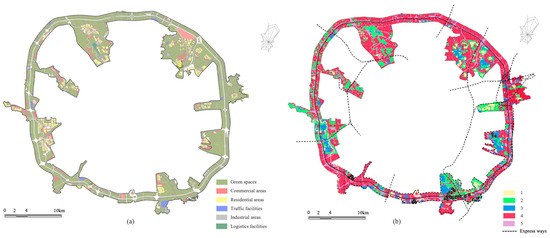
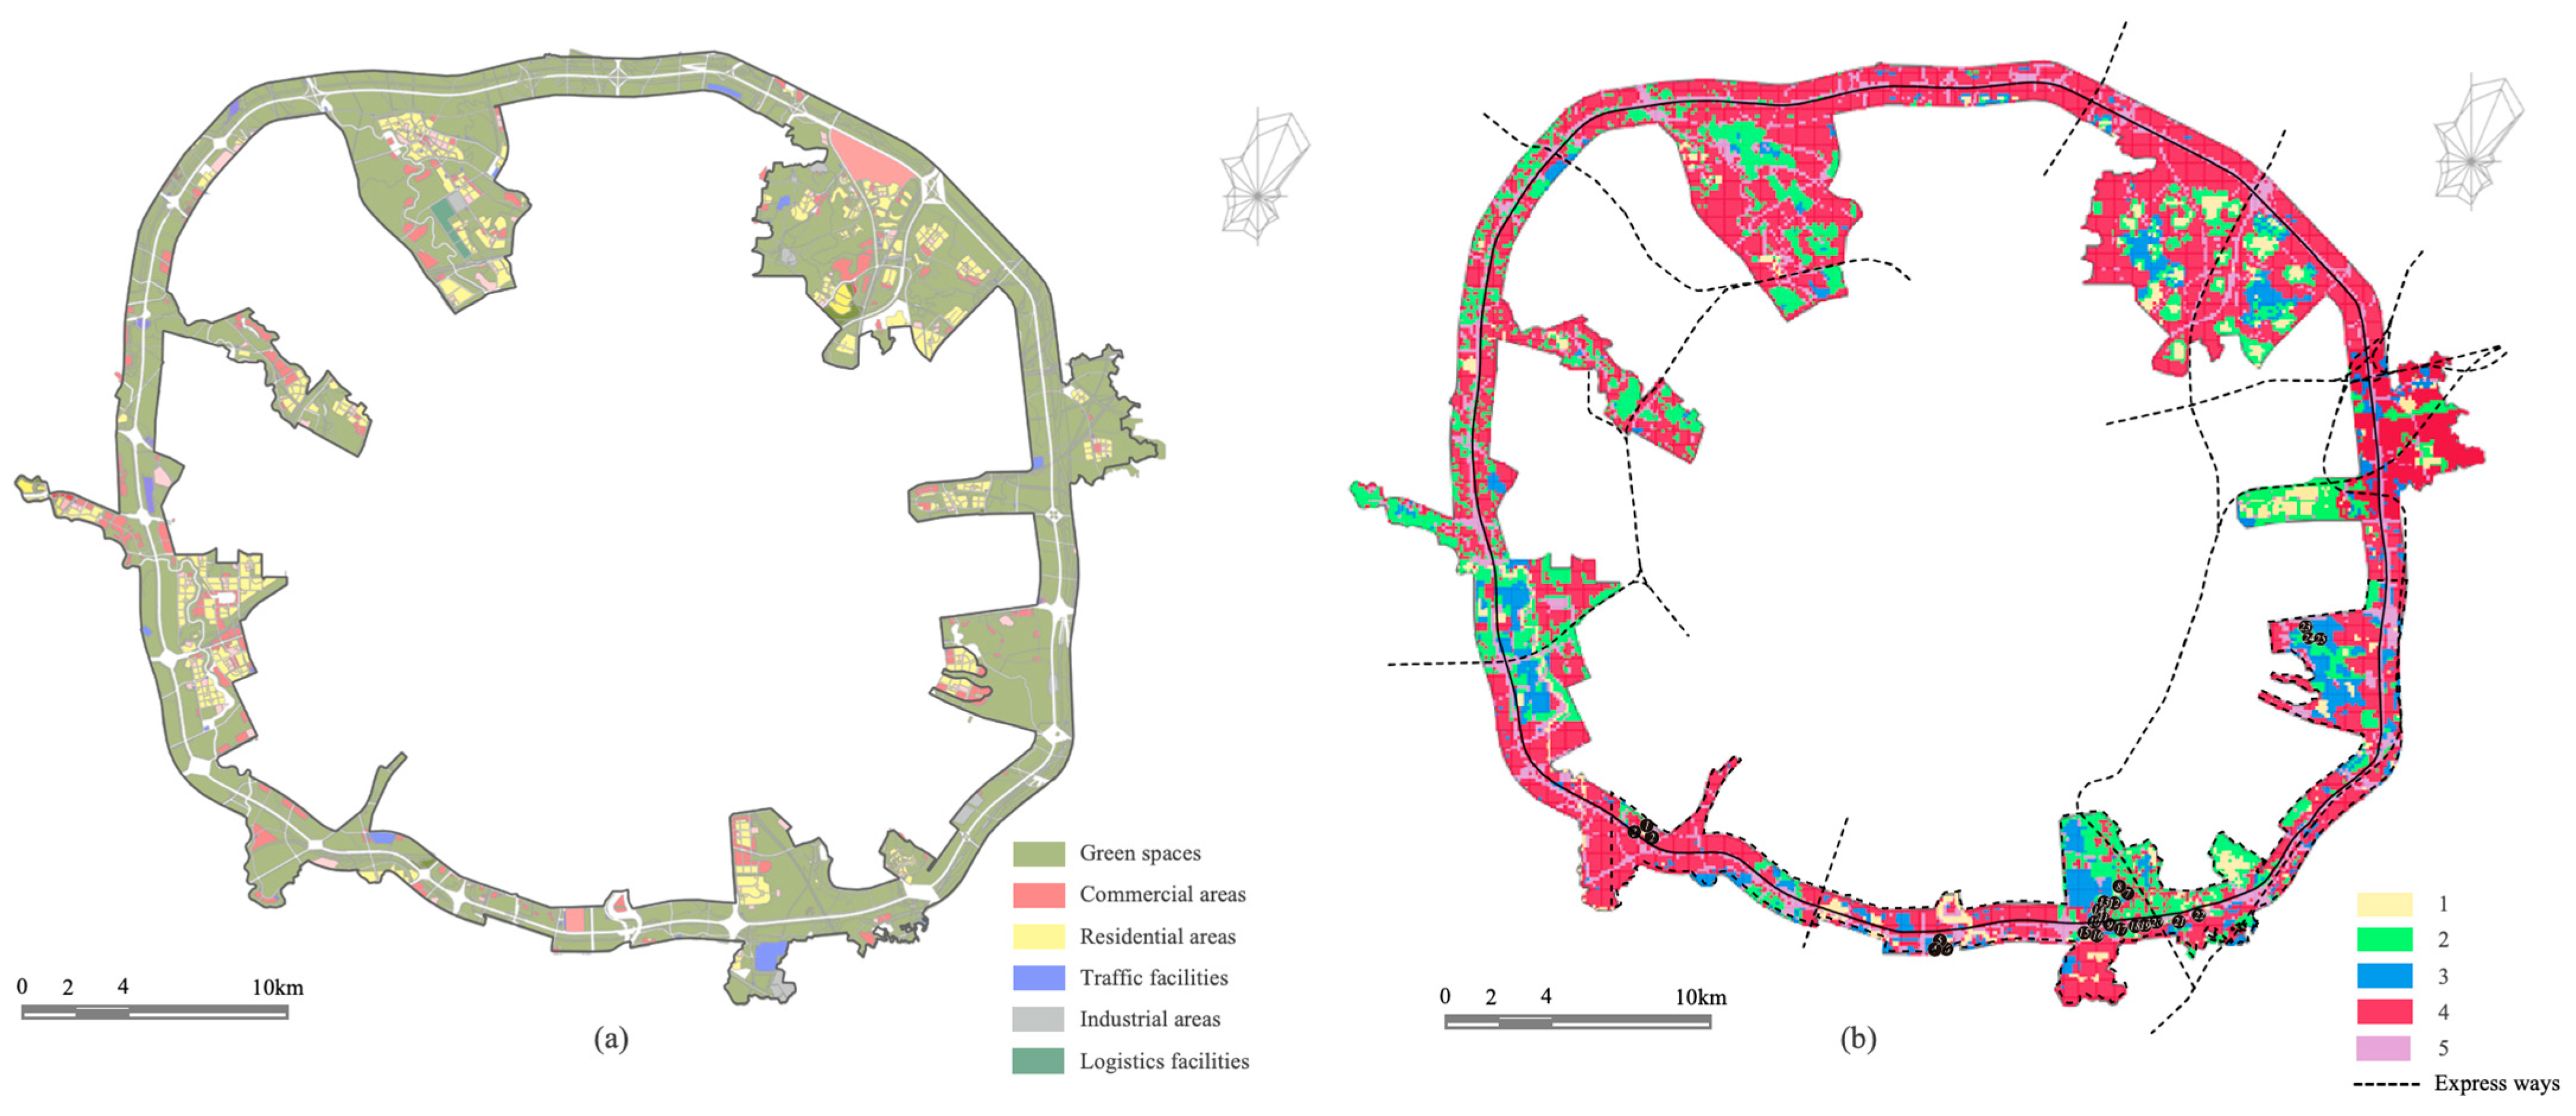
Figure 8.
Land uses (a) and functional vitality (b) of the site.
The functional vitality predicted for the entire site is presented in Figure 8b. The road network was manually given a rating of 5.00 by the researcher to differentiate it from other spaces accessible to people. However, these highest-rated spaces will not be discussed further in the context of developing design and planning implications. Compared with the land uses shown in Figure 8a, functional vitality was relatively high in most green spaces and commercial areas, while lower levels of vitality were primarily observed around residential areas.
3.3. Satisfaction with People’s Perceived Soundscape Predicted by Environmental Characteristics
3.3.1. The Influence of Sound Level Range on People’s Soundscape Satisfaction
Previous evidence suggested that a certain range exists in the relationship between soundscape perception and sound level [50]; when the sound level exceeds that range, the relationship may vary accordingly [51]. Therefore, the sound pressure level was determined as an indicator and also the mediator in this study. To ensure the accuracy of the prediction model, this study first explored the sound level ranges of the site.
Correlational analysis was conducted first on all datasets to confirm that people’s soundscape satisfaction was significantly influenced by sound level (p < 0.01). Afterwards, a scatter plot was used to visually present how people’s soundscape satisfaction changed with sound level. It was quite evident that a negative relationship could be observed when the sound level was lower than 75 dBA. For levels above 75 dBA, there was first a slight increase between 75 and 84 dBA, and then stability was reached when the sound level exceeded 84 dBA (see Figure 9).
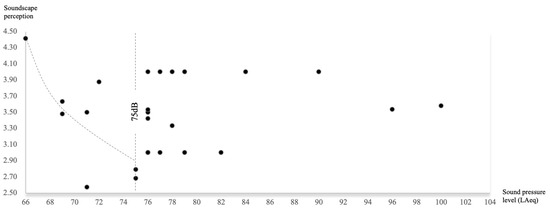
Figure 9.
Scatter plot showing the relationship between overall soundscape perception and sound pressure level.
Correlation analyses were also performed to validate the turning point and found that when the sound level was lower than 75 dBA, a significant negative correlation between sound pressure level and soundscape satisfaction was evident (R = −0.600, p < 0.01). Additionally, the correlation coefficient decreased dramatically when the sound level exceeded this threshold (R = 0.120, p = 0.062 > 0.05). This indicated that when the sound level exceeded 75 dBA in this study, people’s satisfaction with the surrounding soundscape became less predictable. Therefore, under and above 75 dBA were identified as two sound level ranges to carry out the following model construction.
3.3.2. Correlational Analysis between Soundscape Satisfaction and Visual and Aural Indicators
Data from the 25 measurement spots were divided into groups with sound pressure levels above and below 75 dBA. Pearson correlational analysis was then conducted separately for these two groups to identify visual, aural, and functional indicators related to people’s soundscape perceptions in environments with sound pressure levels above and below 75 dBA.
The correlational analysis results indicated that for the dataset with sound pressure levels lower than 75 dBA, people’s satisfaction with the soundscape could be influenced by the visual proportions of waterscape, grassland, buildings, and pavement, as well as the sound pressure level and functional vitality. Among them, the waterscape, buildings, and sound pressure level had positive effects, while the other three factors had negative influences. Fewer influential indicators were found for the group with sound pressure levels above 75 dBA; only grassland was positively related, while woodland, pavement, and functional vitality had negative effects. Only indicators with significant relationships with people’s soundscape satisfaction were included in the regression analysis (see Table 2).
Table 2.
Correlational analysis between soundscape satisfaction and environmental indicators.
3.3.3. Prediction Models of Soundscape Satisfaction
Regression analysis was also conducted, respectively, for the groups with sound levels above and below 75 dBA. Thus, two sets of linear regression models were established.
In the group with sound levels under 75 dBA, five environmental indicators, grassland (p < 0.01), buildings (p < 0.01), pavement (p < 0.01), sound pressure level (p < 0.01), and functional vitality (p < 0.01), were significantly related to people’s satisfaction with their perceived soundscape. A model with an R2 of 0.572 was found as follows:
Correlational analysis results suggested that woodland (p < 0.01), grassland (p < 0.01), pavement (p < 0.01), and functional vitality (p < 0.01) were significantly influential indicators of people’s satisfaction with their perceived soundscape. Thus, the model constructed for the group with sound levels above 75 dBA was (R2 = 0.312):
The estimated coefficient values for all indicators and model-fitting information are listed in Table 3.
Table 3.
Model fit and estimation of B coefficients of the models.
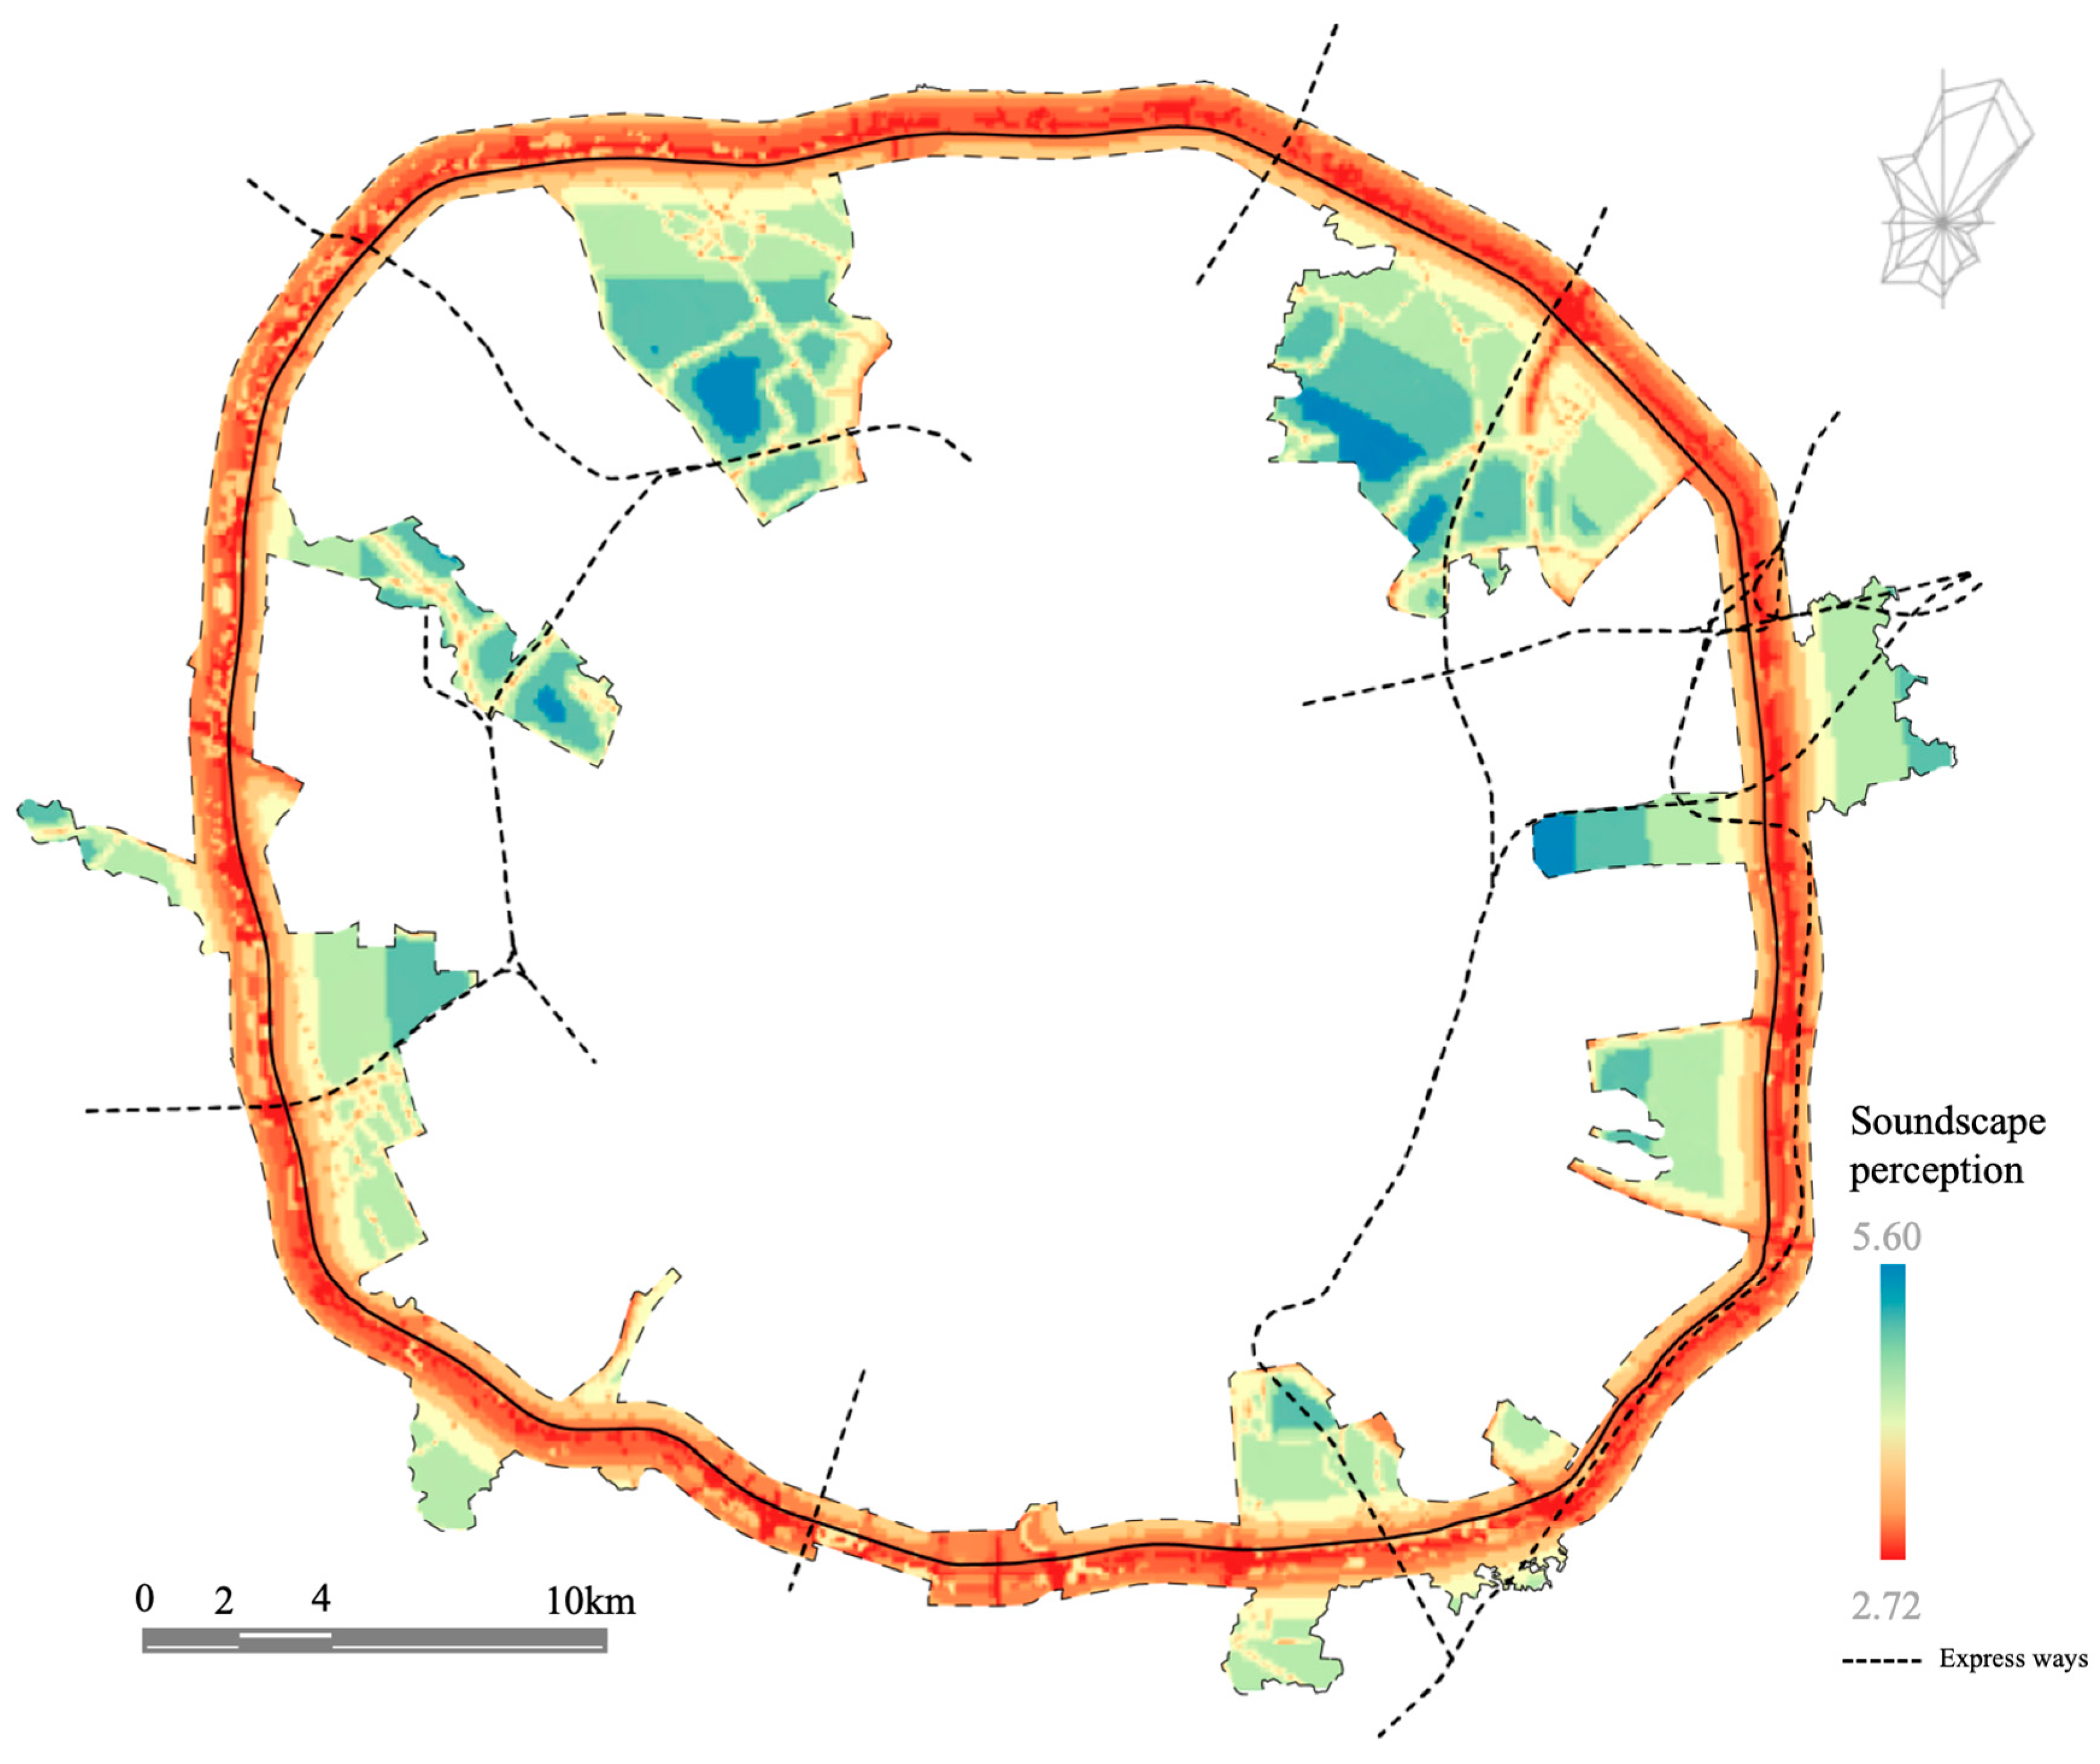
Two sets of models were employed to visually represent people’s satisfaction with the soundscape of the entire site (Figure 10). Compared with site mappings of visual landscape composition, sound pressure level, and functional vitality, the trend in soundscape satisfaction distribution was generally opposite to that of sound pressure level and functional vitality. The lowest level of soundscape satisfaction appeared alongside the ring road, where both the sound level and vitality were extremely high. Soundscape satisfaction increased as the distance from the ring road increased, and it gradually reached its highest level in the spaces stretched outside the ring road. Within the Chengdu Outer Ring Ecological Zone, spaces with higher ratings of soundscape perception also had high percentages of grassland, woodland, waterscape, and buildings (Figure 6, Figure 7, Figure 8, Figure 9 and Figure 10).
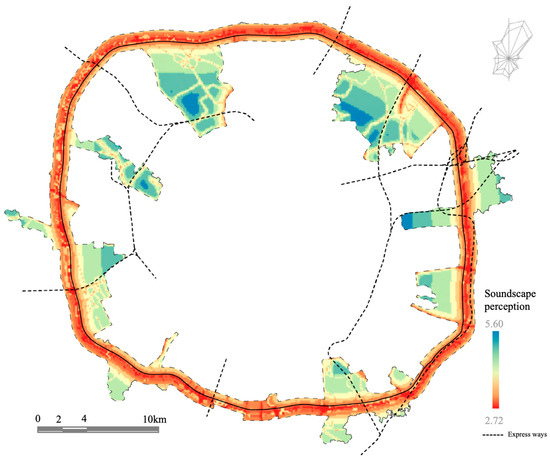
Figure 10.
Soundscape perception map for the Chengdu Outer Ring Ecological Zone.
4. Discussion
4.1. Predicting Large-Scale Soundscape Perceptions Based on Small-Scale Measurements
This study innovatively predicted human soundscape perception in large-scale UGSs. In this study, the prediction of large-scale soundscape perceptions based on small-scale measurements was achieved through three major consecutive steps: (1) collecting visual, aural, and functional characteristics and people’s soundscape satisfaction at the selected measurement spots; (2) building a stochastic model describing the relationships between human subjective perceptions and objective environmental attributes; and (3) collecting environmental information at the site level and inputting it into the stochastic model to predict people’s soundscape satisfaction at the site, which was then visualized as a soundscape perception map.
This approach is expected to save time and effort in conducting sound walks and on-site evaluations. The model for predicting human satisfaction with the soundscape (dependent variable) simply requires quantifiable visual, aural, and functional attributes of the environment as independent variables. With the development of big data and modeling techniques, this environmental information becomes increasingly accessible to professionals, thereby increasing the accuracy and possibility of predicting human perceptions in large-scale urban spaces. A similar mindset was also found in a study assessing the visual comfort of streets at the city scale using artificial intelligence-based image analysis and perceptive evaluation methods [52]. These attempts have made individual perceptions more applicable in large-scale planning and design practices, although small-scale measurements are still needed at the initial model construction stage.
4.2. Applying Soundscape Perception Models and Maps in UGS Planning and Design
To provide cues for regulating planning and design, the soundscape satisfaction map should be considered in conjunction with sets of maps presenting the visual landscape, sound pressure levels, and functional vitality of the Chengdu Outer Ring Ecological Zone. The results suggested that strong planning and design interventions should be introduced within a 300 m range along both sides of the ring road. Tracing back to the distribution of visual, aural, and functional characteristics, a decrease in environmental sound level was particularly important for improving people’s satisfaction. Given that the ring road serves essential traffic functions, controlling traffic flow is unrealistic. Thus, planning regulations should consider adjustments in land use. For example, residential land use and educational facilities should be planned as far away from the ring road as possible, and ecological green spaces that are inaccessible to people can serve as buffer zones [53] between them. Urban parks open to the public should not be planned too close to the ring road, if possible, while commercial and industrial lands can be prioritized in areas closer to the ring road. In addition to planning considerations, physical noise reduction methods such as acoustic shields [54] and noise-absorbing materials [55] should be encouraged along the ring road. In terms of the visual landscape, natural elements have long been confirmed to have positive effects on human soundscape satisfaction [56], which was also consistent with the distribution of grassland, waterscape, and woodland at the site. Spaces with high levels of satisfaction also featured a high percentage of buildings, possibly because high-rise buildings can obstruct people’s view of noise sources [57]. Furthermore, a medium level of functional vitality should be encouraged to maintain people’s satisfaction with soundscapes, which can also be modified through land use and visual landscape characteristics.
Therefore, it can be concluded that improving soundscape perception in large-scale UGSs requires an integrated approach from both planning and design perspectives. The application of this approach should also be considered in conjunction with spatial functions. Planning regulations for land use may include: (1) setting green buffers between noise sources and vulnerable areas (i.e., residential areas, educational facilities, and urban parks) that have low levels of sound tolerance; (2) placing land uses with high tolerance, such as traffic, industrial, and commercial functions, close to noise sources; and (3) identifying and preserving areas with special visual and acoustic characteristics. Design instructions may include: (1) using sound shields around traffic facilities; (2) utilizing natural landscapes to distract people’s attention from noise and block their sight from the source of noise; and (3) introducing positive sounds (e.g., tree murmuring, bird chirping, and fish diving) [56,57].
4.3. Limitations
Although this study successfully predicted people’s satisfaction with the soundscape across the entire site of the Chengdu Outer Ring Ecological Zone, it had limitations regarding the experimental design and data analysis. First, the measurement spots were primarily selected in the built southern part of the site, as the northern area was mostly under construction when the study was conducted. The model should be further refined with additional information from the northern side before implementation. Second, this study recruited only university students for the on-site soundscape perception survey to ensure all subjects had good vision and hearing and also to prevent potential perceptive differences induced by demographic variations. However, the unified background of the participants may have limited the comprehensiveness of the research results. In addition, participants’ responses may also have been influenced by the high outdoor temperature (27 °C–30 °C), since the sound walk was carried out in early summer [58].
As for data analysis, the visual landscape composition of some spots was less than 100%. This was because some areas near the selected measurement spots were still under construction and they were largely mud lands protected with fence screens. These areas were eliminated in the visibility calculation since they were only temporary. In addition, the functional vitality and sound pressure levels of the site were not directly measured but were calculated based on other environmental information. Therefore, the predicted soundscape satisfaction was actually the result of two rounds of predictions and calculations, which might have weakened the accuracy of the established model and increased the complexity of applying this approach in practice. Also, the sound level of the site was estimated mainly based on traffic noise due to the realistic difficulty of on-site measurements. Although influences may exist, the dominancy of traffic sounds in constituting the overall acoustic environment supports this estimation being reasonable to some extent. Moreover, differences in the order of magnitude of the indicators may have slightly influenced the correlation and modeling results, even though standardization was applied.
Lastly, there may be limitations in the application of the research findings. The soundscape perception map provides no direct relationship between human satisfaction and physical planning and design features. Therefore, it needs to be used in conjunction with maps of sound pressure level, functional vitality, and visual landscape distribution as part of a comprehensive soundscape evaluation. Future studies should continue to explore ways to refine the collection and visualization of large-scale physical and perceptive data into a more systematic tool so as to increase its efficiency and broaden the contexts of its application.
5. Conclusions
Soundscape perception is essential in human-oriented multi-sensory landscape planning and design. However, it has obvious limitations in planning and design practices due to the high relevance of individual perceptions. This study aimed to predict human soundscape perception in large-scale UGSs based on environmental visual, aural, and functional characteristics through cross-level measurements, analyses, and model construction. Two innovative steps were carried out to achieve this aim. First, a stochastic model was constructed based on subjective soundscape perceptions and objective environmental visual and aural attributes. Although the data were collected at the measurement spot level, the relationships disclosed and the model established to present these relationships can be adopted in similar settings. The second innovation lies in utilizing the model for prediction by inputting objective environmental information collected at the site scale so that soundscape perception results can be estimated for the site. This approach not only manages to bridge subjective human perceptions and objective environmental characteristics, but it also offers insight for applying individual-scale landscape perceptions and experiences to instruct large-scale landscape planning and design. The research findings imply that both human soundscape perception and physical attributes should collectively inform the implementation of regulations and interventions to improve the soundscapes of UGSs. The perception and characteristic results are especially helpful when they are visually presented as a set of distribution maps. Nevertheless, future explorations are necessary to further clarify which planning regulations and design interventions should be introduced for each perception area. The outcome of this study, along with future relevant research, is expected to introduce a more human-oriented perspective into soundscape planning and design practices. It will also contribute to broadening the scope of human perceptual studies conducted in large-scale city spaces.
Author Contributions
Conceptualization, Y.Y., Y.H., L.J. and Y.S.; methodology, Y.Y., L.J. and Y.S.; software, H.L. and Y.Y.; validation, Y.Y. and Y.H.; formal analysis, Y.Y., H.L. and Y.S.; investigation, H.L. and Y.Y.; resources, Y.S. and Y.H.; data curation, Y.Y. and Y.H.; writing—original draft preparation, Y.Y.; writing—review and editing, Y.Y., L.J. and Y.S.; visualization, H.L.; supervision, Y.S.; project administration, Y.S.; funding acquisition, Y.Y. and Y.S. All authors have read and agreed to the published version of the manuscript.
Funding
This research was funded by the Ministry of Science and Technology, High-end Foreign Experts Introduction Plan, Restorative Urban Landscape Theory, Method and Practice (G2022133023L); the Restorative Urbanism Research Center (RURC), Joint Laboratory for International Cooperation on Eco-Urban Design, Tongji University (CAUP-UD-06); the Shanghai Key Laboratory of Urban Design and Urban Science, NYU Shanghai Open Topic Grants (Grant No. 2022YTYin_LOUD); and the Shanghai Post-doctoral Excellence Program (2021357).
Institutional Review Board Statement
The study was conducted in accordance with the Declaration of Helsinki and approved by the Ethics Committee of Tongji University (protocol code 2020tjdx075 and date of approval 09/11/2020).
Informed Consent Statement
Informed consent was obtained from all subjects involved in the study.
Data Availability Statement
The data presented in this study are available upon request from the corresponding author. The data are not publicly available due to the confidentiality of participants’ information.
Conflicts of Interest
The authors declare no conflict of interest.
References
- 12913-1; I. Acoustics–Soundscape–Part 1: Definition and Conceptual Framework. Technical Report. International Organization for Standardization: Geneva, Switzerland, 2014.
- Raimbault, M.; Dubois, D. Urban soundscapes: Experiences and knowledge. Cities 2005, 22, 339–350. [Google Scholar] [CrossRef]
- Axelsson, Ö.; Nilsson, M.; Berglund, B. A principal components model of soundscape perception. J. Acoust. Soc. Am. 2010, 128, 2836–2846. [Google Scholar] [CrossRef]
- Cain, R.; Jennings, P.; Poxon, J. The development and application of the emotional dimensions of a soundscape. Appl. Acoust. 2013, 74, 232–239. [Google Scholar] [CrossRef]
- Aletta, F.; Axelsson, Ö.; Kang, J. Towards acoustic indicators for soundscape design. In Proceedings of the Forum Acusticum 2014 Conference, Kraków, Poland, 7–12 September 2014. [Google Scholar]
- Davies, W.J.; Adams, M.D.; Bruce, N.S.; Cain, R.; Carlyle, A.; Cusack, P.; Hall, D.A.; Hume, K.I.; Irwin, A.; Jennings, P. Perception of soundscapes: An interdisciplinary approach. Appl. Acoust. 2013, 74, 224–231. [Google Scholar] [CrossRef]
- ISO/TS 12913-2; 2018−Soundscape–Part 2: Data Collection and Reporting Requirements–What’s It all About. International Organization for Standardization: Geneva, Switzerland, 2018; pp. 55–57.
- Zhang, H.; Qiu, M.; Li, L.; Lu, Y.; Zhang, J. Exploring the dimensions of everyday soundscapes perception in spatiotemporal view: A qualitative approach. Appl. Acoust. 2021, 181, 108149. [Google Scholar] [CrossRef]
- Cao, J.; Kang, J. A Perceptual Structure of Soundscapes in Urban Public Spaces Using Semantic Coding Based on the Grounded Theory. Int. J. Environ. Res. Public Health 2023, 20, 2932. [Google Scholar] [CrossRef] [PubMed]
- Moreira, N.M.; Bryan, M. Noise annoyance susceptibility. J. Sound Vib. 1972, 21, 449–462. [Google Scholar] [CrossRef]
- Li, Z.; Kang, J. Sensitivity analysis of changes in human physiological indicators observed in soundscapes. Landsc. Urban Plan. 2019, 190, 103593. [Google Scholar] [CrossRef]
- Paiva, K.; Cardoso, M.-R.; Rodrigues, R. Noise pollution and annoyance: An urban soundscapes study. Noise Health 2015, 17, 125–133. [Google Scholar] [CrossRef]
- Navickas, E. Urban Soundscape: The Relationship between Sound Source Dominance and Perceptual Attributes along with Sound Pressure Levels; University of Groningen: Groningen, The Netherlands, 2020. [Google Scholar]
- Lavandier, C.; Defréville, B. The contribution of sound source characteristics in the assessment of urban soundscapes. Acta Acust. United Acust. 2006, 92, 912–921. [Google Scholar]
- Schultz, T.J. Synthesis of social surveys on noise annoyance. J. Acoust. Soc. Am. 1978, 64, 377–405. [Google Scholar] [CrossRef] [PubMed]
- Liu, J.; Kang, J. Soundscape design in city parks: Exploring the relationships between soundscape composition parameters and physical and psychoacoustic parameters. J. Environ. Eng. Landsc. Manag. 2015, 23, 102–112. [Google Scholar] [CrossRef]
- Yilmazer, S.; Davies, P.; Yilmazer, C. A virtual reality tool to aid in soundscapes in the built environment (SiBE) through machine learning. In Proceedings of the INTER-NOISE and NOISE-CON Congress and Conference Proceedings, Glasgow, Scotland, 20–23 August 2023; pp. 737–747. [Google Scholar]
- Sudarsono, A.S.; Lam, Y.W.; Davies, W.J. The validation of acoustic environment simulator to determine the relationship between sound objects and soundscape. Acta Acust. United Acust. 2017, 103, 657–667. [Google Scholar] [CrossRef]
- Moors, A.; Ellsworth, P.C.; Scherer, K.R.; Frijda, N.H. Appraisal theories of emotion: State of the art and future development. Emot. Rev. 2013, 5, 119–124. [Google Scholar] [CrossRef]
- Ode, Å.; Fry, G.; Tveit, M.S.; Messager, P.; Miller, D. Indicators of perceived naturalness as drivers of landscape preference. J. Environ. Manag. 2009, 90, 375–383. [Google Scholar] [CrossRef]
- Luo, J.; Zhao, T.; Cao, L.; Biljecki, F. Water View Imagery: Perception and evaluation of urban waterscapes worldwide. Ecol. Indic. 2022, 145, 109615. [Google Scholar] [CrossRef]
- Palmer, S.E.; Schloss, K.B.; Sammartino, J. Visual aesthetics and human preference. Annu. Rev. Psychol. 2013, 64, 77–107. [Google Scholar] [CrossRef]
- Weitkamp, G.; Bregt, A.; Van Lammeren, R. Measuring visible space to assess landscape openness. Landsc. Res. 2011, 36, 127–150. [Google Scholar] [CrossRef]
- Grahn, P.; Stigsdotter, U.K. The relation between perceived sensory dimensions of urban green space and stress restoration. Landsc. Urban Plan. 2010, 94, 264–275. [Google Scholar] [CrossRef]
- Yin, Y.; Shao, Y.; Meng, Y.; Hao, Y. The effects of the natural visual-aural attributes of urban green spaces on human behavior and emotional response. Front. Psychol. 2023, 14, 1186806. [Google Scholar] [CrossRef] [PubMed]
- Kim, S.-O.; Shelby, B. Effects of soundscapes on perceived crowding and encounter norms. Environ. Manag. 2011, 48, 89–97. [Google Scholar] [CrossRef] [PubMed]
- Herranz-Pascual, K.; García, I.; Diez, I.; Santander, A.; Aspuru, I. Analysis of field data to describe the effect of context (Acoustic and Non-Acoustic Factors) on urban soundscapes. Appl. Sci. 2017, 7, 173. [Google Scholar] [CrossRef]
- Liu, Y.; Hu, M.; Zhao, B. Audio-visual interactive evaluation of the forest landscape based on eye-tracking experiments. Landsc Urban Plan 2019, 46, 126476. [Google Scholar] [CrossRef]
- Peschardt, K.K.; Stigsdotter, U.K.; Schipperrijn, J. Identifying features of pocket parks that may be related to health promoting use. Landsc. Res. 2016, 41, 79–94. [Google Scholar] [CrossRef]
- Wang, R.; Jiang, W.; Lu, T. Landscape characteristics of university campus in relation to aesthetic quality and recreational preference. Urban For. Urban Green. 2021, 66, 127389. [Google Scholar] [CrossRef]
- Khachatryan, H.; Rihn, A.; Hansen, G.; Clem, T. Landscape aesthetics and maintenance perceptions: Assessing the relationship between homeowners’ visual attention and landscape care knowledge. Land Use Policy 2020, 95, 104645. [Google Scholar] [CrossRef]
- Zube, E.H.; Sell, J.L.; Taylor, J.G. Landscape perception: Research, application and theory. Landsc. Plan. 1982, 9, 1–33. [Google Scholar] [CrossRef]
- Liu, F.; Kang, J. Relationship between street scale and subjective assessment of audio-visual environment comfort based on 3D virtual reality and dual-channel acoustic tests. Build. Environ. 2018, 129, 35–45. [Google Scholar] [CrossRef]
- Wang, X. Research on spatial acoustic landscape optimization of green spaces in street parks. Build. Environ. 2014, 169, 106544. [Google Scholar] [CrossRef]
- Brambilla, G.; Gallo, V.; Asdrubali, F.; D’Alessandro, F. The perceived quality of soundscape in three urban parks in Rome. J. Acoust. Soc. Am. 2013, 134, 832–839. [Google Scholar] [CrossRef]
- Liu, J.; Kang, J.; Luo, T.; Behm, H. Landscape effects on soundscape experience in city parks. Sci. Total Environ. 2013, 454, 474–481. [Google Scholar] [CrossRef] [PubMed]
- Liu, J.; Yang, L.; Xiong, Y.; Yang, Y. Effects of soundscape perception on visiting experience in a renovated historical block. Build. Environ. 2019, 165, 106375. [Google Scholar] [CrossRef]
- Gidlöf-Gunnarsson, A.; Öhrström, E. Noise and well-being in urban residential environments: The potential role of perceived availability to nearby green areas. Landsc. Urban Plan. 2007, 83, 115–126. [Google Scholar] [CrossRef]
- Jo, H.I.; Jeon, J.Y. Effect of the appropriateness of sound environment on urban soundscape assessment. Build. Environ. 2020, 179, 106975. [Google Scholar] [CrossRef]
- Yu, L.; Kang, J. Modeling subjective evaluation of soundscape quality in urban open spaces: An artificial neural network approach. J. Acoust. Soc. Am. 2009, 126, 1163–1174. [Google Scholar] [CrossRef]
- Schirpke, U.; Tappeiner, G.; Tasser, E.; Tappeiner, U. Using conjoint analysis to gain deeper insights into aesthetic landscape preferences. Ecol. Indic. 2019, 96, 202–212. [Google Scholar] [CrossRef]
- Lindeberg, T. Scale-space theory: A basic tool for analyzing structures at different scales. J. Appl. Stat. 1994, 21, 225–270. [Google Scholar] [CrossRef]
- Nilsson, M.; Botteldooren, D.; De Coensel, B. Acoustic indicators of soundscape quality and noise annoyance in outdoor urban areas. In Proceedings of the 19th International Congress on Acoustics, Madrid, Spain, 2–7 September 2007. [Google Scholar]
- Song, X.; Lv, X.; Yu, D.; Wu, Q. Spatial-temporal change analysis of plant soundscapes and their design methods. Urban For. Urban Green. 2018, 29, 96–105. [Google Scholar] [CrossRef]
- Gulliver, J.; Morley, D.; Vienneau, D.; Fabbri, F.; Bell, M.; Goodman, P.; Beevers, S.; Dajnak, D.; Kelly, F.J.; Fecht, D. Development of an open-source road traffic noise model for exposure assessment. Environ. Model. Softw. 2015, 74, 183–193. [Google Scholar] [CrossRef]
- Gehl, J. A changing street life in a changing society. Places 1989, 6, 8–17. [Google Scholar]
- Li, Q.; Cui, C.; Liu, F.; Wu, Q.; Run, Y.; Han, Z. Multidimensional urban vitality on streets: Spatial patterns and influence factor identification using multisource urban data. ISPRS Int. J. Geo-Inf. 2021, 11, 2. [Google Scholar] [CrossRef]
- Meng, Y.; Xing, H. Exploring the relationship between landscape characteristics and urban vibrancy: A case study using morphology and review data. Cities 2019, 95, 102389. [Google Scholar] [CrossRef]
- Yang, W.; Kang, J. Acoustic comfort evaluation in urban open public spaces. Appl. Acoust. 2005, 66, 211–229. [Google Scholar] [CrossRef]
- Wang, X. Research on Optimization of Sound Landscape of Green Space in Street Park; Tianjin University: Tianjin China, 2014. [Google Scholar]
- Shao, Y.; Yin, Y.; Xue, Z.; Ma, D. Assessing and Comparing the Visual Comfort of Streets across Four Chinese Megacities Using AI-Based Image Analysis and the Perceptive Evaluation Method. Land 2023, 12, 834. [Google Scholar] [CrossRef]
- Wen, X.; Lu, G.; Lv, K.; Jin, M.; Shi, X.; Lu, F.; Zhao, D. Impacts of traffic noise on roadside secondary schools in a prototype large Chinese city. Appl. Acoust. 2019, 151, 153–163. [Google Scholar] [CrossRef]
- Van Renterghem, T.; Botteldooren, D. On the choice between walls and berms for road traffic noise shielding including wind effects. Landsc. Urban Plan. 2012, 105, 199–210. [Google Scholar] [CrossRef]
- Bendtsen, H. Noise Barrier Design: Danish and Some European Examples; University of California Pavement Research Center: Davis, CA, USA, 2010. [Google Scholar]
- Jo, H.I.; Jeon, J.Y. Overall environmental assessment in urban parks: Modelling audio-visual interaction with a structural equation model based on soundscape and landscape indices. Build. Environ. 2021, 204, 108166. [Google Scholar] [CrossRef]
- Tan, J.K.A.; Hasegawa, Y.; Lau, S.-K.; Tang, S.-K. The effects of visual landscape and traffic type on soundscape perception in high-rise residential estates of an urban city. Appl. Acoust. 2022, 189, 108580. [Google Scholar] [CrossRef]
- Brown, A.L. Soundscape planning as a complement to environmental noise management. In Proceedings of the Inter-Noise and NOISE-CON Congress and Conference Proceedings, Melbourne, Australia, 16–19 November 2014; pp. 5894–5903. [Google Scholar]
- Guan, H.; Hu, S.; Lu, M.; He, M.; Mao, Z.; Liu, G. People’s subjective and physiological responses to the combined thermal-acoustic environments. Build. Environ. 2020, 172, 106709. [Google Scholar] [CrossRef]


Disclaimer/Publisher’s Note: The statements, opinions and data contained in all publications are solely those of the individual author(s) and contributor(s) and not of MDPI and/or the editor(s). MDPI and/or the editor(s) disclaim responsibility for any injury to people or property resulting from any ideas, methods, instructions or products referred to in the content. |
© 2023 by the authors. Licensee MDPI, Basel, Switzerland. This article is an open access article distributed under the terms and conditions of the Creative Commons Attribution (CC BY) license (https://creativecommons.org/licenses/by/4.0/).