Article

Optimizing a Regional White Spruce Tree Improvement Program: SNP Genotyping for Enhanced Breeding Values, Genetic Diversity Assessment, and Estimation of Pollen Contamination

1
Department of Renewable Resources, University of Alberta, 442 Earth Sciences Building, Edmonton, AB T6G 2E3, Canada
2
Centro de Investigación en Recursos Naturales, Instituto de Recursos Biológicos, Instituto Nacional de Tecnología Agropecuaria (INTA), Hurlingham, Buenos Aires, Argentina
3
Consejo Nacional de Investigaciones Científicas y Técnicas (CONICET), Buenos Aires, Argentina
4
Department of Wood and Forest Sciences and Forest Research Centre, Université Laval, Quebec City, QC G1V 0A6, Canada
*
Author to whom correspondence should be addressed.
Current address: Department of Forestry, Mississippi State University, 775 Stone Blvd, 351 Thompson Hall, Mississippi State, MS 39762-9681, USA.
Forests 2023, 14(11), 2212; https://doi.org/10.3390/f14112212
Submission received: 20 September 2023 / Revised: 4 November 2023 / Accepted: 6 November 2023 / Published: 8 November 2023
(This article belongs to the Special Issue Molecular Markers in Forest Management and Tree Breeding)

Abstract

:
The utilization of genotyping has gained significant popularity in tree improvement programs, aiding in enhancing the precision of breeding values, removing pedigree errors, the assessment of genetic diversity, and evaluating pollen contamination. Our study explores the impact of utilizing 5308 SNP markers to genotype seed orchard parents (166), progeny in progeny trials (667), and seedlot orchard seedlings (780), to simultaneously enhance variance components, breeding values, genetic diversity estimates, and pollen flow in the Region I white spruce (Picea glauca) breeding program in central Alberta (Canada). We compared different individual tree mixed models, including pedigree-based (ABLUP), genomic-based (GBLUP), and single-step pedigree-genomic-based (ssGBLUP) models, to estimate variance components and predict breeding values for the height and diameter at breast height traits. The highest heritability estimates were achieved using the ssGBLUP approach, resulting in improved breeding value accuracy compared to the ABLUP and GBLUP models for the studied growth traits. In the six orchard seedlots tested, the genetic diversity of the seedlings remained stable, characterized by an average of approximately 2.00 alleles per SNP, a Shannon Index of approximately 0.44, and an expected and observed heterozygosity of approximately 0.29. The pedigree reconstruction of seed orchard seedlings successfully identified consistent parental contributions and equal genotype contributions in different years. Pollen contamination levels varied between 11% and 70% using SNP markers and 8% to 81% using pollen traps, with traps both over- and under-estimating contamination. Overall, integrating genomic information from parents and offspring empowers forest geneticists and breeders in the Region I white spruce breeding program to correct errors, conduct backward and forward selections with greater precision, gain a deeper understanding of the orchard’s genetic structure, select superior seedlots, and accurately estimate the genetic worth of each orchard lot, which can ultimately result in increased and more precise estimates of genetic gain in the studied growth traits.

1. Introduction

Genotyping is an increasingly popular tool in tree improvement programs and can be used for several purposes, including the improvement of breeding values, providing accurate estimates of genetic diversity and pollen contamination, correcting pedigree errors, and advancing approaches such as genome-wide association studies (GWAS) [1] and genomic selection (GS) [2].
Breeding values (BVs) have traditionally been calculated by measuring trees in progeny trials to rank parents and offspring in a tree improvement program. This approach is conducted using an individual tree (animal) model [3] and the pedigree-based additive relationship matrix (A-matrix) [4], generating the so-called Pedigree Best Linear Unbiased Predictors (ABLUP). However, the incorporation of genomic information in quantitative genetics analyses has shown significant improvements in the estimated genetic parameters [5] and predicted BV accuracies of individuals and parents [6], especially in open-pollinated (OP) families [7].
In recent years, the Genomic Best Linear Unbiased Predictors (GBLUP) approach, through the incorporation of the marker-based realized kinship matrix (G-matrix) [8] computed from genotyped individuals, has been improved using the single-step GBLUP (ssGBLUP) method [9,10,11]. This single-step method has demonstrated its usefulness in predicting BVs through the simultaneous use of phenotypes, genotypes, and pedigree from the entire breeding program, providing better estimates than the ABLUP method. The ssGBLUP method has also been used in the GS of forest trees, demonstrating its effectiveness in improving the precision of estimated genetic parameters and the accuracy of predicted BVs. This improvement in precision is particularly evident in traits with low heritability and during the early stages of a breeding program [12,13,14,15] but also in large-scale breeding programs, characterized by complex pedigrees spanning multiple generations and extensive datasets [16]. In an open-pollinated population of Picea glauca (Moench) Voss, Ratcliffe (2017) [14] showed the effectiveness of ssGBLUP in reducing the known bias in heritability estimates and significantly improving the breeding value prediction accuracy.
The incorporation of genomic information can also play a key role in optimizing the delivery side of tree improvements, as seed orchards are essential to produce genetically improved seedlings in tree breeding programs [17]. The estimation of genetic diversity and pollen contamination of seed orchard seedlots has been traditionally conducted by phenotypically measuring cones and pollen in the orchards [18]. However, this method has some limitations, such as high labor requirements and the inability to accurately estimate pollen flow between natural populations and orchards [2]. Isoenzymes were the first genetic markers used to estimate pollen contamination in seed orchards [19]. Currently, SNP markers are superior to other DNA makers due to their stability, repeatability, ease of use, considerably low mutation rates and high-throughput genotyping, and can be found in all regions of a genome [20]. Recently, SNP genotyping was employed to obtain the genomic profiles of trees in a white spruce orchard (parents/founders), trees from progeny trials, and seedlings from orchard seedlots, allowing tree improvement programs to accurately measure the genetic diversity (effective population size, Ne) and pollen flow between natural populations and orchards (pollen contamination) [2]. The results showed that severe roguing led to a decrease in Ne and an increase in coancestry and that pollen contamination from an unconsidered source (adjacent seed orchard one km away) had an unanticipated impact on genetic diversity.
To date, only a few tree improvement programs have genotyped parents in the orchard, offspring in progeny trials, and orchard seedlots, and none have used this approach simultaneously to enhance variance components and breeding values while also assessing genetic diversity and pollen flow. Therefore, the objectives of this study were as follows: (1) to compare the variance components and theoretical accuracies of BVs for two growth traits (height and diameter) using genomic (GBLUP), pedigree-based (ABLUP), and combined pedigree and genomic-based (ssGBLUP) approaches; and (2) to estimate genetic diversity parameters, parental assignment, and pollen contamination levels using the genomic profiles of samples from the Alberta Region I white spruce breeding program.

2. Materials and Methods
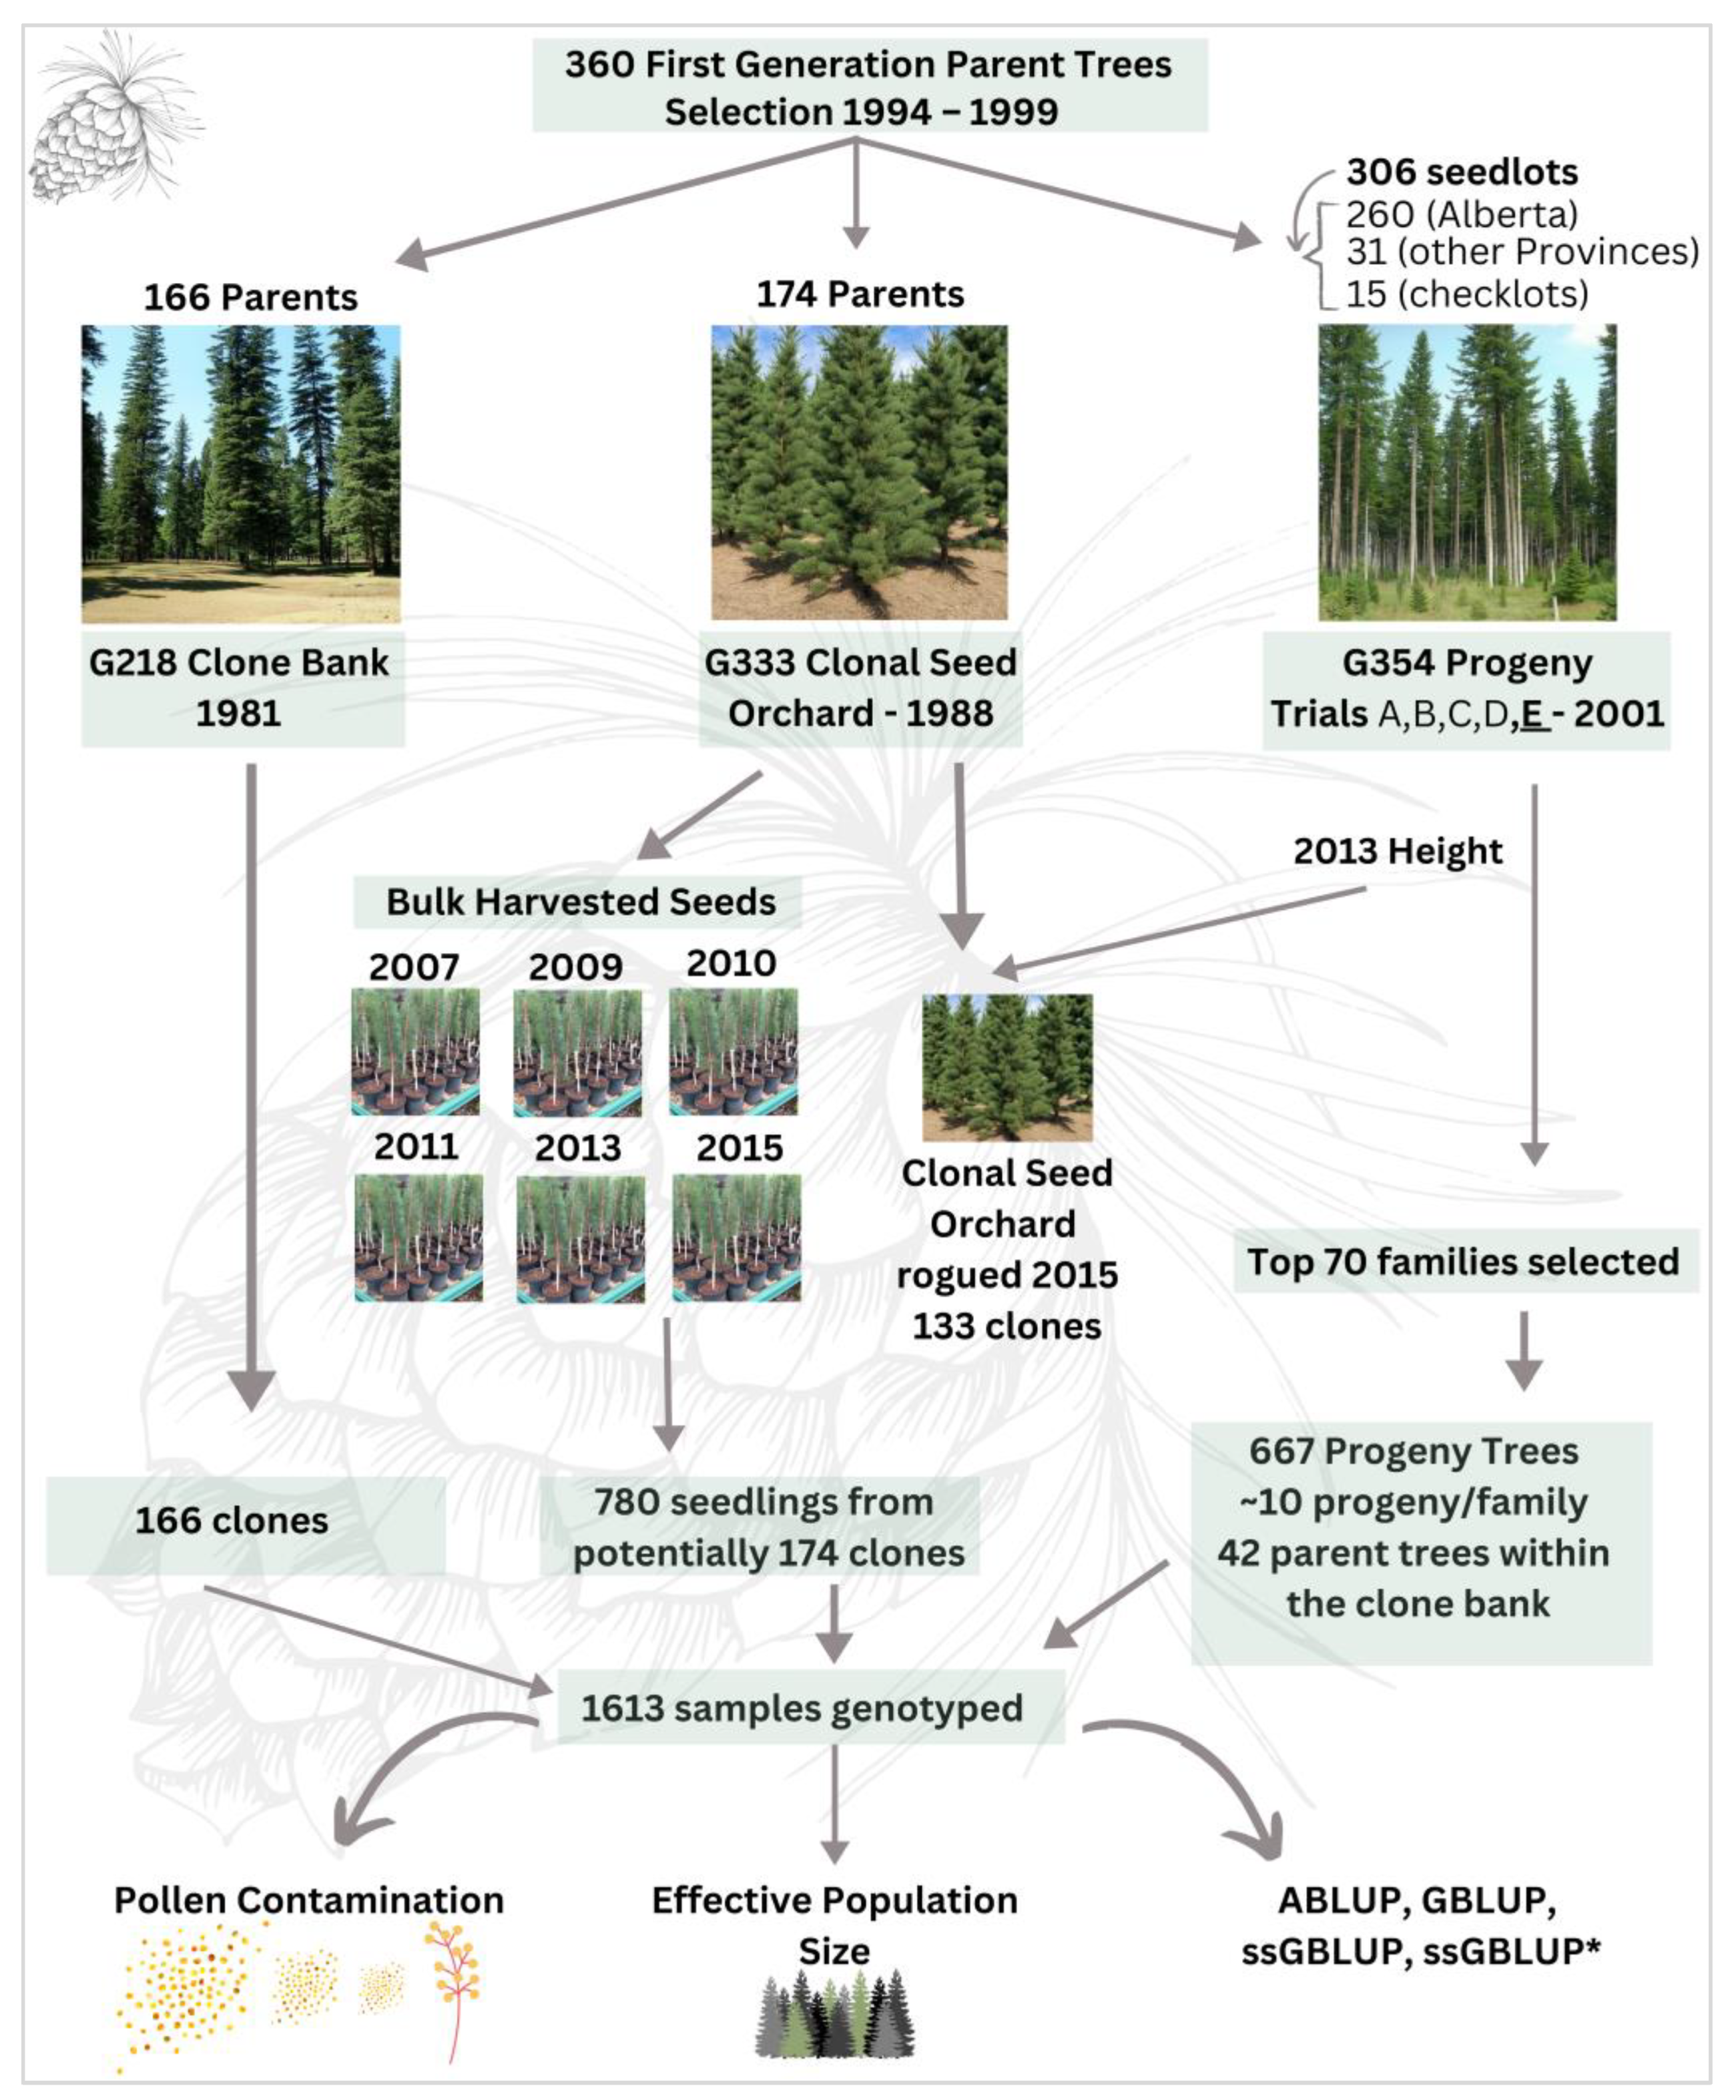
2.1. Study Area

The Region I white spruce Controlled Parentage Program (CPP) began in 1986 in central Alberta, Canada, and is owned and managed by four forest companies. Three hundred and sixty first-generation parent tree selections were made between 1994 and 1999. Progeny trials were established (named G354 by the Government of Alberta) in 2001 on five sites (A, B, C, D, E) with eight replications and 18 blocks per replication, following an alpha design with four tree row plots. Each progeny trial was installed with a total of 306 seedlots, representing 260 seedlots from Alberta, 31 seedlots from British Columbia, Ottawa, and Manitoba, and 15 checklots. From the five progeny trials, we chose the G354 E test site at Linaria (54°12′23″ N, 114°8′40″ W, 630 m.a.s.l), which has the highest survival and the easiest access compared to other test sites. The clonal seed orchard (G333) was established with 2088 ramets in 1998, with grafts collected from the original 174 parent tree selections from wild stands. The orchard occupies 3.78 hectares (210 m × 180 m) with 2100 planting positions arranged in 35 rows and 60 positions and 6 m of spacing between rows and 3 m between trees within a row/position. The seed orchard is located near Grande Prairie, Alberta (55°3′46″ N, 119°17′40.9986″ W, 705 m.a.s.l). Based on the 2013 (age 14) progeny trial measurements, 41 clones were rogued in 2015, leaving 1575 ramets from 133 clones. The first operational cone crop was collected in 2005, with an average production of 13,400 seeds/tree/year (2005 to 2016). Pollen contamination was monitored using a minimum of two wind vane-type pollen traps in the orchard and two external pollen traps outside the orchard. The G333 orchard is located approximately 1.0 km to the west of another white spruce seed orchard (G351), with a southwesterly prevailing wind direction during pollination in that area; therefore, pollen contamination between G351 and G333 is possible but is expected to be low against the prevailing wind direction. The Government of Alberta assigned a genetic gain of 2.0% in height (4% volume) at rotation (~100 yrs) in the seed orchard in 2016 based on the parent tree selection method employed [21]. The Government of Alberta manages a white spruce clone bank (G218) established in 1981 near Smoky Lake, Alberta, Canada (54°03′01″ N, 112°09′50″ W, 623 m.a.s.l.) with clones from various white spruce breeding programs, including Region I. This clone bank facility allows for additional scion collections from parent tree selections, research and DNA sampling, and breeding.

2.2. Needle Collection and DNA Extraction

A random sample of 200 open-pollinated (OP) G333 orchard seeds was obtained from each of the six-bulk orchard seedlots from 2007, 2009, 2010, 2011, 2013, and 2015 (Figure 1). These seedlots were sown and grown in a greenhouse at the University of Alberta for four months (January–April 2021). In the last week of April 2021, needles from 120 seedlings were collected for each of the five seedlots (2007, 2010, 2011, 2013, and 2015) and from 180 seedlings for the 2009 seedlot, resulting in a total of 780 seedling samples. In May 2021, current-year needles were also sampled from 166 founders (cloned wild parent selections) located at the G218 clone bank in Smoky Lake. The 166 founders were part of the initial 174 clones used to establish the original G333 seed orchard and replicated within the G218 clone bank. From the total of 306 families represented in the progeny trials, we selected the top 70 families using the ABLUPs estimated for the height measured in 2013 (age 14) to help the industry advance in the breeding program with the best families, generating genomic information from these (Figure 1). In June and July 2021, current-year needles were sampled from the top 70 OP families, corresponding to 667 progeny trees from the G354 E progeny trial (Linaria), with approximately 10 progenies sampled per family. From the 70 selected and genotyped families, 42 of the parent trees were sampled in the 166 G218 clone bank collection (Figure 1). We used pole pruners and scissors for the needle collections at the field sites. The needle tissue was placed in pre-labeled plastic bags and then stored in a field cooler at approximately 4 °C using ice packs. All samples were returned to the University of Alberta within two days of collection and stored at −20 °C until DNA was extracted at the Molecular Biology Service Unit (MBSU) at the University of Alberta, Canada, using the DNeasy Plant Kit (Qiagen, Mississauga, ON, Canada) and quantified using a Nano-Drop N-1000 spectrophotometer (Thermo Fisher Scientific, Waltham, MA, USA). DNA concentrations ranged between 50 and 100 ng/µL with a total volume of 25 µL in each sample. DNA samples were normalized to 400 ng per well before the SNP genotyping.

2.3. SNP Genotyping

A total of 1613 DNA samples (from 166 parents, 667 progeny, 780 seedlot seedlings) were genotyped using an Infinium iSelect SNP array (Illumina, San Diego, CA, USA) (Figure 1). The SNP array consisted of 5308 biallelic SNPs, representing as many distinct gene loci [22], and was previously used to genotype trees from the Region G1 Alberta white spruce tree improvement program [2]. Genotyping was conducted by Neogene Canada (Edmonton, AB, Canada). For the optimal assignment of parents and pollen contamination evaluation, we discarded, via visual inspection, a total of 480 SNPs, which were multilocus, paralogs, monomorphic, or presented low signals, using GenomeStudio 2.0 software (Illumina, San Diego, CA, USA). Following this visual inspection, 20 SNPs showing a minimum allele frequency (MAF) <0.01, an absolute value of |FST| ≥ 0.50 (FST = Fixation Index), or an average call rate of <85%, were eliminated. Next, a total of 4808 valid SNPs had an average call rate per SNP of 99.7%, an average MAF of 0.21, and an average FST of −0.02. We used all 4808 SNPs to obtain the GBLUP and ssGBLUP values. Two subsets of 2000 SNPs were randomly selected, showing no differences in their overall diversity parameters, so we performed the subsequent genetic diversity analyses using subset 1, following previous studies that were conducted with the same SNP chip [2].

2.4. Variance Components, Theoretical Accuracy, and Breeding Value Predictions

The Government of Alberta provided phenotypic data (height and diameter), with approval from the owners, of the G354 progeny trial for this study, measured at age 20. To estimate variance components and predict breeding values for parents and offspring, we fitted and compared the following animal (individual-tree) genetic mixed models [23] for height (HT20) and diameter at breast height (DBH20) traits using the conventional pedigree-based ABLUP model, the standard genomic-based GBLUP model and two versions of the single-step GBLUP (ssGBLUP) models.
ABLUP:
y = X β + Z a + e  
where y is the vector of phenotypic data; β is the vector of the fixed effect of blocks; a is the vector of random additive genetic effects (i.e., breeding values) with distribution a ~ N 0 , A σ a 2 , where A is the additive relationship matrix [4] from the pedigree information containing 8658 trial trees (progeny) and their 306 known parents, σ a 2 is the additive genetic variance; and e is the vector of random residual effects with distribution e ~ N 0 , I σ e 2 , where I is the identity matrix, and σ e 2 is the residual variance. The incidence matrices X and   Z relate the phenotype y to the effects β and a , respectively.
GBLUP: The model for the classical GBLUP analysis was the same as [1], with the only difference being that the A-matrix from the pedigree was substituted with the G-matrix from a total of 709 individuals (667 progeny from 70 OP families of the G354 E progeny trial and their 42 genotyped parents) and 4808 SNPs. Then, vector a was distributed a ~ N 0 , G σ a 2 , where σ a 2 genetic G-matrix were described above.
ssGBLUP: The model for the ssGBLUP method was the same as [1], except that the A-matrix was substituted for the combined pedigree- and marker-based relationship matrix (H-matrix) of the same dimension as the pedigree-based matrix. That is, to obtain the hybrid H-matrix, we blended the G-matrix (667 progeny trees genotyped and 42 parents) with the A-matrix (8658 progeny trees and 306 parents). Then, vector a   was distributed a ~ N 0 , H σ a 2 . The inverse of the relationship matrix combining the pedigree and genomic information H 1 was derived following Legarra et al. (2009) [24], Misztal et al. (2009) [9]; Aguilar et al. (2010) [25], Christensen and Lund (2010) [10] as follows:
H 1 = A 1 + 0 0 0 λ G 1 A 22 1
where λ scales the differences between genomic and pedigree-based information, G 1 is the inverse of the genomic-based relationship matrix, and A 22 1 is the inverse of the pedigree-based relationship matrix for genotyped individuals ( A 22 ). The weighting factor λ was set to 0.90. The G-matrix was estimated following the first method proposed by VanRaden (2008) [8]:
G = W W 2 k p k 1 p k
where W is the centered matrix of SNP covariates, and p k is the current (or observed) allele frequency of the genotyped trees for marker k. This G-matrix was used to correct errors in the pedigree, so the pedigree-based ABLUP and pedigree-genomic ssGBLUP analyses were preformed using the corrected pedigree.
We further evaluated the effect of including the genotyped parents corresponding to the genotyped offspring (42) and all the genotyped parents from the program (166) on the genetic parameters and breeding value predictions. Therefore, we generated a second version of the ssGBLUP analysis (ssGBLUP*). In the ssGBLUP* analysis, we merged the G-matrix derived from genotyping 667 progeny trees from the G354 E progeny trial and 166 parents from the G218 clone bank with the A-matrix (consisting of 8658 progeny and 306 parents) to obtain the hybrid H-matrix.
The single-trait narrow-sense heritability ( h ^ 2 ) was estimated as follows:
h ^ 2 = σ ^ a 2 σ ^ a 2 + σ ^ e 2  
where σ ^ a 2 is the estimated additive genetic variance and σ ^ e 2 is the estimated residual genetic variance from the single-trait model (Equation (1)).
The theoretical accuracy of breeding values for the ith tree ( A cc i ) was calculated using the following expression:
A cc i = 1 S E i 2 σ ^ a 2   1 + F i
where SEi is the standard error and F i is the inbreeding coefficient that corresponds to individual i.
Finally, the Spearman rank correlations were used to evaluate whether the ranking of predicted breeding values for parents varied among the models.
The A-matrix, G-matrix, and H-matrix were obtained using the ASRgenomics R-package [26]. The variance components and predicted BVs from the different models described above were fitted in R (www.r-project.org) with the package ASReml-R 4.2 [27] using the average information algorithm described by Gilmour (1995) [28]. The estimated BVs (in centimeters) were transformed to “percentage gain” using the mean of all BVs (as the baseline for the % gain) and following government policies [21]. Finally, HT20 (% gain) and DBH20 (% gain) were the units used for the different BVs.

2.5. Genetic Diversity Analysis

The average number of alleles per SNP (A), the Shannon Index (I), expected heterozygosity (He), and observed heterozygosity (Ho) were calculated using the GenAlEx software v6.5 (Australian National University, Canberra, Australia) [29] and a subset of 2000 SNPs, following previous studies [2]. The inbreeding coefficient was calculated as Fi = (mean He − mean Ho)/mean He. The effective population size (Ne) is defined as the census size of a population of unrelated, non-inbred individuals with equivalent gene diversity, measuring the rate of genetic drift and inbreeding [30]. Effective population size was calculated using four methods. The first Ne method was based on Ritland (1996) [31], calculated using the GenAlEx software, and called Ne (Ritland) throughout this study. The second Ne method was based on Nomura (2008) [32], calculated using the NeEstimator software v2.1 (Molecular Fisheries Laboratory, Brisbane, Australia) [33], and called Ne (Nomura) throughout this study. The third Ne method was based on Waples (2006) [34], calculated using the NeEstimator software v2.1 [33], and called Ne (Waples) throughout this study. The fourth Ne method was based on cones, calculated following FGRMS (2016) [21] and Galeano et al. (2021) [18], and called Ne (cones) throughout this study.

2.6. Parental Assignment and Mating Dynamics

The parental assignment of each seedling from the G333 seed orchard was performed using CERVUS 3.0.7 (Field Genetics Ltd., Edinburgh, United Kingdom) [35], with an assignment probability of 95%, a genotyping error rate of 0.0001, and 2000 SNPs [2]. CERVUS was run using the “parent pair-sexes unknown” analysis. For each offspring, parent sex1 (mothers of trees in the seed orchard seedlings) with a positive LOD score was accepted, and parent sex2 (fathers of trees in the seed orchard seedlings) was confirmed when the delta score was significant when calculated with a simulation of 10,000 offspring and assuming that 50% of the candidate parents were sampled. Parental contributions were obtained for all six years (2007, 2009, 2010, 2011, 2013, 2015), combining all seed orchard seedlots. The mating dynamics of all six seedlots together and the 42 progeny families from the seed orchard seedlings were performed based on the number of offspring that each mother (parent sex1) and father (parent sex2) produced, using an Excel spreadsheet.

2.7. Assessment of Pollen Contamination

The percentage of pollen contamination (pollen from outside the seed orchard) was estimated using two methods. The first method used pedigree reconstruction based on 2000 SNPs and parental assignment previously obtained with CERVUS: an offspring was labeled as ‘pollen contamination’ when the delta score was not significant, meaning that a mismatch occurred between candidate parents. The second method used pollen traps as follows: where pollen is counted from inside and outside the orchard, using a surrogate species (e.g., lodgepole pine pollen).

2.8. Correlations for Effective Population Size and Level of Pollen Contamination

Correlation values and matrices were obtained using Pearson’s method for the two pollen contamination assessments and effective population size (Ne) methods in the Alberta Region I and Region G1 white spruce seed orchards. Pearson’s correlation (r) coefficients were estimated in R 4.2.3 (www.r-project.org) and assumed to be significant at p < 0.05. Plots were fitted using the ggplot2 package in R (www.r-project.org) and Excel.

3. Results

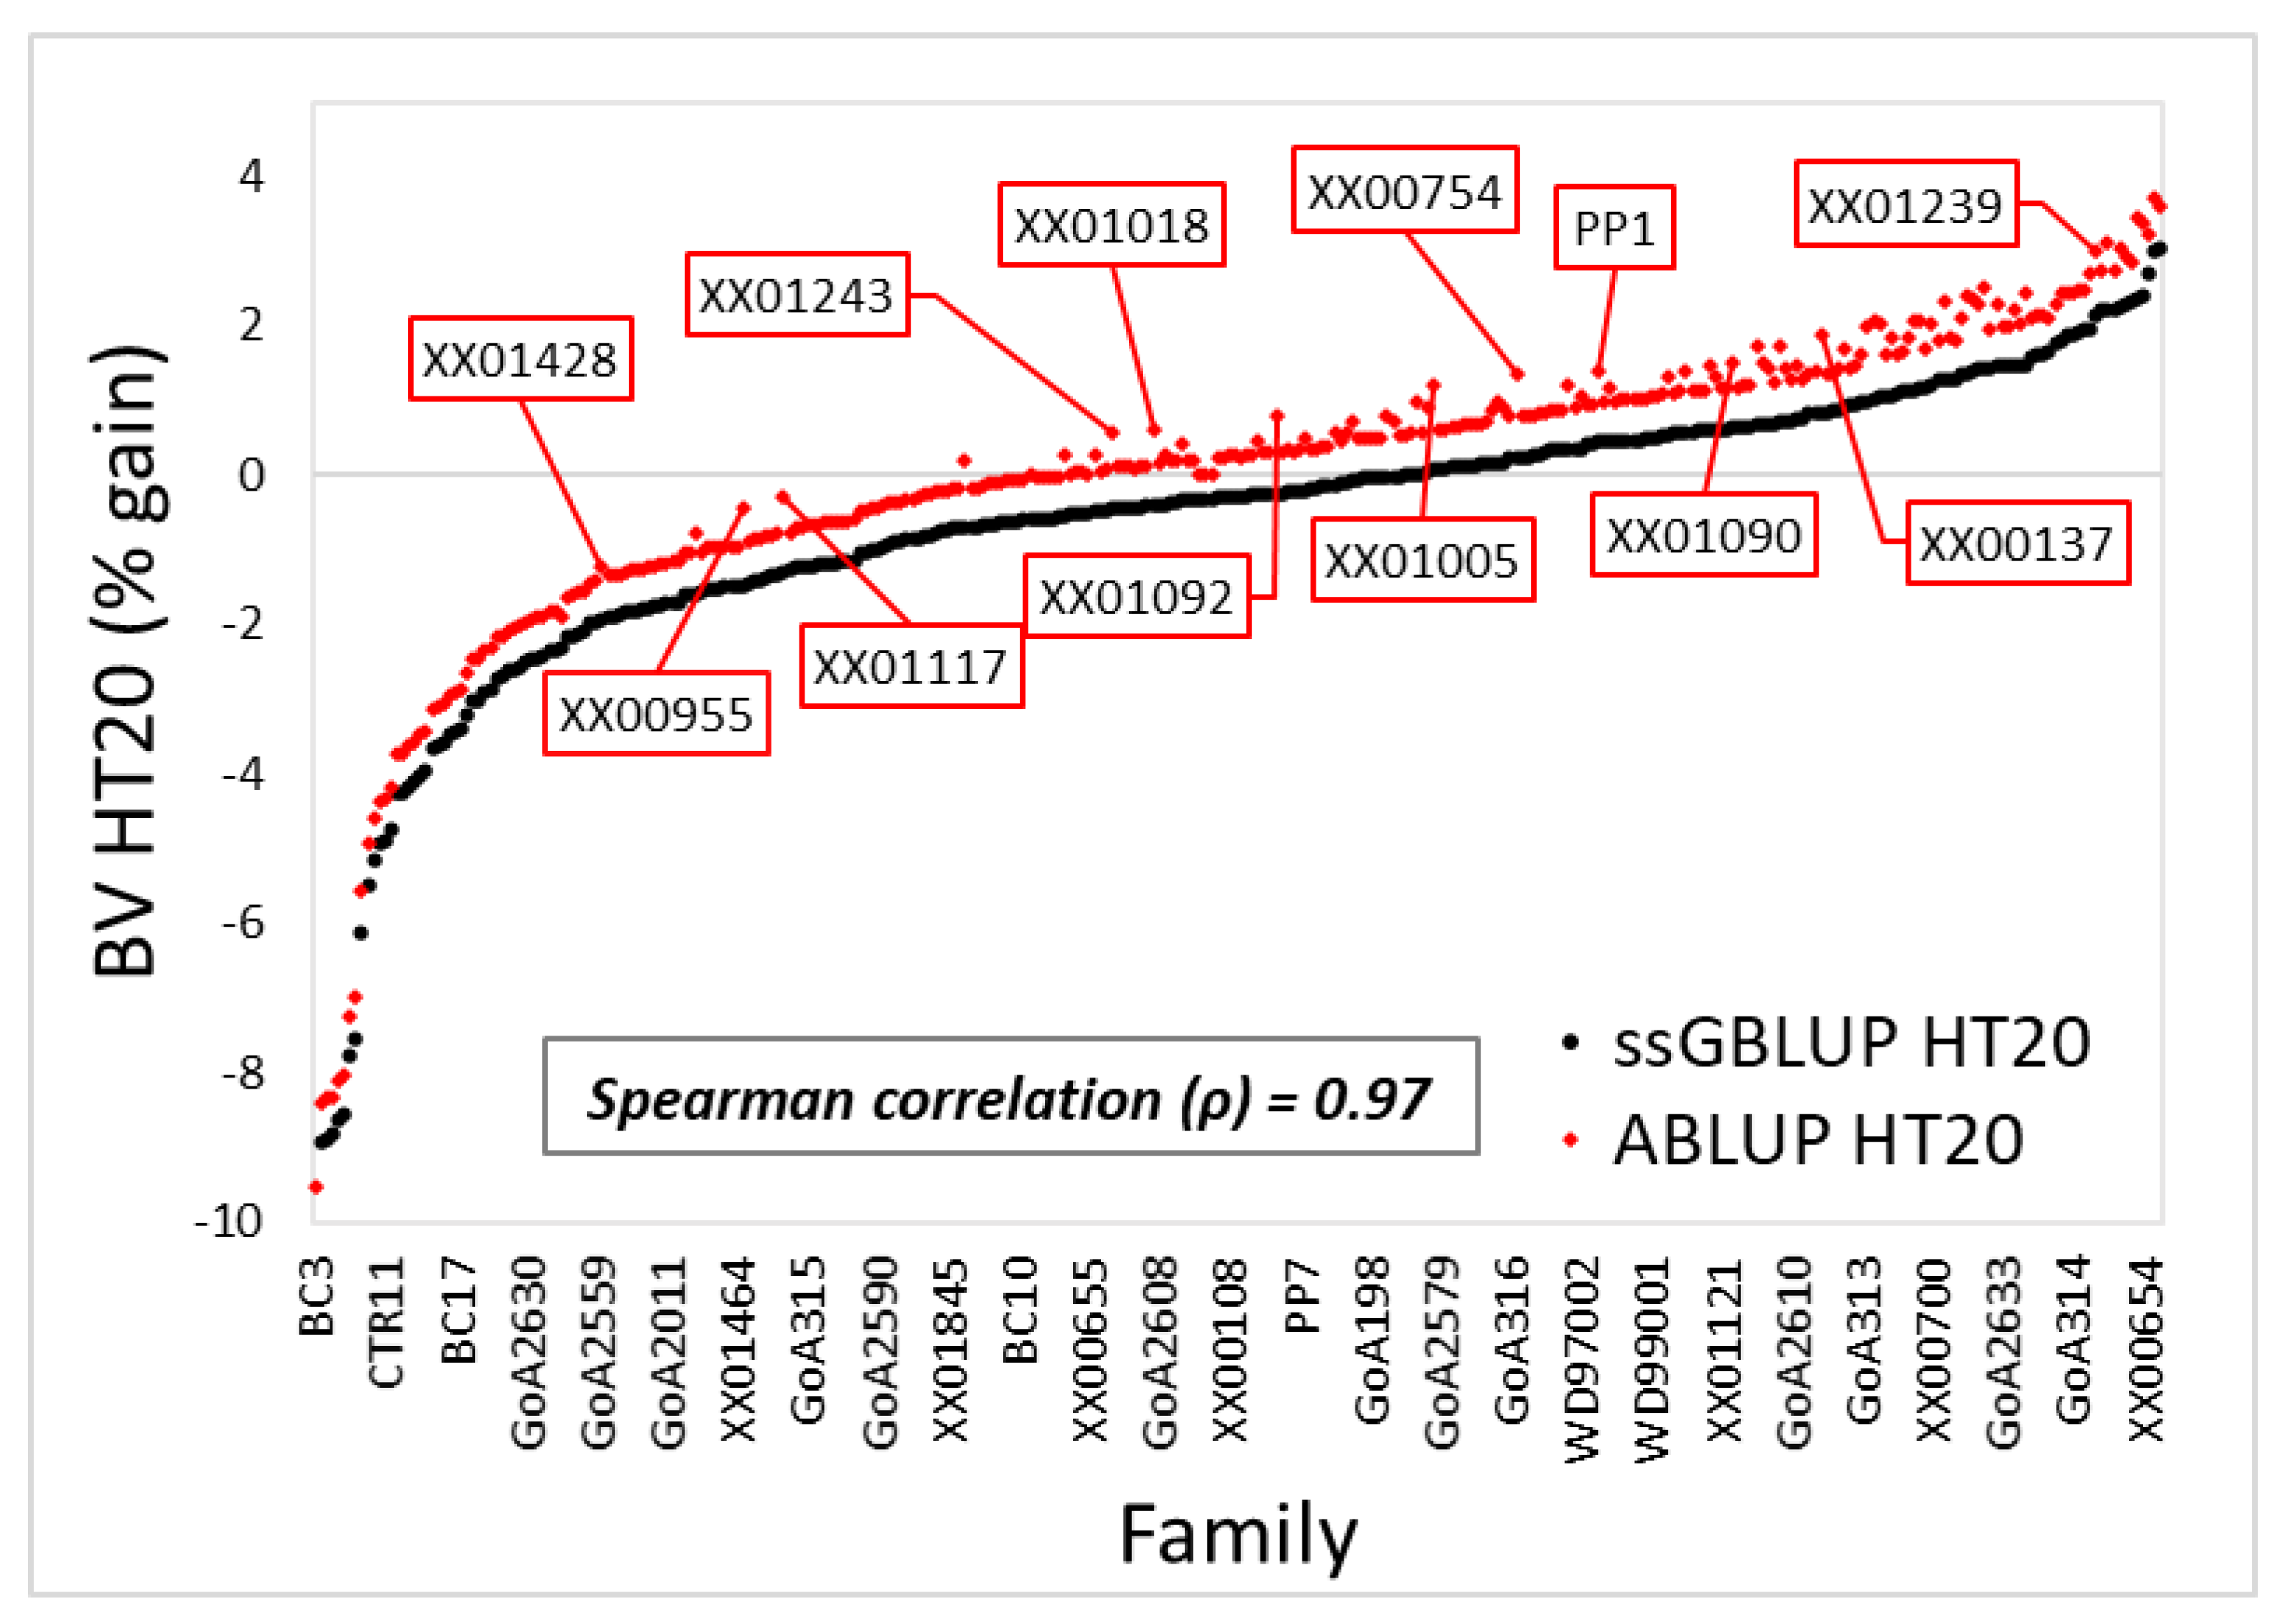
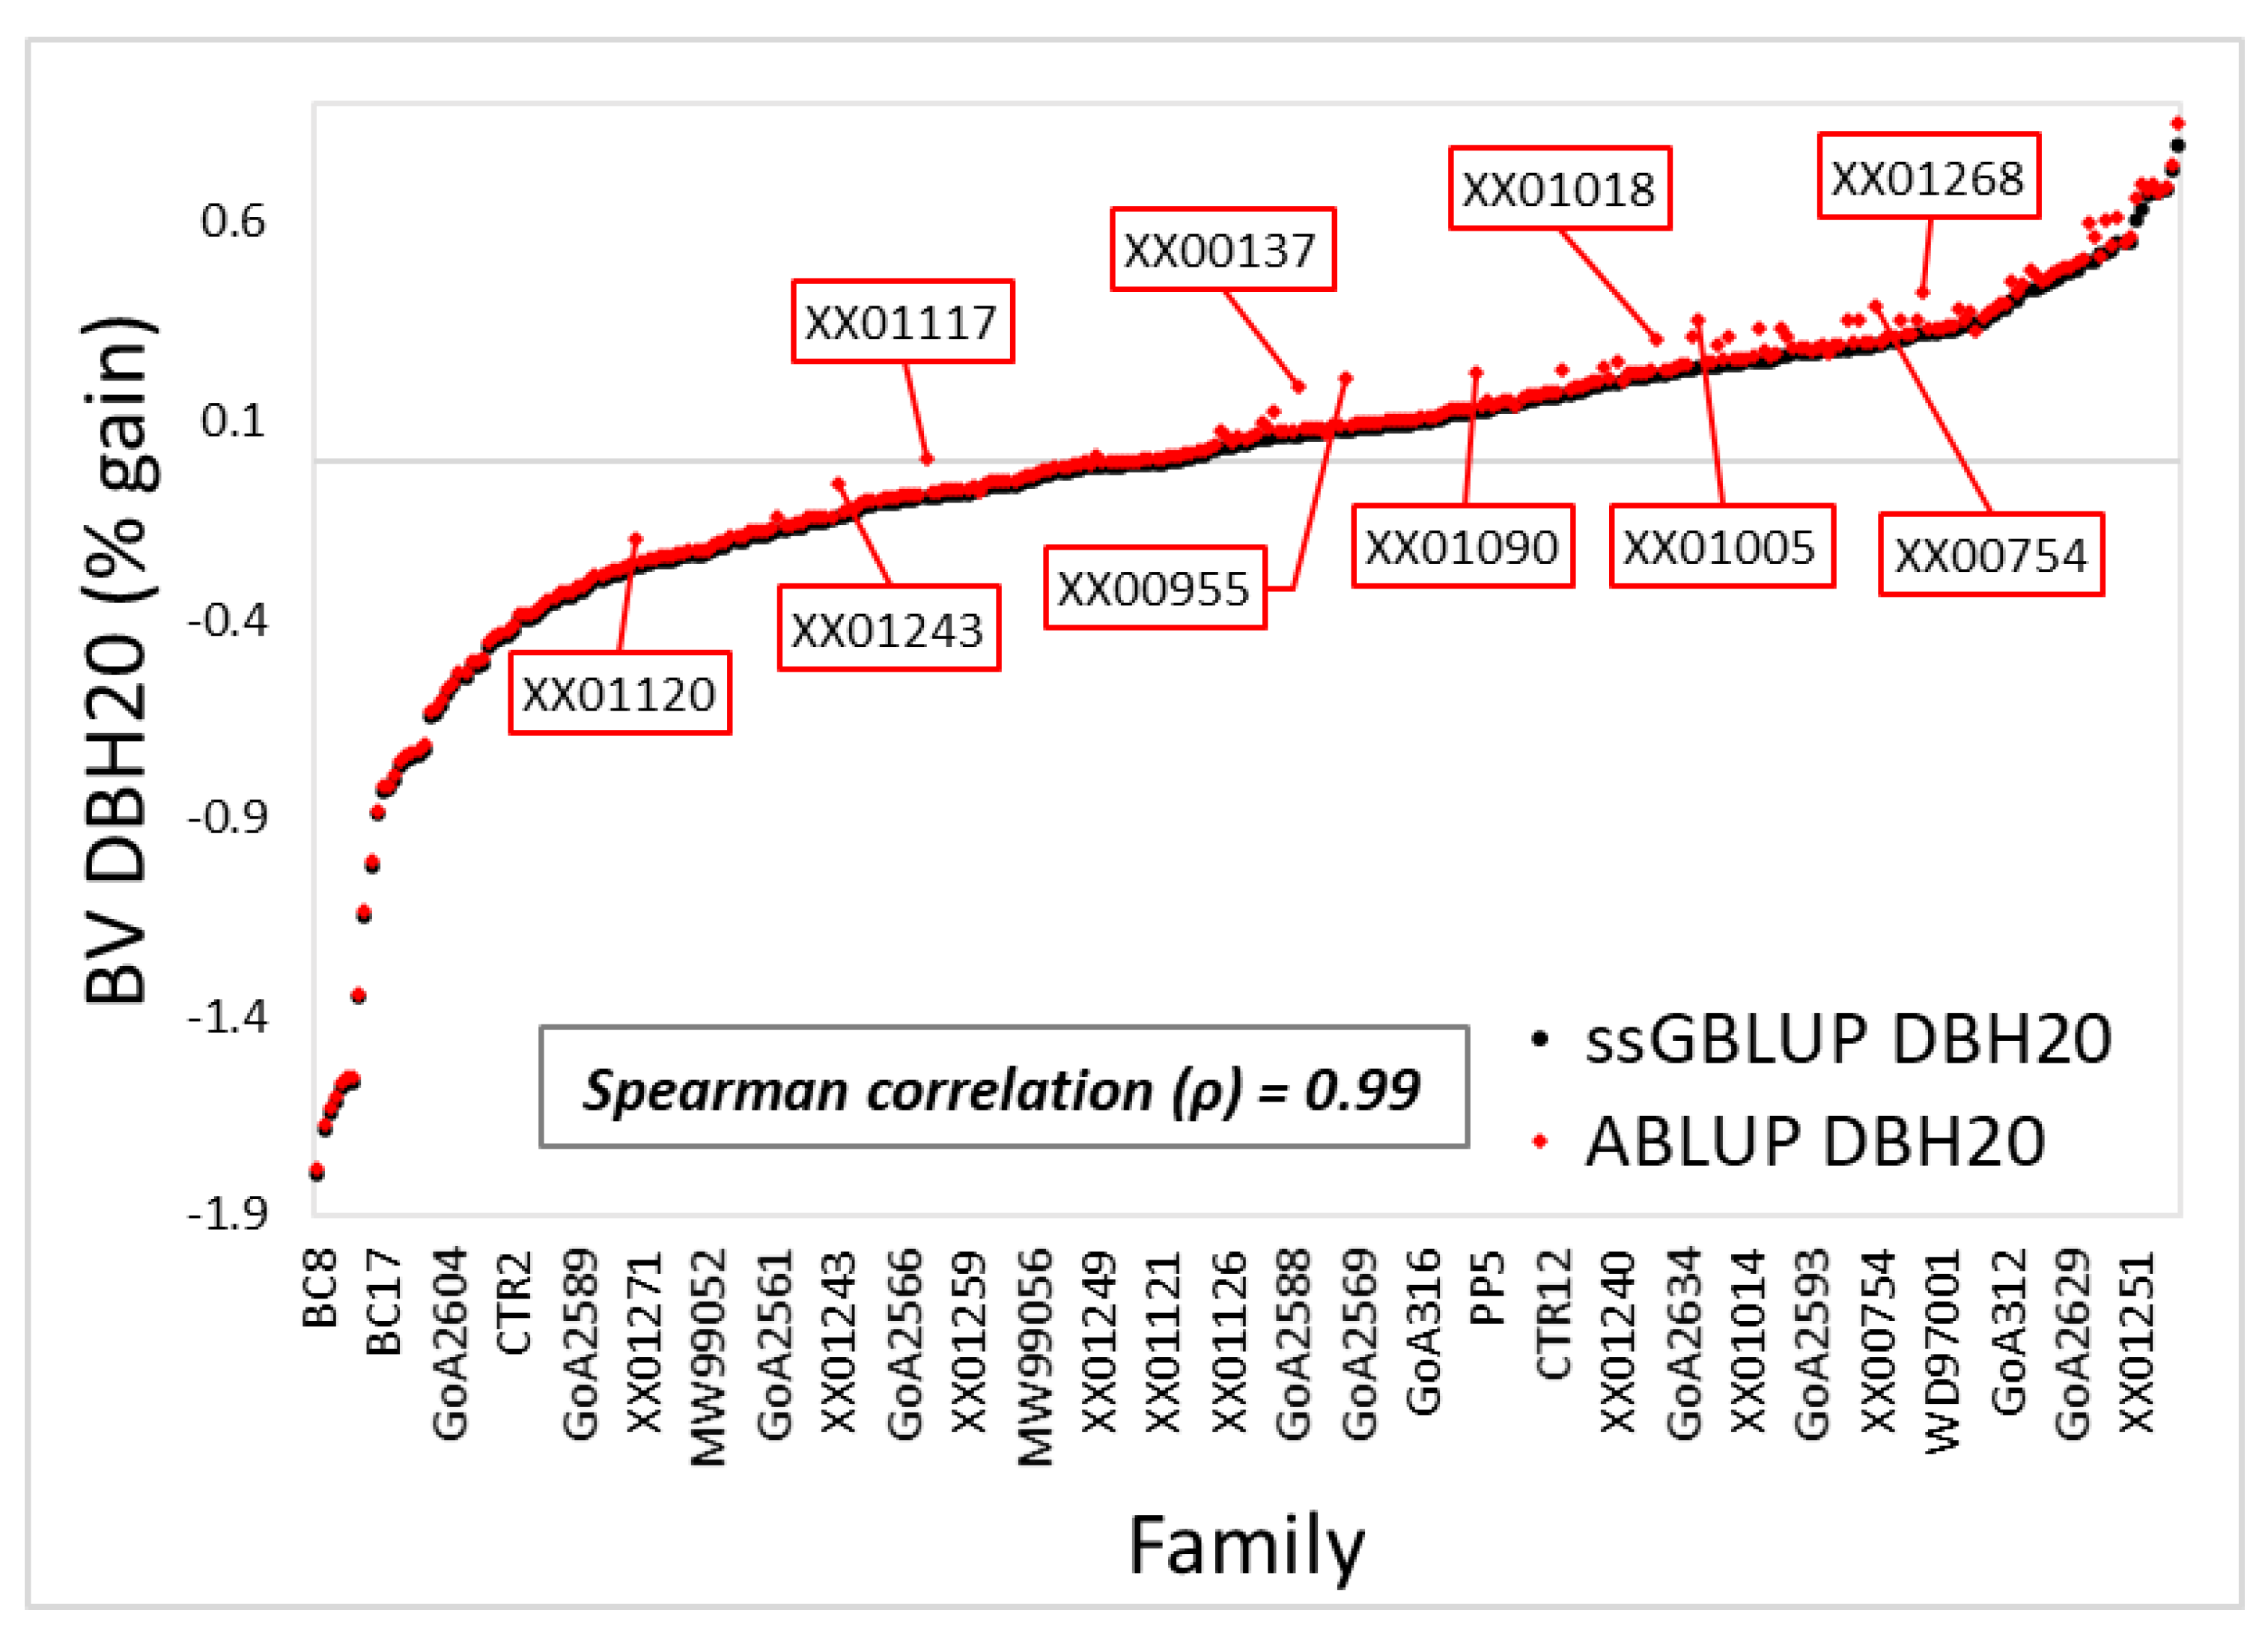
3.1. Variance Components and Predicted Breeding Values

Based on the G-matrix, we performed a pedigree correction of 136 genotyped trees from the progeny trial, corresponding to 20% of the total number of genotyped progeny trees (n = 667). We removed 25 trees that were found to be unrelated to the rest of the genotyped trees and mothers, and 111 trees were reassigned to appropriate mothers (error correction).
Overall, the estimated genetic parameters and predicted BVs improved when implementing ssGBLUP compared to GBLUP and ABLUP evaluation models fitted for both growth HT20 and DBH20 traits (Table 1). In particular, estimates of residual variance ( σ ^ e 2 ) decreased, and estimates of additive genetic variance ( σ ^ a 2 ) and heritability ( h ^ 2 ) increased using ssGBLUP (Table 1). However, heritability estimates for DBH20 and HT20 with the ABLUP and ssGBLUP models using all 8974 trees (306 parents and 8658 progenies from the progeny trial) were considerably higher than those with 709 genotyped trees (42 parents and 667 progenies from the progeny trial) (Table 1). The average theoretical accuracy of the breeding values (BVs) ( A c c ¯ ) corresponding to mothers and progeny improved when using ssGBLUP for both traits (Table 1). In general, ssGBLUP and ssGBLUP* did not show significant differences in the genetic parameters and accuracy of the BVs (Table 1). The new ranking (lowest to highest values) for HT20 and DBH20, based on the ssGBLUPs for 306 families, helped identify the families with an incorrect ranking from the ABLUP models, such as XX00955, XX00117, XX00137, XX01239 for HT20, among others (Figure 2), and XX01120, XX01243, XX00754, XX01268 for DBH20, among others (Figure 3). The Spearman’s rank correlation coefficients (ρ) were significant and positive between ABLUP and ssGBLUP values for HT20 (ρ = 0.97) (Figure 2) and DBH20 (ρ = 0.99) (Figure 3), further indicating that there were fewer differences in rankings for DBH20 between the two methods.

3.2. Genetic Diversity in the White Spruce Program

The genetic diversity of the seedlots from the Region I orchard was maintained and remained stable throughout the years of study (2007 to 2015), with an average number of alleles per SNP close to 2.0, a Shannon Index (I) of approximately 0.44, and expected (He) and observed (Ho) heterozygosity values between 0.28 and 0.29 (Table 2). The orchard seedlots showed no inbreeding, given that Fi was near or below zero (Table 2). The Ne calculated, using the Ritland, Nomura, and Waples methods (see Section 2), showed similar tendencies for each population but contrasting numbers among populations (Table 2).

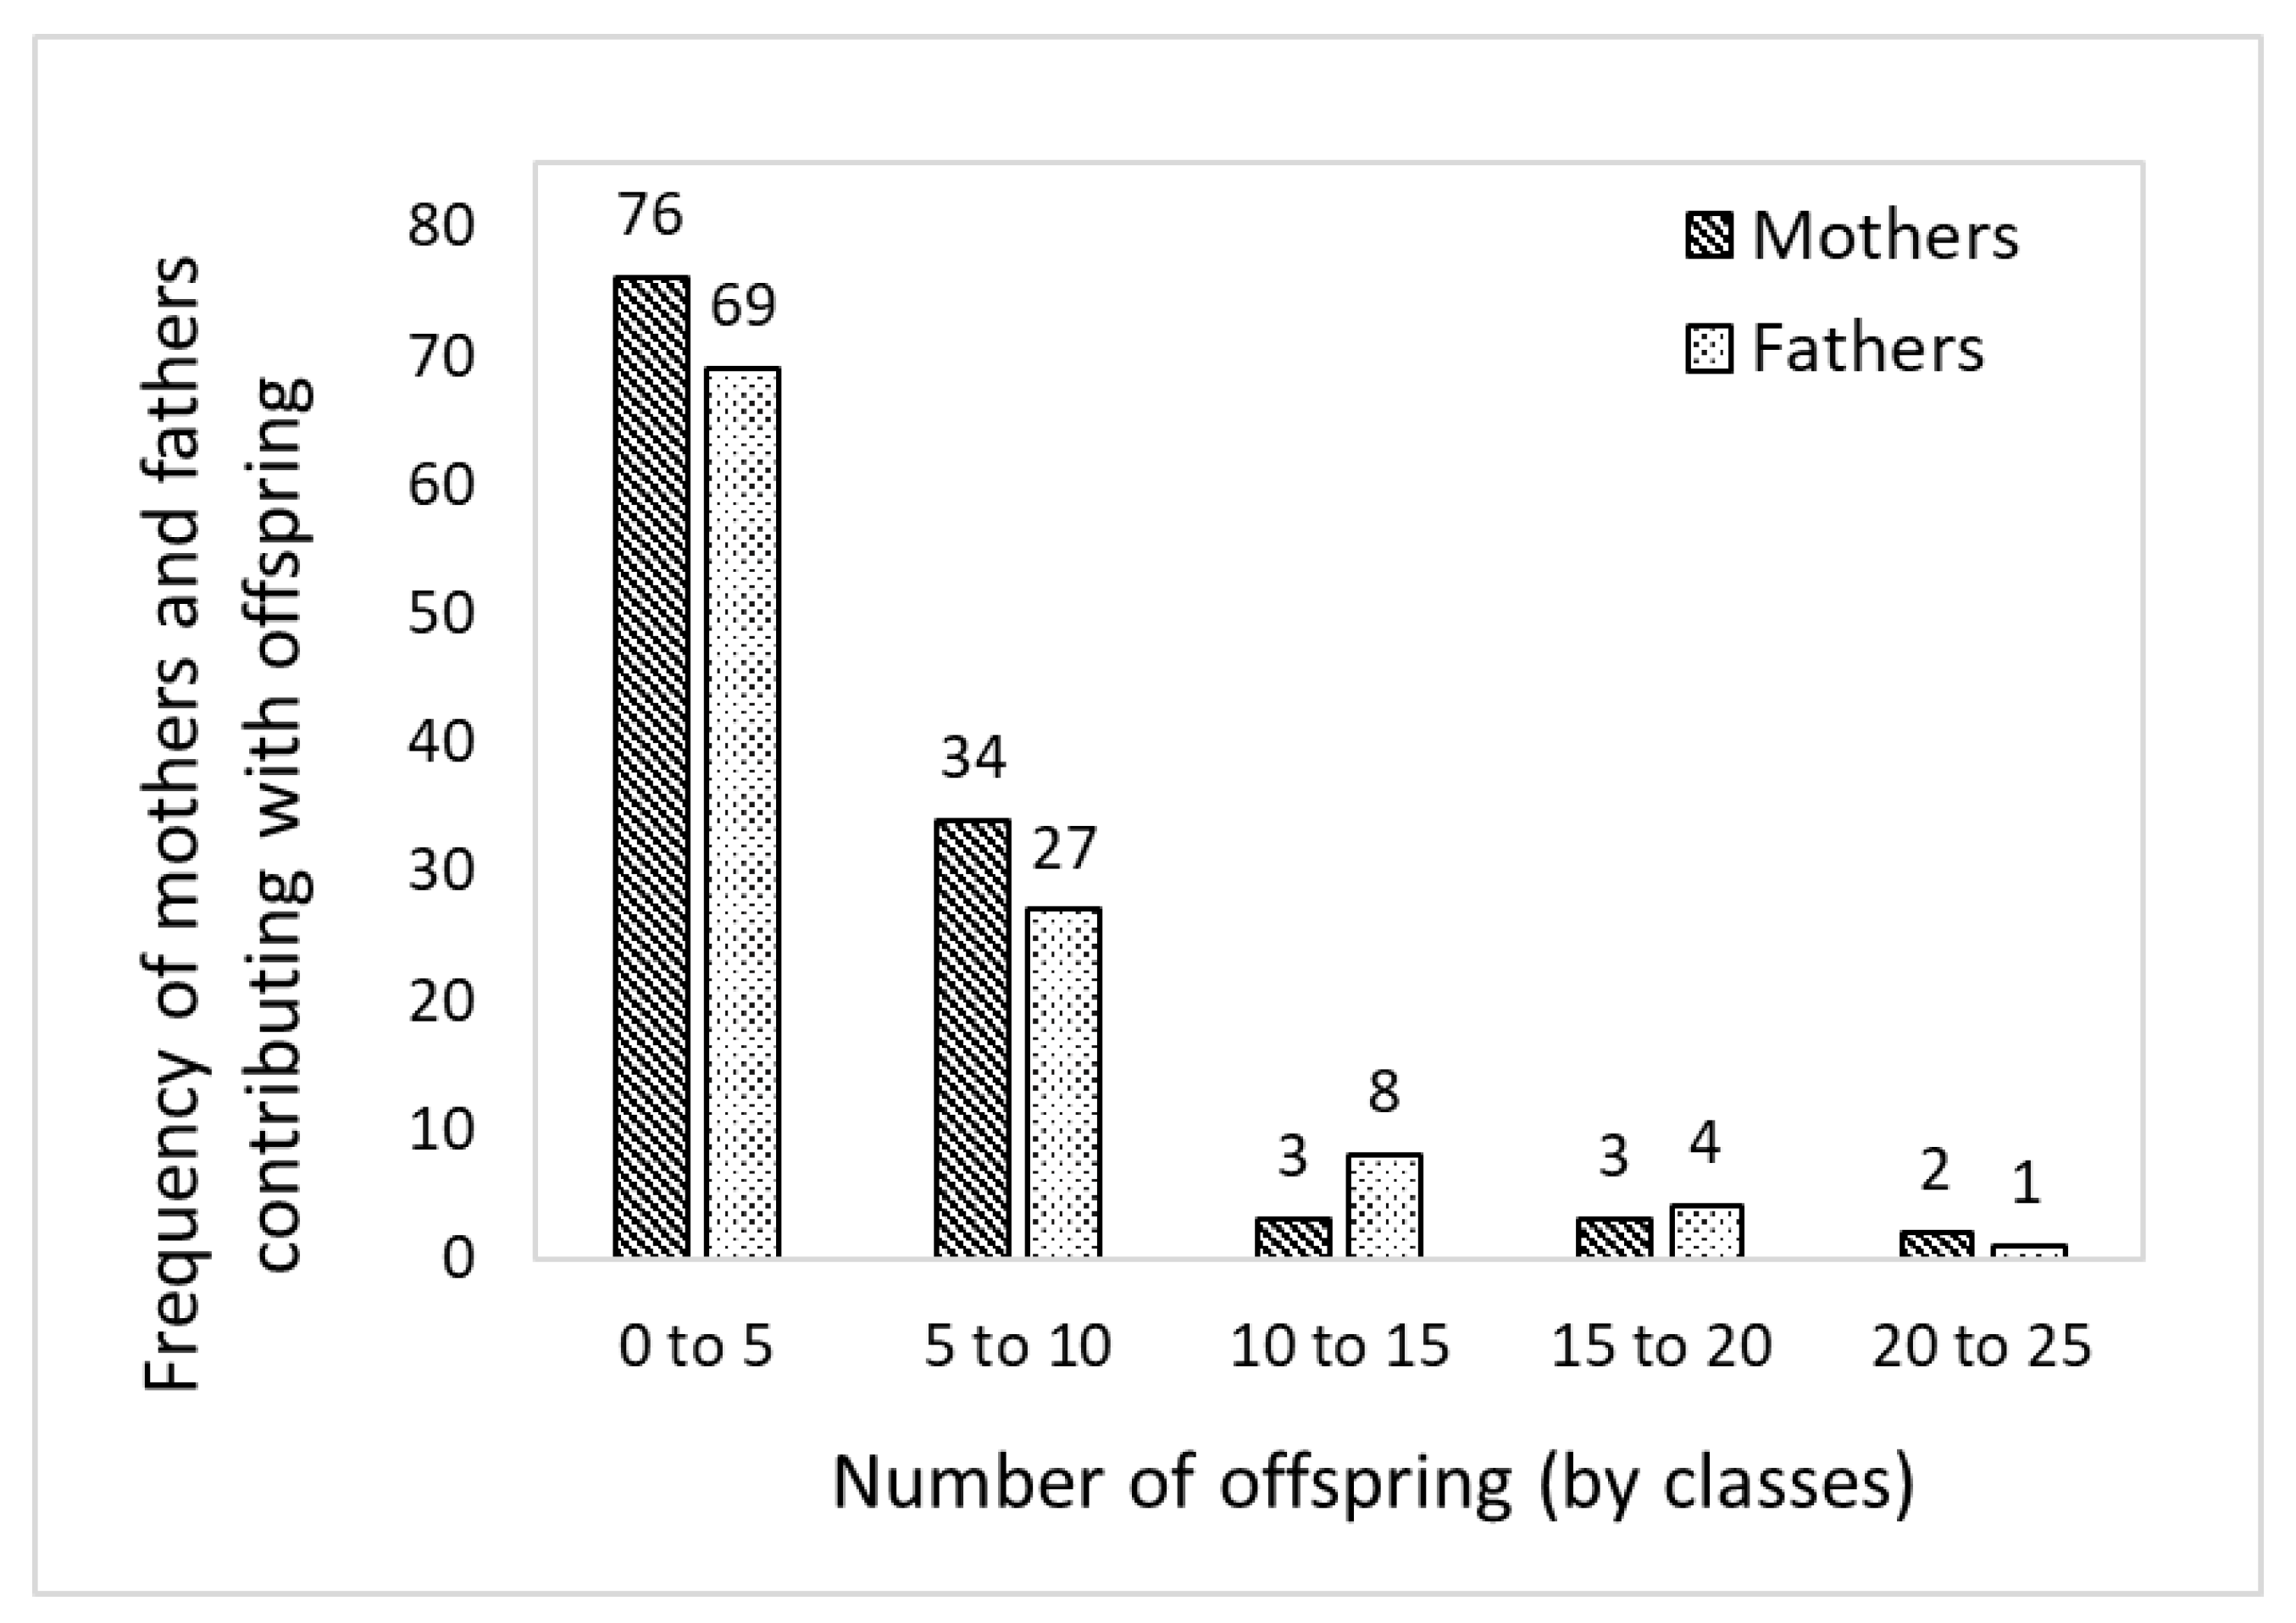
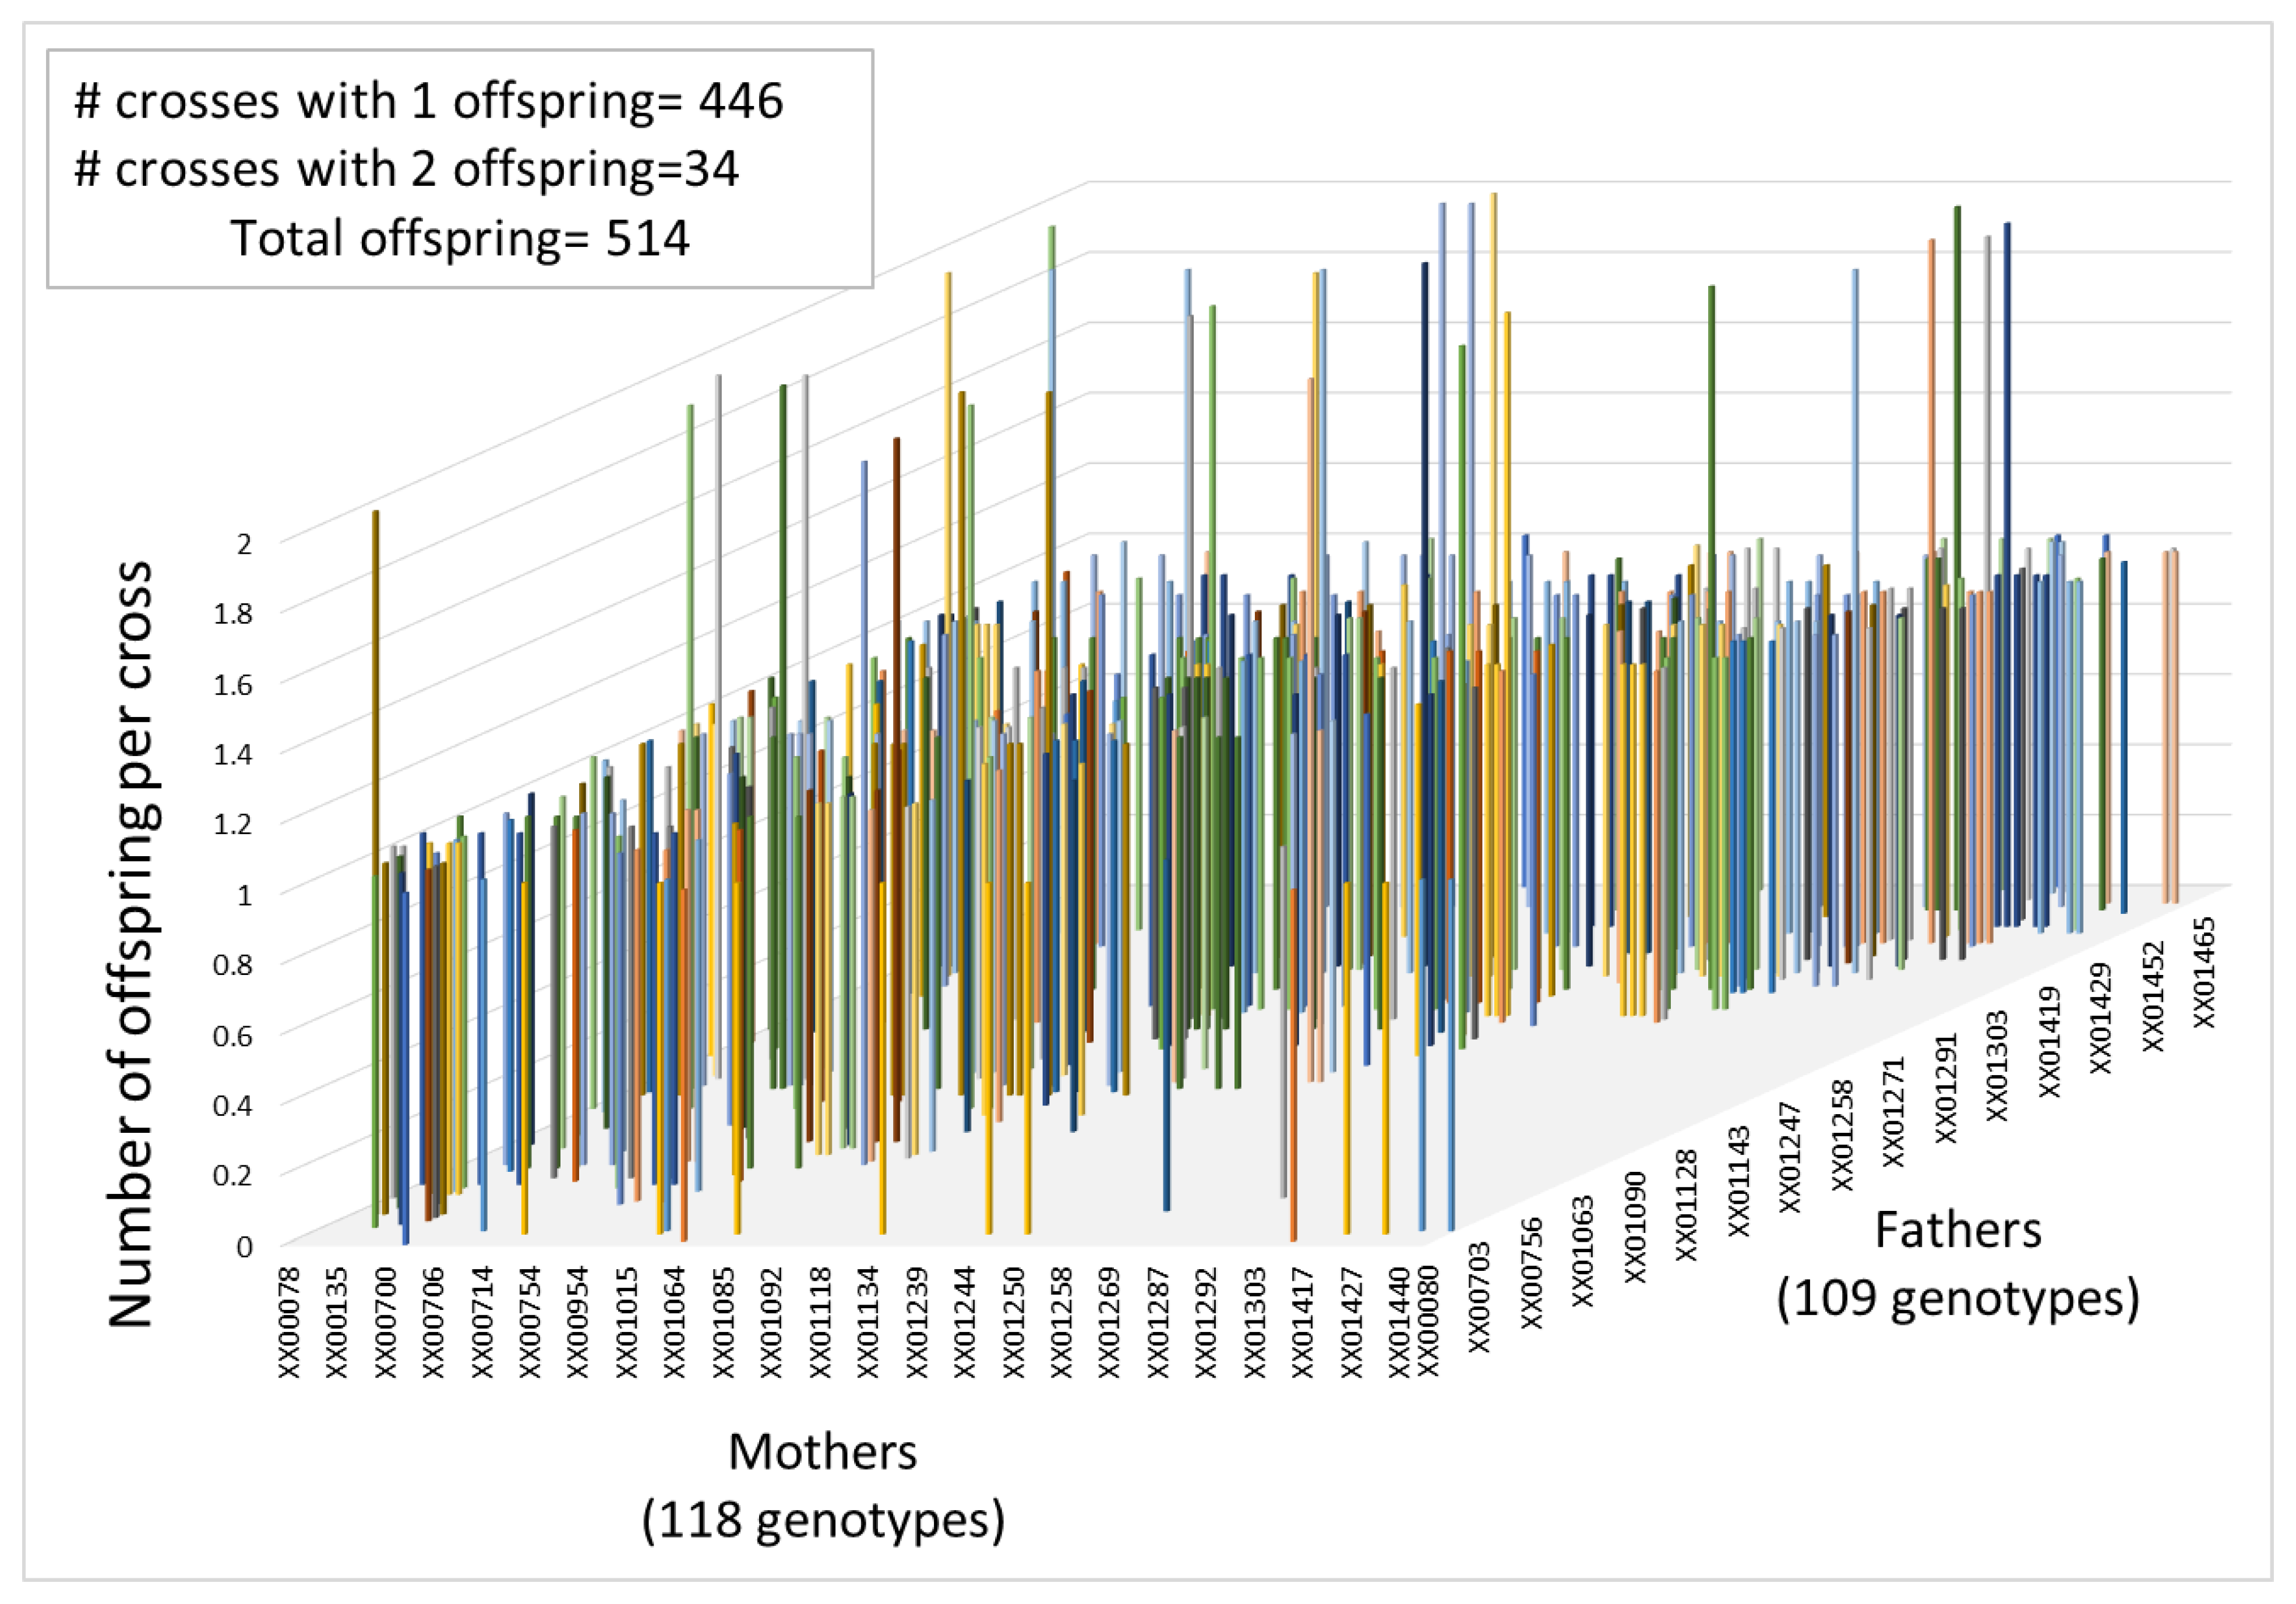
3.3. Pedigree Reconstruction

We performed pedigree reconstruction for the 780 seedlings, with 514 seedlings known mothers (118) and fathers (109) (Figure 4 and Figure S1) and 266 seedlings with known mothers and unknown fathers. Known fathers and known mothers showed a similar frequency in parental contributions across the years, regardless of the number of offspring when grouped into classes (Figure 4 and Figure S1). For example, we had a range of 69–76 mothers and fathers contributing in the 0–5 offspring class and 1–2 mothers and fathers contributing in the 20–25 offspring class (Figure 4 and Figure S1). Furthermore, known fathers and known mothers showed equal parental contributions through the different genotypes, with no more than two seeds per cross for the six years under study, as shown in the results from the mating dynamics analysis of the Region I white spruce seed orchard (Figure 5).

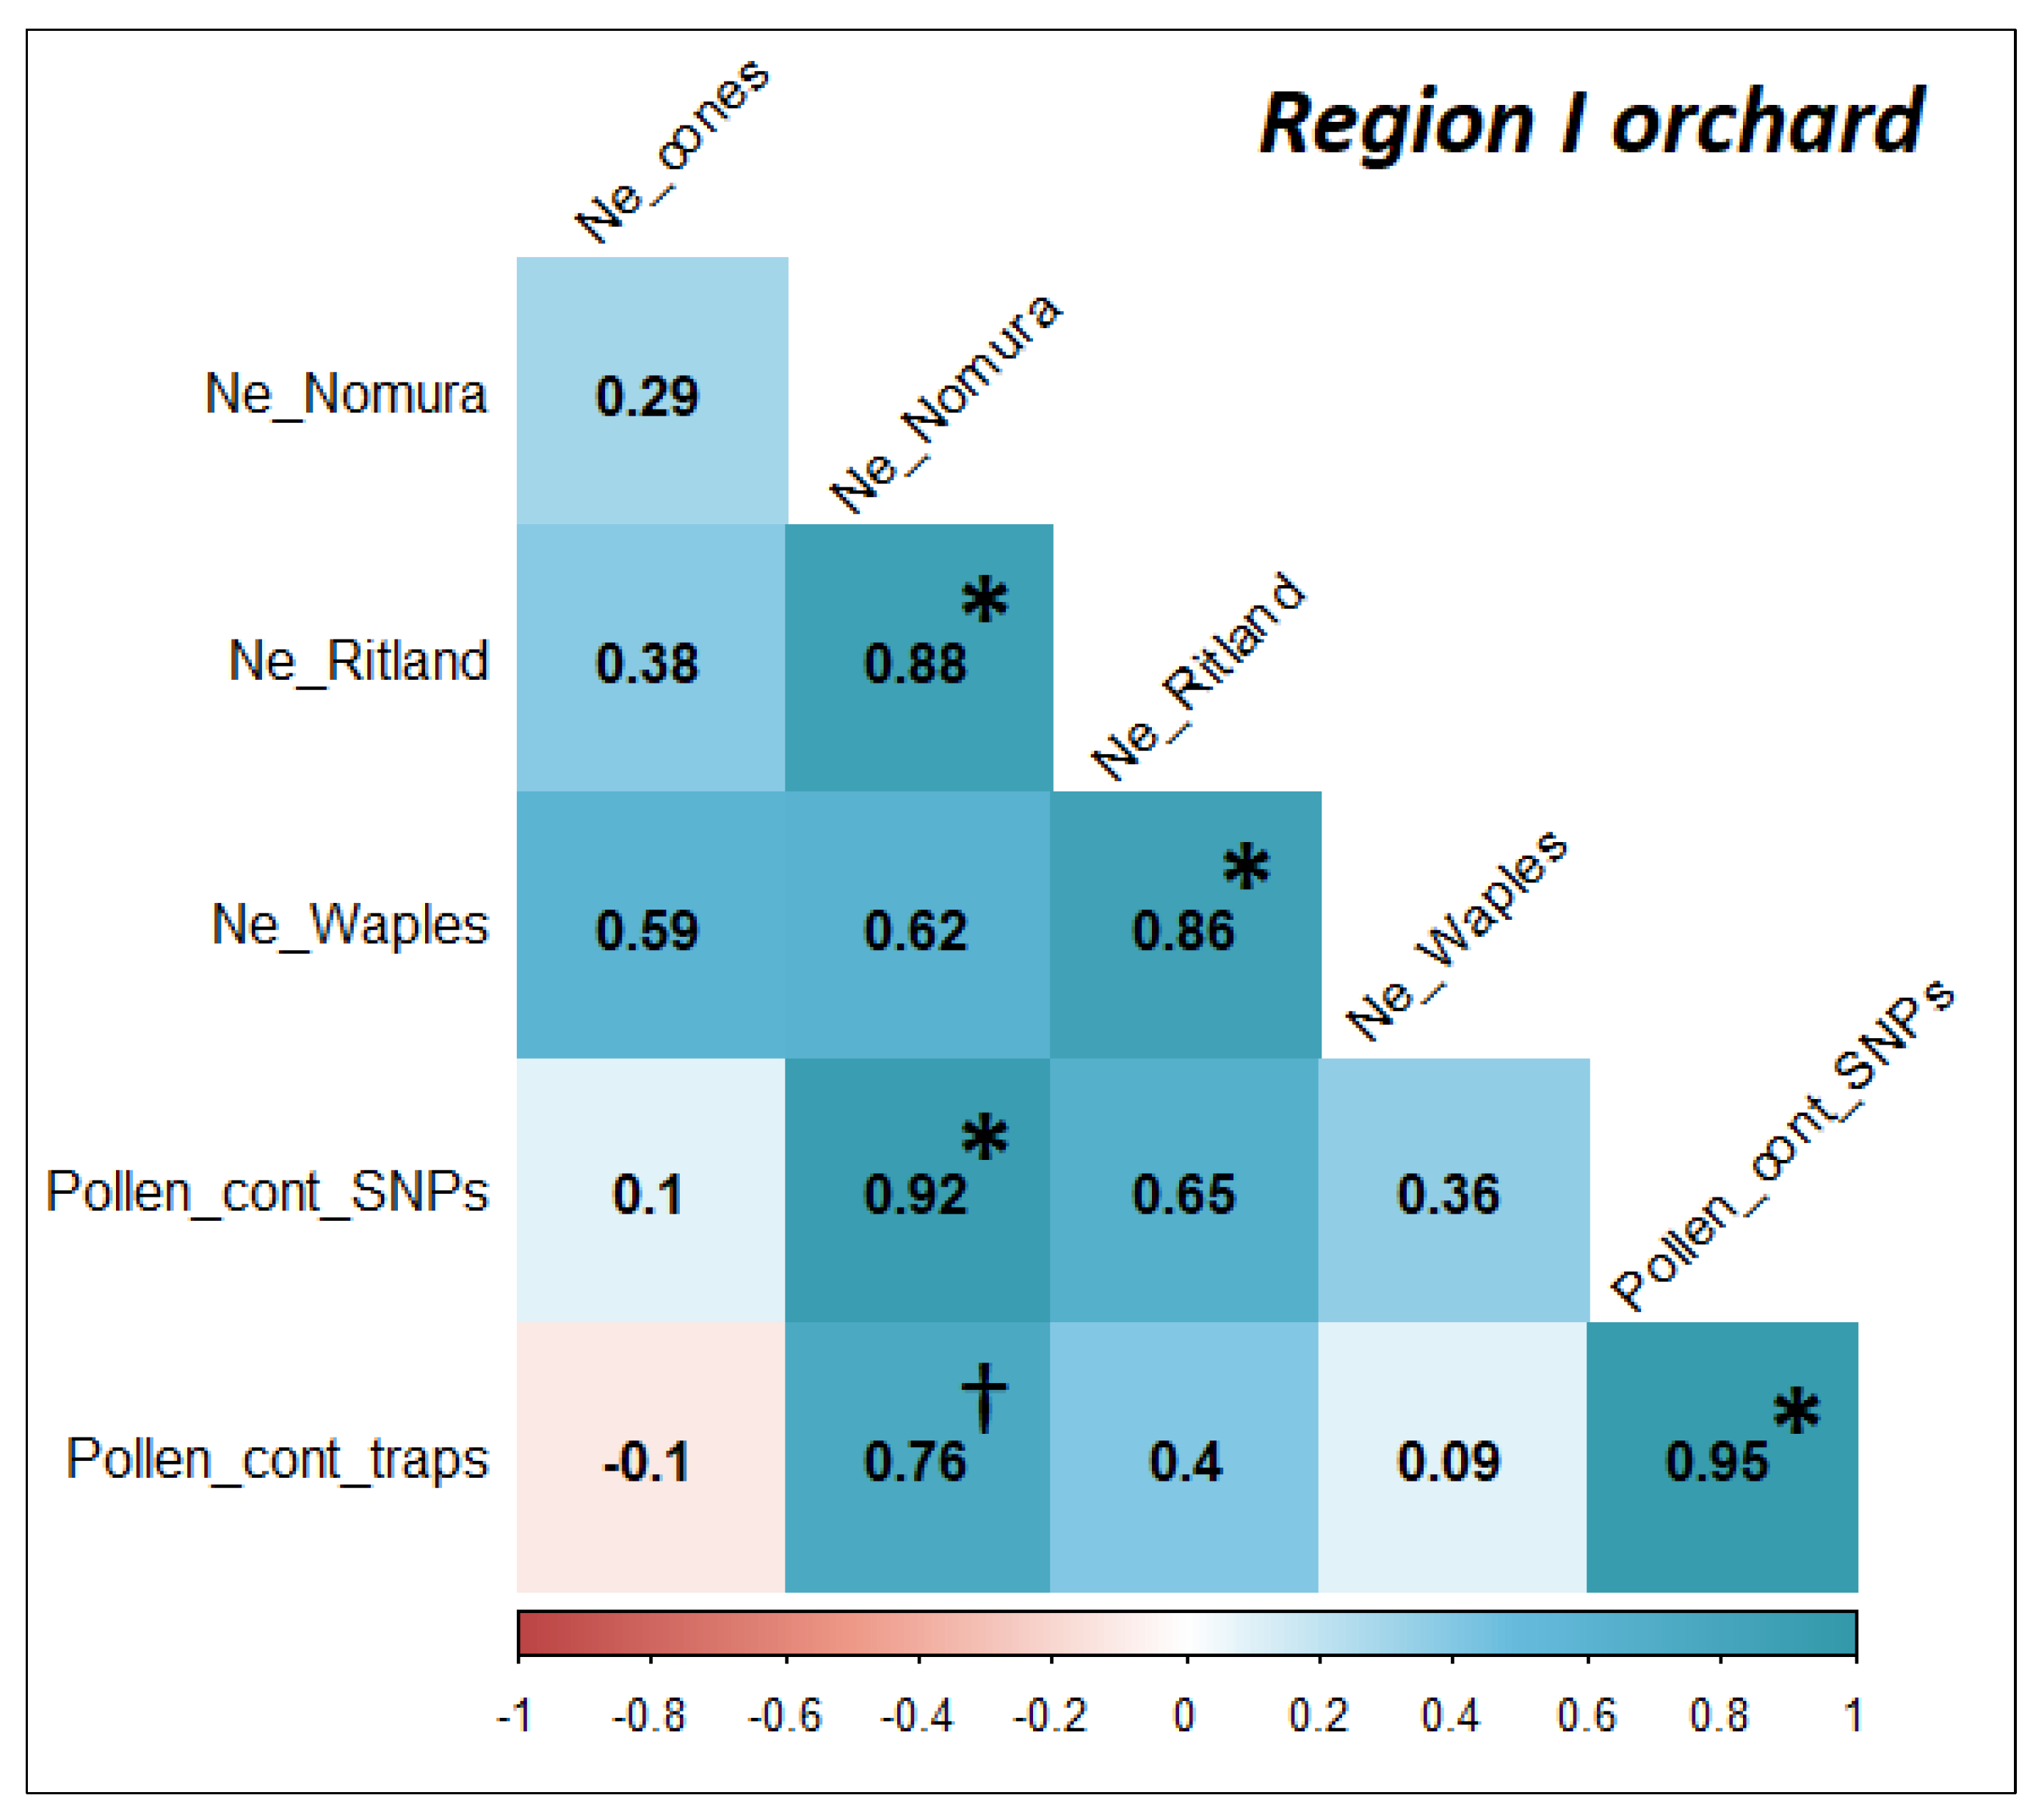
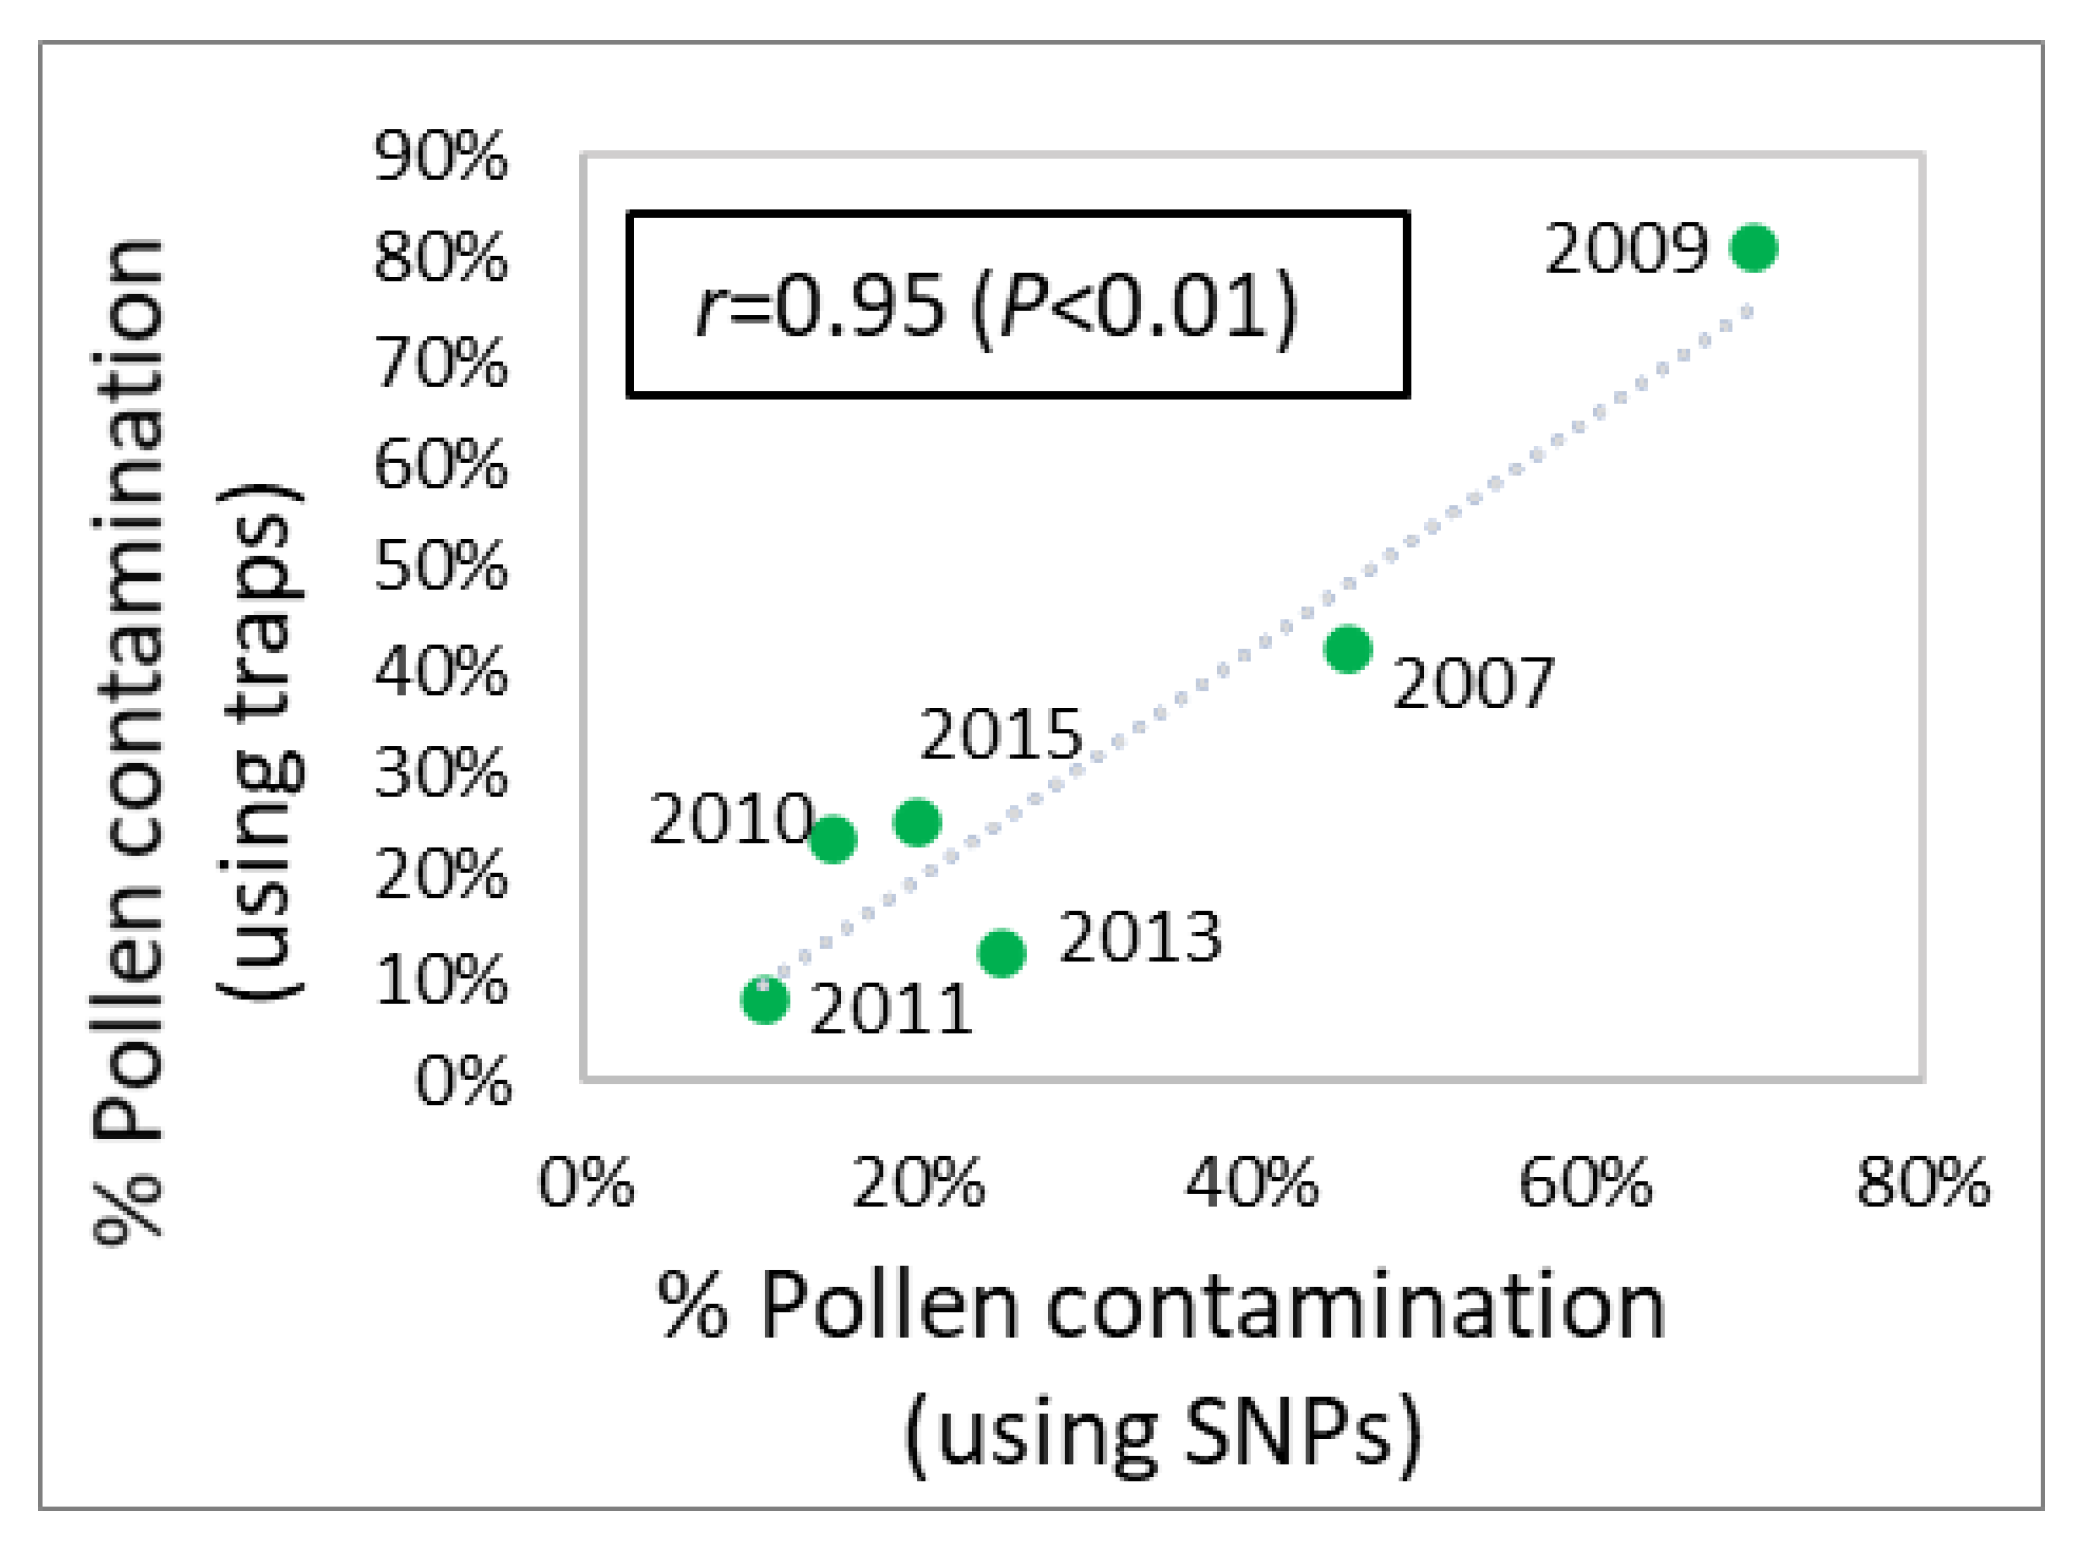
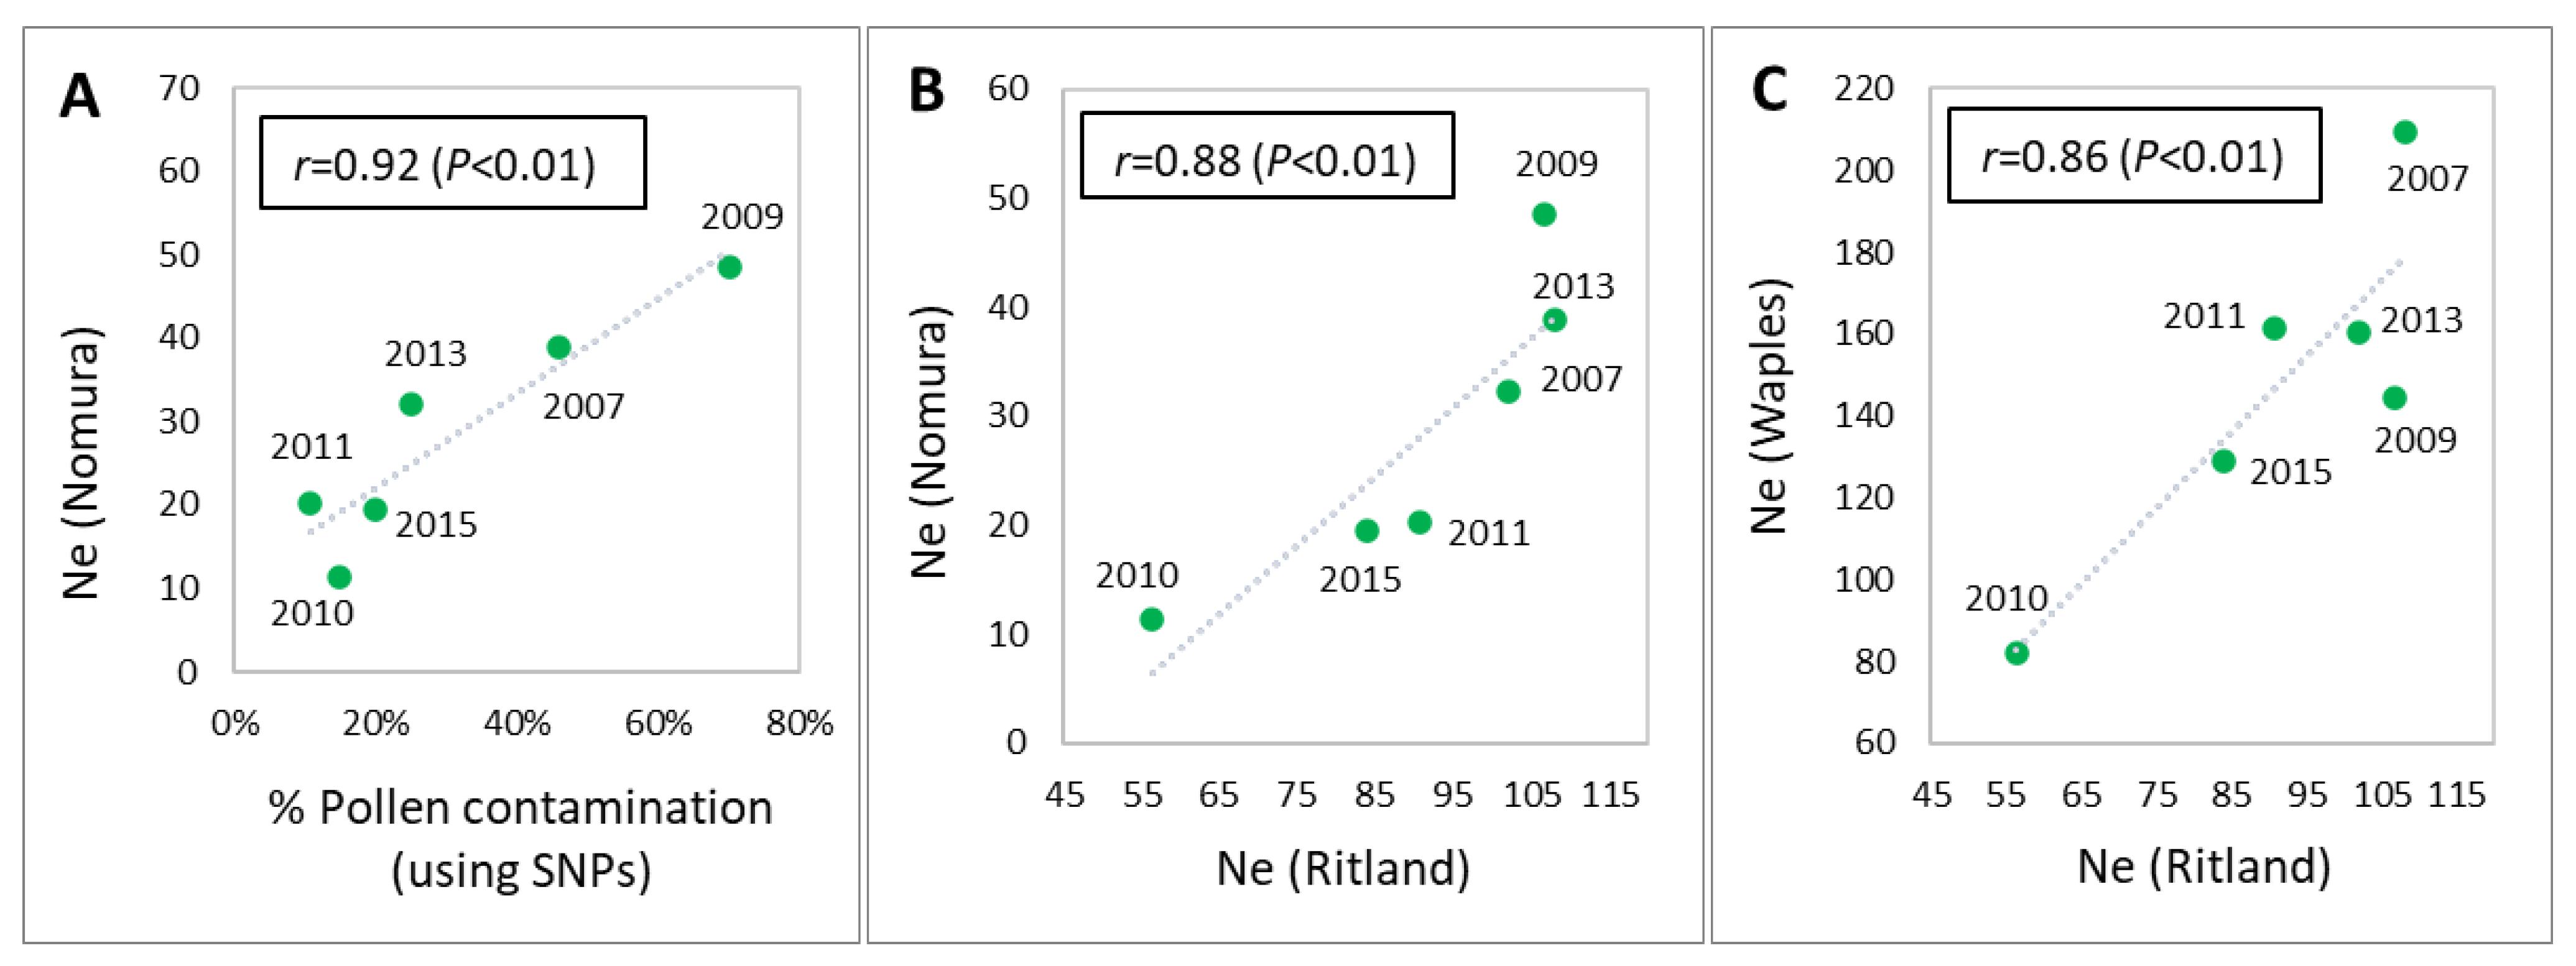
3.4. Pollen Contamination and Genetic Diversity

The levels of pollen contamination were between 11% and 70% (average 31%) among seedlots using SNPs and between 8% and 81% (average 32%) using pollen traps (Table 2). We found significant Pearson’s correlations between methods to estimate pollen contamination and Ne in seedlings from the white spruce Region I seed orchard (Figure 6). These two methods were used to estimate pollen contamination and showed a statistically significant Pearson’s correlation (at p < 0.05) for Region I (r = 0.95) (Figure 7). In addition, pollen contamination showed a strong correlation with Ne (Nomura) for Region I (r = 0.92) (Figure 8A), while Ne (Ritland) showed a strong correlation with Ne (Nomura) (Figure 8B) and Ne (Waples) (Figure 8C).

4. Discussion

The consideration of SNP information from parents in seed orchards, offspring in progeny trials, and seedlings from orchard seedlots in the genetic analysis of Alberta’s Region I white spruce breeding program provide valuable insights for future management. By leveraging the power of this genomic information, we were able to improve the estimation of variance components, allowing for more precise and reliable theoretical accuracies of breeding values (BVs). Simultaneously, the utilization of these SNP markers proved instrumental in the thorough evaluation of genetic diversity parameters, parental assignment accuracy, and estimates of pollen contamination levels. In summary, incorporating genomic information from both parents and offspring can allow forest geneticists and breeders to perform backward and forward selections with greater precision and confidence. The use of genomics tools has also enhanced our understanding of the seed orchard’s genetic structure, facilitating the selection of better seedlots for deployment and providing a more accurate estimation of the genetic worth of each orchard lot, ultimately leading to more accurate and potentially higher estimates of genetic gain.

4.1. Variance Components, Theoretical Accuracy, and Prediction of Breeding Values

The implementation of ssGBLUP resulted in a slight increase in the heritability estimates for both traits (HT20 and DBH20) analyzed compared to the pedigree-based ABLUP model, and a significant increase was observed compared to the genomic-based GBLUP model (Table 1). While the pedigree-based ABLUP approach has been widely used in tree breeding programs, the pedigree-genomic ssGBLUP estimations allow tree breeders to accurately rank the families’ performance after correcting the pedigree errors using the genomic relationship matrix (Figure 2 and Figure 3), even when the ABLUP and ssGBLUP genetic parameters are similar. The reliability of estimated genetic parameters is crucial for maximizing and obtaining realistic genetic gain estimates in tree breeding programs [14] and for breeders to make precise decisions regarding backward and forward selections. These results are consistent with the findings reported for growth traits in other tree species. For example, Cappa et al. [13], Thavamanikumar et al. [15], and Thumma et al. [36] observed similar patterns in Eucalyptus, while Ukrainetz and Mansfield [37] studied Pinus contorta, and Walker et al. [38] focused on Pinus taeda. On the other hand, investigations conducted on different tree species have also indicated that models incorporating genomic evaluation methods such as GBLUP or ssGBLUP resulted in comparable or reduced heritability estimates compared to models relying solely on pedigree-based information (ABLUP) [14,39,40]. Supporting these findings, a metadata analysis conducted by Beaulieu et al. [5] on conifer and broadleaf tree species showed that estimates obtained solely from pedigree information (ABLUP) were generally biased upward when compared to those obtained using GBLUP, though there were exceptions. Consequently, the authors recommend expanding the use of genomic selection approaches to obtain more accurate estimates of genetic parameters and gain in tree breeding populations.
The genetic parameters and heritabilities estimated in the genotyped trees in the current study (GBLUP model) were significantly lower compared to those estimated using all trees (ABLUP and ssGBLUP models) (Table 1). As shown in studies on Eucalyptus pellita and Picea glauca by Thavamanikumar et al. [15] and Nadeau [41], respectively, these differences could be related to the sampling bias caused by small sample sizes.
The incorporation of genomic information using the ssGBLUP approach serves as a genetic relationship bridge, connecting individuals and parents and facilitating improved information utilization during the BLUP analysis. This approach results in more reliable and accurate BVs, increasing the likelihood of correctly ranking selection candidates [12]. Our results consistently demonstrate the enhanced accuracy of predicted BVs for parents and offspring when employing ssGBLUP compared to both ABLUP and GBLUP approaches (Table 1). This enhanced accuracy is a direct reflection of observed incremental improvements in heritability estimates, as demonstrated by studies in Eucalyptus [13,15,36] and Pinus contorta [37]. The observed discrepancies in ranking accuracy between ABLUP and ssGBLUP further emphasize the need to reassess and update the choice of evaluation models in breeding programs. While breeding values estimated by both approaches showed a strong positive Spearman rank correlation in our study, the superiority of ssGBLUP became evident in identifying families with previously incorrect rankings (Figure 2 and Figure 3). These findings highlight the potential of ssGBLUP to overcome limitations associated with traditional ABLUP approaches, warranting further exploration and a more universal adoption in forest tree breeding programs. Finally, we wanted to evaluate if the small relatedness among founders and their distant additive relationships could improve the breeding value calculations (ssGBLUP*) (Figure 1). We found that there was no benefit in including the additional founders who are not parents of the genotyped offspring (Table 1) in the analysis.

4.2. Estimation of Genetic Diversity and Pollen Contamination with Appropriate Methods

Although the theory of random mating is usually not applicable in operational plant breeding [42], the G333 seed orchard under study showed a similar frequency of mothers and fathers contributing to seed (offspring) production across the years (Figure 4 and Figure S1) and a balanced mating dynamic (Figure 5). This result has also been observed in previous studies, such as in Pinus contorta [43], Platycladus orientalis [44], and Pseudotsuga menziesii [45]. Although we found consistent parental contributions to seeds produced by the G333 orchard across the years, other studies in spruce orchards have observed other trends. Recently, a sitka spruce (Picea sitchensis) seed orchard presented uneven contributions, and the authors attributed it to poor flowering [46]. In general, estimations of parental contributions in seed orchards using DNA markers are more precise than cone counting [18,47,48], which ultimately leads to better estimates of genetic gain. The pollen contamination values for Region I showed that using pollen traps (8%–81%) can under- or overestimate pollen contamination. In the Region G1 white spruce improvement program, under- and overestimations of pollen contamination using pollen traps (11%–100%) (Table S1) were also observed [18]. Consequently, exaggerated values at both ends of the spectrum of pollen contamination levels may affect the calculation of the genetic worth of seedlots coming from these orchards. Furthermore, using SNPs, significant Pearson correlations found for Region I were also observed in the Region G1 white spruce program between pollen contamination and Ne (Figure S2 and Figure S3) [18]. Although all Ne methods using SNPs were correlated with Region I and Region G1 white spruce programs, we suggest that tree breeders always use the same method to avoid bias. If counting cones and using pollen traps continue to be used to assess genetic diversity and pollen contamination, respectively, in these tree improvement programs, the correlation between these visual methods and those using genotyping should be verified to corroborate values. Finally, several studies have stressed the necessity of using SNP markers to ultimately estimate accurate Ne values [18,49,50,51,52,53].

4.3. Perspectives

This study focused on providing recommendations to our industrial partners regarding the utilization of genomic tools, providing new genomic-estimated BVs, and showing differences in the estimated levels of pollen contamination using visual versus genomic approaches through the genotyping of both parents and offspring (progeny trials and orchard seedlots). The objectives were two-fold as follows: (1) to enhance estimates of variance components and BV predictions through applying the ssGBLUP approach, and (2) to improve the assessment of pollen contamination and estimations of effective population size in the studied orchard. Furthermore, the matrix of genomic relationships allowed us to correct pedigree errors, which has been an ongoing problem in many programs (Table S2 and Table S3) and has become a more common practice among forest geneticists in recent years [22,54]. Overall, this work serves to both illustrate this process and offers guidance on how to obtain more accurate BV estimates and genetic diversity, facilitating the calculation of improved and more precise genetic gain for seed orchard seedlots. The pedigree correction using the G-matrix analysis recognized the misidentified individuals and was confined to only a few families (17 out of 70) (Table S3). These observations are of interest to tree breeders because they help plan future activities and allow managers to know where errors of identification can occur. For future research, we suggest genotyping more seeds from each seedlot and including additional years of production from Region I to evaluate if the number of offspring produced per cross could be different than the parental contributions found in this study. Finally, results from this study could aid in the effective planning of the next steps in Alberta’s tree improvement programs, encompassing both backward and forward selections and in the development of new 2nd and potentially 3rd generation orchards.

5. Conclusions

The ssGBLUP approach was successfully implemented in the genetic evaluation of the white spruce Region I breeding program, leading to improved genetic parameter estimates and BV predictions for height and diameter at age 20. By utilizing the genomic profiles of parents and seedling progeny from seed orchard seedlots, we observed consistent and stable genetic diversity in the G333 seed orchard over an eight-year period of production. In addition, the pedigree reconstruction of full-sib families from the G333 orchard seedlings across the six seedlots under study demonstrated equal contributions of mothers and fathers within the seed orchard. We also observed strong Pearson correlations between pollen contamination levels and the effective population size, which were estimated using molecular markers for Alberta’s white spruce Region I breeding program. This study encourages forest companies and orchard managers, in Alberta and elsewhere, to continue leveraging genomic tools to assess genetic diversity, estimate the levels of pollen contamination, reconstruct pedigrees, provide error correction, and obtain more accurate individual and parental predictions of BVs through modern approaches such as ssGBLUP.

Supplementary Materials

The following supporting information can be downloaded at: https://www.mdpi.com/article/10.3390/f14112212/s1, Figure S1: Maternal and paternal contributions in the Alberta Region I white spruce seed orchard based on six years of assessment; Figure S2: Pearson’s correlation matrices for the different pollen contamination assessments and effective population size (Ne) methods in the Alberta Region G1 white spruce seed orchard; Figure S3: Scatterplots showing linear trendlines, Pearson’s correlation, and p values for pollen contamination assessments and Ne using genomic profiles in the Alberta Region G1 white spruce seed orchard; Table S1: Genetic diversity parameters across seed orchard seedlots in the Alberta Region G1 white spruce seed orchard, using tree genomic profiles with a set of 2000 SNPs; Table S2: List of individual trees that were unrelated to any other genotyped tree in the progeny trial and were not part of any family (unrelated to any mother from the program); Table S3: List of individual trees that had a wrong family assignment. The diagnosis of these errors was made using the relationship coefficients from the original G-matrix following their expected values from the pedigree-based A-matrix.

Author Contributions

Conceptualization, E.G., J.B. and B.R.T.; methodology, E.G., E.P.C., J.B. and B.R.T.; formal analysis, E.G., E.P.C. and B.R.T.; data curation, E.G. and E.P.C.; writing—original draft, E.G. and E.P.C.; writing—review & editing, E.G., E.P.C., J.B. and B.R.T.; supervision, B.R.T.; project administration, B.R.T.; funding acquisition, B.R.T. All authors have read and agreed to the published version of the manuscript.

Funding

This manuscript was funded by the Industrial Research Chair in Tree Improvement held by B.R.T. and supported by the Natural Sciences and Engineering Research Council (NSERC), Alberta-Pacific Forest Industries Inc., Alberta Newsprint Company Timber Ltd., Canadian Forest Products Ltd., Huallen Seed Orchard Company Ltd., West Fraser Mills Ltd. (including Alberta Plywood, Blue Ridge Lumber Inc., Hinton Wood Products (HWP), Sundre Forest Products Inc.) and Weyerhaeuser Company Ltd. (Pembina Timberlands and Grande Prairie Timberlands).

Data Availability Statement

The data presented in this study are available on request from the corresponding author. The data are not publicly available due to privacy restrictions.

Acknowledgments

We acknowledge the Government of Alberta (Deogratias Rweyongeza and Andy Benowicz) for providing the genetic material from the G218 white spruce clone bank and the Breeding Values of Region I G354 Progeny Trial used in this study. We thank Kennedy Mitchell and Romy Suliteanu (Undergraduate Research Assistants from Thomas Lab, University of Alberta), Charlotte Ratcliff (Silviculture Supervisor, Canadian Forest Products Ltd.) for assisting in the sample collection in the field, and Stacy Bergheim (Coordinator, Thomas Lab, University of Alberta) for the sample collection in the greenhouse.

Conflicts of Interest

The authors declare no conflict of interest.

References

  1. Uffelmann, E.; Huang, Q.Q.; Munung, N.S.; de Vries, J.; Okada, Y.; Martin, A.R.; Martin, H.C.; Lappalainen, T.; Posthuma, D. Genome-Wide Association Studies. Nat. Rev. Methods Prim. 2021, 1, 59. [Google Scholar] [CrossRef]
  2. Meuwissen, T.H.E.; Hayes, B.J.; Goddard, M.E. Prediction of Total Genetic Value Using Genome-Wide Dense Marker Maps. Genetics 2001, 157, 1819–1829. [Google Scholar] [CrossRef] [PubMed]
  3. Borralho, N. The Impact of Individual Tree Mixed Models (BLUP) in Tree Breeding Strategies Eucalypt Plantations: Improving Fibre Yield and Quality. In Proceedings of the CRCTHF-IUFRO Conference, Hobart, Australia, 19–24 February 1995; pp. 141–145. [Google Scholar]
  4. Henderson, C.R. Applications of Linear Models in Animal Breeding; University of Guelph: Guelph, ON, Canada, 1984. [Google Scholar]
  5. Beaulieu, J.; Lenz, P.; Bousquet, J. Metadata Analysis Indicates Biased Estimation of Genetic Parameters and Gains Using Conventional Pedigree Information Instead of Genomic-Based Approaches in Tree Breeding. Sci. Rep. 2022, 12, 3933. [Google Scholar] [CrossRef] [PubMed]
  6. Grattapaglia, D.; Silva-Junior, O.B.; Resende, R.T.; Cappa, E.P.; Müller, B.S.F.; Tan, B.; Isik, F.; Ratcliffe, B.; El-Kassaby, Y.A. Quantitative Genetics and Genomics Converge to Accelerate Forest Tree Breeding. Front. Plant Sci. 2018, 871, 1693. [Google Scholar] [CrossRef] [PubMed]
  7. Beaulieu, J.; Doerksen, T.; Clément, S.; Mackay, J.; Bousquet, J. Accuracy of Genomic Selection Models in a Large Population of Open-Pollinated Families in White Spruce. Heredity 2014, 113, 343–352. [Google Scholar] [CrossRef] [PubMed]
  8. VanRaden, P.M. Efficient Methods to Compute Genomic Predictions. J. Dairy Sci. 2008, 91, 4414–4423. [Google Scholar] [CrossRef] [PubMed]
  9. Misztal, I.; Legarra, A.; Aguilar, I. Computing Procedures for Genetic Evaluation Including Phenotypic, Full Pedigree, and Genomic Information. J. Dairy Sci. 2009, 92, 4648–4655. [Google Scholar] [CrossRef]
  10. Christensen, O.; Lund, M. Genomic Relationship Matrix When Some Animals Are Not Genotyped. Genet. Sel. Evol. 2010, 42, 2. [Google Scholar] [CrossRef]
  11. Legarra, A.; Calenge, F.; Mariani, P.; Velge, P.; Beaumont, C. Use of a Reduced Set of Single Nucleotide Polymorphisms for Genetic Evaluation of Resistance to Salmonella Carrier State in Laying Hens. Poult. Sci. 2011, 90, 731–736. [Google Scholar] [CrossRef]
  12. Cappa, E.P.; El-Kassaby, Y.A.; Muñoz, F.; Garcia, M.N.; Villalba, P.V.; Klápště, J.; Marcucci Poltri, S.N. Improving Accuracy of Breeding Values by Incorporating Genomic Information in Spatial-Competition Mixed Models. Mol. Breed. 2017, 37, 125. [Google Scholar] [CrossRef]
  13. Cappa, E.P.; El-Kassaby, Y.A.; Muñoz, F.; Garcia, M.N.; Villalba, P.V.; Klápště, J.; Marcucci Poltri, S.N. Genomic-Based Multiple-Trait Evaluation in Eucalyptus Grandis Using Dominant DArT Markers. Plant Sci. 2018, 271, 27–33. [Google Scholar] [CrossRef] [PubMed]
  14. Ratcliffe, B.; El-Dien, O.G.; Cappa, E.P.; Porth, I.; Klápště, J.; Chen, C.; El-Kassaby, Y.A. Single-Step BLUP with Varying Genotyping Effort in Open-Pollinated Picea Glauca. G3 Genes Genomes Genet. 2017, 7, 935–942. [Google Scholar] [CrossRef] [PubMed]
  15. Thavamanikumar, S.; Arnold, R.J.; Luo, J.; Thumma, B.R. Genomic Studies Reveal Substantial Dominant Effects and Improved Genomic Predictions in an Open-Pollinated Breeding Population of Eucalyptus Pellita. G3 Genes Genomes Genet. 2020, 10, 3751–3763. [Google Scholar] [CrossRef] [PubMed]
  16. Callister, A.N.; Bradshaw, B.P.; Elms, S.; Gillies, R.A.W.; Sasse, J.M.; Brawner, J.T. Single-Step Genomic BLUP Enables Joint Analysis of Disconnected Breeding Programs: An Example with Eucalyptus Globulus Labill. G3 Genes Genomes Genet. 2021, 11, jkab253. [Google Scholar] [CrossRef] [PubMed]
  17. Kang, K.-S.; Bilir, N. Seed Orchards-Establishment, Management and Genetics; Kang, K.-S., Bilir, N., Eds.; The Foundation of Developing Forestry and Supporting Fire Protection Services: Altindag, Turkey, 2021; ISBN 978-975-93943-9-4. [Google Scholar]
  18. Galeano, E.; Bousquet, J.; Thomas, B.R. SNP-based Analysis Reveals Unexpected Features of Genetic Diversity, Parental Contributions and Pollen Contamination in a White Spruce Breeding Program. Sci. Rep. 2021, 11, 4990. [Google Scholar] [CrossRef] [PubMed]
  19. Wheeler, N.C.; Jech, K.S. The Use of Electrophoretic Markers in Seed Orchard Research. New For. 1992, 6, 311–328. [Google Scholar] [CrossRef]
  20. Sajid, M.; Ahmad, R.I.; Muhammad, A.R.; Zulfiqar, A.L.I.; Lori, H.; Tehseen, A.M. Role of SNPs in Determining QTLs for Major Traits in Cotton. J. Cott. Res. 2019, 2, 5. [Google Scholar]
  21. FGRMS. Alberta Forest Genetic Resource Management and Conservation Standards Volume 1: Stream 1 and Stream 2; FGRMS: Edmonton, AB, Canada, 2016; Volume 4, 165p. [Google Scholar]
  22. Lenz, P.R.N.; Nadeau, S.; Azaiez, A.; Gérardi, S.; Deslauriers, M.; Perron, M.; Isabel, N.; Beaulieu, J.; Bousquet, J. Genomic Prediction for Hastening and Improving Efficiency of Forward Selection in Conifer Polycross Mating Designs: An Example from White Spruce. Heredity 2020, 124, 562–578. [Google Scholar] [CrossRef]
  23. Isik, F.; Holland, J.; Maltecca, C. Genetic Data Analysis for Plant and Animal Breeding, 1st ed.; Isik, F., Holland, J., Maltecca, C., Eds.; Springer: Cham, Switzerland, 2017; ISBN 978-3-319-55175-3. [Google Scholar]
  24. Legarra, A.; Aguilar, I.; Misztal, I. A Relationship Matrix Including Full Pedigree and Genomic Information. J. Dairy Sci. 2009, 92, 4656–4663. [Google Scholar] [CrossRef]
  25. Aguilar, I.; Misztal, I.; Johnson, D.L.; Legarra, A.; Tsuruta, S.; Lawlor, T.J. Hot Topic: A Unified Approach to Utilize Phenotypic, Full Pedigree, and Genomic Information for Genetic Evaluation of Holstein Final Score. J. Dairy Sci. 2010, 93, 743–752. [Google Scholar] [CrossRef]
  26. Gezan, S.A.; de Oliveira, A.A.; Galli, G.; Murray, D. ASRgenomics: An R Package with Complementary Genomic Functions; The Comprehensive R Archive Network: Vienna, Australia, 2022. [Google Scholar]
  27. Butler, D.G.; Cullis, B.R.; Gilmour, A.R.; Gogel, B.J.; Thompson, R. ASReml-R Reference Manual Version 4; The Comprehensive R Archive Network: Vienna, Australia, 2017. [Google Scholar]
  28. Gilmour, A.R.; Thompson, R.; Cullis, B.R. Average Information REML: An Efficient Algorithm for Variance Parameter Estimation in Linear Mixed Models. Biometrics 1995, 51, 1440–1450. [Google Scholar] [CrossRef]
  29. Peakall, R.; Smouse, P.E. GenALEx 6.5: Genetic Analysis in Excel. Population Genetic Software for Teaching and Research—An Update. Bioinformatics 2012, 28, 2537–2539. [Google Scholar] [CrossRef] [PubMed]
  30. Lindgren, D.; Mullin, T.J. Relatedness and Status Number in Seed Orchard Crops. Can. J. For. Res. 1998, 28, 276–283. [Google Scholar] [CrossRef]
  31. Ritland, K. Estimators for Pairwise Relatedness and Individual Inbreeding Coefficients. Genet. Res. 1996, 67, 175–185. [Google Scholar] [CrossRef]
  32. Nomura, T. Estimation of Effective Number of Breeders from Molecular Coancestry of Single Cohort Sample. Evol. Appl. 2008, 1, 462–474. [Google Scholar] [CrossRef]
  33. Do, C.; Waples, R.S.; Peel, D.; Macbeth, G.M.; Tillett, B.J.; Ovenden, J.R. NeEstimator v2: Re-Implementation of Software for the Estimation of Contemporary Effective Population Size (Ne) from Genetic Data. Mol. Ecol. Resour. 2014, 14, 209–214. [Google Scholar] [CrossRef] [PubMed]
  34. Waples, R.S. A Bias Correction for Estimates of Effective Population Size Based on Linkage Disequilibrium at Unlinked Gene Loci. Conserv. Genet. 2006, 7, 167–184. [Google Scholar] [CrossRef]
  35. Kalinowski, S.T.; Taper, M.L.; Marshall, T.C. Revising How the Computer Program CERVUS Accommodates Genotyping Error Increases Success in Paternity Assignment. Mol. Ecol. 2007, 16, 1099–1106. [Google Scholar] [CrossRef]
  36. Thumma, B.R.; Joyce, K.R.; Jacobs, A. Genomic Studies with Preselected Markers Reveal Dominance Effects Influencing Growth Traits in Eucalyptus Nitens. G3 Genes Genomes Genet. 2022, 12, jkab363. [Google Scholar] [CrossRef]
  37. Ukrainetz, N.K.; Mansfield, S.D. Prediction Accuracy of Single-Step BLUP for Growth and Wood Quality Traits in the Lodgepole Pine Breeding Program in British Columbia. Tree Genet. Genomes 2020, 16, 64. [Google Scholar] [CrossRef]
  38. Walker, T.D.; Cumbie, W.P.; Isik, F. Single-Step Genomic Analysis Increases the Accuracy of Within-Family Selection in a Clonally Replicated Population of Pinus taeda L. For. Sci. 2022, 68, 37–52. [Google Scholar] [CrossRef]
  39. Gamal El-Dien, O.; Ratcliffe, B.; Klápště, J.; Chen, C.; Porth, I.; El-Kassaby, Y.A. Prediction Accuracies for Growth and Wood Attributes of Interior Spruce in Space Using Genotyping-by-Sequencing. BMC Genom. 2015, 16, 370. [Google Scholar] [CrossRef] [PubMed]
  40. Lenz, P.R.N.; Beaulieu, J.; Mansfield, S.D.; Clément, S.; Desponts, M.; Bousquet, J. Factors Affecting the Accuracy of Genomic Selection for Growth and Wood Quality Traits in an Advanced-Breeding Population of Black Spruce (Picea mariana). BMC Genom. 2017, 18, 335. [Google Scholar] [CrossRef] [PubMed]
  41. Nadeau, S.; Beaulieu, J.; Gezan, S.A.; Perron, M.; Bousquet, J.; Lenz, P.R.N. Increasing Genomic Prediction Accuracy for Unphenotyped Full- Sib Families by Modeling Additive and Dominance Effects with Large Datasets in White Spruce. Front. Plant Sci. 2023, 14, 1137834. [Google Scholar] [CrossRef] [PubMed]
  42. Bernardo, R. Reinventing Quantitative Genetics for Plant Breeding: Something Old, Something New, Something Borrowed, Something BLUE. Heredity 2020, 2020, 24. [Google Scholar] [CrossRef] [PubMed]
  43. Funda, T.; Liewlaksaneeyanawin, C.; El-Kassaby, Y.A. Determination of Paternal and Maternal Parentage in Lodgepole Pine Seed: Full versus Partial Pedigree Reconstruction. Can. J. For. Res. 2014, 44, 1122–1127. [Google Scholar] [CrossRef]
  44. Huang, L.S.; Song, J.; Sun, Y.Q.; Gao, Q.; Jiao, S.Q.; Zhou, S.S.; Jin, Y.; Yang, X.L.; Zhu, J.J.; Gao, F.L.; et al. Pollination Dynamics in a Platycladus Orientalis Seed Orchard as Revealed by Partial Pedigree Reconstruction. Can. J. For. Res. 2018, 48, 952–957. [Google Scholar] [CrossRef]
  45. Korecký, J.; El-Kassaby, Y.A. Pollination Dynamics Variation in a Douglas-Fir Seed Orchard as Revealed by Microsatellite Analysis. Silva Fenn. 2016, 50, 808. [Google Scholar] [CrossRef]
  46. Finžgar, B.D.; Ennos, R.; Whittet, R.; Cottrell, J. Measuring and Managing Genetic Diversity in the British Sitka Spruce Improvement Programme. Scott. For. 2023, 77, 38–44. [Google Scholar]
  47. El-Kassaby, Y.A.; Funda, T.; Lai, B.S.K. Female Reproductive Success Variation in a Pseudotsuga menziesii Seed Orchard as Revealed by Pedigree Reconstruction from a Bulk Seed Collection. J. Hered. 2010, 101, 164–168. [Google Scholar] [CrossRef]
  48. Funda, T.; Liewlaksaneeyanawin, C.; Fundova, I.; Lai, B.S.K.; Walsh, C.; van Niejenhuis, A.; Cook, C.; Graham, H.; Woods, J.; El-Kassaby, Y.A. Congruence between Parental Reproductive Investment and Success Determined by DNA-Based Pedigree Reconstruction in Conifer Seed Orchards. Can. J. For. Res. 2011, 41, 380–389. [Google Scholar] [CrossRef]
  49. Luikart, G.; Ryman, N.; Tallmon, D.A.; Schwartz, M.K.; Allendorf, F.W. Estimation of Census and Effective Population Sizes: The Increasing Usefulness of DNA-Based Approaches. Conserv. Genet. 2010, 11, 355–373. [Google Scholar] [CrossRef]
  50. Hough, J.; Williamson, R.J.; Wright, S.I. Patterns of Selection in Plant Genomes. Annu. Rev. Ecol. Evol. Syst. 2013, 44, 31–49. [Google Scholar] [CrossRef]
  51. Jónás, Á.; Taus, T.; Kosiol, C.; Schlötterer, C.; Futschik, A. Estimating the Effective Population Size from Temporal Allele Frequency Changes in Experimental Evolution. Genetics 2016, 204, 723–735. [Google Scholar] [CrossRef] [PubMed]
  52. Wang, J.; Santiago, E.; Caballero, A. Prediction and Estimation of Effective Population Size. Heredity 2016, 117, 193–206. [Google Scholar] [CrossRef] [PubMed]
  53. Trask, A.E.; Bignal, E.M.; McCracken, D.I.; Piertney, S.B.; Reid, J.M. Estimating Demographic Contributions to Effective Population Size in an Age-Structured Wild Population Experiencing Environmental and Demographic Stochasticity. J. Anim. Ecol. 2017, 86, 1082–1093. [Google Scholar] [CrossRef]
  54. Bousquet, J.; Gérardi, S.; de Lafontaine, G.; Jaramillo-Correa, J.P.; Pavy, N.; Prunier, J.; Lenz, P.; Beaulieu, J. Spruce Population Genomics. In Population Genomics; Rajora, O.P., Ed.; Springer: Cham, Switzerland, 2021; pp. 1–64. [Google Scholar]
Figure 1. Schematic sampling design of the Region I tree improvement program in Alberta including the number of trees genotyped, and analysis workflow resulting in four best linear unbiased predictions (BLUP), pollen contamination estimates and effective population size calculations. The years for each population’s establishment are included. The site selected among the five progeny trials for the genotyping is underlined and bold (E) in the figure. The ssGBLUP and ssGBLUP* included 42 and 166 parents in the estimation of the different genetic components, respectively (please see Section 2).
Forests 14 02212 g001
Figure 2. Predicted breeding values (BVs) for the 306 open-pollinated families of the Alberta Region I white spruce breeding program for height at 20 years (HT20). Breeding values (BV) for height at age 20 (HT20) obtained using the ssGBLUP (black dots) and ABLUP (red dots) models were ordered from lowest to highest based on the ssGBLUP analysis. Selected families with a different ranking between ssGBLUP and ABLUP are highlighted in red squares. Spearman’s rank correlation coefficient (ρ) between analyses is also shown. The estimated breeding values (in centimeters) were transformed to % gain using the mean of all BVs.
Forests 14 02212 g002
Figure 3. Predicted breeding values (BVs) for the 306 open-pollinated families of the Alberta Region I white spruce breeding program for diameter at breast height at 20 years (DBH20). Breeding values (BV) for the diameter at breast height at age 20 (DBH20) obtained using the ssGBLUP (black dots) and ABLUP (red dots) models were ordered from lowest to highest based on the ssGBLUP analysis. Selected families with a different ranking between ssGBLUP and ABLUP are highlighted in red squares. Spearman’s rank correlation coefficient (ρ) between analyses is also shown. The estimated breeding values (in centimeters) were transformed to % gain using the mean of all BVs.
Forests 14 02212 g003
Figure 4. Frequency of parental contributions in the Alberta Region I white spruce G333 seed orchard based on six years of assessment. Frequency histogram based on 514 seedlings and 166 parents for the years 2007, 2009, 2010, 2011, 2013, 2015. The graphic includes five class intervals for the number of offspring (x-axis) and the number of known mothers and known fathers contributing with offspring (y-axis) as the sum of the frequency across all years. Parents were inferred using the software CERVUS 3.0.7 (Field Genetics Ltd., Edinburgh, UK).
Forests 14 02212 g004
Figure 5. Three-dimensional representation of the mating dynamics in the Alberta Region I white spruce G333 seed orchard based on six years of assessment. Five hundred and fourteen seedlings and 166 parents for the years 2007, 2009, 2010, 2011, 2013, and 2015 were included in this figure. The figure includes all known mothers and known fathers contributing to offspring. Each line represents a full-sib family, represented with a unique color.
Forests 14 02212 g005
Figure 6. Pearson’s correlation matrices for the different pollen contamination assessments and effective population size (Ne) methods in the Alberta Region I white spruce seed orchard. Pollen contamination was estimated using traps (monitors) and SNPs (genomic profiles) (see Section 2). The Ne methods are Nomura, Ritland, Waples, and cones (Ritland 1996; Waples 2006; Nomura 2008; FGRMS 2016; see Section 2). The asterisks (*) indicate statistically significant values at p < 0.01, and the cross (†) indicates statistically significant values at p < 0.05.
Forests 14 02212 g006
Figure 7. Scatterplot showing the linear trend line, Pearson’s correlation, and p value for the pollen contamination assessment using SNPs vs. traps in the Alberta Region I white spruce seed orchard. The green dots denote the different seedlot years.
Forests 14 02212 g007
Figure 8. Scatterplots showing linear trend lines, Pearson’s correlations, and p values for the pollen contamination assessments and Ne using genomic profiles in the Alberta Region I white spruce seed orchard. (A) Pollen contamination using SNPs vs. Ne (Nomura), (B) Ne (Ritland) vs. Ne (Nomura), (C) Ne (Ritland) vs. Ne (Waples) (Ritland 1996; Waples 2006; Nomura 2008; see Section 2). The green dots denote the different seedlot years.
Forests 14 02212 g008
Table 1. Estimates of additive genetic variance ( σ ^ a 2 ), residual variance ( σ ^ e 2 ), heritability estimates ( h ^ 2 ), and the average theoretical accuracy of the breeding values ( A c c ¯ ) for height (HT20) and diameter at breast height (DBH20) at 20 years old for the Alberta Region I white spruce breeding program across the 4 genetic models evaluated. ABLUP used the pedigree-based A-matrix, the GBLUP model used the G-matrix, ssGBLUP used the hybrid H-matrix, which was obtained using 42 genotyped parents, and ssGBLUP* used the hybrid H-matrix, which was obtained using 166 genotyped parents. The GBLUP, ABLUP, and ssGBLUP were estimated after performing the 111 pedigree corrections and 25 removals. Standard errors are denoted in parenthesis. The minimum and maximum values of theoretical accuracies for mother and progeny are denoted in square brackets.
ParameterGBLUPABLUPssGBLUPssGBLUP*
Total No. of parents42306306306
No. of parents genotyped42--42166
No. of progeny667865886588658
Total number709897489748974
HT20
σ ^ a 2 1517.8 (1590.4)6682.6 (481.7)7015.9 (487.3)6863.7 (481.5)
σ ^ e 2 8077.2 (1264.3)6703.9 (373.2)6557.3 (372.2)6604.9 (368.4)
h ^ 2 0.16 (0.16)0.49 (0.03)0.52 (0.03)0.51 (0.03)
A c c ¯  mothers0.43 [0.37–0.51]0.90 [0.90–0.90]0.91 [0.72–0.95]0.91 [0.71–0.95]
A c c ¯  progeny0.39 [0.21–0.47]0.74 [0.73–0.75]0.76 [0.74–0.81]0.75 [0.74–0.80]
DBH20
σ ^ a 2 0.48 (0.3)2.75 (0.2)2.86 (0.2)2.78 (0.2)
σ ^ e 2 3.67 (0.4)2.79 (0.2)2.77 (0.2)2.79 (0.2)
h ^ 2 0.12 (0.07)0.49 (0.03)0.51 (0.03)0.50 (0.03)
A c c ¯  mothers0.55 [0.49–0.58]0.90 [0.90–0.90]0.90 [0.72–0.95]0.91 [0.71–0.95]
A c c ¯  progeny0.42 [0.32–0.49]0.74 [0.73–0.75]0.76 [0.74–0.81]0.75 [0.74–0.80]
Table 2. Genetic diversity parameters across groups (founders, seed orchard seedlots, and progeny trial trees) in the Alberta Region I white spruce seed orchard, using tree genomic profiles with a set of 2000 SNPs. S2007 = seedlot from 2007, S2009 = seedlot from 2009, S2010 = seedlot from 2010, S2011 = seedlot from 2011, S2013 = seedlot from 2013, S2015 = seedlot from 2015, Prog. trial = progeny trial. A = average number of alleles per SNP, I = Shannon Index, He = expected heterozygosity, Ho = observed heterozygosity, Fi = inbreeding coefficient, Ne = effective population size calculated with four different methods (Ritland 1996; Waples 2006; Nomura 2008; FGRMS 2016; see Section 2). Pollen cont. = pollen contamination calculated using SNPs and traps (see Section 2). SE = standard error. na = not available.
ParameterFoundersS2007S2009S2010S2011S2013S2015Prog. Trial
N166120180120120120120667
AMean1.991.991.991.981.981.991.982
(SE)(0.001)(0.002)(0.001)(0.004)(0.003)(0.003)(0.004)(0.001)
IMean0.440.440.440.440.440.440.440.45
(SE)(0.006)(0.006)(0.006)(0.006)(0.006)0.006)(0.006)(0.006)
HeMean0.290.280.280.280.280.280.280.29
(SE)(0.004)(0.004)(0.004)(0.004)(0.004)(0.004)(0.004)(0.005)
HoMean0.290.290.290.280.290.280.280.29
(SE)(0.004)(0.003)(0.004)(0.005)0.005)(0.005)(0.005)(0.005)
FiMean0.0010.0070.004−0.0030.0030.0050.012−0.002
(SE)(0.002)(0.002)(0.002)(0.002)0.002)(0.002)(0.002)(0.002)
Ne (Ritland)Mean333.33108.02106.7556.3890.59101.9784.02301.93
Ne (Nomura)Mean180.2438.948.511.320.232.219.585.21
(SE)(19.36)(5.05)(4.03)(2.06)(3.57)(3.39)(2.93)(10.12)
Ne (Waples)Mean570.82209.5144.481.8161.6160.4128.9358.27
(SE)(126.61)(51.25)(35.79)(20.51)38.49)(37.98)(29.89)(84.31)
Ne (cones)Meanna83.959.859.979.972.328.59na
Pollen cont. (SNPs)Meanna45.8%70.0%15.0%10.8%25.0%20.0%na
Pollen cont. (traps)Meanna42.1%81.0%23.7%7.8%12.3%25.2%na
Disclaimer/Publisher’s Note: The statements, opinions and data contained in all publications are solely those of the individual author(s) and contributor(s) and not of MDPI and/or the editor(s). MDPI and/or the editor(s) disclaim responsibility for any injury to people or property resulting from any ideas, methods, instructions or products referred to in the content.

