Article

Transcriptome Analysis and Novel EST-SSR Marker Development for Pinus tabuliformis Seedlings from Four Provenances

1
College of Forestry, Inner Mongolia Agricultural University, Hohhot 010018, China
2
Wanjiagou Management Station of Hohhot Branch, Inner Mongolia Daqingshan Nature Reserve Management Bureau, Hohhot 010100, China
*
Author to whom correspondence should be addressed.
Forests 2023, 14(9), 1810; https://doi.org/10.3390/f14091810
Submission received: 31 July 2023 / Revised: 31 August 2023 / Accepted: 1 September 2023 / Published: 5 September 2023
(This article belongs to the Special Issue Molecular Markers in Forest Management and Tree Breeding)

Abstract

:
Chinese pine (Pinus tabuliformis) is a conifer species endemic to the temperate, warm temperate, and semi-arid regions of China. It has important ecological and economic values, but lacks suitable molecular markers for genetic studies. In this study, we collected open-pollinated progeny seeds from four provenances: Ningcheng (Nc), Qinyuan (Qy), Weichang (Wc), and Pingquan (Pq). We sequenced the transcriptomes of open-pollinated progeny seedlings from four provenances and annotated 18,244 unigenes. We analyzed the expression of genes involved in the auxin indole-3-acetic acid (IAA), cytokinin (CTK), and gibberellin (GA) signaling pathways among the provenances. Additionally, we detected 2811 expressed sequence tag simple sequence repeat (EST-SSR) loci in 2360 unigenes, with a frequency of 14.83% and an average of one locus per 14,556 base pairs (bp). We developed 10 polymorphic primers from 67 pairs and tested them on 56 samples from the four provenances. These primers exhibited moderate to high polymorphism and distinguished all samples clearly. Our study reveals variation in growth and development among open-pollinated progeny seedlings from different provenances of Chinese pine and provides novel markers for its genetic diversity study and marker-assisted breeding.

1. Introduction

Chinese pine (Pinus tabuliformis) is a conifer species endemic to the temperate, warm temperate, and semi-arid regions of China. It has crucial roles in terrestrial ecosystems and the forestry economy [1]. However, suitable genetic markers for seed orchard studies of this species are scarce. Previous studies have focused on its growth and development [2,3,4], drought stress response [5], and genetic diversity [6].
The growth and development of Chinese pine seedlings are important for its afforestation and application. Studying the growth differences of open-pollinated progeny seedlings from different provenance regions can provide theoretical and practical guidance for selecting and breeding high-quality seedlings for afforestation. Previous studies have shown that various hormones play key roles in the growth of Chinese pine seedlings. Li et al. [2] studied the requirement of gibberellin (GA) signaling for far-red light-induced bud elongation and explored the morphological and transcriptomic changes induced by a low red to far-red ratio (R:FR), GAs, and GA biosynthesis inhibitor paclobutrazol (PAC). Guo et al. [4] performed transcriptomic and proteomic analyses of the far-red light effect on stem elongation in the presence or absence of PAC and investigated the molecular mechanism of FR-regulated stem elongation under PAC treatment. Zhang et al. [3] studied the plant hormone spectrum and related gene expression after megagametophyte release in developing male cones and analyzed the endogenous hormones and their related genes, verifying the important role of abscisic acid (ABA) in plant growth and development.
Simple sequence repeat (SSR) markers are useful for improving breeding programs of Chinese pine seed orchards, but they are scarce. DNA molecular markers have been widely used in plant genetic diversity analysis, germplasm identification, gene mapping of important agronomic traits, and marker-assisted breeding [7]. Among different types of molecular markers such as RAPD (randomly amplified polymorphic DNA), ISSR (inter-simple sequence repeat), SCAR (sequence characterized amplified regions), and SSR [8,9,10], SSR markers are ideal tools for constructing genetic linkage maps, genetic diversity analyses, pedigree analyses, molecular marker screening for target traits, etc., due to their co-dominance, high repeatability, and high polymorphism [11,12,13]. Expressed sequence tag (EST)-SSR primers derived from highly conserved gene coding regions are applicable within and across species [9,14]. With continuous reductions in time and cost of deep sequencing and high-throughput methods, second-generation sequencing has been proven to be a powerful method for SSR identification [15]. Therefore, large-scale and efficient high-throughput transcriptome mining gene SSRs are considered to be the most suitable technology [15,16,17,18,19,20]. SSRs play an important role in Chinese pine seed orchard research. For example, Pan et al. [20] verified the applicability and transferability of EST-SSR markers developed by Chinese pine transcriptome sequencing in its related species Pinus koraiensis for genetic diversity analysis. Yang et al. [21] performed second-generation sequencing on Chinese pine samples from Pingquan City, Hebei Province, China, screened some SSR markers from the obtained transcriptome data, and further used them to evaluate the genetic diversity of each generation in seed orchards. However, the currently developed EST-SSR markers for Chinese pine are still very limited.
To accelerate the breeding process and shorten the breeding cycle of Chinese pine seed orchards, this study collected the open-pollinated progeny seeds from four provenance regions: Ningcheng (Nc), Qinyuan (Qy), Pingquan (Pq), and Weichang (Wc). A transcriptome sequencing analysis and an expression analysis of genes involved in growth-related pathways were performed on the progeny seedlings. Moreover, new SSR markers were developed from the transcriptome data and their applicability was evaluated. This study provided a basis for exploring the differences in growth and development among open-pollinated progeny seedlings from different regions of Chinese pine seed orchards and for conducting genetic diversity analyses.

2. Materials and Methods

2.1. Plant Materials

We obtained seeds from four provenances of Pinus tabuliformis progeny trees in the Wanjia Gully seed orchard, Tuzuo Banner, Inner Mongolia Autonomous Region, China (110°09′ E, 40°41′ N). The four provenances were Nc (Ningcheng County, Inner Mongolia Autonomous Region, China, 118°40′ E, 41°22′ N), Pq (Pingquan City, Hebei Province, China, 118°21′ E, 40°55′ N), Qy (Qinyuan County, Shanxi Province, China, 112°02′′ E, 36°40′ N), Wc (Weichang Manchu and Mongolian Autonomous County, Chengde City, Hebei Province, China, 117°25′ E, 42°05′ N). From each provenance area, we selected a tree that had been naturally pollinated and collected a minimum of 200 seeds per tree. We selected ten intact seeds from four individual trees, soaked them in warm water for 12 h, and sowed them in vermiculite-filled nutrient pots. After incubating for approximately 15 days at 29 ± 1 °C, we used the 15-day-old seedlings from the four provenances for RNA sequencing. We assessed the polymorphism of SSR primers by testing 56 trees from four provenances: Nc (n = 14), Pq (n = 12), Qy (n = 14), and Wc (n = 16). Table S1 shows the planting age and origin of each tree.

2.2. RNA and DNA Extraction

We pooled tender needles from four representative seedlings of each provenance as one group for RNA sequencing samples (Figure S1), which were sequenced and analyzed by Beijing Qingke Biotechnology Co., Ltd., (Beijing, China). The tissue samples were treated with TRIzol Reagent (Invitrogen, Carlsbad, CA, USA) to isolate total RNA, which was then purified from genomic DNA by DNase I (TaKara, Shiga, Japan). We extracted genomic DNA following the plant DNA extraction kit instructions from Tiangen (Beijing, China), and measured the concentration and purity using a Nanodrop 2000 spectrophotometer and an Agilent 2100 bioanalyzer.

2.3. Transcriptome Sequencing, Assembly, and Gene Annotation

We constructed the RNA-seq libraries using a TruSeq Stranded mRNA Library Prep Kit (Illumina, San Diego, CA, USA) following the manufacturer’s protocol. Poly-A mRNA was isolated from total RNA using oligo-dT magnetic beads, and then fragmented by divalent cations at elevated temperature. First-strand cDNA was synthesized from the fragmented RNA using random primers and SuperScript II reverse transcriptase (Invitrogen, USA). Then, second-strand cDNA was generated using DNA Polymerase I and RNase H. The cDNA fragments were end-repaired, A-tailed, and ligated with indexed adapters. The adapter-ligated fragments were size-selected using AMPure XP beads (Beckman Coulter, Brea, CA, USA) and enriched by PCR amplification. The quality and quantity of the libraries were validated using a Qubit 2.0 Fluorometer (Invitrogen, USA) and an Agilent 2100 Bioanalyzer (Agilent Technologies, Santa Clara, CA, USA), respectively. The libraries were normalized to 2 nM and pooled in equimolar ratios. The pooled library was denatured and diluted to 1.8 pM before loading onto the flow cell. The library was sequenced on an Illumina NovaSeq 6000 platform (Illumina, USA) with a paired-end read length of 150 bp.
We used SOAPnuke (v1.4.0) to filter raw reads and obtain clean reads [22]. We used Trinity (v2.0.6) [23] to assemble clean reads and Tgicl (v2.0.6) [24] to cluster and remove redundant transcripts from the assembled transcripts, resulting in unigenes. We used Bowtie2 (v2.2.5) [25] to map clean reads to the assembled unigenes and RSEM (v1.2.8) [26] to calculate gene expression levels, which we normalized as FPKM (fragments per kilobase of transcript per million mapped reads).
We annotated the unigenes using a combination of homology-based and ab initio methods. We searched for homologs of the transcripts in the NCBI NR (Non-Redundant Protein Sequence Database), KOG (EuKaryotic Orthologous Group), Swiss-Prot (Swiss-Prot Protein Sequence Database), eggNOG (evolutionary genealogy of genes: Non-supervised Orthologous Groups) and KEGG (Kyoto Encyclopedia of Genes and Genomes) databases using BLAST [27]. We assigned Gene Ontology (GO) terms to the unigenes based on the results of BLAST and InterProScan using Blast2GO [28]. We also aligned the unigenes to the Protein family (PFAM) database using HMMER (E-value 10−10). We performed a differential expression analysis of the unigenes across tissues using edgeR [29].

2.4. Indentification of Simple Sequence Repeats

We mined and screened SSRs from the unigenes using the MIcroSAtellite identification tool (MISA, https://webblast.ipk-gatersleben.de/misa/, accessed on 15 May 2023), with the minimum identification criteria set as 10, 6, 5, 5, and 5 repeats for mono-, di-, tri-, tetra-, penta-, and hexa-nucleotide motifs, respectively. We designed primers for the SSRs using the Primer premier 3.0 software [30] with the following standard parameters: primer size of 18–27 bp, optimal at 20 bp; amplicon length of 100–300 bp; annealing temperature ranging from 57 to 65 °C; GC content of 40%–60%.

2.5. Genotyping and Genetic Diversity Analysis

We tested 67 primer pairs randomly to evaluate their polymorphism and selected those with high polymorphic performance for genotyping 56 trees including 12 from Pq, 14 from Qy, 14 from Nc, and 16 from Wc. We present the sequences of 10 highly polymorphic SSR markers in Table S2. For the SSR analysis, we used an ABI 3730 DNA sequencer and prepared the PCR reaction mixture containing 10 ng of DNA template, 0.2 μM of each primer (forward primer labeled with fluorescent dye and reverse primer), 200 μM of each dNTP, 1 U of Taq polymerase, 1× PCR buffer, 1.5 mM of MgCl2, and distilled water up to 25 μL. We ran the PCR program with the following conditions: initial denaturation at 95 °C for 5 min, followed by 35 cycles of denaturation at 94 °C for 30 s, annealing at 55 °C for 30 s and extension at 72 °C for 45 s, and a final extension at 72 °C for 10 min. After the PCR, we diluted the PCR products with formamide and size standard, and loaded them onto the ABI 3730 DNA sequencer for electrophoresis and detection. We analyzed the data using the GeneMarker software (v2.2.0) or other suitable programs [31].

2.6. Statistical Analysis

We used the GenAlEx 6.5 software [32] to calculate the mean number of alleles (Na), expected heterozygosity (He), observed heterozygosity (Ho), Shannon diversity index (I), etc., and we performed a principal coordinate analysis. We used the Powermarker software (v3.2.5) [33] to calculate the polymorphic information content (PIC), Nei’s genetic distance, and we performed a neighbor-joining (NJ) cluster analysis. We used MEGA7 to beautify the cluster tree [34].

3. Results

3.1. Transcriptome Analysis

We prepared and analyzed four RNA libraries (Nc, Pq, Qy, and Wc). The four libraries obtained 43,089,842, 44,520,446, 44,191,794, and 44,708,800 raw reads, respectively. After quality filtering, we obtained 42,921,654, 44,353,490, 44,015,678, and 44,520,876 clean reads from the Nc, Pq, Qy, and Wc libraries, respectively. The average GC content was 45.51% (Table S3). The Q30 percentage of all four libraries was above 93%, indicating high sequencing and RNA quality. We used the Trinity software (v2.0.6) to assemble the clean reads and produced 18,244 unigenes. The violin box plot in Figure S2 shows that the gene expression levels of the four groups are different. The hierarchical clustering analysis heat map of gene expression in Figure S3 shows that there are obvious differences in gene expression levels among the four groups.
We annotated 18,244 genes by BLAST comparison with six public databases (Nr, Swiss-Prot, KEGG, GO, eggNOG, and Pfam). The six public databases Nr, Swiss-Prot, KEGG, GO, eggNOG, and Pfam annotated 17,340 (95.04%), 13,443 (73.68%), 6791 (37.22%), 13,179 (72.24%), 10,775 (59.06%), and 16,763 genes (91.88%), respectively (Table S4). There was a total of 5566 genes commonly annotated by all six databases (Figure S4). In addition to this, the Nr database annotated only 841 genes; the Pfam database annotated only 654 genes; the KEGG database annotated only one gene; there were no genes annotated in the Swiss-Prot, GO, or eggNOG databases (Figure S4).
The NR database alignment results showed that the assembled transcripts were aligned with the proteomes of Picea sitchensis, Amborella trichopoda, Nelumbo nucifera, Cinnamomum micranthum f. kanehirae, Macleaya cordata, and Pinus taeda and other plants, with similarities of 58.02% (7865), 12.28% (1664), 5.60% (759), 4.53% (614), 2.64% (358), and 2.50% (339), respectively (Figure 1A). This indicates that there are a total of 7865 sequences in our transcriptome of Chinese pine progeny seedlings that are consistent with Picea sitchensis.
GO annotation classified the unigenes into subcategories under three GO categories: “biological process”, “cellular component”, and “molecular function” (Figure 1B). The “biological process” category had 24 terms, with “cellular process”, “metabolic process”, and “response to stimulus” being the most frequent terms. The “cellular component” category had 19 terms, with “cell”, “cell part”, and “organelle” being the most represented terms. The “molecular function” category had 13 terms, with “binding” and “catalytic activity” being the most abundant terms.
The KEGG pathway enrichment analysis assigned 6791 (37.22% of 18,244) unigenes to five biochemical pathways (hierarchy 1), including 19 main pathways (hierarchy 2) (Figure 1C). Among these five main categories, metabolism was the most prevalent (3840, 64.21%), followed by genetic information processing (1434, 23.98%). The remaining three were cellular processes (258, 4.31%), environmental information processing (239, 4.00%), and organismal systems (209, 3.49%). In the biochemical pathways (hierarchy 2), carbohydrate metabolism, amino acid metabolism, and global and overview maps were the top three in terms of content.
The KOG database annotation clustered the unigenes into 26 functional groups. Among them, in the genes with known functions, the top three groups were Group O—“post-translational modification, protein turnover, and chaperones” (1334, 12.40%); Group T—“signal transduction mechanisms” (1389, 12.91%); and Group G “carbohydrate transport and metabolism” (895, 8.32%). The smallest groups were Group N—“cell motility” (2, 0.02%), Group W—“extracellular structure” (37, 0.34%), and Group Y—“nuclear structure” (39, 0.36%). Meanwhile, 1761 (16.37%) unigenes were annotated in Group S—“function unknown” (Figure 1D).
Auxin, cytokinin, and gibberellin are hormones that regulate plant growth and development [35]. We identified 40 genes in the auxin signaling pathway, among which three AUX1s, one TIR1, one ARF, and one CH3 had higher expression levels in Nc; one AUX1 had a higher expression level in Pq (Figure 2). In the cytokinin signaling pathway, we identified 19 genes, among which two AHKs, one AHP, and three ARR-As had higher expression levels in Nc; two AHPs, two ARR-Bs, and one ARR-A had higher expression levels in Pq (Figure 2). In the gibberellin signaling pathway, we identified 14 genes, among which one DELLA and two PIF3s had higher expression levels in Nc; one GID1 and one GID2 had higher expression levels in Pq (Figure 2).

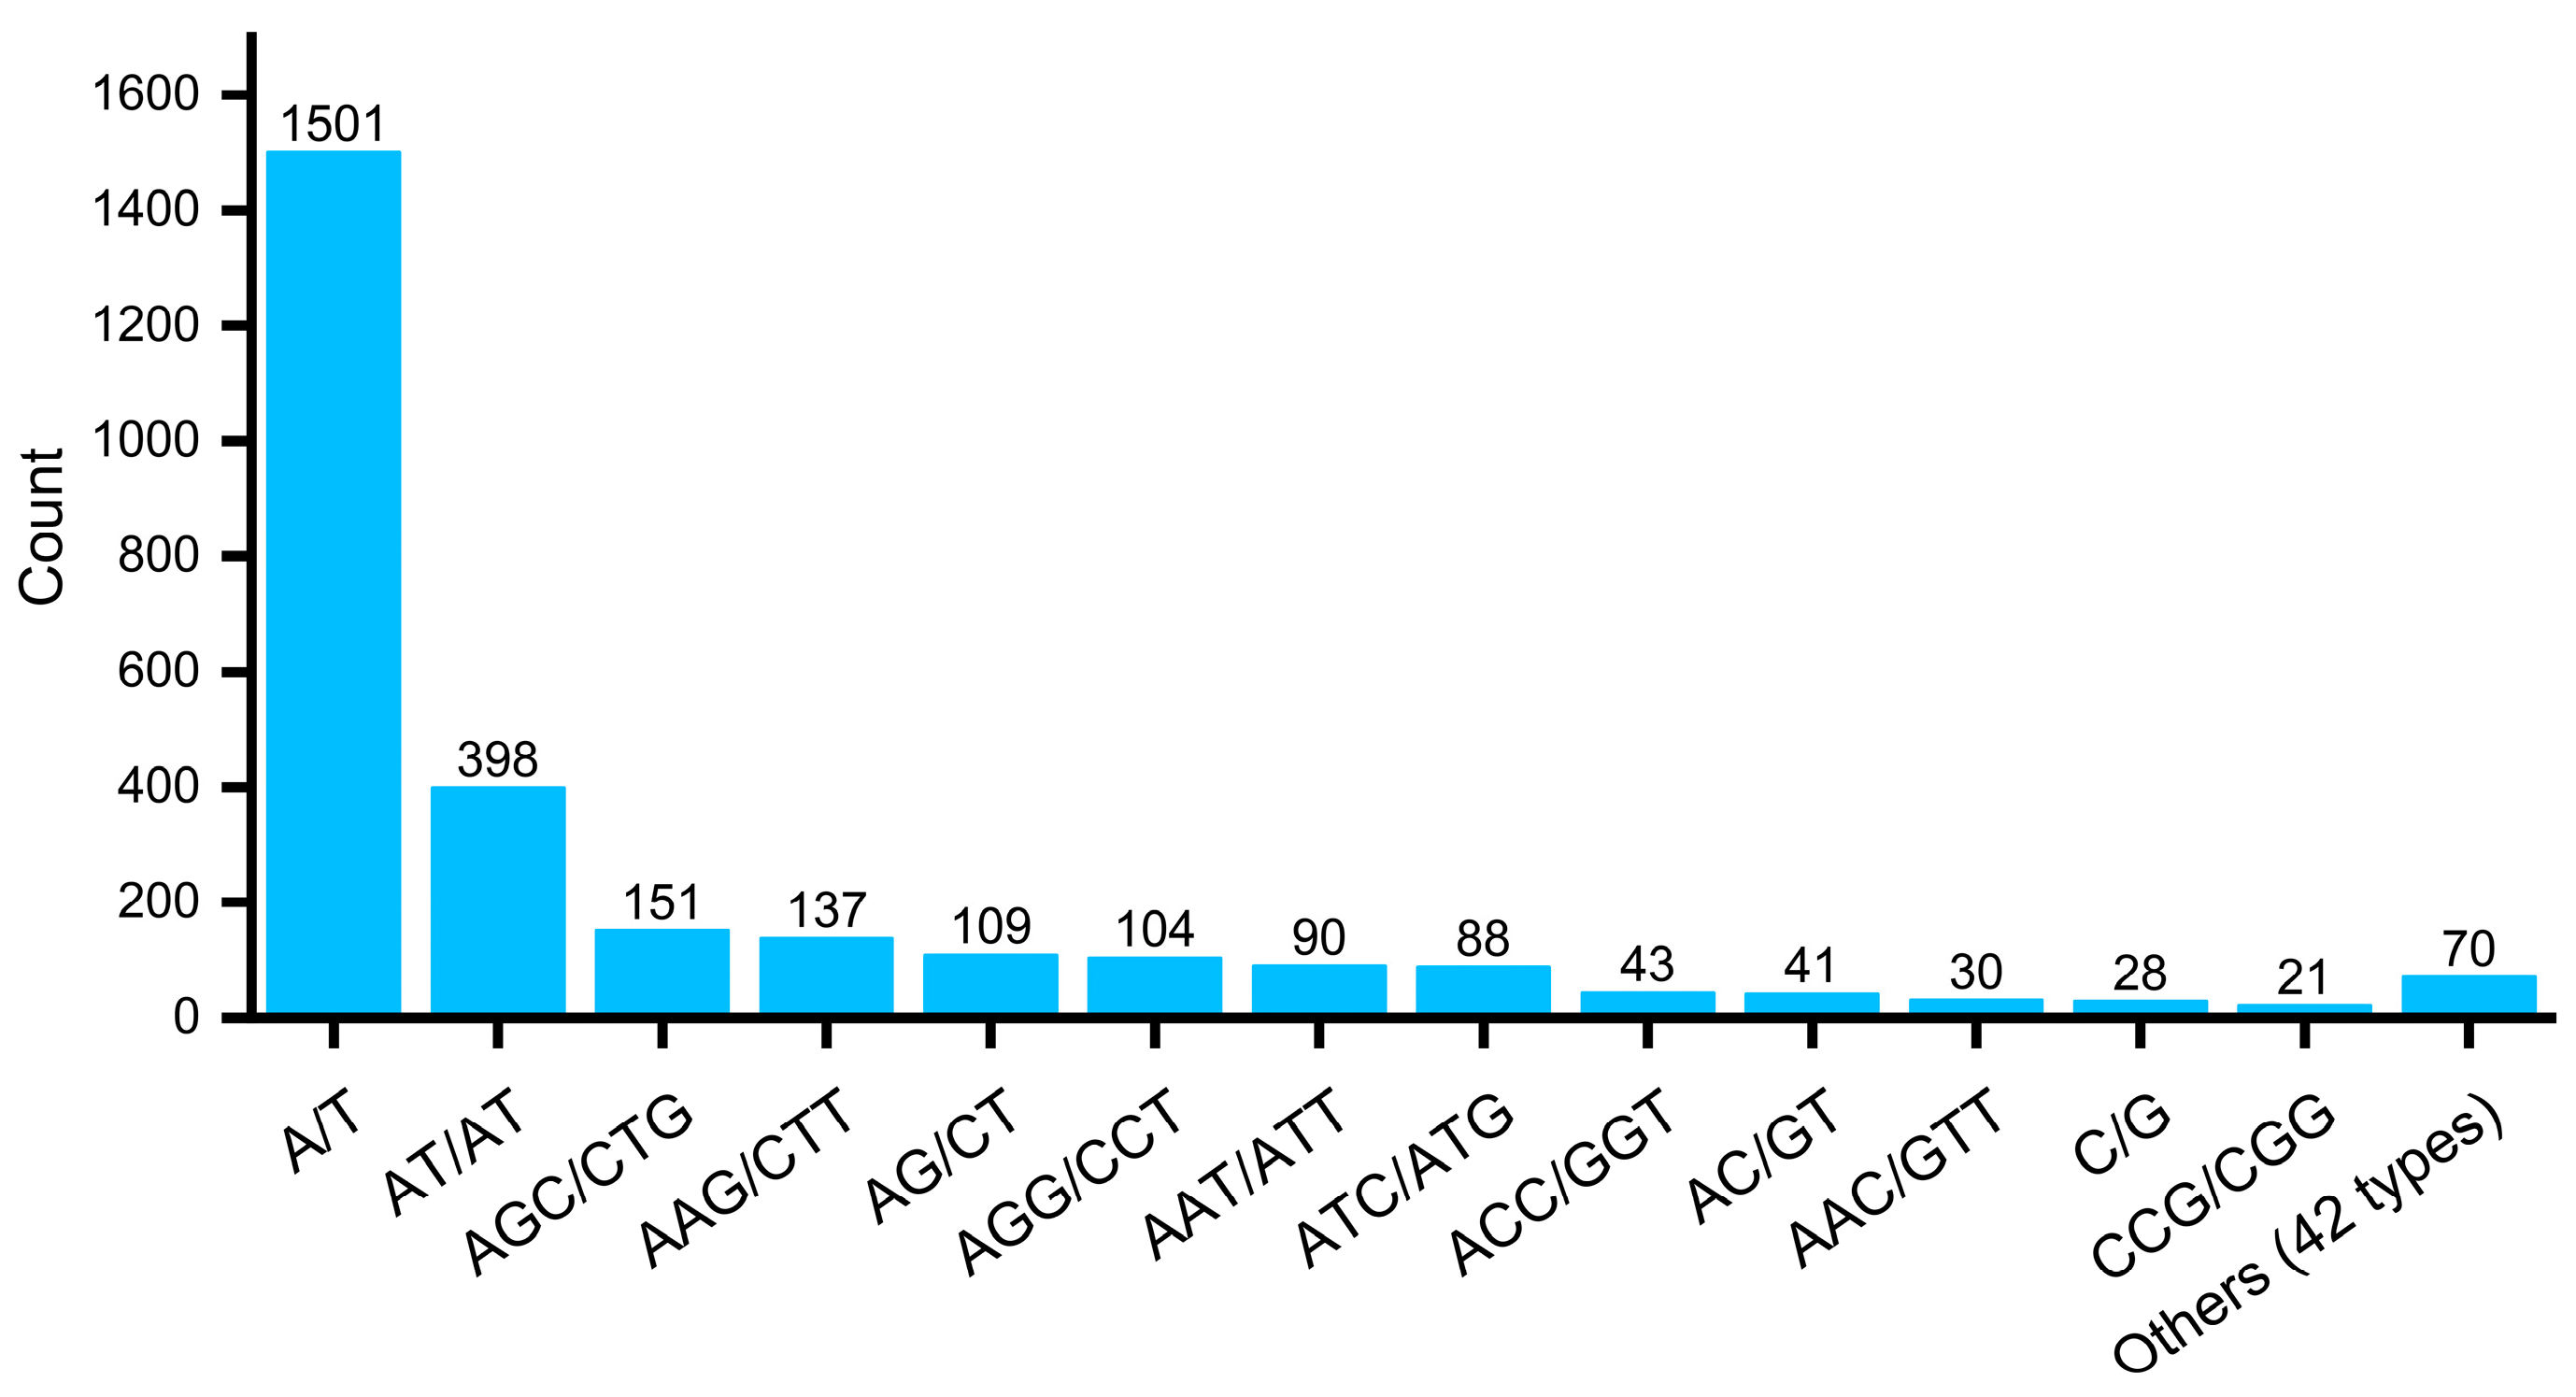
3.2. Identification and Analysis of EST-SSR Loci

We analyzed the SSR loci of the 18,954 unigene sequences (total length of 40,916,157 bp) obtained from transcriptome sequencing. We found that 2360 unigenes contained 2811 SSR loci, with an SSR occurrence frequency of 12.45%, a distribution frequency of 14.83%, and an average distance of one SSR locus per 14,556 bp (Table S5). Each unigene sequence contained 1–7 SSR loci, among which 348 unigene sequences contained only one SSR locus, accounting for 14.75% of the unigene sequences containing SSR loci. We examined the repeat motif types of the SSR loci (Table 1) and found significant differences in the number of SSR loci for different types. The mononucleotide repeat type was the most abundant, accounting for 54.39% of the total SSR loci, followed by the trinucleotide repeat type and the dinucleotide repeat type, accounting for 23.01% and 19.53% of the total SSRs, respectively (Table S6). The remaining three repeat types had lower proportions, with the pentanucleotide repeat type being the lowest (0.50%) (Table S4). The distribution frequencies of six repeat types in total unigenes were 8.07%, 2.90%, 3.56%, 0.14%, 0.07%, and 0.09%, respectively, showing large differences in SSR locus distribution frequency for different types (Table S6).
A total of 55 repeat motifs were found (Figure 3 and Table S7). The mononucleotide repeat type had two repeat motifs (A/T and G/C), with A/T being the dominant one (98.2%), while G/C was rare (1.8%) (Figure 3A). The dinucleotide repeat type had four repeat motifs, with AT/AT and AG/CT being the most frequent ones (72.5% and 19.9%, respectively), followed by the AC/GT repeat motif (7.5%), while CG/CG only appeared once (Figure 3B). The trinucleotide repeat type had 14 repeat motifs, with the highest frequency being AGC/CTG (22.4%), followed by AAG/CTT (20.3%), while ACT/AGT was the least frequent one (0.3%) (Figure 3C). The tetranucleotide repeat type had 14 repeat motifs, but each motif type appeared in small numbers. AAAT/ATTT appeared six times (22.2%); AAAG/CTTT, AATC/ATTG, AGAT/ATCT, and AGGC/CCTG four repeat motifs appearing three times each (11.1% each); the remaining AACT/AGTT and other nine repeat motifs appeared only once each (Figure 3D). The pentanucleotide repeat type had nine motifs: AGCAT/ATGCT and AGGCG/CCTCG two repeat motifs appearing three times each (21.4% each) (Figure 3E); the AGGGC/CCCTG motif appeared twice (accounting for 14.3%); the remaining AAAAC/GTTTT and other six repeat motifs appeared only once each (Figure 3E). The hexanucleotide repeat type had the most repeat motifs (16). The ACCATC/ATGGTG repeat motif only appeared twice (11.8%), while the remaining AAAAAC/GTTTTT and other fifteen repeat motifs appeared only once each (Figure 3F).
We analyzed the SSR loci of the repeat motifs based on the number of different bases. The mononucleotide repeat type A/T was the most dominant, appearing 1501 times, followed by the dinucleotide repeat types AT/AT, AGC/CTG, AAG/CTT, AG/CT, AGG/CCT, AAT/ATT, ATC/ATG, ACC/GGT, and AC/GT, appearing 398, 151, 137, 109, 90, 88, 43, and 41 times, respectively. The other repeat types appeared less than 40 times each (Figure 4; Table S7). Regarding the motif repetition number, the most frequent number was 10 times (759, 27.00%), followed by 5 times (488, 17.36%), 6 times (369, 13.13%), 11 times (321, 11.42%), 15 times and above (216, 7.68%), 12 times (174, 6.19%), 7 times (152, 5.41%), 13 times (120, 4.27%), 8 times (88, 3.13%), 14 times (77, 2.74%), and 9 times (47, 1.67%) (Table 1).

3.3. Screening and Validation of Polymorphic Primers

We validated the newly developed EST-SSR primers using 56 accessions of four provenances. We screened out ten polymorphic primers with high polymorphism and good repeatability from the randomly selected and synthesized 67 primer pairs for subsequent experiments (Table S2). The ten primers produced a total of 60 alleles, with the number of alleles amplified at each locus ranging from three to twelve, and an average of six alleles per locus (Table 2). The Ho index ranged from 0.509 to 0.855, the He index ranged from 0.549 to 0.823, and the PIC values of each locus ranged from 0.4582 to 0.8072, with an average of 0.624 (Table 2). Eighty percent of the EST-SSR markers showed high levels of polymorphism (PIC > 0.5), and only two markers (g5114_i0 and g24756_i0) had moderate levels of polymorphism (0.25 < PIC < 0.5). These results indicate that these loci contain rich genetic information and can be used for genetic diversity studies of Chinese pine germplasm.
We performed an NJ clustering analysis based on Nei’s genetic distance using the neighbor-joining method to evaluate the applicability of the newly developed EST-SSR primers for the 56 samples. The Nei’s genetic distance matrix for the 56 accessions is shown in Table S8. Figure 5 shows that Chinese pine from four provenance regions clustered into four groups: Group I contained one sample each from Ningcheng, Pingquan, and Qinyuan; Group II contained four, four, seven, and six samples from Ningcheng, Pingquan, Qinyuan, and Weichang, respectively; Group III contained four, five, five, and nine samples from Ningcheng, Pingquan, Qinyuan, and Weichang, respectively; Group IV contained five, two, and one samples from Ningcheng, Pingquan, and Qinyuan, respectively. The results demonstrated the strong genetic identification ability of the SSR primers developed in this study.

4. Discussion

Chinese pine (Pinus tabulaeformis) is a cold- and drought-tolerance tree species that plays important roles in ecological conservation, forestry economy, and timber production in northern China. Zhang et al. [1] investigated the roles of auxin, cytokinin, gibberellin, and other endogenous hormones and their related genes in the growth and development of Chinese pine using transcriptome data and liquid chromatography/electrospray tandem mass spectrometry. In this study, we sequenced and assembled the transcriptomes of needles of Chinese pine seedlings from four provenance regions on the Illumina HiSeq 6000 platform. We obtained a total sequence length of 40,916,157 bp, with 18,244 unigenes annotated in six databases. The NR database alignment showed that 7865 sequences in the Chinese pine seedling transcriptome matched Picea sitchensis, which is likely due to the close phylogenetic relationship between Chinese pine and spruce in the Pinaceae family. The transcriptome data obtained in this study provide new insights for elucidating the growth and development of Chinese pine.
Auxin IAA, cytokinin, and gibberellin are essential for plant growth and development [35]. It has been found that auxin near the proximal end of the leaf primordium can be transported to the apical meristematic tissue by polar transport, resulting in a decrease in auxin concentration in that region, which is essential for leaf morphogenesis [36]. Cytokinin regulates establishment and maintenance of shoot apical meristem, and cytokinin B-type response factors can directly activate the expression of the Arabidopsis shoot apical stem cell maintenance gene WUSCHEL (WUS), thereby modulating Arabidopsis shoot apical stem cell activity [36,37,38]. Gibberellin regulates various processes in plant growth and development, such as seed germination, stem elongation, floral transition, and flower and fruit development [39,40]. The DELLA protein is an inhibitor in the gibberellin signal transduction process, and researchers have found that DELLA can relieve SCL27’s inhibition on protochlorophyllide oxidoreductase (POR), regulating chloroplast formation and leaf development in Arabidopsis [41]. Li et al. [2] found that gibberellin signal transduction can promote Chinese pine seedling growth. In our study, we identified two genes with higher expression levels in Nc seedlings in the gibberellin signal transduction pathway as DELLA and PIF, while we identified two genes with higher expression levels in Pq seedlings as GID1 and GID2. This indicates that there are significant differences in the genes with higher expression levels in the gibberellin signal transduction pathway among Chinese pine seedlings from different regions. This provides us with new perspectives for studying the regulatory mechanism of growth and development of Chinese pine open-pollinated progeny seedlings.
In our study, we obtained EST-SSR sequences from transcriptome data. Trinucleotide repeat sequences (24.01%) were the most dominant type, except for mononucleotide sequences, a finding which was consistent with most previous studies on Pinaceae tree species such as Pinus tabuliformis [6], Larix principis-rupprechtii [42], and Larix gmelinii [9]. However, some studies on pigeon pea [43] and Rhododendron rex [44] have shown that dinucleotide was the most abundant type. Among dinucleotide repeat motifs, AT/AT (398, 72.5%) (Figure 3B; Table S7) was the most abundant in our study, which agreed with Li et al.’s results [45]. However, our nucleotide motif frequency differed slightly from those of cereals [46] and maple trees [47]. The difference in SSR motif type distribution frequency may be attributed to different species types.
Previous studies have examined the genetic structure of 1310 individuals from 38 major natural and artificial populations in northern China using nine nuclear simple sequence repeat (SSR) markers [48]. The genetic diversity of first-, second-, and third-generation seed orchards has been evaluated using 24 SSR molecular markers [21]. In this study, we identified 2811 new EST-SSR loci from transcriptome data, randomly synthesized 67 primer pairs for polymorphic primer screening, and screened out 10 primers with polymorphism among Chinese pine from different provenance regions. Eight loci were highly polymorphic (PIC > 0.5), while two loci were moderately polymorphic (0.25 < PIC < 0.5) [49]. The average PIC value was 0.624, which was higher than the average PIC value (0.449) of SSR primers in Yang et al.’s study [21], indicating that the EST-SSR primers we developed effectively expanded the molecular marker resources for genetic diversity identification of Chinese pine. Moreover, based on Nei’s genetic distance, we performed an NJ clustering analysis on 56 Chinese pine samples using the neighbor-joining method, and divided the samples from four provenance regions into four groups, each containing different samples from three or four provenance regions that could be clearly distinguished. This suggests that the EST-SSR markers developed in this study can play important roles in Chinese pine population genetic diversity, as well as phylogenetic relationship and molecular marker-assisted selection breeding research.

5. Conclusions

This study examined transcriptomes of Pinus tabuliformis seedlings from four different provenance regions: Ningcheng (Nc), Qinyuan (Qy), Weichang (Wc), and Pingquan (Pq). The results showed that 18,244 genes were annotated. The expression levels of genes involved in the auxin IAA, CTK, and GA signal transduction pathways varied significantly among seedlings from different regions. Additionally, 2811 new EST-SSR loci were detected from 2360 unigenes. Ten pairs of polymorphic primers were chosen and used to genotype 56 Pinus tabuliformis samples. The average PIC value of these primers was 0.624, allowing for clear distinctions among all individuals. The new EST-SSR markers developed through transcriptome sequencing will provide valuable molecular marker resources and information support for evaluating, conserving, and breeding Pinus tabuliformis germplasm resources.

Supplementary Materials

The following supporting information can be downloaded at: https://www.mdpi.com/article/10.3390/f14091810/s1, Figure S1: Images of representative Pinus tabulaeformis seedlings from four provenance regions, Figure S2: Violin plot of gene expression levels, Figure S3: Clustered heatmap of gene expression levels, Figure S4: Venn diagram of gene annotations in six databases, Table S1: Information of 56 trees from four different provenances, Table S2: Primer sequences for 10 polymorphic loci, Table S3: Statistics of transcriptome sequencing quality assessment, Table S4: Number and proportion of gene annotations in six databases, Table S5: Statistics of SSR identification in unigenes, Table S6: Types and distribution of SSR repeat motifs in transcriptome, Table S7: Number of different SSR motifs, Table S8: Nei’s genetic distance matrix for 56 Pinus tabulaeformis accessions based on 10 EST-SSR markers.

Author Contributions

Conceptualization, J.W. and G.Z.; methodology, J.W.; software, Y.Z.; validation, S.G., Y.Z., and F.Z.; formal analysis, J.W.; investigation, S.G. and Y.Y.; resources, Y.Z. and F.Z.; data curation, S.G. and Y.Z.; writing—original draft preparation, J.W.; writing—review and editing, J.W.; visualization, Y.Z., F.Z., and Y.Y.; supervision, G.Z.; project administration, G.Z.; funding acquisition, G.Z. All authors have read and agreed to the published version of the manuscript.

Funding

This research was funded by the Young Teachers’ Research Ability Improvement Project of Inner Mongolia Agricultural University (grant number BR230161), the Key R&D and Achievement Transformation Plan of Inner Mongolia Autonomous Region (grant number 2023YFDZ0017), the Inner Mongolia Science and Technology Department Project of China (grant number 2021GG0075) and the National Natural Science Foundation of China (grant number 31160167).

Data Availability Statement

The transcriptome raw data have been submitted to the SRA database of the NCBI (PRJNA1010855).

Acknowledgments

We thank teacher Penghao Ji (College of Science, Inner Mongolia Agricultural University) for his project support and his assistance in revising the manuscript.

Conflicts of Interest

The authors declare no conflict of interest.

References

  1. Chen, K.; Abbott, R.J.; Milne, R.I.; Tian, X.M.; Liu, J. Phylogeography of Pinus tabulaeformis Carr. (Pinaceae), a dominant species of coniferous forest in northern China. Mol. Ecol. 2008, 17, 4276–4288. [Google Scholar] [CrossRef]
  2. Li, W.; Liu, S.W.; Ma, J.J.; Liu, H.M.; Han, F.X.; Li, Y.; Niu, S.H. Gibberellin signaling is required for far-red light-induced shoot elongation in Pinus tabuliformis seedlings. Plant Physiol. 2020, 182, 658–668. [Google Scholar] [CrossRef]
  3. Zhang, J.X.; Liu, H.M.; Yang, B.N.; Wang, H.L.; Niu, S.H.; El-Kassaby, Y.A.; Li, W. Phytohormone profiles and related gene expressions after endodormancy release in developing Pinus tabuliformis male strobili. Plant Sci. 2022, 316, 111167. [Google Scholar] [CrossRef] [PubMed]
  4. Guo, Y.; Niu, S.; El-Kassaby, Y.A.; Li, W. Transcriptomic and proteomic analyses of far-red light effects in inducing shoot elongation in the presence or absence of paclobutrazol in Chinese pine. J. For. Res. 2021, 33, 1033–1043. [Google Scholar] [CrossRef]
  5. Pervaiz, T.; Liu, S.W.; Uddin, S.; Amjid, M.W.; Niu, S.H.; Wu, H.X. The Transcriptional landscape and hub genes associated with physiological responses to drought stress in Pinus tabuliformis. Int. J. Mol. Sci. 2021, 22, 9604. [Google Scholar] [CrossRef]
  6. Niu, S.H.; Li, Z.X.; Yuan, H.W.; Chen, X.Y.; Li, Y.; Li, W. Transcriptome characterisation of Pinus tabuliformis and evolution of genes in the Pinus phylogeny. BMC Genom. 2013, 14, 263. [Google Scholar] [CrossRef]
  7. Balakrishnan, S.; Dev, S.A.; Sakthi, A.R.; Vikashini, B.; Bhasker, T.R.; Magesh, N.S.; Ramasamy, Y. Gene-ecological zonation and population genetic structure of Tectona grandis L.f. in India revealed by genome-wide SSR markers. Tree Genet. Genomes 2021, 17, 33. [Google Scholar] [CrossRef]
  8. Zhou, Y.; Wei, X.; Abbas, F.; Yu, Y.; Yu, R.; Fan, Y. Genome-wide identification of simple sequence repeats and assessment of genetic diversity in Hedychium. J. Appl. Res. Med. Aromat. Plants 2021, 24, 100312. [Google Scholar] [CrossRef]
  9. Zhang, G.; Sun, Z.; Zhou, D.; Xiong, M.; Wang, X.; Yang, J.; Wei, Z. Development and characterization of novel EST-SSRs from Larix gmelinii and their cross-species transferability. Molecules 2015, 20, 12469–12480. [Google Scholar] [CrossRef]
  10. Grover, A.; Sharma, P.C. Development and use of molecular markers: Past and present. Crit. Rev. Biotechnol. 2016, 36, 290–302. [Google Scholar] [CrossRef]
  11. Zhao, D.W.; Yang, J.B.; Yang, S.X.; Kato, K.; Luo, J.P. Genetic diversity and domestication origin of tea plant Camellia taliensis (Theaceae) as revealed by microsatellite markers. BMC Plant Biol. 2014, 14, 14. [Google Scholar] [CrossRef] [PubMed]
  12. Stephen, K.; Aparna, K.; Beena, R.; Sah, R.P.; Jha, U.C.; Behera, S. Identification of simple sequence repeat markers linked to heat tolerance in rice using bulked segregant analysis in F(2) population of NERICA-L 44 x Uma. Front. Plant Sci. 2023, 14, 1113838. [Google Scholar] [CrossRef] [PubMed]
  13. Zhao, M.; Shu, G.; Hu, Y.; Cao, G.; Wang, Y. Pattern and variation in simple sequence repeat (SSR) at different genomic regions and its implications to maize evolution and breeding. BMC Genom. 2023, 24, 136. [Google Scholar] [CrossRef] [PubMed]
  14. Ellis, J.R.; Burke, J.M. EST-SSRs as a resource for population genetic analyses. Heredity 2007, 99, 125–132. [Google Scholar] [CrossRef] [PubMed]
  15. Chen, H.; Liu, L.; Wang, L.; Wang, S.; Somta, P.; Cheng, X. Development and validation of EST-SSR markers from the transcriptome of adzuki bean (Vigna angularis). PLoS ONE 2015, 10, e0131939. [Google Scholar] [CrossRef]
  16. Zheng, J.Y.; Wang, H.; Chen, X.X.; Wang, P.; Gao, P.; Li, X.N.; Zhu, G.P. Microsatellite markers for assessing genetic diversity of the medicinal plant Paris. polyphylla var. chinensis (Trilliaceae). Genet. Mol. Res. 2012, 11, 1975–1980. [Google Scholar] [CrossRef]
  17. Koohi Dehkordi, M.; Beigzadeh, T.; Sorkheh, K. Novel in silico EST-SSR markers and bioinformatic approaches to detect genetic variation among peach (Prunus persica L.) germplasm. J. For. Res. 2019, 31, 1359–1370. [Google Scholar] [CrossRef]
  18. Li, S.; Ji, F.; Hou, F.; Cui, H.; Shi, Q.; Xing, G.; Weng, Y.; Kang, X. Characterization of Hemerocallis citrina transcriptome and development of EST-SSR markers for evaluation of genetic diversity and population structure of Hemerocallis collection. Front. Plant Sci. 2020, 11, 686. [Google Scholar] [CrossRef]
  19. Zhou, Y.; Yin, M.; Abbas, F.; Sun, Y.; Gao, T.; Yan, F.; Li, X.; Yu, Y.; Yue, Y.; Yu, R.; et al. Classification and association analysis of gerbera (Gerbera hybrida) flower color traits. Front. Plant Sci. 2021, 12, 779288. [Google Scholar] [CrossRef]
  20. Fang, P.; Niu, S.; Yuan, H.; Li, Z.; Zhang, Y.; Yuan, L.; Li, W. Development and characterization of 25 EST-SSR markers in Pinus sylvestris var. mongolica (Pinaceae). Appl. Plant Sci. 2014, 2, 1300057. [Google Scholar] [CrossRef]
  21. Yang, B.; Niu, S.; El-Kassaby, Y.A.; Li, W. Monitoring genetic diversity across Pinus tabuliformis seed orchard generations using SSR markers. Can. J. For. Res. 2021, 51, 1534–1540. [Google Scholar] [CrossRef]
  22. Chen, Y.; Chen, Y.; Shi, C.; Huang, Z.; Zhang, Y.; Li, S.; Li, Y.; Ye, J.; Yu, C.; Li, Z.; et al. SOAPnuke: A MapReduce acceleration-supported software for integrated quality control and preprocessing of high-throughput sequencing data. Gigascience 2018, 7, 1–6. [Google Scholar] [CrossRef]
  23. Grabherr, M.G.; Haas, B.J.; Yassour, M.; Levin, J.Z.; Thompson, D.A.; Amit, I.; Adiconis, X.; Fan, L.; Raychowdhury, R.; Zeng, Q.; et al. Full-length transcriptome assembly from RNA-Seq data without a reference genome. Nat. Biotechnol. 2011, 29, 644–652. [Google Scholar] [CrossRef]
  24. Pertea, G.; Huang, X.; Liang, F.; Antonescu, V.; Sultana, R.; Karamycheva, S.; Lee, Y.; White, J.; Cheung, F.; Parvizi, B.; et al. TIGR Gene Indices clustering tools (TGICL): A software system for fast clustering of large EST datasets. Bioinformatics 2003, 19, 651–652. [Google Scholar] [CrossRef]
  25. Langmead, B.; Salzberg, S.L. Fast gapped-read alignment with Bowtie 2. Nat. Methods 2012, 9, 357–359. [Google Scholar] [CrossRef]
  26. Li, B.; Dewey, C.N. RSEM: Accurate transcript quantification from RNA-Seq data with or without a reference genome. BMC Bioinform. 2011, 12, 323. [Google Scholar] [CrossRef]
  27. Altschul, S.F.; Gish, W.; Miller, W.; Myers, E.W.; Lipman, D.J. Basic local alignment search tool. J. Mol. Biol. 1990, 215, 403–410. [Google Scholar] [CrossRef]
  28. Audic, S.; Claverie, J.M. The significance of digital gene expression profiles. Genome Res. 1997, 7, 986–995. [Google Scholar] [CrossRef]
  29. Robinson, M.D.; McCarthy, D.J.; Smyth, G.K. edgeR: A Bioconductor package for differential expression analysis of digital gene expression data. Bioinformatics 2010, 26, 139–140. [Google Scholar] [CrossRef]
  30. Koressaar, T.; Remm, M. Enhancements and modifications of primer design program Primer3. Bioinformatics 2007, 23, 1289–1291. [Google Scholar] [CrossRef]
  31. Holland, M.M.; Parson, W. GeneMarker(R) HID: A reliable software tool for the analysis of forensic STR data. J. Forensic. Sci. 2011, 56, 29–35. [Google Scholar] [CrossRef] [PubMed]
  32. Peakall, R.; Smouse, P.E. GenAlEx 6.5: Genetic analysis in Excel. Population genetic software for teaching and research—An update. Bioinformatics 2012, 28, 2537–2539. [Google Scholar] [CrossRef] [PubMed]
  33. Liu, K.; Muse, S.V. PowerMarker: An integrated analysis environment for genetic marker analysis. Bioinformatics 2005, 21, 2128–2129. [Google Scholar] [CrossRef] [PubMed]
  34. Kumar, S.; Stecher, G.; Tamura, K. MEGA7: Molecular evolutionary genetics analysis version 7.0 for bigger datasets. Mol. Biol. Evol. 2016, 33, 1870–1874. [Google Scholar] [CrossRef] [PubMed]
  35. Blazquez, M.A.; Nelson, D.C.; Weijers, D. Evolution of plant hormone response pathways. Annu. Rev. Plant Biol. 2020, 71, 327–353. [Google Scholar] [CrossRef]
  36. Qi, J.; Wang, Y.; Yu, T.; Cunha, A.; Wu, B.; Vernoux, T.; Meyerowitz, E.; Jiao, Y. Auxin depletion from leaf primordia contributes to organ patterning. Proc. Natl. Acad. Sci. USA 2014, 111, 18769–18774. [Google Scholar] [CrossRef]
  37. Dai, X.; Liu, Z.; Qiao, M.; Li, J.; Li, S.; Xiang, F. ARR12 promotes de novo shoot regeneration in Arabidopsis thaliana via activation of WUSCHEL expression. J. Integr. Plant Biol. 2017, 59, 747–758. [Google Scholar] [CrossRef]
  38. Wang, J.; Tian, C.; Zhang, C.; Shi, B.; Cao, X.; Zhang, T.Q.; Zhao, Z.; Wang, J.W.; Jiao, Y. Cytokinin signaling activates WUSCHEL expression during axillary meristem Initiation. Plant Cell 2017, 29, 1373–1387. [Google Scholar] [CrossRef]
  39. Sun, T.P. The molecular mechanism and evolution of the GA-GID1-DELLA signaling module in plants. Curr. Biol. 2011, 21, R338–R345. [Google Scholar] [CrossRef]
  40. Wang, Y.; Deng, D. Molecular basis and evolutionary pattern of GA-GID1-DELLA regulatory module. Mol. Genet. Genom. 2014, 289, 1–9. [Google Scholar] [CrossRef]
  41. Ma, Z.; Hu, X.; Cai, W.; Huang, W.; Zhou, X.; Luo, Q.; Yang, H.; Wang, J.; Huang, J. Arabidopsis miR 171-targeted scarecrow-like proteins bind to GT cis-elements and mediate gibberellin-regulated chlorophyll biosynthesis under light conditions. PLoS Genet. 2014, 10, e1004519. [Google Scholar] [CrossRef] [PubMed]
  42. Dong, M.; Wang, Z.; He, Q.; Zhao, J.; Fan, Z.; Zhang, J. Development of EST-SSR markers in Larix principis-rupprechtii Mayr and evaluation of their polymorphism and cross-species amplification. Trees 2018, 32, 1559–1571. [Google Scholar] [CrossRef]
  43. Dutta, S.; Kumawat, G.; Singh, B.P.; Gupta, D.K.; Singh, S.; Dogra, V.; Gaikwad, K.; Sharma, T.R.; Raje, R.S.; Bandhopadhya, T.K.; et al. Development of genic-SSR markers by deep transcriptome sequencing in pigeonpea [Cajanus cajan (L.) Millspaugh]. BMC Plant Biol. 2011, 11, 17. [Google Scholar] [CrossRef] [PubMed]
  44. Zhang, Y.; Zhang, X.; Wang, Y.H.; Shen, S.K. De Novo Assembly of Transcriptome and development of novel EST-SSR markers in Rhododendron rex Levl. through Illumina sequencing. Front. Plant Sci. 2017, 8, 1664. [Google Scholar] [CrossRef]
  45. Li, X.; Liu, X.; Wei, J.; Li, Y.; Tigabu, M.; Zhao, X. Development and transferability of EST-SSR markers for Pinus koraiensis from cold-stressed transcriptome through Illumina sequencing. Genes 2020, 11, 500. [Google Scholar] [CrossRef]
  46. Raza, Q.; Riaz, A.; Saher, H.; Bibi, A.; Raza, M.A.; Ali, S.S.; Sabar, M. Grain Fe and Zn contents linked SSR markers based genetic diversity in rice. PLoS ONE 2020, 15, e0239739. [Google Scholar] [CrossRef]
  47. Chen, S.; Dong, M.; Zhang, Y.; Qi, S.; Liu, X.; Zhang, J.; Zhao, J. Development and characterization of simple sequence repeat markers for, and genetic diversity analysis of Liquidambar formosana. Forests 2020, 11, 203. [Google Scholar] [CrossRef]
  48. Biao, Z.; Zhang, Z.; Li, Y.; Ma, Y.; Zhang, S.; Niu, S.; Li, Y. Genetic diversity, genetic structure, and germplasm source of Chinese pine in North China. Eur. J. For. Res. 2023, 142, 183–195. [Google Scholar] [CrossRef]
  49. Botstein, D.; White, R.L.; Skolnick, M.; Davis, R.W. Construction of a genetic linkage map in man using restriction fragment length polymorphisms. Am. J. Hum. Genet. 1980, 32, 314–331. [Google Scholar]
Figure 1. Functional annotation analysis of unigenes in: (A) NR; (B) KEGG; (C) GO; (D) KOG databases.
Forests 14 01810 g001
Figure 2. Expression analysis of genes related to the auxin, cytokinin, and gibberellin signaling pathways.
Forests 14 01810 g002
Figure 3. Proportions of different SSR motifs in the Pinus tabulaeformis transcriptome: (A) Mononucleotide; (B) dinucleotide; (C) trinucleotide; (D) tetranucleotide; (E) pentanucleotide; (F) hexanucleotide.
Forests 14 01810 g003
Figure 4. Number of Different EST-SSR Motif Types.
Forests 14 01810 g004
Figure 5. Cluster analysis of 56 Pinus tabulaeformis accessions based on 10 EST-SSRs.
Forests 14 01810 g005
Table 1. Frequencies of different SSR repeat motif types.
SSR MotifNumber of MotifsNumber of RepeatsTotalPercentage
567891011121314≥15
Mononucleotides2-----70729015310269208152954.39%
Dinucleotides4-2081056741492620188754919.53%
Trinucleotides104431494621635100167524.01%
Tetranucleotide14215100000000270.96%
Pentanucleotide9121000000000130.46%
Hexanucleotide16126000000000180.64%
Total554883691528847759321174120772162811100.00%
Table 2. Characteristics of 10 polymorphic SSR loci in 56 accessions.
SSR LociNaNeIHoHePIC
g3601_i072.7691.2820.6550.6390.5876
g10617_i053.0371.2620.6730.6710.6118
g7466_i063.6731.3960.7270.7280.6863
g5114_i032.2190.9230.6730.5490.4857
g24756_i042.2650.9120.6180.5590.4582
g6422_i0103.8811.6890.7640.7420.7073
g6405_i0125.6231.9620.8550.8220.8072
g334_i053.7791.4270.6000.7350.6955
g798_i053.4791.3390.7640.7130.6571
g10239_i032.5611.0180.5090.6100.5407
Mean63.3291.3210.6840.6770.624
Note: Na, number of alleles; Ne, number of effective alleles; I, Shannon’s index; Ho, observed heterozygosity; He, expected heterozygosity; PIC, polymorphic information content.
Disclaimer/Publisher’s Note: The statements, opinions and data contained in all publications are solely those of the individual author(s) and contributor(s) and not of MDPI and/or the editor(s). MDPI and/or the editor(s) disclaim responsibility for any injury to people or property resulting from any ideas, methods, instructions or products referred to in the content.

