Abstract
Understanding genetic diversity and population structure is essential for the conservation and utilization of germplasm. Ginkgo biloba L. is a medicinal, edible and ornamental tree species. Detailed knowledge of genetic variability and diversity in different Ginkgo germplasm resources is still scarce. In this study, a total of 173,160 Expressed Sequence Tag Simple Sequences Repeat (EST-SSR) loci were derived from 43,073 Unigenes of the Ginkgo genome. A total of 43,731 pairs of specific primers were designed for the EST-SSR loci, with sequence lengths >20 bp, and 100 of the SSR primers were randomly selected. Among these, 20 EST-SSR markers were verified and used to assess the genetic diversity of 101 Ginkgo individuals collected from different regions. The average values for Shannon’s diversity index (I, 0.993), expected heterozygosity (0.566) and Nei’s genetic diversity index (H, 0.563) indicate a high level of genetic diversity of Ginkgo populations. Based on the EST-SSR markers, a core collection of Ginkgo germplasm comprising 27 genetic resources was constructed. The retention rates of the number of resources, the number of alleles, the number of effective alleles, the I index, the H index and the percentage of polymorphic loci of the constructed core collection are 26.73%, 95.29%, 103.43%, 102.25%, 102.91% and 100.00%, respectively. The molecular markers developed in this study are an effective tool for Ginkgo genetic diversity analysis and will facilitate the future breeding of this species.
1. Introduction
Ginkgo biloba L. is an endangered species endemic to China. It is a long-lived dioecious tree that is distributed in extremely small populations. Ginkgo is the only member of its family that has no close relatives. The size of the Ginkgo genome is 10.61 Gb [1]. The strong adaptability of Ginkgo to various environmental stresses makes it a popular species worldwide [2,3]. As a relict species, Ginkgo germplasm resources are extremely valuable. Ginkgo resources have potential for medicinal, edible and ornamental uses. The leaves and seeds of Ginkgo are used as important raw materials for traditional medicines with pharmaceutical value, such as anti-inflammatory [4], photoprotective [5], liver-protective [6], cardioprotective [7] and antioxidant medicines [8]. However, in view of environmental threats, Ginkgo resources are gradually decreasing. There is an urgent need to strengthen the resource conservation and genetic breeding of this species [9].
Although several molecular marker techniques, such as RAPD, ISSR and PCR-RFLP, used to analyze the population structure and reconstruct the phylogeographic history of Ginkgo have been reported [10,11,12], the findings are still limited due to insufficient population sizes and the limitations of genetic markers or related techniques. Previous results based on RAPD [11] and AFLP [13] have shown that high levels of genetic variation exist in Ginkgo populations, and the genetic diversity and differentiation of Ginkgo populations in China were higher than those in Korea and North America [11]. In addition, RAPD markers showed that the highest genetic diversity exists in the Ginkgo populations distributed in Southwest China [11]. These results are consistent with those obtained through PCR-RFLP and ISSR-PCR analysis in smaller Ginkgo populations. These efforts indicated that the genetic diversity in the populations located in Guizhou and Hubei Provinces (Southwest China) is much higher than that in Zhejiang Province (East China) [10,12]. Differently, using SSR markers, Zhou et al. (2020) proposed that the highest genetic diversity and allelic richness exist in a Ginkgo population located in East China [14]. The difference in these results might be attributed to the genetic background discrepancy between refuge and cultivated populations. Refuge populations are expected to have higher genetic variation than cultivated ones because the latter generally represent a part of the original gene pool [15]. A number of studies have described the genetic structure and inferred possible glacial refuges of Ginkgo in China based on molecular markers, including isozyme electrophoresis [16], random amplified polymorphic DNA (RAPD) [11,17] and inter-simple sequence repeat (ISSR) analysis [10]. For example, Shen et al. (2005) examined the genetic structure of eight Ginkgo populations in China and suggested that the Ginkgo refugium is located in Southwest China, and the populations located in the Jinfou Mountain across Nanchuan, Chongqing and Guiyang City are probably the most primitive natural relicts of Ginkgo [12]. In addition, a single haplotype was found in the population located in the West Tianmu Mountain, Zhejiang Province. Among existing molecular markers, SSRs have become the most preferred because they are typically codominant, reproducible, cross-species transferable and highly polymorphic [18]. SSR markers are widely used for core collection construction [19,20] and genetic diversity analysis in many crop species [21].
The construction of a germplasm repository fully preserving genetic resources is critical for comprehensive conservation programs for endangered species [22]. Developing core collections requires both morphological data and molecular markers. Morphological traits are easy to observe and measure. However, they are variable, subject to many limitations and particularly depend on the environment [23,24]. On the contrary, molecular markers are independent of environmental factors and have been effectively applied in plant breeding and gene resource assessment [25]. It has been widely reported that the diversity of molecular markers, e.g., microsatellites, could be a good indicator of plant adaptation potential [26]. Conservation studies often infer adaptive potential from neutral molecular marker data [27]. Such studies will enhance the value of regionally adapted germplasm [28] and allow for better utilization and management of regional challenges, such as tolerance to abiotic stresses [29], disease resistance [30] and product quality traits [31].
A detailed molecular evaluation of the Ginkgo accessions will provide insights into the genetic diversity and relationships among different accessions. Consequently, it is imperative to clarify the genetic variation and population structure of Ginkgo germplasm resources. This effort will facilitate the establishment of the gene pool and understanding of the effect of domestication on genetic diversity and aid the breeding of new varieties [3,32]. In this study, EST-SSR loci identified based on transcriptome data were used to analyze the composition, distribution and characteristics of Ginkgo populations. The EST-SSR markers were designed and their polymorphism levels in Ginkgo individuals representing ten distribution regions were analyzed, and a core collection of Ginkgo germplasm has been constructed based on these EST-SSR markers.
2. Materials and Methods
2.1. Plant Material and Prospected Provinces
A total of 101 Ginkgo individuals from nine provinces of China, including Guangxi (5), Guizhou (8), Hubei (4), Jiangsu (41), Liaoning (3), Shandong (20), Shaanxi (3), Zhejiang (4) and Hunan (11), and 2 individuals from Japan were sampled (Figure 1 and Table S1).
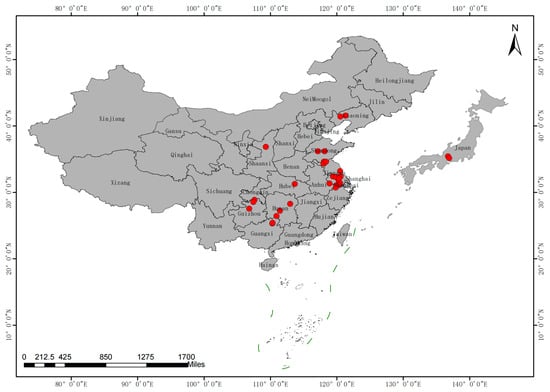
Figure 1.
Map of sampling sites for the 99 samples of Ginkgo germplasm across nine provinces of China and 2 samples of Ginkgo germplasm from Japan.
2.2. SSR Extraction from Transcriptome Data and Primer Design
The EST-SSR loci were screened based on 11 transcriptome databases of Ginkgo, including leaves, stems and flower buds. The MISA (microsatellite) software (https://webblast.ipkgatersleben.de/misa/index.php?action=1 (accessed on 8 April 2020)) was used to screen the repeat sequence sites in the Ginkgo transcriptome. Potential SSR markers were selected according to the criteria that the number of repetitions for mono-, di-, tri-, tetra-, penta-, and hexanucleotides were 10, 6, 5, 5, 5 and 5, respectively. The Primer 5.0 software was used to design SSR primers with sequence lengths > 20 bp, the GC content was between 40% and 60%, and the annealing temperature was between 55 °C and 75 °C. A total of 43,731 pairs of specific primers were successfully designed for 173,160 SSR loci. In order to verify the effectiveness of the SSR primers, 100 pairs of primers were randomly selected for synthesis (Table S2).
2.3. PCR and Polyacrylamide Gel Electrophoresis
A total of 25 g fresh leaves for each sample was collected and dried in allochronic silica gel for DNA extraction. Genomic DNA was extracted using the CTAB (Cetyltrimethylammonium Ammonium Bromide) method [33]. The quality of DNA was detected by 1% agarose gel electrophoresis, and the concentration and purity of DNA were detected using an ultraviolet spectrophotometer (756 PC, American). Each sample was diluted to a concentration of 40 ng/μL and stored at −20 °C.
Polymerase chain reaction (PCR) was performed in a 10 μL volume containing 5 μL Premix Taq™ (Tsingke Biomedical Technology, Beijing, China), 1 μL forward primer, 1 μL reverse primer, 1 μg DNA and 2 μL ddH2O. PCR amplification was performed using the following steps: initial denaturation at 96 °C for 2 min, denaturation at 96 °C for 10 s, optimal gradient annealing for 30 s, 30–35 cycles of extension at 72 °C for 1 min and finally an elongation step at 72 °C for 1 min. The PCR product was detected by 2%–3% agarose electrophoresis, and the primers with clear bands at 50–500 bp were selected to characterize the polymorphism. The amplified products were electrophoresed on 8% polyacrylamide gels in 5 × TBE buffer at a voltage of 200 V for 2 h. Electrophoresis gels were stained with Silver Nitrate acid dye solution.
For the 100 pairs of SSR markers selected, the PCR results showed that 50 pairs of primers generated clear and reproducible amplification products with high amplification efficiencies (Figure S1). Polymorphic primer bands of the above 50 primers were screened using 101 Ginkgo germplasm genomic DNA samples, and 20 polymorphic primers were obtained. Moreover, their PCR products showed polymorphisms in the tested germplasms (Figure S2). Reproducible and consistent PCR results for SSR primers were recorded separately as present (1) or absent (0) in a binary matrix for the 20 polymorphism loci.
2.4. Molecular Data Analysis
Based on the characterization of a matrix, the POPGENE 32 software [34] was used to evaluate the parameters of population genetic diversity, including number of alleles (Na), effective number of alleles (Ne), observed heterozygosity (Ho), expective heterozygosity (He), Nei’s genetic diversity index (H), genetic differentiation coefficient (Gst), gene flow (Nm) and Shannon’s diversity index (I). The percentage of polymorphic loci (P) and locus polymorphism information content (PIC) were calculated using the PowerMarker v3.25 software [35].
To infer population structure, Bayesian clustering analysis was conducted in the STRUCTURE version 2.3.4 software [36]. The number of groups (K) was set from 1 to 11, with 10 independent runs, using an admixture ancestry model and 10,000-step Markov Chain Monte Carlo (MCMC) replicates after a 10,000-step burn-in for each run. The best K value was inferred by delta K in the STRUCTURE HARVESTER software [37] and the CLUMPP1.1.2 software [38]. The results were plotted using the DISTRUCT 1.1 software [39]. A cluster analysis based on genetic distance was performed by the unweighted pair-group method with the arithmetic mean (UPGMA) approach in the MEGA 7.0.14 software [40]. Principal component analysis (PCA) was calculated using the GenAlEx v6.502 software [41].
2.5. Construction of the Core Collection
A total of 72 germplasm groups were obtained by random combination of two grouping principles (ten groups according to geographical origins (random non-grouping method)), and four sampling ratios within groups (simple proportional (P strategy), logarithmic proportion (L strategy), square-root proportion (S strategy) and genetic diversity proportion (G strategy)) and two sampling methods (the locus-first stepwise clustering method, stepwise clustering random sampling method) were used (Tables S4-1–S4-5). The PowerMarker v3.25 software was used to compare the differences between sampling methods for core collection construction [35]. The sampling ratios were set to 5%, 10%, 15%, 20%, 25%, 30%, 35% and 40%. According to the simulated annealing algorithm, the core collection of Ginkgo germplasms was constructed based on the maximizing allelic richness. The POPGENE 32 software [34] was used to calculate the genetic diversity parameters of the core varieties, which were evaluated by calculating the retention rates of genetic diversity parameters and t-tests (Tables S5–S8). PCA was used to confirm the reliability of the constructed core collection.
3. Results
3.1. EST-SSR Distribution in the Gingko Genome
There are 43,073 SSR sequences with a total length of 1,150,995,496 bp. The occurrence rate of SSRs throughout the Ginkgo genome is 35.23% (Table 1). There are six types of identified SSRs. The mononucleotide repeats are most abundant (87,017), with a proportion of 50.25%, followed by di- (69,835, 40.33%), tri- (11,923, 6.89%), tetra- (3843, 2.22%), hexa- (161, 0.09%) and pentanucleotide (381, 0.22%) repeats. The mono-, di- and trinucleotide repeats account for 97.47% of the total. There are 112,003 SSRs with a number of repeats higher than ten, accounting for 64.68% of all the SSR loci (Table 2).

Table 1.
Distribution characteristics of SSR sites in nuclear transcriptome of Ginkgo.
Table 2.
Statistics of repeat times of SSR sites with different repeat types.
3.2. SSR Type of the Ginkgo Genome and Validation of the SSR Markers
The SSR repetition type and frequency were determined in the Ginkgo genome. The frequencies of A/T and G/C were 82,238 and 4779, accounting for 94.51% and 5.49% of the mononucleotide repeats, respectively. Four types of dinucleotide repeats were found in the Ginkgo transcriptome. The most dominant dinucleotide is AT/AT, accounting for 52.24% of the total repeats, followed by AG/CT (25.24%) and CG/CG (0.13%). Ten types of trinucleotide repeats were found, among which the frequencies of AAG/CTT, ATC/GAT and AAT/ATT account for 32.01%, 24.16% and 20.63%, respectively. There were 25 types of tetranucleotides identified, among which ACAT/ATGT and AGAT/ATCT are enriched, accounting for 40.70% and 23.47%, respectively. In addition, the most common types of pentanucleotide (23) and hexanucleotide (69) repeats were AAGAT/ATCTT (36.65%), AAAAG/CTTTT (9.32%), AAAAT/ATTTT (9.32%), ACATAT/ATATGT (33.33%), AGATAT/ATATCT (17.06%), ACCATC/GATGGT (8.40%) and AAAGCT/AGCTTT (5.77%) (Figure 2).
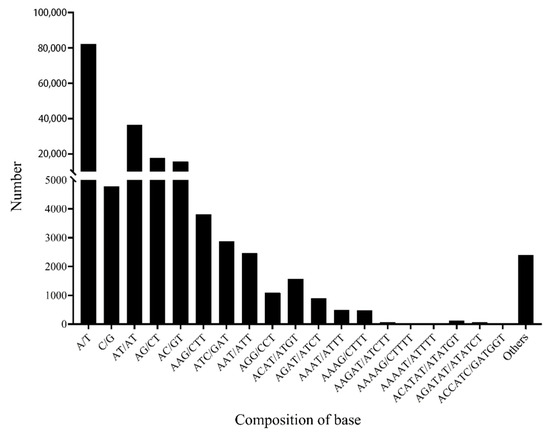
Figure 2.
Distribution of SSR repeat motif types in transcriptome of Ginkgo.
The sequence length of SSR loci ranged from 10 to 1736 bp, with an average length of 23.31 bp, among which 113,282 loci were mainly in the range of 10 to 20 bp, accounting for 78.81% of the total (Figure S3).
3.3. Allelic Richness of the SSR Loci
The 50 candidate primer pairs were screened in the Ginkgo germplasm resources, and 20 of them with clear product polymorphism were selected for further analysis. A total of 85 alleles were detected using these 20 EST-SSRs in the 101 Ginkgo germplasms. The number of alleles (Na) observed at each locus in the dataset ranged from 2 (loci GbSSR27072 and GbSSR34776) to 8 (GbSSR27860), with an average of 4.250. The average values representing the number of effective alleles (Ne) and the polymorphic locus percentage (PPL) are 2.504 and 0.951, respectively. The average observed heterozygosity and expected heterozygosity are 0.809 and 0.566, respectively. The Shannon’s diversity index (I) ranges from 0.662 (GbSSR05243) to 1.975 (GbSSR27860), with an average value of 0.993. The polymorphism information content (PIC) varies between 0.430 (GbSSR05243) and 0.838 (GbSSR27860), with an average of 0.589 (PIC > 0.5), indicating a high level of polymorphism and wide genetic variation in the 101 Ginkgo germplasm resources (Table 3). These results suggested that the loci containing a considerable amount of genetic information can be used for genetic diversity analysis.
Table 3.
Genetic diversity parameters of 20 pairs of SSR primers in the 101 germplasm resources.
3.4. Genetic Diversity of the Collected Ginkgo Germplasm
Genetic variation at 20 EST-SSR loci was assessed in the 101 Ginkgo germplasm resources collected from 10 geographical origins. The results indicated that the Ginkgo populations possess high genetic diversity, which is supported by the values for Na (from 2.2632 to 3.2105), Ne (from 1.9100 to 2.5544), H (from 0.4420 to 0.5797), I (from 0.7355 to 0.9266), He (from 0.5494 to 0.6930) and Ho (from 0.7606 to 0.9411) (Table 4). Among all populations, the Guizhou population had the highest genetic diversity (He = 0.6930, H = 0.5797), while the Liaoning population had the lowest (He = 0.5494, H = 0.4420) (Table 4). The genetic diversity of the Ginkgo populations in Southwest China (including the Guizhou, Hubei, Guangxi and Hunan populations) is the highest, followed by those in East China (including the Jiangsu, Shandong and Zhejiang populations). The populations with the lowest genetic diversity are located in Northwest China (including the Shaanxi and Liaoning populations). The gene flow of Ginkgo populations is high (Nm ranges from 0.731 to 275.569, with an average value of 2.671) (Table 3). This suggests that the Ginkgo populations are genetically similar.
Table 4.
Genetic diversity of 101 Ginkgo germplasm resources in different populations based on the 20 polymorphic EST-SSR loci.
3.5. Genetic Relationship between Genotypes of Ginkgo Germplasms
The AMOVA results show that the highest genetic variation (96%) occurs within populations, while only 4% genetic variation was observed among populations (Table S3). The clustering pattern based on the analysis of the EST-SSR profiles revealed the formation of two (best delta K, Figure 3) main clusters among the selected 101 Ginkgo germplasm resources from ten geographical origins. Half of the genetic resources in each individual are grouped into one class. When K = 3, one third of the genetic resources of each individual are grouped into one category.
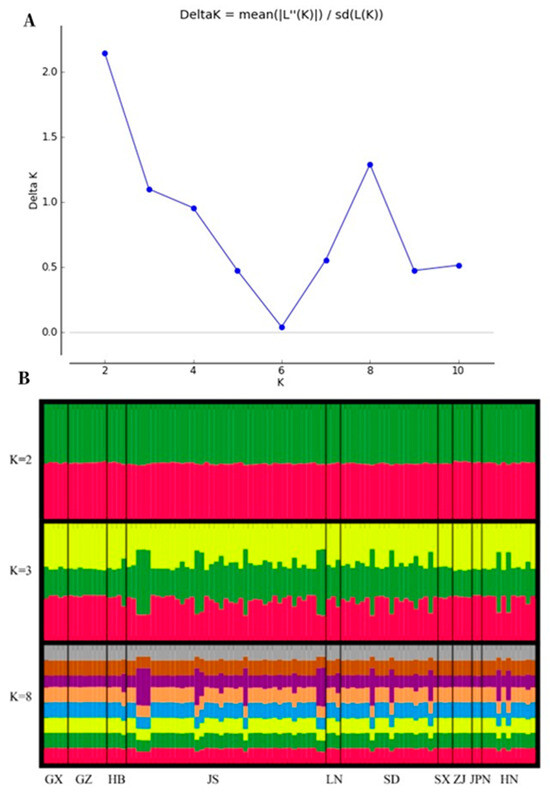
Figure 3.
The distribution of ΔK and the cluster plot based on STRUCTURE analysis. (A) The best K was estimated from the ΔK statistics using Structure Harvester for the ten Ginkgo populations. Population structure bar plots from transcriptome data showed two clusters (best delta K = 2). (B) Genetic structure of Ginkgo accessions in ten different populations. Each vertical bar indicates an individual, and the height of each colored bar represents the proportion of assignment to that cluster. Population abbreviations: GX, Guangxi Province; GZ, Guizhou Province; HB: Hubei Province; JS: Jiangsu Province; LN: Liaoning Province; SD: Shandong Province; SX: Shaanxi Province; ZJ: Zhejiang Province; JPN: Japan; HN: Hunan Province.
The PCA showed that the three principal components accounted for 87.24% of the total genetic variation. The first principal component accounted for 48.35%, which divided the 10 Ginkgo populations into two groups (the first group includes the Guangxi, Guizhou, Shaanxi, Hubei, Hunan and Japan subgroups; the second group includes the Zhejiang, Jiangsu, Shandong and Liaoning subgroups). The second principal component accounted for 22.99% of the variance and divided the Ginkgo populations into four groups (the first group includes the Guangxi, Guizhou, Shaanxi and Hubei subgroups; the second group includes the Zhejiang, Jiangsu and Shandong subgroups; the third group includes the Liaoning subgroup; the fourth group includes the Japan and Hunan subgroups). The third main component accounted for 15.90% and divided the 10 Ginkgo populations into three groups (the first group includes the Guangxi, Guizhou, Shaanxi, Hubei, Zhejiang, Jiangsu, Shandong and Hunan subgroups; the second group includes the Liaoning subgroup; the third group includes the Japan subgroup).
Individual PCA divided the 101 Ginkgo biloba resources into three categories. The majority of the Ginkgo groups were gathered together, except for the Jiangsu subgroup. Among them, the Guangxi, Guizhou and Hunan subgroups were closely clustered, indicating that their genetic relationship is relatively close. The population in Jiangsu is relatively dispersed, and some individuals are distant from other populations, indicating that the genetic relationship between them is distant. This may be due to the large differences between individuals, the phenomenon of gene exchange or remote introduction.
The UPGMA method was used to perform cluster analysis. The cluster results show that the 10 Ginkgo populations can be divided into two categories and three subpopulations at a genetic distance of 0.08, which was consistent with the results of the genetic structure analysis (K = 3) and PCA. The first group includes the Jiangsu, Shandong, Hunan, Hubei, Guangxi, Guizhou, Shaanxi and Liaoning populations. The Liaoning population is classified as a single subpopulation, indicating that the genetic relationship between the Liaoning population and the other populations is distant, while the Jiangsu and Shandong populations are grouped together, indicating that their genetic relationship is the closest. The second category includes only the Japan population, indicating that it has the most distant genetic relationship with respect to the other populations.
The 101 germplasm resources of Ginkgo can be divided into three categories, which is consistent with the results of the PCA. However, the categories are not clustered strictly according to their geographical provenances. The first, second and third categories include 7, 21 and 73 Ginkgo germplasm resources, respectively. The results of the PCA (Figure 4A and Figure 5B), UPGMA (Figure 4B) and phylogenetic tree (Figure 5A) jointly confirmed the genetic structure of these Ginkgo populations obtained with K = 3 (the third top delta K, Figure 3). These results indicate that there is extensive gene exchange between Ginkgo populations, which is consistent with the results for population genetic differentiation.
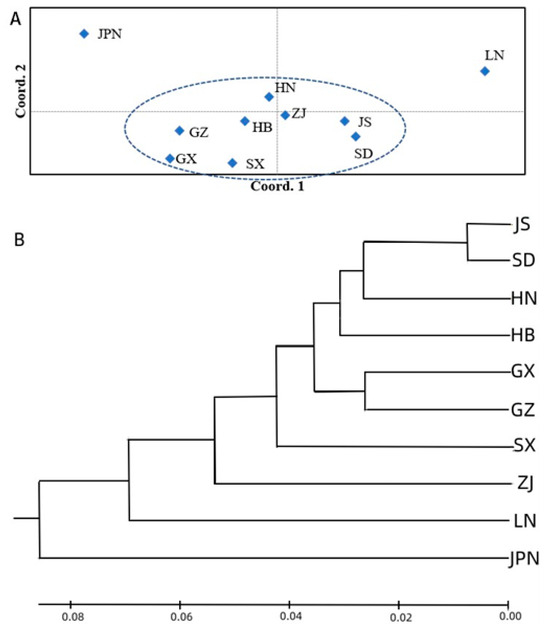
Figure 4.
(A) PCA and (B) UPGMA dendrograms show the relationships between the ten Ginkgo germplasm resource populations studied by 20 polymorphic EST-SSRs. For population abbreviations, please see Figure 3.
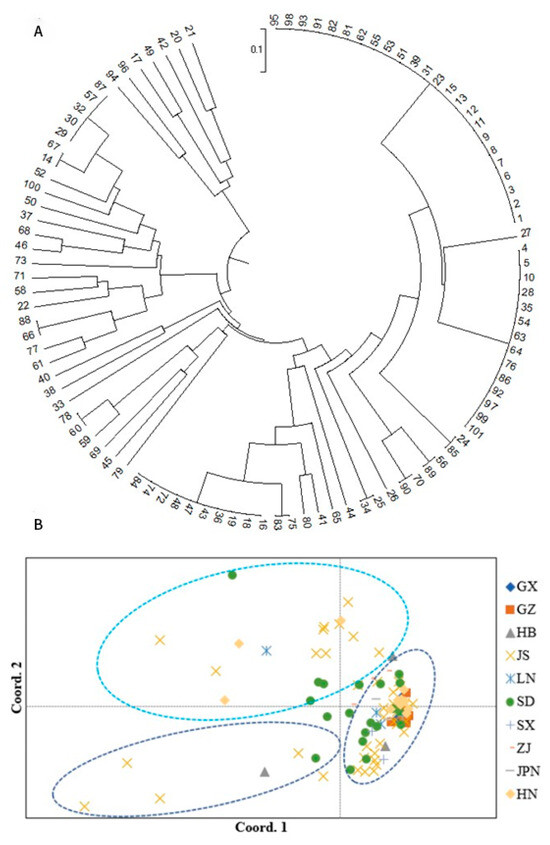
Figure 5.
Phylogenetic tree and PCA of 101 Ginkgo germplasm resources based on EST-SSRs. (A) Maximum-likelihood (ML) tree illustrates genetic relationships between the 101 Ginkgo germplasm resources. For individuals’ abbreviations, please see Table S1. (B) Principal coordinate analysis of the 101 individuals from the ten Ginkgo populations, assessed with 20 EST-SSR markers. For population abbreviations, please see Figure 3.
3.6. Core Collection Construction of the Ginkgo Germplasms
Shannon’s diversity index (I) and Nei’s gene diversity index (H) values among the 72 germplasm groups and the original germplasm were tested by t-tests. The results showed that the genetic diversity of the 70 groups was not significantly different from that of the original germplasm (p > 0.05), except for C9 (individual codes: 31, 52, 79 and 100) and C17 (individual codes: 13, 22, 81 and 92) (p < 0.05), which indicated that most of the sampling schemes in this study could meet the conditions of the Ginkgo core collection construction (Table S5).
Different core collections constructed by four different sampling strategies (p, L, S and G strategies) and a random non-grouping method were compared. Using the locus-first clustering method (I = 0.994, H = 0.570) and random clustering (I = 0.956, H = 0.528), the genetic diversity of the core germplasm obtained with the genetic diversity proportion (the G strategy) was the highest, while that obtained with the random non-grouping method was the lowest (I = 0.927, H = 0.490). These results indicate that the grouping strategy according to origin is better for the construction of the core germplasm of Ginkgo (Table S6).
The genetic diversity index of the core collection was constructed using eight different overall sampling ratios (5%, 10%, 15%, 20%, 25%, 30%, 35% and 40%) and the results were compared. The results show that the average Shannon’s diversity index (I) and Nei’s gene diversity index (H) values of the core collection germplasm obtained by the locus-first clustering method under the other seven overall sampling ratios were higher than those obtained by the random clustering sampling method, except for 5%, indicating that the genetic diversity of the core germplasm obtained by the locus-first clustering method was higher. According to the I and H values, the genetic diversity of the core germplasm was the most abundant when the total sampling proportion was 25% (Table S7).
The optimal sampling scheme (grouped according to origin, sampled within the group according to the genetic diversity proportion and the locus-first clustering method, and with the overall sampling proportion being 25%) was determined through the comparative analysis of different sampling schemes. To provide an overview of the whole genetic diversity of the germplasm, a core collection (C29, individual codes: 3, 4, 5, 7, 8, 13, 15, 16, 17, 22, 30, 48, 60, 61, 79, 80, 81, 82, 83, 84, 85, 87, 88, 89, 90, 92 and 95) that contained 26.73% of the 101 Ginkgo individuals was constructed. The core collection includes Ginkgo individuals from the Guangxi (3), Guizhou (3), Hubei (3), Jiangsu (3), Liaoning (2), Shandong (3), Shaanxi (3), Zhejiang (3), Hunan (2) and Japan (2) populations (Table S8). The results of the core collection evaluation demonstrate that the retention rates of the number of resources, Na, Ne, I, H and PPL (%) were 26.73%, 95.29%, 103.43%, 102.25%, 102.91%, and 100.00%, respectively, indicating that the core collection can represent the genetic diversity of the original germplasm (Table 5). The PCA results for the core germplasm and the original germplasm (Figure S4) show that the core germplasm basically spread throughout the whole coordinate map, indicating that the constructed core germplasm has good representability.
Table 5.
Genetic diversity evaluation of core collection.
4. Discussion
Ginkgo is an ancient medicinal tree species; the various parts of the tree can be used to treat diseases due to the Ginkgo-specific bioactive compounds they contain [42]. SSRs were used for the genetic diversity study of the germplasm, genetic map construction, kinship identification and core germplasm collection due to their codominant inheritance and rich polymorphism [43]. We assessed the genetic diversity and population structure of 101 Ginkgo germplasm across China and Japan using 20 EST-SSR markers. Shannon’s diversity index, expected heterozygosity and Nei’s genetic diversity index values revealed that the Ginkgo populations have a high level of genetic diversity. The collection, preservation, evaluation and utilization of Ginkgo germplasm resources are of great significance for high tree quality and the breeding of new varieties [44]. Based on the 20 EST-SSR markers, a core collection of Ginkgo including 27 genetic resources was constructed. This study gives insight into the choice and use of the most variable Ginkgo accessions, which are identified here as potential resources for future breeding programs of new and more productive varieties.
4.1. SSR Locus Analysis of the Ginkgo Transcriptome
Polymorphic markers are important tools for studying population inheritance at the genomic level [45]. The effective amplification rates observed in our study are between 60% and 90%, as recommended by Saha et al. (2004) [46]. EST-SSR markers have relatively high amplification rates because the sequence data used for primer design come from a relatively highly conserved transcribed region rather than a randomized whole-genome library. A higher effective amplification rate is one of the criteria used for the development of high-quality EST-SSR markers. In this study, 173,160 SSR loci were obtained from 15,176 Unigenes by screening the sequences of 43,073 Unigenes in the Ginkgo transcriptome. The frequency of SSRs was 35.23%, which was much higher than in previous studies (5.95%) [47] and the results for another endangered species, Abies alba (0.45%) [48]. These results were in agreement with those reported by Fan et al. (2021) [47], who revealed that all microsatellite loci were polymorphic and displayed significant spatial differentiation of genetic variation in Ginkgo. Differences in the genomes of species lead to differences in SSR loci in different plant transcriptomes, and the adopted methods or screening criteria may also affect the frequency of SSR loci [49].
The number of single nucleotide repeats in the Ginkgo transcriptome is the largest (50.25%), but it is relatively easy for mismatch to occur, which leads to sequencing failure, so it is rarely used in practice. In addition, dinucleotide and trinucleotide repeats dominated, accounting for 47.22% of the total number of SSRs, which was consistent with the results of previous studies [47], indicating that short repeats were more prone to mutation. Among the six nucleotide repeat types, the number of SSR sequences containing A/T bases was the largest, which may be due to the fact that the number of complementary hydrogen bonds of A/T was less than that of G/C and the frequency of fluctuation, which took place relatively easily. Another explanation is that this situation is caused by the insertion of polyA at the 3′ end into the genome and the conversion of methylated C residues into T residues [50]. The AT/AT repeat is the most common type of dinucleotide repetition, accounting for 52.24%. The most common type of trinucleotide repetition is AAG/CTT, accounting for 32.01%. This distribution characteristic is consistent with most tree species, such as Taxus fuana [51] and Firmiana danxiaensis [52], indicating that AT/AT and AAG/CTT belong to the dominant and highly frequent gene sequences in different species. In this study, the length of SSR sequences in the transcriptome of Ginkgo was mainly in the range of 10–20 bp, and there were 30,462 SSR loci with sequence lengths greater than 20 bp, accounting for only 21.19% of the total number, indicating that low-length SSR sequences were more prone to variation in Ginkgo [53]. These SSR loci with lengths greater than 20 bp usually have high polymorphism, which is of great significance for the development of molecular markers.
4.2. Development of SSRs in the Ginkgo Transcriptome
The developed SSR molecular markers in different species are distinctive, which can be attributed to their genomic properties. In this study, 50 pairs of effective SSR primers were screened, and finally 20 pairs of primers with a polymorphism percentage of 40% and an average PIC value of 0.594 were obtained, ensuring that the developed primers were polymorphic in the Ginkgo germplasm resources and can be used for genetic diversity analysis of Ginkgo [54]. Through SSR primer validity verification and polymorphism screening, the 20 SSR molecular markers with good stability and high polymorphism were successfully developed, which provided stable and reliable results for the genetic diversity analysis and core germplasm construction of Ginkgo.
4.3. Genetic Diversity and Population Structure of the 101 Ginkgo Germplasm Resources
The observed heterozygosity of Ginkgo populations was higher than the expected heterozygosity at the majority of loci (19). We only observed lower heterozygosity at one locus (GbSSR01538) compared to the expected heterozygosity. These results suggest that there are frequent gene exchange events occurring in the ten ginkgo populations, confirming the genotype hybridization of Ginkgo germplasm resources. The PIC value indicates the level of polymorphism information provided, as well as the usefulness of the microsatellite primers for genotyping, gene mapping, molecular breeding and germplasm evaluation. In this sense, the most suitable locus for genetic characterization of the analyzed set of Ginkgo genotypes was GbSSR27860, which showed PIC values equal to or higher than 80% [55].
EST-SSR markers have been extensively developed for multiple purposes, like genetic diversity analysis [56], genetic improvement [57], species delimitation [58] and marker-assisted breeding [59]. In this study, Ginkgo germplasm resources showed high genetic diversity (I = 0.993, Ho = 0.809, He = 0.566, H = 0.563) compared with other endangered species, such as Isoetes yunguiensis (mean Ho = 0.475, He = 0.463, I = 0.782 for EST-SSRs [60]) and economically important plants, e.g., Camellia reticulata (mean Ho = 0.242, He = 0.457 for EST-SSRs [61]), and the results on Ginkgo from other studies (H = 0.2408, I = 0.3599 for ISSR [62]; H = 0.21, I = 0.34 for AFLP [63]; H = 0.12, I = 0.19 for AFLP [64]; He = 0.3159, I = 0.4489 for RAPD [11]; He = 0.808 for SSR [14]). Thus, the methods (e.g., SSR, ISSR and RAD) and the number of loci used to calculate genetic diversity can influence values of genetic diversity. For example, endemic species showed lower genetic diversity (Ho and He) within populations than regional or widespread species using STMS (Sequence Tagged Microsatellite Site)-based data, while no difference between them was found when RAPD (Random Amplified Polymorphic DNA)-based data were used [65]. In addition, the genetic diversity of different species also depends on their life form, breeding system and geographic range [65].
The genetic structure of species is affected by the interaction of multiple factors, such as the transmission model of seeds and pollen, population demographic history, geological events, geographical or ecological barriers, and divergent selection for environmental factors [66]. The Ginkgo accessions in the present study were clustered into three groups based on PCA, UPGMA and STRUCTURE analyses. The results of the PCA and analysis of molecular variance showed a wide range of variability among our Ginkgo groups (among populations = 98%, within populations = 2%). Our results are in line with previous studies (among populations = 73.57%, within populations = 26.43%), suggesting that most variation was maintained among Ginkgo populations [67]. The reason for the high genetic variation and low genetic differentiation in Ginkgo populations may be related to the gene exchange between the populations (Nm = 2.671), which can overcome genetic drift to a certain extent [68]. Germplasm resources are the most basic and key materials in breeding, and genetic variation mainly comes from artificial selection, which is more significant for the genetic improvement of Ginkgo. The results of this study further demonstrated the long-term artificial selection of Ginkgo germplasm resources, such as grafting, cross breeding and remote introduction to cultivation places (such as the introduction of Ginkgo plants from Tianmu Mountain in Zhejiang Province to Hunan Province). Breaking through the geographical restrictions will produce more frequent gene exchange events, thus making it difficult for Ginkgo to follow an independent evolutionary route. Therefore, it is necessary to cultivate new varieties that can adapt to complex environmental conditions and present excellent comprehensive phenotypes to meet the requirements of different regions.
4.4. Construction of the Core Germplasm of Ginkgo
At present, the data sources for core germplasm construction mainly include phenotypic trait and molecular marker data. The data of phenotypic traits can directly reflect the phenotypic characteristics of crops, but it is easy for these to be affected by the environment, which is relatively suitable for Oryza sativa, Gossypium spp., Glycine max and other crops with a short growth cycle [28]. Molecular marker data are the expression of DNA molecular-level variation, which is not affected by the environment and the growth and development stage of the crop itself and is applicable to Cunninghamia lanceolata, Castanea mollissima, Prunus armeniaca and other perennial trees [28]. For plants with large population sizes, performance data and molecular marker data are combined to construct core germplasms, which can not only retain the phenotypic characteristics of crops, but also reflect the genetic characteristics of crops at the molecular level, making them more representative. Although this study collected phenotypic trait data on the basis of previous studies, for tall perennial trees like Ginkgo, long-term investigation is needed to provide a more complete and objective data basis, and the germplasm resources of Ginkgo are limited. Therefore, in this study, relatively stable EST-SSR molecular marker data were used to construct the core germplasm of the Ginkgo germplasm resources.
It was found that the diversity index of the core germplasm grouped by origin was higher than that of the core germplasm without grouping, indicating that grouping was more representative than non-grouping. This is consistent with existing research findings [69]. The results showed that the core germplasm constructed according to the proportion of genetic diversity and the locus priority cluster sampling method had the best representation. For example, Raamsdonk and Wijnker (2000) used genetic diversity strategies to construct a tulip core germplasm [70]. The minimum genetic resources and genetic duplication represent the maximum genetic diversity of the original germplasm [71]. At present, in most studies of core germplasm, the overall sampling proportion is between 5% and 40%. Therefore, when constructing the core germplasm of different germplasm resources, sampling should be carried out according to their resource quantity and genetic characteristics.
According to the above analysis, the optimal sampling scheme was obtained, which included grouping by origin, sampling by the proportional strategy of genetic diversity within groups and the priority clustering method for loci, and the overall proportion was 25%. Finally, 27 core germplasm resources for Ginkgo were constructed. The genetic diversity parameters of the core germplasm, original germplasm and retained germplasm were compared. The number of resources, number of alleles (Na), number of effective alleles (Ne), Shannon’s diversity index (I), Nei’s genetic diversity index (H) and percentage of polymorphic loci (PPL) retention rates of the core germplasm were 26.73%, 95.29%, 103.43%, 102.25% and 102.91% and 100.00%, respectively. These results can represent the maximum genetic diversity of the original germplasm with the least number of resources, which conforms to the principle of core germplasm construction. The results of the PCA also showed that the core germplasm covered the whole distribution area of the original germplasm, indicating that the core germplasm constructed in this study was successful. However, the retained germplasm may also retain genetic information and phenotypic traits missing from the core germplasm, which should not be ignored in the actual utilization of germplasm resources. In subsequent studies, phenotypes of Ginkgo germplasm resources in different growth cycles can be investigated and collected to further evaluate and confirm the constructed core germplasm.
5. Conclusions
In this study, we assessed the genetic diversity, population structure and relationships of 99 Ginkgo germplasm samples across nine provinces of China and 2 samples from Japan using 20 EST-SSR markers. The SSR loci were found to be significantly polymorphic and effective for differentiation among the accessions studied. The results of this study showed that Ginkgo germplasm resources had a high level of genetic diversity (the mean values of I, He and H were 0.993, 0.566 and 0.563, respectively), revealing that there are differences in the levels of genetic diversity among populations. Based on the EST-SSR data, the optimal sampling scheme was screened out, and the core collection was well representative (PCA results, Figure S4). Our results provide a reference for the genetic improvement, resource protection and utilization of Ginkgo.
Supplementary Materials
The following supporting information can be downloaded at: https://www.mdpi.com/article/10.3390/f14112155/s1, Figure S1: PCR electrophoresis diagram of Partial primers of SSRs; Figure S2: Polymorphism map of GbSSR01538 in 101 Ginkgo germplasm resources; Figure S3: Length distribution of SSR in Ginkgo transcriptome; Figure S4: Principal component analysis of the core collection and the initial collection of Ginkgo; Table S1: Sample information of germplasm resources in Ginkgo; Table S2: Primer sequence and product sizes of 100 SSR markers for analyzing genetic diversity; Table S3: Analysis of molecular variance of Ginkgo populations; Table S4-1: Ginkgo core collection constructed based on simple proportional sampling; Table S4-2: Ginkgo core collection constructed based on square root proportion; Table S4-3: Ginkgo core collection constructed on logarithmic proportion; Table S4-4: Ginkgo core collection constructed by genetic diversity proportion; Table S4-5: Ginkgo core collection constructed by random non-grouping method; Table S5: Tests for core collection of Ginkgo; Table S6: Comparison of different sampling strategies; Table S7: Comparison of different sampling ratio in group; Table S8: Ginkgo core collection.
Author Contributions
Conceptualization, Z.Y., Z.F., M.L. and Y.W.; methodology, Z.Y., Z.F., M.L. and Y.W.; software, Z.Y.; validation, Z.Y.; formal analysis, Z.Y.; investigation, L.T., X.W., Q.W. and D.C.; resources, M.L. and Y.W.; data curation, Z.Y. and C.W.; writing—original draft preparation, Z.Y. and Z.F.; writing—review and editing, Z.Y., Z.F., M.L. and Y.W.; visualization, K.F.; supervision, M.L. and Y.W.; project administration, Y.W.; funding acquisition, Y.W. All authors have read and agreed to the published version of the manuscript.
Funding
The National Natural Science Foundation of China (32171842); the National Key Research and Development Project of China (2019YFD1100403); the Hunan Provincial Department of Finance ((2023)5); and the Key Research Projects of Hunan Provincial Department of Education (20A521).
Data Availability Statement
The germplasm resources and SSR data are provided in the Supplementary Materials.
Acknowledgments
We thank Shuncun Jiang and Xiaoqin Mi for the field survey, the local forestry bureau for their assistance and QiYe Wang for their help in editing the manuscript.
Conflicts of Interest
The authors declare no conflict of interest.
References
- Guan, R.; Zhao, Y.; Zhang, H.; Fan, G.; Liu, X.; Zhou, W.; Shi, C.; Wang, J.; Liu, W.; Liang, X.; et al. Draft genome of the living fossil Ginkgo biloba. Gigascience 2016, 5, 49. [Google Scholar] [CrossRef] [PubMed]
- Zou, K.; Liu, X.; Hu, Q.; Zhang, D.; Fu, S.; Zhang, S.; Huang, H.; Lei, F.; Zhang, G.; Miao, B.; et al. Root endophytes and Ginkgo biloba are likely to share and compensate secondary metabolic processes, and potentially exchange genetic information by LTR-RTs. Front. Plant Sci. 2021, 12, 704985. [Google Scholar] [CrossRef] [PubMed]
- Qing, J.; Meng, Y.D.; He, F.; Du, Q.X.; Zhong, J.; Du, H.Y.; Liu, P.F.; Du, L.Y.; Wang, L. Whole genome re-sequencing reveals the genetic diversity and evolutionary patterns of Eucommia ulmoides. Mol. Genet. Genom. 2022, 297, 485–494. [Google Scholar] [CrossRef] [PubMed]
- Li, Y.; Sheng, Y.; Liu, J.; Xu, G.; Yu, W.; Cui, Q.; Lu, X.; Du, P.; An, L. Hair-growth promoting effect and anti-inflammatory mechanism of Ginkgo biloba polysaccharides. Carbohydr. Polym. 2022, 278, 118811. [Google Scholar] [CrossRef] [PubMed]
- Dal Belo, S.E.; Gaspar, L.R.; Maia Campos, P.M. Photoprotective effects of topical formulations containing a combination of Ginkgo biloba and green tea extracts. Phytother. Res. 2011, 25, 1854–1860. [Google Scholar] [CrossRef]
- Sherif, I.O.; Al-Shaalan, N.H. Hepatoprotective effect of Ginkgo biloba extract against methotrexate-induced hepatotoxicity via targeting STAT3/miRNA-21 axis. Drug Chem. Toxicol. 2022, 45, 1723–1731. [Google Scholar] [CrossRef]
- Zheng, X.; Gao, Q.; Liang, S.; Zhu, G.; Wang, D.; Feng, Y. Cardioprotective properties of Ginkgo biloba extract 80 via the activation of AKT/GSK3β/β-Catenin signaling pathway. Front. Mol. Biosci. 2021, 8, 771208. [Google Scholar] [CrossRef]
- Priyanka, A.; Sindhu, G.; Shyni, G.L.; Preetha Rani, M.R.; Nisha, V.M.; Raghu, K.G. Bilobalide abates inflammation, insulin resistance and secretion of angiogenic factors induced by hypoxia in 3T3-L1 adipocytes by controlling NF-κB and JNK activation. Int. Immunopharmacol. 2017, 42, 209–217. [Google Scholar] [CrossRef]
- Mathavaraj, S.; Sabu, K.K. Genetic diversity and structure revealed by genomic microsatellite markers in Centella asiatica (L.) Urb., a plant with medicinal potential. Mol. Biol. Rep. 2021, 48, 7387–7396. [Google Scholar] [CrossRef]
- Ge, Y.; Qiu, Y.; Fu, C. Genetic diversity of the “living fossil” Ginkgo biloba based on ISSR marker. Biodivers. Sci. 2003, 11, 276–287. [Google Scholar]
- Fan, X.X.; Shen, L.; Zhang, X.; Chen, X.Y.; Fu, C.X. Assessing genetic diversity of Ginkgo biloba L. (Ginkgoaceae) populations from China by RAPD markers. Biochem. Genet. 2004, 42, 269–278. [Google Scholar] [CrossRef]
- Shen, L.; Chen, X.Y.; Zhang, X.; Li, Y.Y.; Fu, C.X.; Qiu, Y.X. Genetic variation of Ginkgo biloba L. (Ginkgoaceae) based on cpDNA PCR-RFLPs: Inference of glacial refugia. Heredity 2005, 94, 396–401. [Google Scholar] [CrossRef] [PubMed]
- Gong, W.; Chen, C.; Dobes, C.; Fu, C.X.; Koch, M.A. Phylogeography of a living fossil: Pleistocene glaciations forced Ginkgo biloba L. (Ginkgoaceae) into two refuge areas in China with limited subsequent postglacial expansion. Mol. Phylogenet. Evol. 2008, 48, 1094–1105. [Google Scholar] [CrossRef] [PubMed]
- Bhagwat, S.A.; Willis, K.J. Species persistence in northerly glacial refugia of Europe: A matter of chance or biogeographical traits? Biogeography 2008, 35, 464–482. [Google Scholar] [CrossRef]
- Tsumura, Y.; Ohba, K. The genetic diversity of isozymes and the possible dissemination of Ginkgo biloba in ancient times in Japan. In Ginkgo Biloba A Global Treasure: From Biology to Medicine; Springer Science & Business Media: Berlin/Heidelberg, Germany, 1997; pp. 159–172. [Google Scholar]
- Kuddus, R.H.; Kuddus, N.N.; Dvorchik, I. DNA polymorphism in the living fossil Ginkgo biloba from the Eastern United States. Genome Biol. 2002, 45, 8–12. [Google Scholar] [CrossRef]
- Daler, S.; Cangi, R. Characterization of grapevine (V. vinifera L.) varieties grown in Yozgat province (Turkey) by simple sequence repeat (SSR) markers. Turk. J. Agric. For. 2022, 46, 38–48. [Google Scholar]
- Sa, K.J.; Kim, D.M.; Oh, J.S.; Park, H.; Hyun, D.Y.; Lee, S.; Rhee, J.H.; Lee, J.K. Construction of a core collection of native Perilla germplasm collected from South Korea based on SSR markers and morphological characteristics. Sci. Rep. 2021, 11, 23891. [Google Scholar] [CrossRef] [PubMed]
- Jia, Y.; Bai, J.-Q.; Liu, M.-L.; Jiang, Z.-F.; Wu, Y.; Fang, M.-F.; Li, Z.-H. Transcriptome analysis of the endangered Notopterygium incisum: Cold-tolerance gene discovery and identification of EST-SSR and SNP markers. Plant Divers. 2019, 41, 1–6. [Google Scholar] [CrossRef]
- Chikh-Rouhou, H.; Mezghani, N.; Mnasri, S.; Mezghani, N.; Garcés-Claver, A. Assessing the genetic diversity and population structure of a Tunisian Melon (Cucumis melo L.) collection using phenotypic traits and SSR molecular markers. Agronomy 2021, 11, 1121. [Google Scholar] [CrossRef]
- Frankel, O. Genetic perspectives of germplasm conservation. In Genetic Manipulation: Impact on Man Society & Natural Resources; Cambridge University Press: Cambridge, UK, 1984; Volume 161, p. 170. [Google Scholar]
- Akan, S. Morphological characterisation and volatile analysis of Turkish garlic genotypes. Turk. J. Agric. For. 2022, 46, 424–440. [Google Scholar] [CrossRef]
- Morelos-Flores, D.A.; Montalvo-González, E.; Chacón-López, M.A.; Santacruz-Varela, A.; Zamora-Gasga, V.M.; Torres-García, G.; de Lourdes García-Magaña, M. Comparative study of four Jackfruit genotypes: Morphology, physiology and physicochemical characterization. Horticulturae 2022, 8, 1010. [Google Scholar] [CrossRef]
- Naval, M.d.M.; Zuriaga, E.; Pecchioli, S.; Llácer, G.; Giordani, E.; Badenes, M.L. Analysis of genetic diversity among persimmon cultivars using microsatellite markers. Tree Genet. Genomes 2010, 6, 677–687. [Google Scholar] [CrossRef][Green Version]
- Sumathi, M.; Yasodha, R. Microsatellite resources of Eucalyptus: Current status and future perspectives. Bot. Stud. 2014, 55, 73. [Google Scholar] [CrossRef] [PubMed]
- Ellis, J.; Burke, J. EST-SSRs as a resource for population genetic analyses. Heredity 2007, 99, 125–132. [Google Scholar] [CrossRef] [PubMed]
- Guerra-García, A.; Gioia, T.; von Wettberg, E.; Logozzo, G.; Papa, R.; Bitocchi, E.; Bett, K.E. Intelligent characterization of Lentil genetic resources: Evolutionary history, genetic diversity of germplasm, and the need for well-represented collections. Curr. Protoc. 2021, 1, e134. [Google Scholar] [CrossRef] [PubMed]
- Vasumathy, S.K.; Alagu, M. SSR marker-based genetic diversity analysis and SNP haplotyping of genes associating abiotic and biotic stress tolerance, rice growth and development and yield across 93 rice landraces. Mol. Biol. Rep. 2021, 48, 5943–5953. [Google Scholar] [CrossRef]
- Zhang, J.; Wedegaertner, T. Genetics and breeding for glandless upland cotton with improved yield potential and disease resistance: A review. Front. Plant Sci. 2021, 12, 753426. [Google Scholar] [CrossRef] [PubMed]
- Prasad, P.; Singh, V.; Aftab, N.; Gupta, A.; Kishor, R.; Kushwaha, H.K.; Singh, V.; Verma, R.S.; Kumar, B. Gamma irradiation-induced variability in morpho-agronomic and oil quality traits of Mentha piperita L. Int. J. Radiat. Biol. 2021, 97, 737–745. [Google Scholar] [CrossRef] [PubMed]
- Li, X.; Qiao, L.; Chen, B.; Zheng, Y.; Zhi, C.; Zhang, S.; Pan, Y.; Cheng, Z. SSR markers development and their application in genetic diversity evaluation of garlic (Allium sativum) germplasm. Plant Divers. 2022, 44, 481–491. [Google Scholar] [CrossRef]
- Porebski, S.; Bailey, L.G.; Baum, B.R. Modification of a CTAB DNA extraction protocol for plants containing high polysaccharide and polyphenol components. Plant Mol. Biol. Rep. 1997, 15, 8–15. [Google Scholar] [CrossRef]
- Yeh, F.C.; Yang, R.; Boyle, T.B.; Ye, Z.; Mao, J.X. POPGENE, the User-Friendly Shareware for Population Genetic Analysis; Molecular biology biotechnology centre, University of Alberta: Camrose, AB, Canada, 1997; Volume 10, pp. 295–301. [Google Scholar]
- Liu, K.; Muse, S.V. PowerMarker: An integrated analysis environment for genetic marker analysis. Bioinformatics 2005, 21, 2128–2129. [Google Scholar] [CrossRef] [PubMed]
- Pritchard, J.K.; Stephens, M.; Donnelly, P. Inference of population structure using multilocus genotype data. Genetics 2000, 155, 945. [Google Scholar] [CrossRef] [PubMed]
- Earl, D.; Vonholdt, B.M. STRUCTURE HARVESTER: A website and program for visualizing STRUCTURE output and implementing the Evanno method. Conserv. Genet. Resour. 2012, 4, 359–361. [Google Scholar] [CrossRef]
- Jakobsson, M.; Rosenberg, N.A. CLUMPP: A cluster matching and permutation program for dealing with label switching and multimodality in analysis of population structure. Bioinformatics 2007, 23, 1801–1806. [Google Scholar] [CrossRef] [PubMed]
- Rosenberg, N.A. DISTRUCT: A program for the graphical display of population structure. Mol. Ecol. Notes 2004, 4, 137–138. [Google Scholar] [CrossRef]
- Tamura, K.; Stecher, G.; Peterson, D.; Filipski, A.; Kumar, S. MEGA 6: Molecular evolutionary genetics analysis version 6.0. Mol. Biol. Evol. 2013, 30, 2725–2729. [Google Scholar] [CrossRef]
- Peakall, R.; Smouse, P.E. GENEALEX 6: Genetic analysis in Excel. Population genetic software for teaching and research. Mol. Ecol. Notes 2006, 6, 288–295. [Google Scholar] [CrossRef]
- Isah, T. Rethinking Ginkgo biloba L.: Medicinal uses and conservation. Pharmacogn. Rev. 2015, 9, 140–148. [Google Scholar] [CrossRef] [PubMed]
- Dervishi, A.; Jakše, J.; Ismaili, H.; Javornik, B.; Štajner, N. Genetic structure and core collection of Olive germplasm from Albania revealed by microsatellite markers. Genes 2021, 12, 256. [Google Scholar] [CrossRef]
- Guo, Q.; Liu, J.; Li, J.; Cao, S.; Zhang, Z.; Zhang, J.; Zhang, Y.; Deng, Y.; Niu, D.; Su, L. Genetic diversity and core collection extraction of Robinia pseudoacacia L. germplasm resources based on phenotype, physiology, and genotyping markers. Ind. Crops Prod. 2022, 178, 114627. [Google Scholar] [CrossRef]
- Du, F.K.; Xu, F.; Qu, H.; Feng, S.; Tang, J.; Wu, R. Exploiting the transcriptome of Euphrates Poplar, Populus euphratica (Salicaceae) to develop and characterize new EST-SSR markers and construct an EST-SSR database. PLoS ONE 2013, 8, e61337. [Google Scholar] [CrossRef] [PubMed]
- Saha, M.C.; Mian, M.A.; Eujayl, I.; Zwonitzer, J.C.; Wang, L.; May, G.D. Tall fescue EST-SSR markers with transferability across several grass species. Theor. Appl. Genet. 2004, 109, 783–791. [Google Scholar] [CrossRef]
- Fan, X.; Wang, G.; Yang, X.; Zhou, T.; Ren, Z. Distribution and sequence characterization of SSR in Ginkgo biloba transcriptions. Non-Wood For. Res. 2021, 39, 63–73. (In Chinese) [Google Scholar]
- Dragos, P. Using bioinformatics tools for identification and characterization of transcriptome derived EST-SSRs in Silver Fir (Abies alba Mill.). Bull. Univ. Agric. Sci. Vet. Med. Cluj-Napoca. Hortic. 2017, 74, 1843–5394. [Google Scholar]
- Biswas, M.K.; Chai, L.; Mayer, C.; Xu, Q.; Guo, W.; Deng, X. Exploiting BAC-end sequences for the mining, characterization and utility of new short sequences repeat (SSR) markers in Citrus. Mol. Biol. Rep. 2012, 39, 5373–5386. [Google Scholar] [CrossRef] [PubMed]
- Schorderet, D.F.; Gartler, S.M. Analysis of CpG suppression in methylated and nonmethylated species. C. R. Biol. 1992, 89, 957–961. [Google Scholar] [CrossRef]
- Shen, X.; Zhu, Y.; Xu, G. Distribution characteristics of SSR loci and development of molecular markers in Taxus fuana. J. Cent. South Univ. For. Technology 2021, 41, 139–147, (In Chinese with English Abstract). [Google Scholar]
- Fan, Q.; Chen, S.; Li, M.; He, S.; Zhou, R.; Liao, W. Development and characterization of microsatellite markers from the transcriptome of Firmiana danxiaensis (Malvaceae s.l.). Appl. Plant. Sci. 2013, 1, 1300047. [Google Scholar] [CrossRef] [PubMed]
- Temnykh, S.; DeClerck, G.; Lukashova, A.; Lipovich, L.; Cartinhour, S.; McCouch, S. Computational and experimental analysis of microsatellites in rice (Oryza sativa L.): Frequency, length variation, transposon associations, and genetic marker potential. Genome Res. 2001, 11, 1441–1452. [Google Scholar] [CrossRef] [PubMed]
- Botstein, D.; White, R.L.; Skolnick, M.; Davis, R.W. Construction of a genetic linkage map in man using restriction fragment length polymorphisms. Am. J. Hum. Genet. 1980, 32, 314. [Google Scholar]
- Dervishi, A.; Jakše, J.; Ismaili, H.; Javornik, B.; Štajner, N. Comparative assessment of genetic diversity in Albanian olive (Olea europaea L.) using SSRs from anonymous and transcribed genomic regions. Tree Genet. Genomes 2018, 14, 53. [Google Scholar] [CrossRef]
- Yuan, N.; Li, M.; Jia, C. De novo transcriptome assembly and population genetic analyses of an important coastal shrub, Apocynum venetum L. BMC Plant Biol. 2020, 20, 408. [Google Scholar] [CrossRef] [PubMed]
- Du, J.; Zhang, Z.; Zhang, H.; Junhong, T. EST–SSR marker development and transcriptome sequencing analysis of different tissues of Korean pine (Pinus koraiensis Sieb. et Zucc.). Biotechnol. Biotechnol. Equip. 2017, 31, 679–689. [Google Scholar] [CrossRef]
- Ahossou, O.D.; Daïnou, K.; Janssens, S.B.; Triest, L.; Hardy, O.J. Species delimitation and phylogeography of African tree populations of the genus Parkia (Fabaceae). Tree Genet. Genomes 2020, 16, 68. [Google Scholar] [CrossRef]
- Karunarathna, K.H.T.; Mewan, K.M.; Weerasena, O.; Perera, S.; Edirisinghe, E.N.U. A functional molecular marker for detecting blister blight disease resistance in tea (Camellia sinensis L.). Plant Cell Rep. 2021, 40, 351–359. [Google Scholar] [CrossRef] [PubMed]
- Zheng, T.; He, X.; Ye, H.; Fu, W.; Peng, M.; Gou, G. Phylogeography of the rare and endangered lycophyte Isoetes yunguiensis. PeerJ 2020, 8, e8270. [Google Scholar] [CrossRef]
- Tong, Y.; Gao, L.Z. Development and characterization of EST-SSR markers for Camellia reticulata. Appl. Plant Sci. 2020, 8, e11348. [Google Scholar] [CrossRef]
- Yong-Qi, G.; Ying-Xiong, Q.; Bing-Yang, D.; Cheng-Xin, F. An ISSR analysis on population genetic diversity of the relict plant Ginkgo biloba. Biodivers. Sci. 2003, 11, 276. [Google Scholar]
- Qi-Kui, W.; Shi-Yan, X.; Xuan, W.; Li-Min, S. Genetic relationship of stone-used Ginkgo biloba cultivars based on AFLP markers. Acta Hortic. Sin. 2015, 42, 961. [Google Scholar]
- Tang, H.; Xing, S.; Li, J.; Wang, X.; Sun, L.; Du, S.; Liu, X. Genetic diversity of Ginkgo biloba half-sib families based on AFLP technology. Biochem. Syst. Ecol. 2016, 68, 58–65. [Google Scholar] [CrossRef]
- Zhou, Q.; Mu, K.; Ni, Z.; Liu, X.; Li, Y.; Xu, L. Analysis of genetic diversity of ancient Ginkgo populations using SSR markers. Ind. Crops Prod. 2020, 145, 111942. [Google Scholar] [CrossRef]
- Nybom, H. Comparison of different nuclear DNA markers for estimating intraspecific genetic diversity in plants. Mol. Ecol. 2004, 13, 1143–1155. [Google Scholar] [CrossRef] [PubMed]
- Smith, A.L.; Hodkinson, T.R.; Villellas, J.; Catford, J.A.; Csergő, A.M.; Blomberg, S.P.; Crone, E.E.; Ehrlén, J.; Garcia, M.B.; Laine, A.L.; et al. Global gene flow releases invasive plants from environmental constraints on genetic diversity. Proc. Natl. Acad. Sci. USA 2020, 117, 4218–4227. [Google Scholar] [CrossRef] [PubMed]
- Gong, W.; Zeng, Z.; Chen, Y.Y.; Chen, C.; Qiu, Y.X.; Fu, C.X. Glacial refugia of Ginkgo biloba and human impact on its genetic diversity: Evidence from chloroplast DNA. J Integr. Plant. Biol. 2008, 50, 368–374. [Google Scholar] [CrossRef] [PubMed]
- Yu, W.; Wu, B.; Wang, X.; Yao, Z.; Li, Y.; Liu, Y. Scale-dependent effects of habitat fragmentation on the genetic diversity of Actinidia chinensis populations in China. Hortic. Res. 2020, 7, 172. [Google Scholar] [CrossRef] [PubMed]
- Upadhyaya, H.D.; Ortiz, R.; Bramel, P.J.; Singh, S. Development of a groundnut core collection using taxonomical, geographical and morphological descriptors. Genet. Resour. Crop Evol. 2003, 50, 139–148. [Google Scholar] [CrossRef]
- Van Raamsdonk, L.; Wijnker, J. The development of a new approach for establishing a core collection using multivariate analyses with tulip as case. Genet. Resour. Crop Evol. 2000, 47, 403–416. [Google Scholar] [CrossRef]
- Yilmaz, A.; Ciftci, V. Genetic relationships and diversity analysis in Turkish laurel (Laurus nobilis L.) germplasm using ISSR and SCoT markers. Mol. Biol. Rep. 2021, 48, 4537–4547. [Google Scholar] [CrossRef]
Disclaimer/Publisher’s Note: The statements, opinions and data contained in all publications are solely those of the individual author(s) and contributor(s) and not of MDPI and/or the editor(s). MDPI and/or the editor(s) disclaim responsibility for any injury to people or property resulting from any ideas, methods, instructions or products referred to in the content. |
© 2023 by the authors. Licensee MDPI, Basel, Switzerland. This article is an open access article distributed under the terms and conditions of the Creative Commons Attribution (CC BY) license (https://creativecommons.org/licenses/by/4.0/).