Article

Drought Variations in the Yili Basin, Northwest China since AD 1673 Based on Tree-Ring Width

1
State Key Laboratory of Loess and Quaternary Geology, Institute of Earth Environment, Chinese Academy of Sciences, Xi’an 710061, China
2
University of Chinese Academy of Sciences, Beijing 100049, China
3
Center for Excellence in Quaternary Science and Global Change, Chinese Academy of Sciences, Xi’an 710061, China
4
School of Human Settlements and Civil Engineering, Xi’an Jiaotong University, Xi’an 710049, China
5
Xi’an Institute for Innovative Earth Environment Research, Xi’an 710061, China
6
Institute of Desert Meteorology, China Meteorological Administration, Urumqi 830002, China
7
School of Geography Sciences and Touristy, Xinjiang Normal University, Urumqi 830054, China
*
Author to whom correspondence should be addressed.
Forests 2023, 14(11), 2127; https://doi.org/10.3390/f14112127
Submission received: 8 September 2023 / Revised: 3 October 2023 / Accepted: 24 October 2023 / Published: 25 October 2023

Abstract

:
The Yili Basin represents a typical region influenced by the Westerlies, and as a result of the substantial precipitation delivered by these winds, it has emerged as a significant hub for agricultural and animal husbandry activities in Central Asia. This study established a 419-year tree-ring width chronology, utilizing living Picea schrenkiana samples from two sampling sites in the Yili Basin. Correlation analysis showed that the standard tree-ring width chronology had the best correlation with the Palmer Drought Severity Index from the previous August to the current May (PDSIP8C5) (r = 0.614, n = 59, p < 0.001). Therefore, we reconstructed PDSIP8C5 variations from 1673 to 2018. The reconstruction results reveal eight wet and seven dry periods during the past 346 years. In the reconstructed series, droughts are particularly pronounced around 1770 and 1920, and the PDSI shows a significant long-term wetting trend since the 1980s. The solar activity, North Atlantic Oscillation (NAO), and Atlantic Multidecadal Oscillation (AMO) jointly influenced the regional moisture variation.

1. Introduction

Drought has been a significant natural disaster throughout history, substantially impacting the economy, society, and ecosystem [1,2]. Global warming has increased the intensity and frequency of drought events [3]. Over the period 1951–2021, the annual mean surface temperature in China has shown a significant upward trend [4]. It is crucial for the sustainable development of arid and semi-arid areas to study and analyze the trend of drought development in climate change and to provide adequate drought early warning. The Tianshan Mountains are located in the arid region of Central Asia, where the climate is changeable. The Tianshan area is an essential area for grain production in Xinjiang and a critical barrier to the climate and ecological environment in the arid regions of northwest China [5,6]. Climate variations in the Tianshan Mountains are essential to Xinjiang’s ecological environment and food security. Understanding the changes in regional dryness and moisture levels and identifying key drought events in the Tianshan Mountains can provide vital assurances for local social and economic activities. This is important for the area’s social and economic growth and preventing and reducing disasters. Traditionally, Central Asia is regarded as a region dominated by Westerlies [7]. Some studies have also found that the precipitation in Central Asia is affected by the North Atlantic Oscillation (NAO) [8] and Atlantic multidecadal variability [9]. Due to the short duration of measurement recording, comprehension of the frequency and severity of drought occurrences in this region is significantly restricted. Tree-rings have become one of the preferred proxy data for the investigation of past climatic fluctuations owing to their extensive spatial distribution, prolonged temporal coverage, and high resolution [10,11,12].
Many climate-sensitive conifer species, such as Picea schrenkiana Fisch. et Mey and Larix sibirica Ledb., are distributed in the Tianshan Mountain area [13]. P. schrenkiana is a tree with shallow roots, yet a well-developed system, able to resist cold, preferring humid and shaded habitats, and sensitivity to climatic factors, which is very suitable for tree-ring research [13]. Several dendro-climatology and -hydrology studies have been conducted in the Tianshan Mountains, establishing dendrochronology series and mainly reconstructing climatic variables such as precipitation, temperature, and river runoff [14,15,16,17,18,19,20,21,22,23]. However, inadequate delineation of drought events in the western Tianshan Mountains is insufficient to understand historical climate change. Owing to the limited durations of previous meteorological records, the calibration period of tree-ring reconstruction is short and not conducive to obtaining stable and reliable climate reconstruction results. Therefore, collecting new samples and establishing new dendrochronology is necessary to conduct tree-ring climate analysis to gain a new understanding of drought events in this region. In addition, due to the favorable hydrothermal conditions in some areas of the western Tianshan Mountains, the response of tree radial growth to climate is complicated, and it is challenging to extract absolute climate-limiting factors [13]. A comprehensive index that considers water changes should be used to understand regional moisture changes better. Drought severity is determined by the relationship between water supply and demand, which can reflect the dry and wet changes in agriculture. The Palmer Drought Severity Index (PDSI) has the potential to detect and predict crop yield [24], and can determine the beginning and end of the drought.
Taking Zhaosu County in the southwest of the Yili Basin as the study area, P. schrenkiana was selected as the tree species for tree-ring research. The objectives of this study are (1) to explore the relationship between tree-ring and climate and to reconstruct drought change over 346 years, (2) to investigate potential drivers of drought change in the study area, such as the link between drought and water vapor in the North Atlantic and Westerlies. This study has enhanced the dendroclimatic data of Central Asia’s Tianshan Mountains and provided a basis for additional large-scale climate reconstruction. Furthermore, it aids in interpreting how climate change has historically impacted arid Central Asia.

2. Materials and Methods

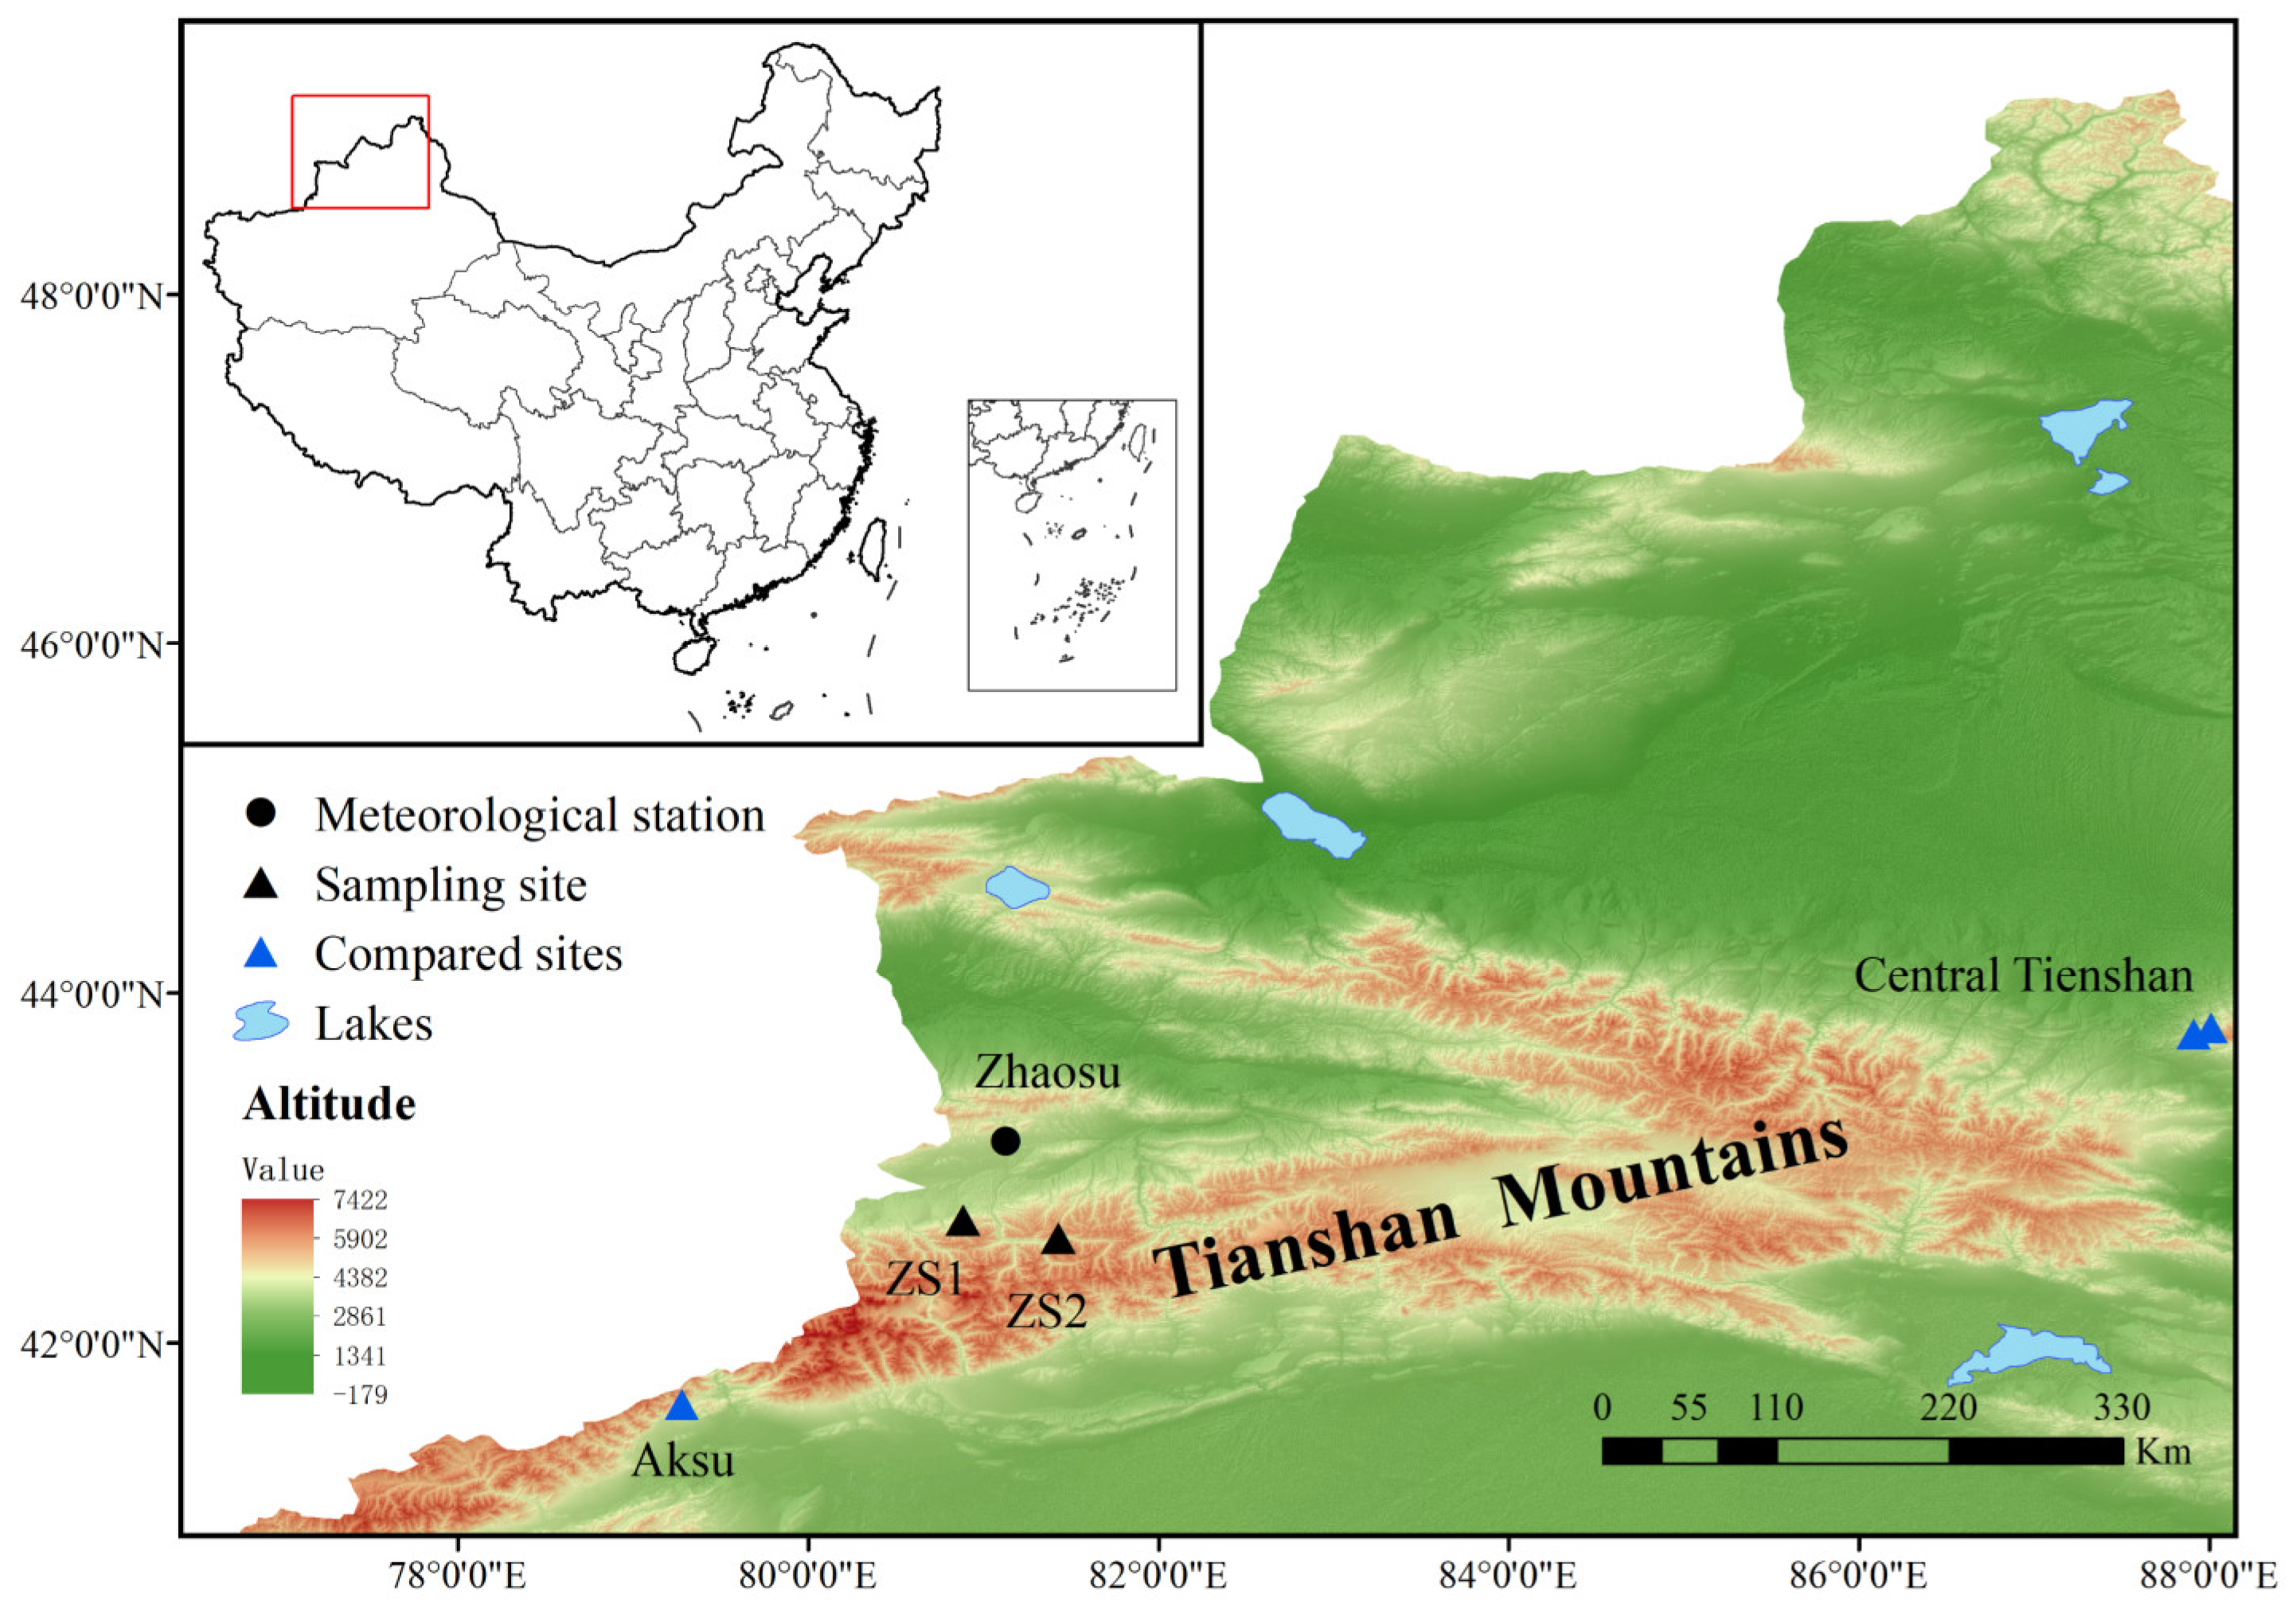
2.1. Study Area and Climate Data

Yili Basin is located at the northern foot of the West Tianshan in Xinjiang, surrounded by mountains on three sides and open to the west, between Keguqin Mountain, Bolohoro Mountain, Wusun Mountain, and Narati Mountain in the Middle Tianshan [25], forming a terrain of “three mountains sandwiching a valley and a basin” [26]. Due to its deep location in Eurasia and the influence of the surrounding plateaus and mountains, water vapor from the Pacific and Indian Oceans is challenging to reach. However, this valley opens to the west, and warm, humid air can arrive from the Atlantic carried by the westerly wind [27,28]. In the Yili area, forest resources are abundant because of the unique terrain and climatic conditions, and P. schrenkiana is mainly distributed at an altitude of 1200~3500 m [29]. Yili Kazak Autonomous Prefecture is part of the semi-arid and semi-humid cold climate type of continental temperate mountainous region. The sampling sites are located southwest (Figure 1), with an annual average temperature of 2.9 °C, an annual rainfall of 511.8 mm, and an average annual water evaporation of 1261.6 mm.
Based on the climatic data collected from Zhaosu Meteorological Station (43°09′ N, 81°08′ E), which is close to the sampling point from 1959 to 2018 (the data are obtained from “China Meteorological Science Data Sharing Service Network” http://cdc.cma.gov.cn/, accessed on 18 July 2023), the results show that January and August are the coldest and warmest months, respectively, in the study area, and precipitation predominantly occurs between April and September. Due to the significant variation in elevation between the sampling locations and the adjacent meteorological stations, the data-sharing website of the Royal Netherlands Meteorological Institute (http://climexp.knmi.nl, accessed on 2 August 2023) was used in this study. From the Climatic Research Unit, University of East Anglia, the CRU TS 4.06 dataset with a resolution of 0.5° × 0.5° was used to extract rainfall and monthly mean temperature data covering the sampling sites (42–45° N, 80–82° E) during 1960–2018. The scPDSI data were obtained from the CRU TS 4.05 dataset with a resolution of 0.5° × 0.5°. For the convenience of narration, the scPDSI is henceforth described as PDSI.

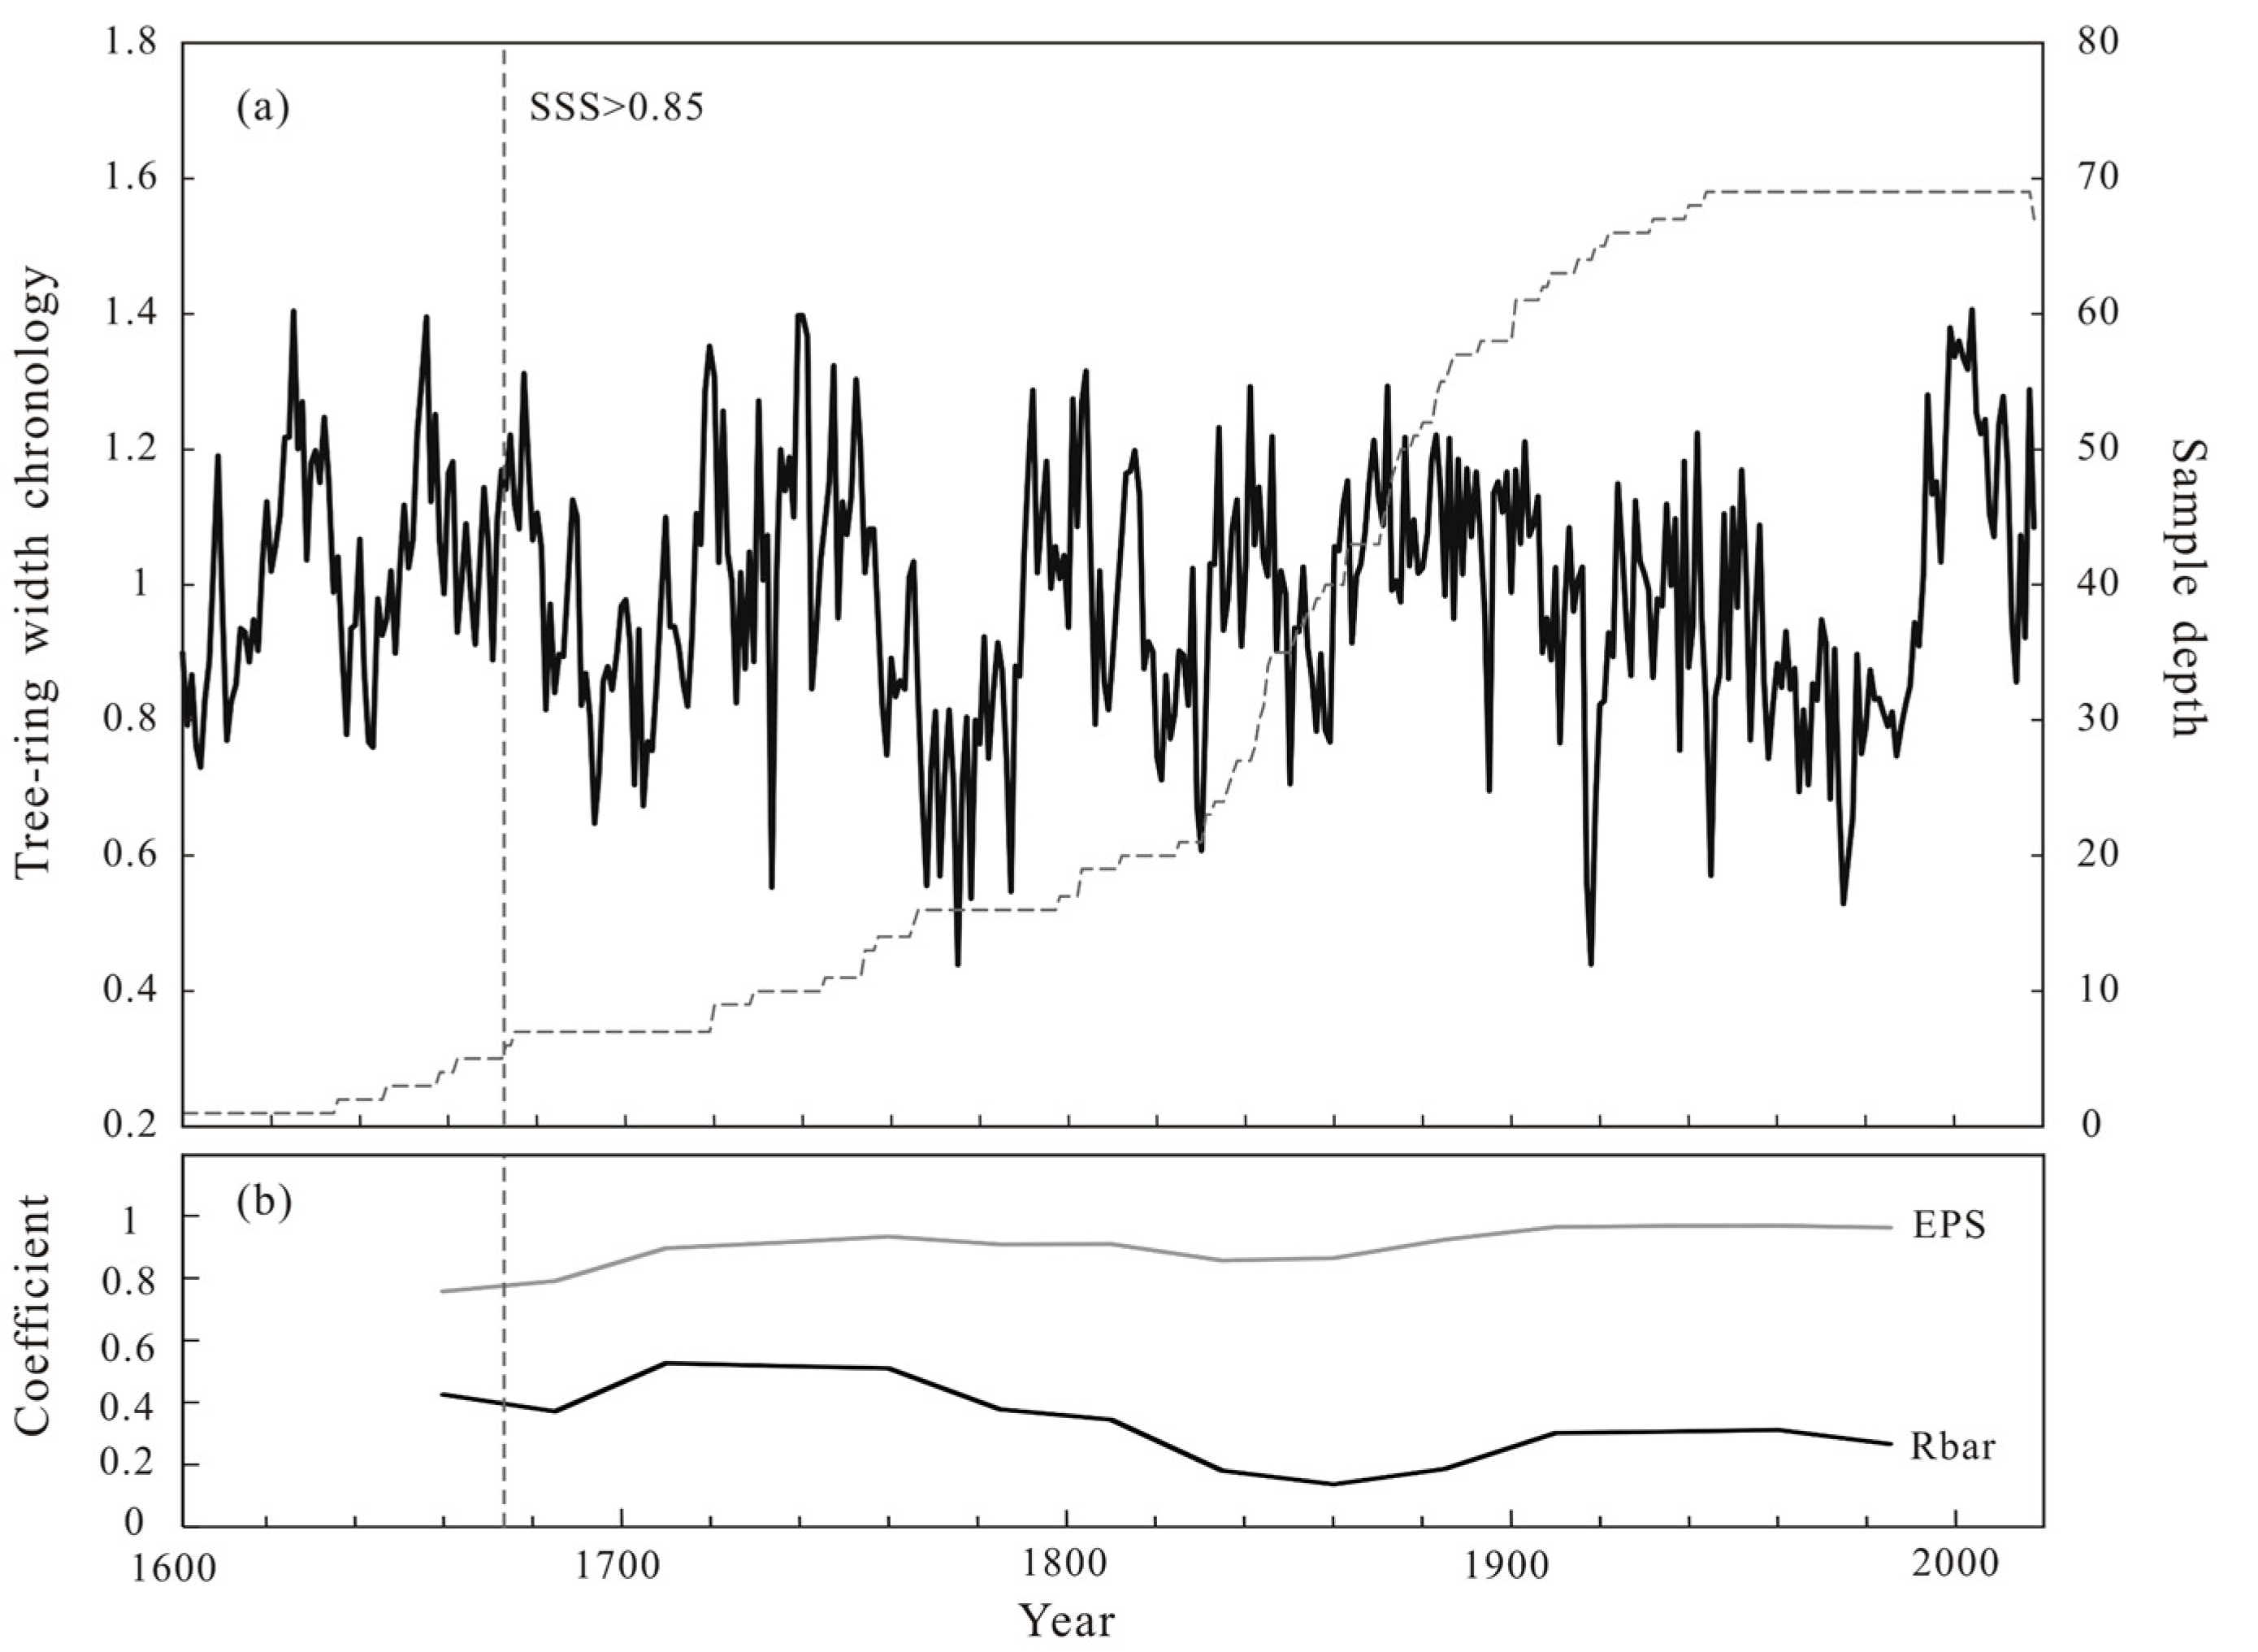
2.2. Tree-Ring Data and Chronology Development

In June 2019, the research team collected samples on the north slope in Aksu Ditch (ZS1, 42°35′ N, 81°25′ E, 2548 m) and Aheyazi Ditch (ZS2, 42°41′ N, 80°53′ E, 2443 m) in Zhaosu; the sampling sites were near the lower treeline. The soils in the sampling area are grayish-brown and relatively thick. P. schrenkiana, with healthy growth and no human damage, was selected in the moderate open stand and low crown density. Following the International Tree-Ring Data Bank standard, two cores were taken from each tree at the breast height (1–1.5 m) in different directions using growth cones. After discarding some missing and decayed cores, 70 cores with complete form and clear rings were collected from 37 trees. The samples were dried, fixed, polished, and dated in the laboratory. Each ring was measured by LINTAB with an accuracy of 0.01 mm, and the quality of cross-dating was controlled by the COFECHA program [30] to ensure the accurate growth age of each ring. The results showed that the mean correlation of the original sequence was 0.611, with a mean sensitivity of 0.171. We use the negative exponential function in the ARSTAN program [31] to detrend, and three types of tree-ring width chronologies are obtained: the standard (STD) chronology, the residual (RES) chronology, and the ARSTAN (ARS) chronology. The STD chronology includes high- and low-frequency information, whereas the RES chronology shows more high-frequency changes. In subsequent analyses, the STD chronology is used because it retained more low-frequency information [32]. The corresponding statistical characteristics are shown in Table 1. The reliable start year of the chronology is determined based on the number of samples with subsample signal strength (SSS) greater than 0.85. In addition, the mean inter-series correlation (Rbar) and the expressed population signal (EPS) were calculated to assess the representativeness of the STD chronology. When the EPS value is more significant than 0.80, it is acceptable to capture regional climate signals [33]. The EPS ranged from 0.79 to 0.97, suggesting our chronology is reliable. The reliable interval of the final chronology (SSS > 0.85) was obtained from 1673 (corresponding to 6 tree cores) to 2018 (Figure 2); EPS is also greater than 0.80 in this period.

2.3. Analysis Methods

Climate variables and tree-ring radial growth were correlated using Pearson correlation. Since tree growth lags behind the climate, it is also affected by the previous year’s climate [34]. We have used the climate data for a total interval of 15 months from the previous July to the current September. A linear regression model has been used to reconstruct the main climate limiting factors. The model’s reliability was evaluated using Jackknife and bootstrap methods [35]. Statistical parameters utilized to test the model consist of the correlation coefficient (r), coefficient of determination (R2), coefficient of determination after accounting for degrees of freedom (R2adj), estimated standard error (SE), F-value, p-value, and D/W value.
Furthermore, the reconstructed series was compared with other climatic records around the study area. The spatial correlations between the actual PDSI and reconstructed PDSI and the global gridded PDSI data and the gridded Hadley Centre Sea-surface Temperature Data Set Version 1 (HadISST1) were analyzed by using the KNMI Climate Explorer (http://climexp.knmi.nl, accessed on 24 August 2023) from 1960 to 2018. The Multi-taper method (MTM) [36] has been used to identify the major periods present in our reconstructed sequences. In addition, we computed the correlation between the reconstructed sequence and the sunspots, the North Atlantic Oscillation (NAO), and the Atlantic Multidecadal Oscillation (AMO). Studies have indicated that low-frequency change information is more dependable in reconstruction efforts [37]. To highlight decadal-scale changes and long-term fluctuations, an 11-year moving average was used for the sequential comparison analysis [38].

3. Results and Discussions

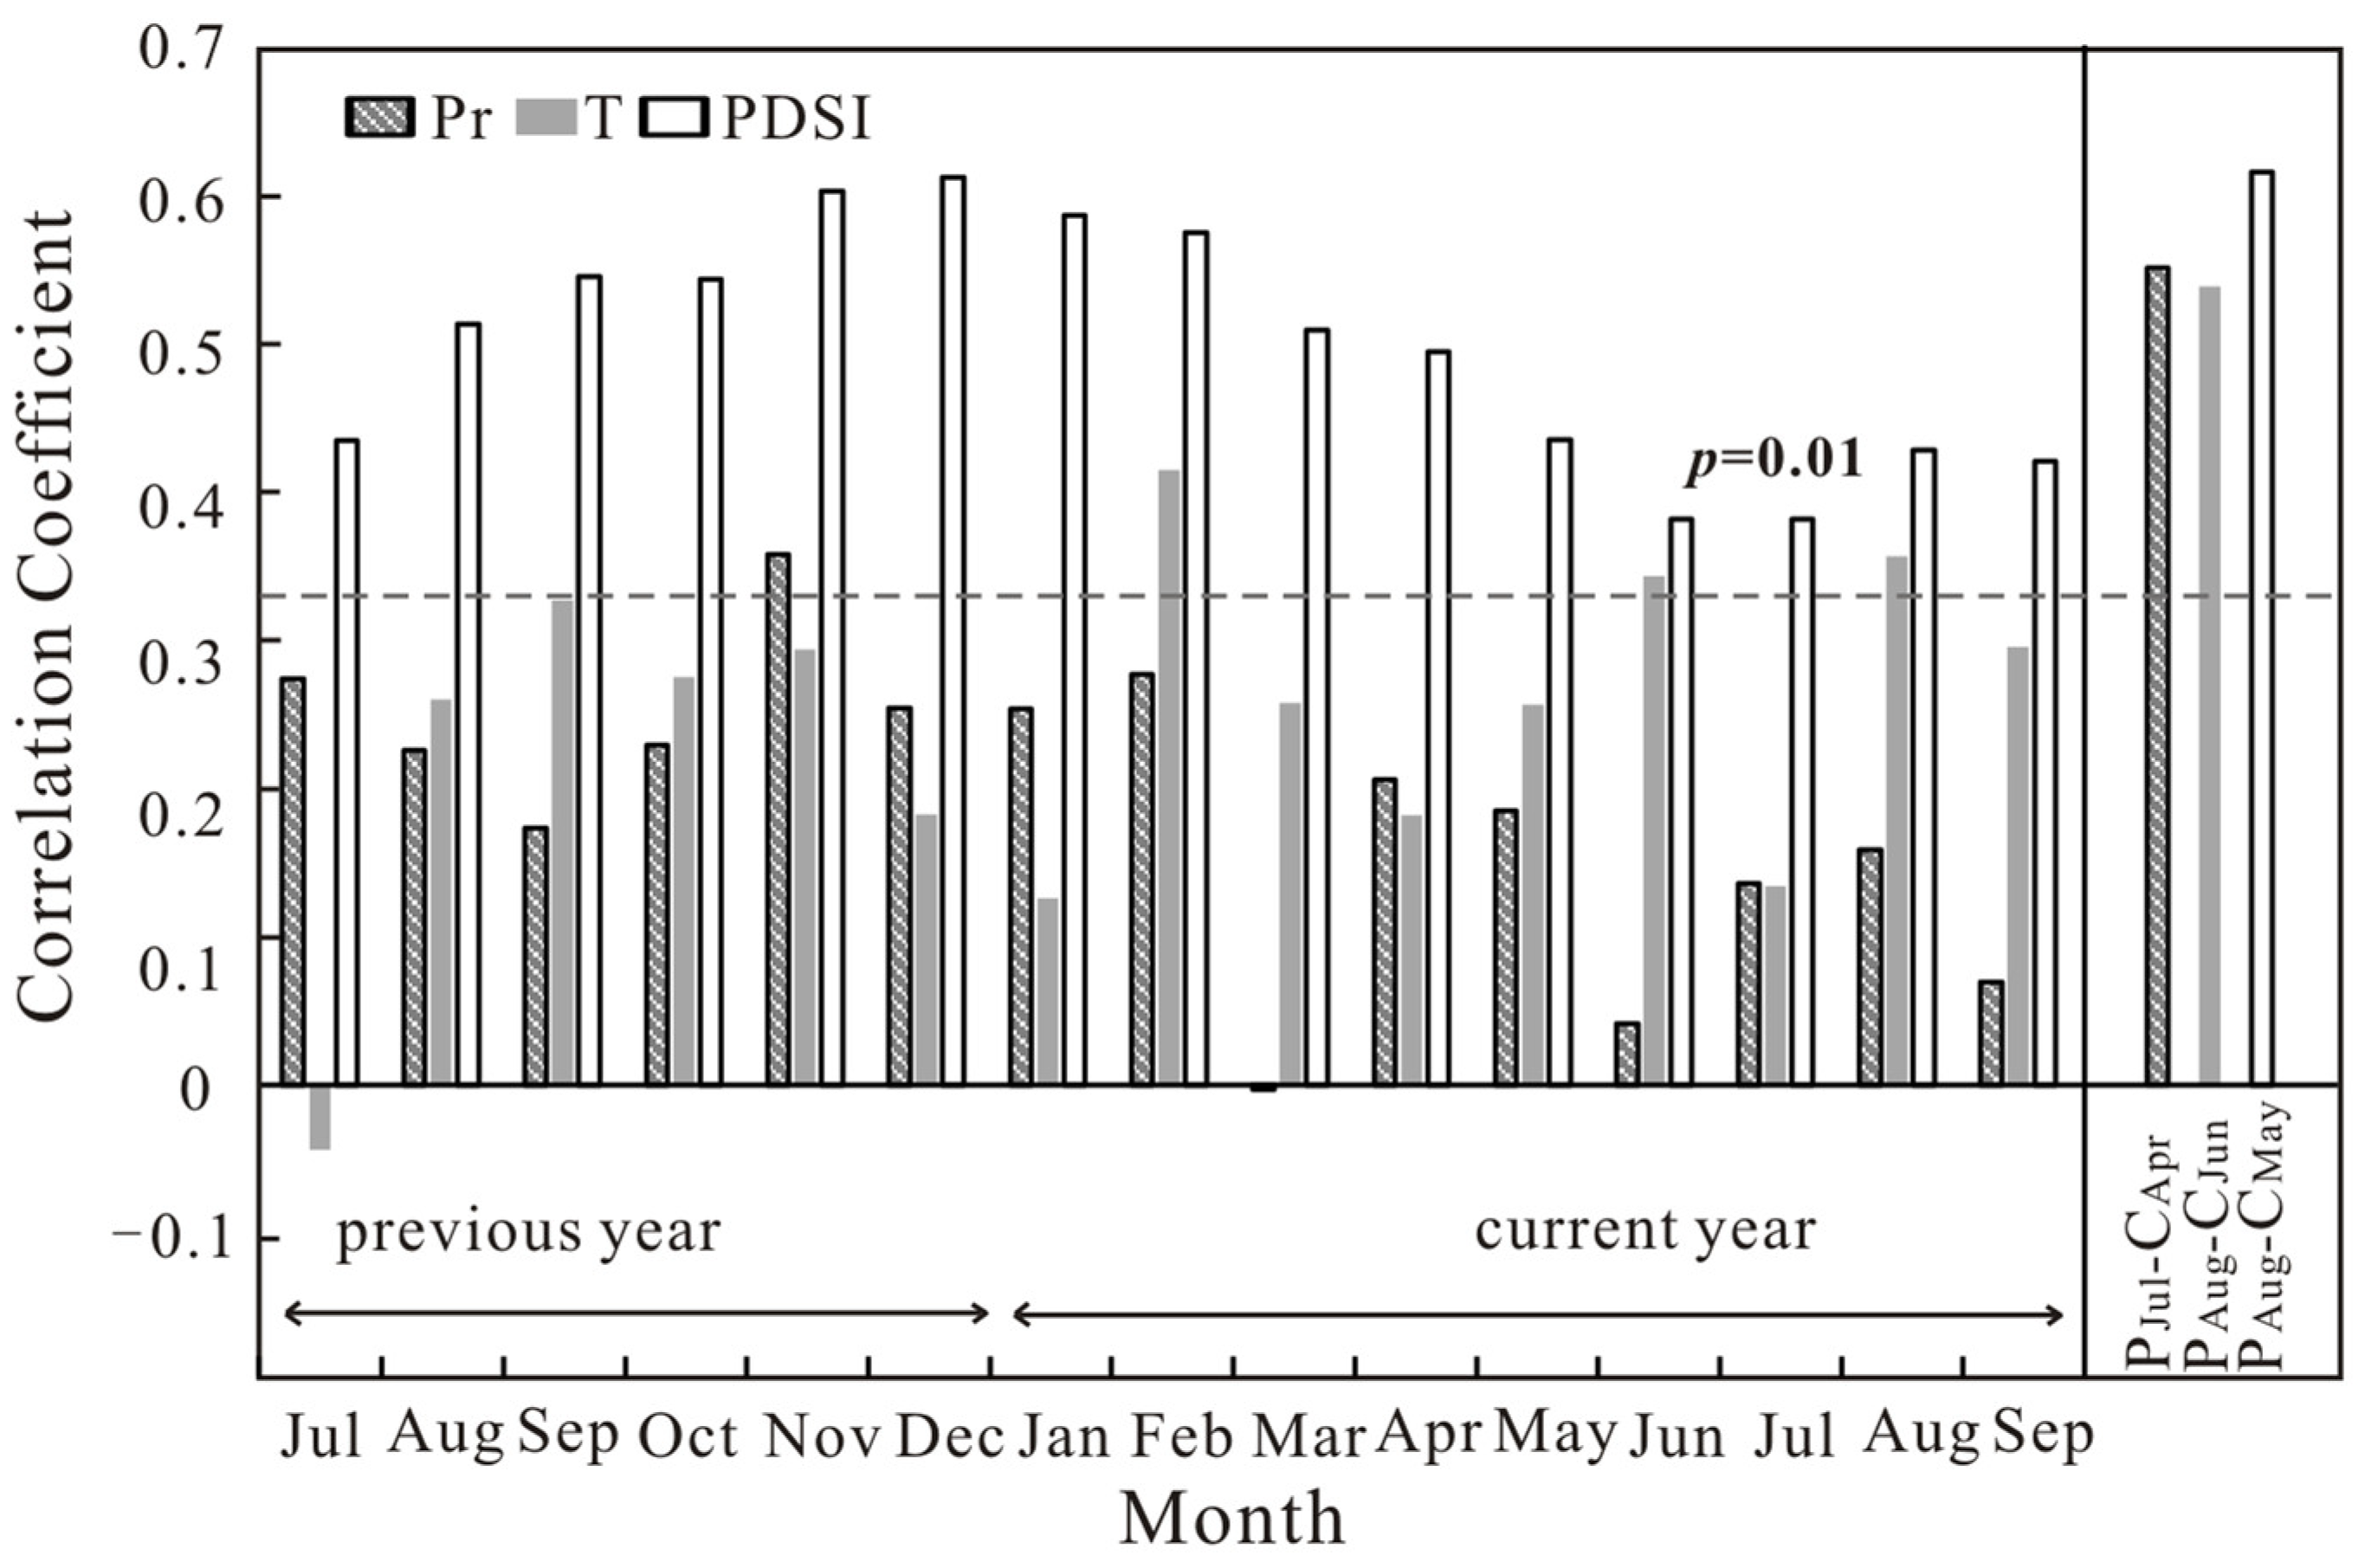
3.1. Climate–Growth Response

Some studies on how climate change affects trees in the Tianshan Mountains indicate that tree growth is not solely influenced by the climate of the ongoing growth season; it is also notably impacted by the weather conditions of the preceding year [39]. The climatic conditions before the growth season will affect the radial growth of tree-ring during the growing season. The water vapor in the Yili area mainly comes from mountain precipitation and melting glaciers and snow. More rainfall during the growing season directly provides water for tree growth, enhancing photosynthesis efficiency and tree cell growth and division [40]. At the same time, the precipitation in the growing season replenishes the loss of soil water vapor evaporation, increases soil water content, and indirectly promotes the growth of trees. Snow in winter could boost snow storage and moisture in soil [41], which may promote tree growth in the next growing season.
As shown in Figure 3, at a significance level of 0.05, we only found a positive correlation between the chronology and precipitation in November of the previous year. With mean temperature, the STD chronology exhibited a positive correlation with September from the preceding year, as well as February, June, and August of the current year. The low correlations between tree growth and mean temperature reveal that temperature does not have a notable impact on tree growth. After trying various month combinations, we discovered that the most robust correlation between the STD chronology and precipitation was in the period from July to April, whereas the strongest correlation between the chronology and the mean temperature appeared from August to July. The PDSI exhibited significant correlations with the STD chronology from July of the previous year until September of the present year (1960–2018). In addition, it is noteworthy that the correlation coefficient linking the STD chronology with PDSI shows a stronger correlation than precipitation and temperature. To study the correlation between climate and tree-rings in greater depth, we integrated the climate data from various months with the STD chronology for examination. The findings demonstrate that the STD chronology exhibits robust associations with the PDSI from the previous August to the current May (r = 0.614, p < 0.001). Moisture condition was found to be the main climatic factor in this analysis, and the PDSI from August to May is the most suitable predictor for drought reconstruction.

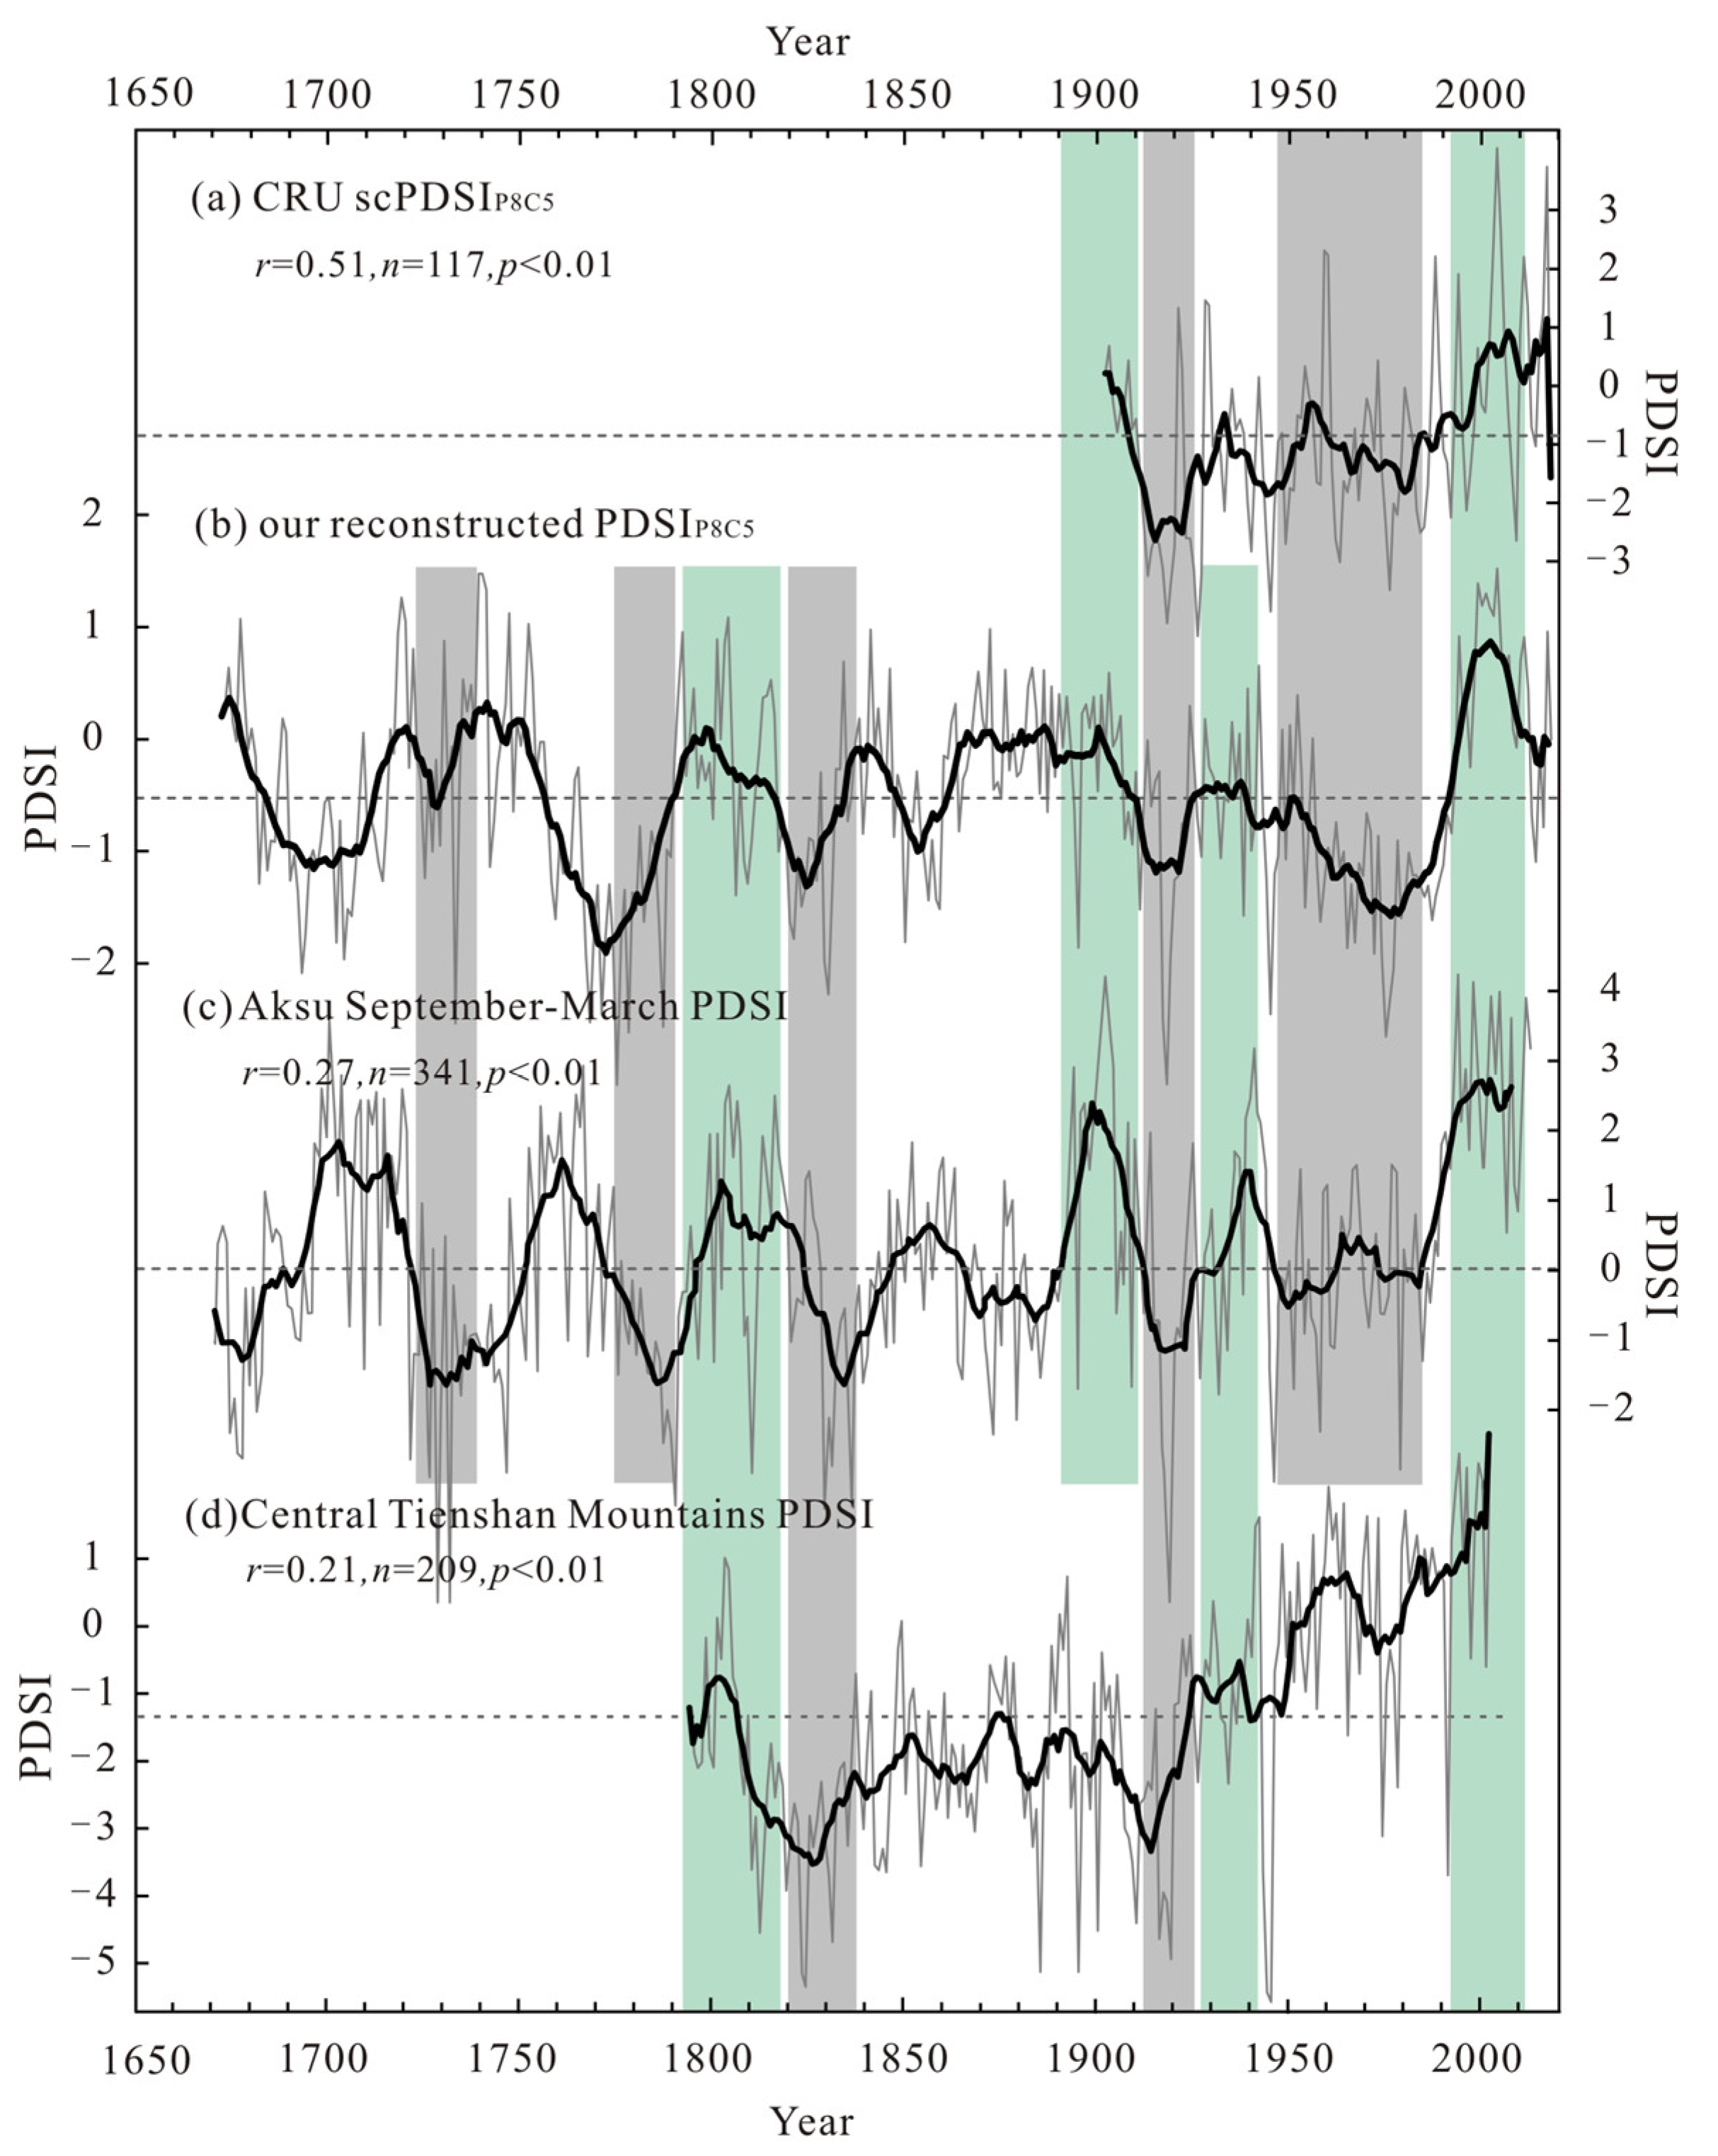
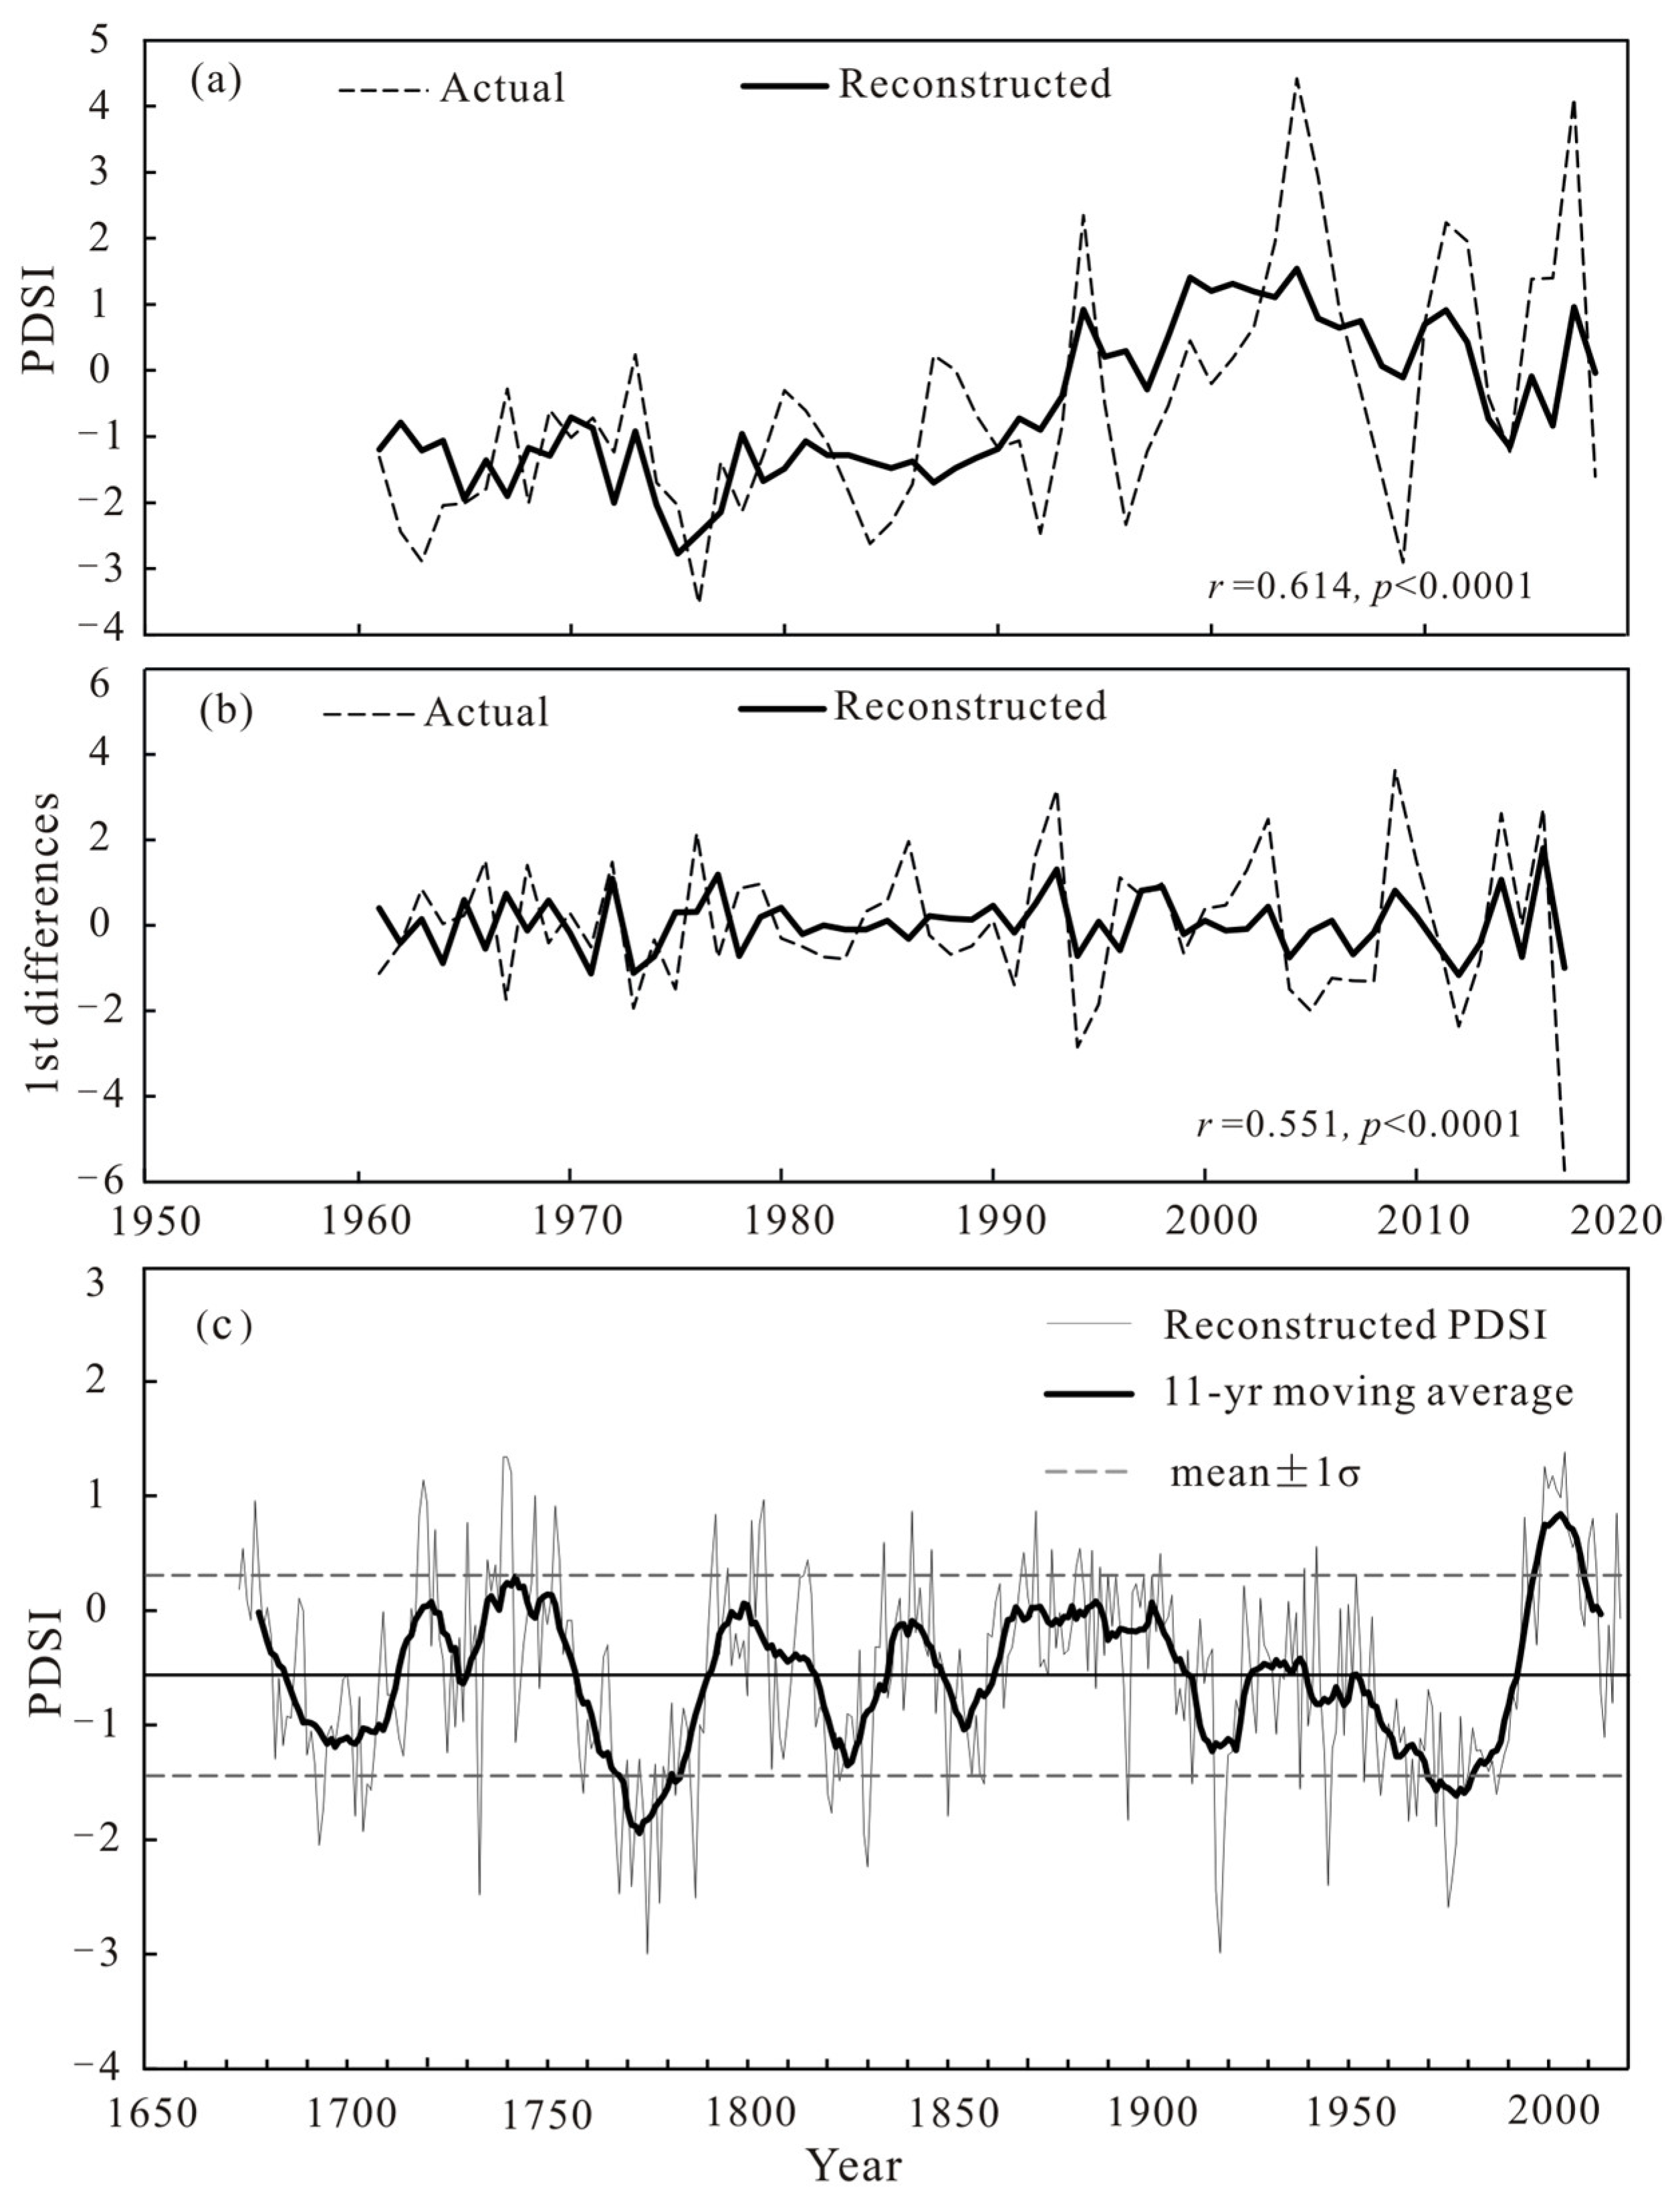
3.2. PDSI Reconstruction

The mean PDSIP8C5 from 1673 to 2018 was reconstructed by using a linear regression model that took into account the connection between the standard chronology and climate variables. The linear regression function is designed as follows:
PDSIP8C5 = −4.9875 + 4.5305 × STD
n = 59, r = 0.614, R2 = 0.38, R2adj = 0.37, F = 33.84, p < 0.0001, D/W = 0.98.
In the formula, PDSIP8C5 is the average PDSI value from the previous August to the current May, and STD is the standard chronology of tree-ring width. R2 is the explained variance, and R2adj is the explained variance after adjusting the degrees of freedom. The D/W value [42] is used to test the residuals of the reconstructed sequence, and the residuals have a positive correlation when D/W < 2. Table 2 shows the test of the equation by Bootstrap and Jackknife methods. All parameters measured by the test system are very similar to the calibrated parameters, indicating that the reconstructed equation is reliable and suitable for the PDSI reconstruction. Figure 4 compares the PDSI with the reconstructed PDSI (1960–2018) in this study area, and the reconstructed series are consistent with the PDSI. However, the amplitude changes are different. After first-order difference detrending, the correlation coefficient is 0.551, and the changes have a similar trend (Figure 4b). This statistical analysis validates our reconstruction model, which may represent a long-term variation of dry and wet in the Yili Basin since 1673.
Spatial analysis showed that the reconstructed PDSIP8C5 sequence had a positive correlation with both PDSI and precipitation in the surrounding areas of the Yili Basin (Figure 5). These results show that the reconstructed PDSIP8C5 can represent the dry and wet fluctuations in the Yili region.

3.3. Drought Variability in the Past 346 Years

According to the liner regression equation, the PDSIP8C5 of the southwestern Yili Basin (1673–2018) is reconstructed (Figure 4c). The reconstructed sequence reveals the drought variation over a long time, providing a valuable series for studying local drought history. A positive PDSI indicates wetness, while negative values indicate drought. The more negative, the more severe the drought will be. Due to regional differences, the PDSI values representing drought or wetness should be defined by the average climate conditions in this study area. The maximum value of the reconstructed PDSIP8C5 sequence is 1.38, the minimum value is −2.99, the mean value is −0.56, and the standard deviation is 0.84. Referring to the previous study [43], we regarded the range of PDSI value between the mean ± 1σ as the normal wet/dry condition in the Yili Region. PDSIP8C5 ≥ mean + 2σ (PDSIP8C5 ≥ 1.12) or PDSIP8C5 ≤ mean−2σ (PDSIP8C5 ≤ −2.24) were taken as the critical values for judging extraordinarily wet or dry years. According to the 11-year moving average result of reconstructed PDSIP8C5 and the definition criteria of dry and wet, there have been eight wet and seven dry periods in the Yili region in the past 346 years (Table 3). Among all the periods, 1953–1992 was the most extended dry period, lasting 40 years and accounting for 11.6% of the total reconstruction period. From 1862 to 1910 was the longest wet period, lasting 49 years and accounting for 14.1% of the entire reconstruction period. According to the reconstruction series, the years of extreme wetness were 1739–1741, 1999, and 2004, which accounted for only 1% of the complete series. The years of severe drought were 1733, 1768, 1771, 1775, 1778, 1787, 1917, 1918, 1945, and 1975, representing 3% of the total series.
In the reconstruction sequence, the extreme drought in 1768 corresponds to the drought in Yili in the thirty-first year of Qianlong (1766), recorded in Chinese history during the Qing Dynasty [44]. The drought period from 1911 to 1925 corresponded to the significant drought period in northern China’s other arid or semi-arid areas in the 1920s [45]. In 1941, a provincial-level drought occurred in Xinjiang, and wheat, highland barley, and other crops were significantly reduced. During 1942–1943, drought occurred in some parts of northern Xinjiang; nearly half of all late autumn crops in Zhaosu County were affected, and grain crops were destroyed by drought [44]. The reconstructed sequence’s drought period from 1940 to 1951 matched the Xinjiang drought noted in the historical records.
The reconstructed climate sequence around the study area helps us understand more detailed climate changes and provides conditions for verifying our reconstructed sequence. We compared the reconstructed PDSI sequence with other climate reconstructions based on tree-rings in the surrounding area (Figure 6). The reconstructed PDSIP8C5 showed a strong positive correlation with the CRU scPDSI (r = 0.51, p < 0.01, n = 118) and the regional September–March PDSI reconstruction in the Aksu area [41] (r = 0.27, p < 0.01, n = 341). Furthermore, the reconstructed PDSIP8C5 exhibited a noteworthy association with the reconstructed PDSI in the central Tianshan Mountains from April to June [46] (r = 0.21, p < 0.01, n = 209) (Figure 6d). These comparisons affirmed the dependability and spatial representativeness of our reconstructed PDSI. Three drought periods (1770s–1790s, 1820s–1830s, 1910s–1920s) and two wet periods (1790s–1810s, 1990s–2010s) have been identified in the above reconstructed series. The comparisons show that the dry-wet variations in the study area and its surrounding regions could be influenced by comparable weather conditions. Some differences between the reconstructed PDSIP8C5 and the PDSI reconstruction in the Aksu area (1840s–1890s), and the reconstructed April–June PDSI in the Central Tianshan Mountains (1860s–1910s, 1960s–1980s) (Figure 6d) may be due to the influence of regional geographical characteristics, local climate variations, and different drought reconstruction seasons. The extreme drought event of 1876–1878 in northern China is missing in our reconstruction; some tree-ring sequences in the Qilian Mountains [47,48] and the central and eastern Tianshan Mountains [49] showed this drought event; according to historical records, there was no drought, and the harvest was successful in the Yili region in 1877 [50]. In addition, the reconstruction of precipitation in the Mulei area [51] and SPEI in the Yili Valley [52] showed that the humidity in this area was normal, and the tree-ring series in the Sayram Lake area in western Xinjiang indicate that 1876 was a wet year [53]. Based on historical documents and the above tree-ring sequence, it is believed that there was no drought in the study area in 1876–1878.
According to this reconstruction series, the PDSI in the Yili region exhibited a marked upward trend after the dry period in the 1980s, consistent with precipitation in the Tianshan Mountains of Xinjiang, which has increased in recent decades [54]. In addition, the climatic humidification trend in the 1980s was also reflected in the central Tianshan (Figure 6c). This warming and the humid trend are in line with previous studies [55]. The increase in temperature and humidity is believed to be linked to strengthening water vapor transport due to the combined effects of the tropical Indian Ocean and the regional atmospheric circulation system [56].

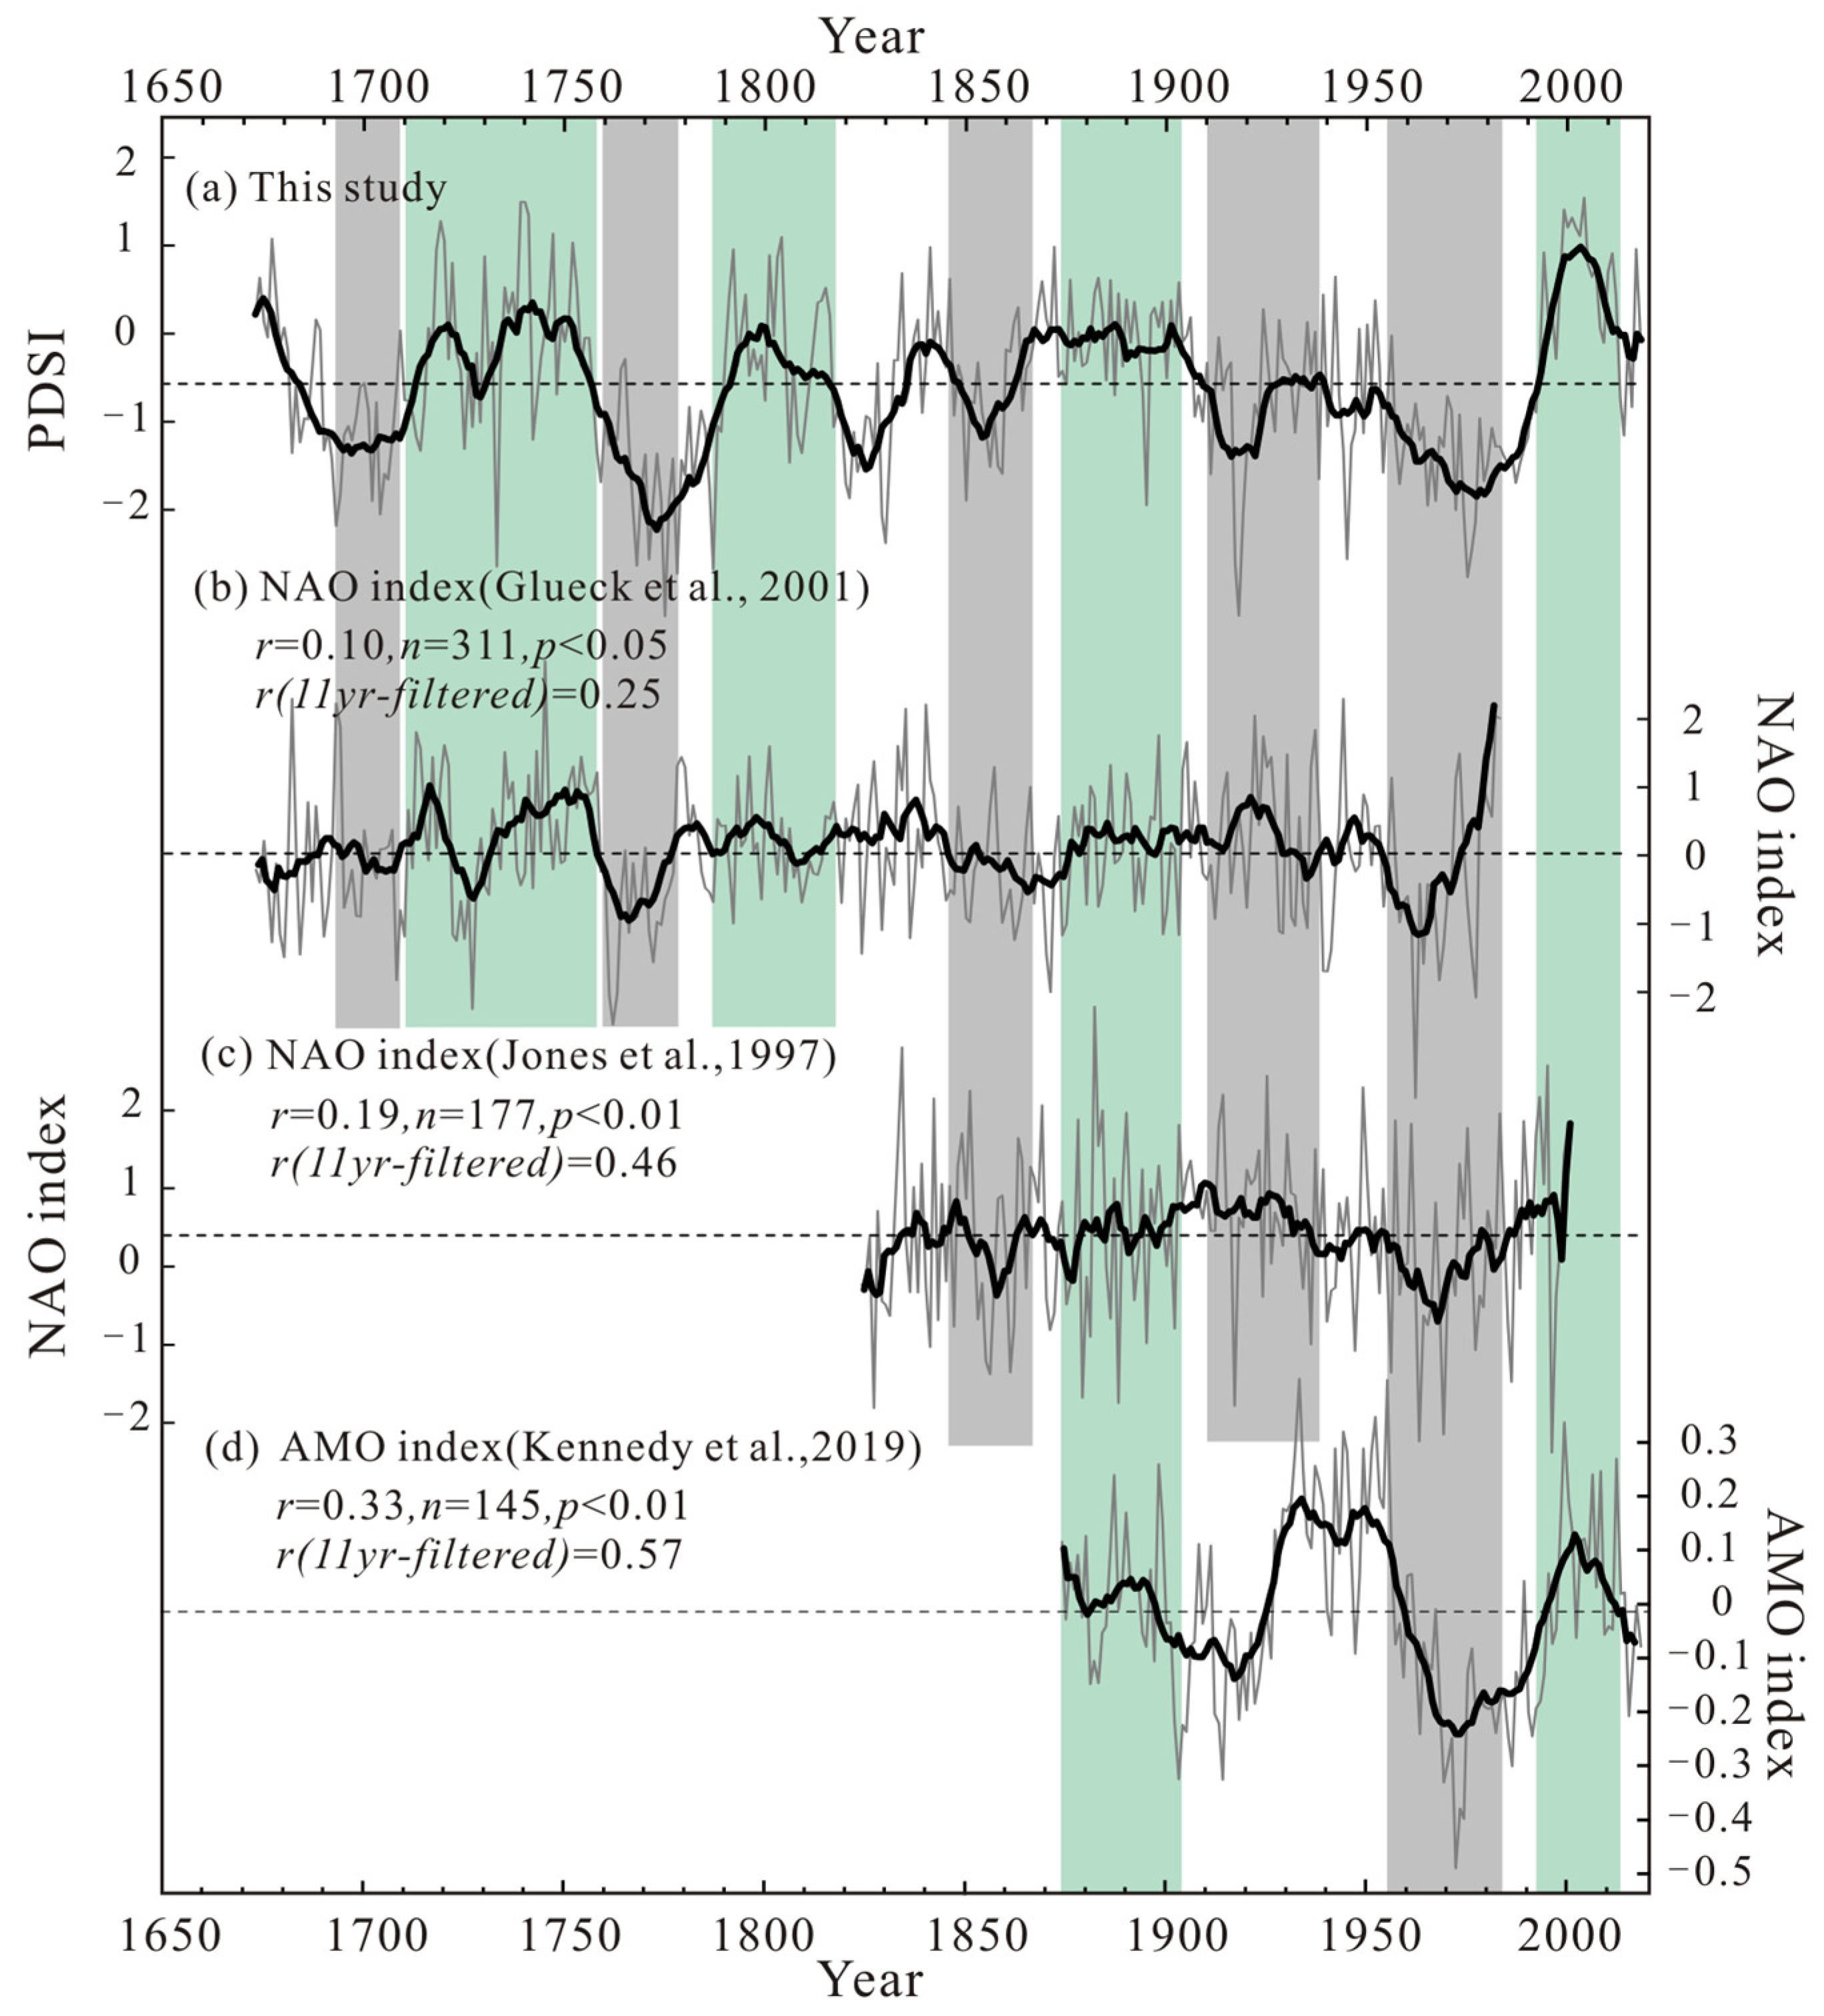
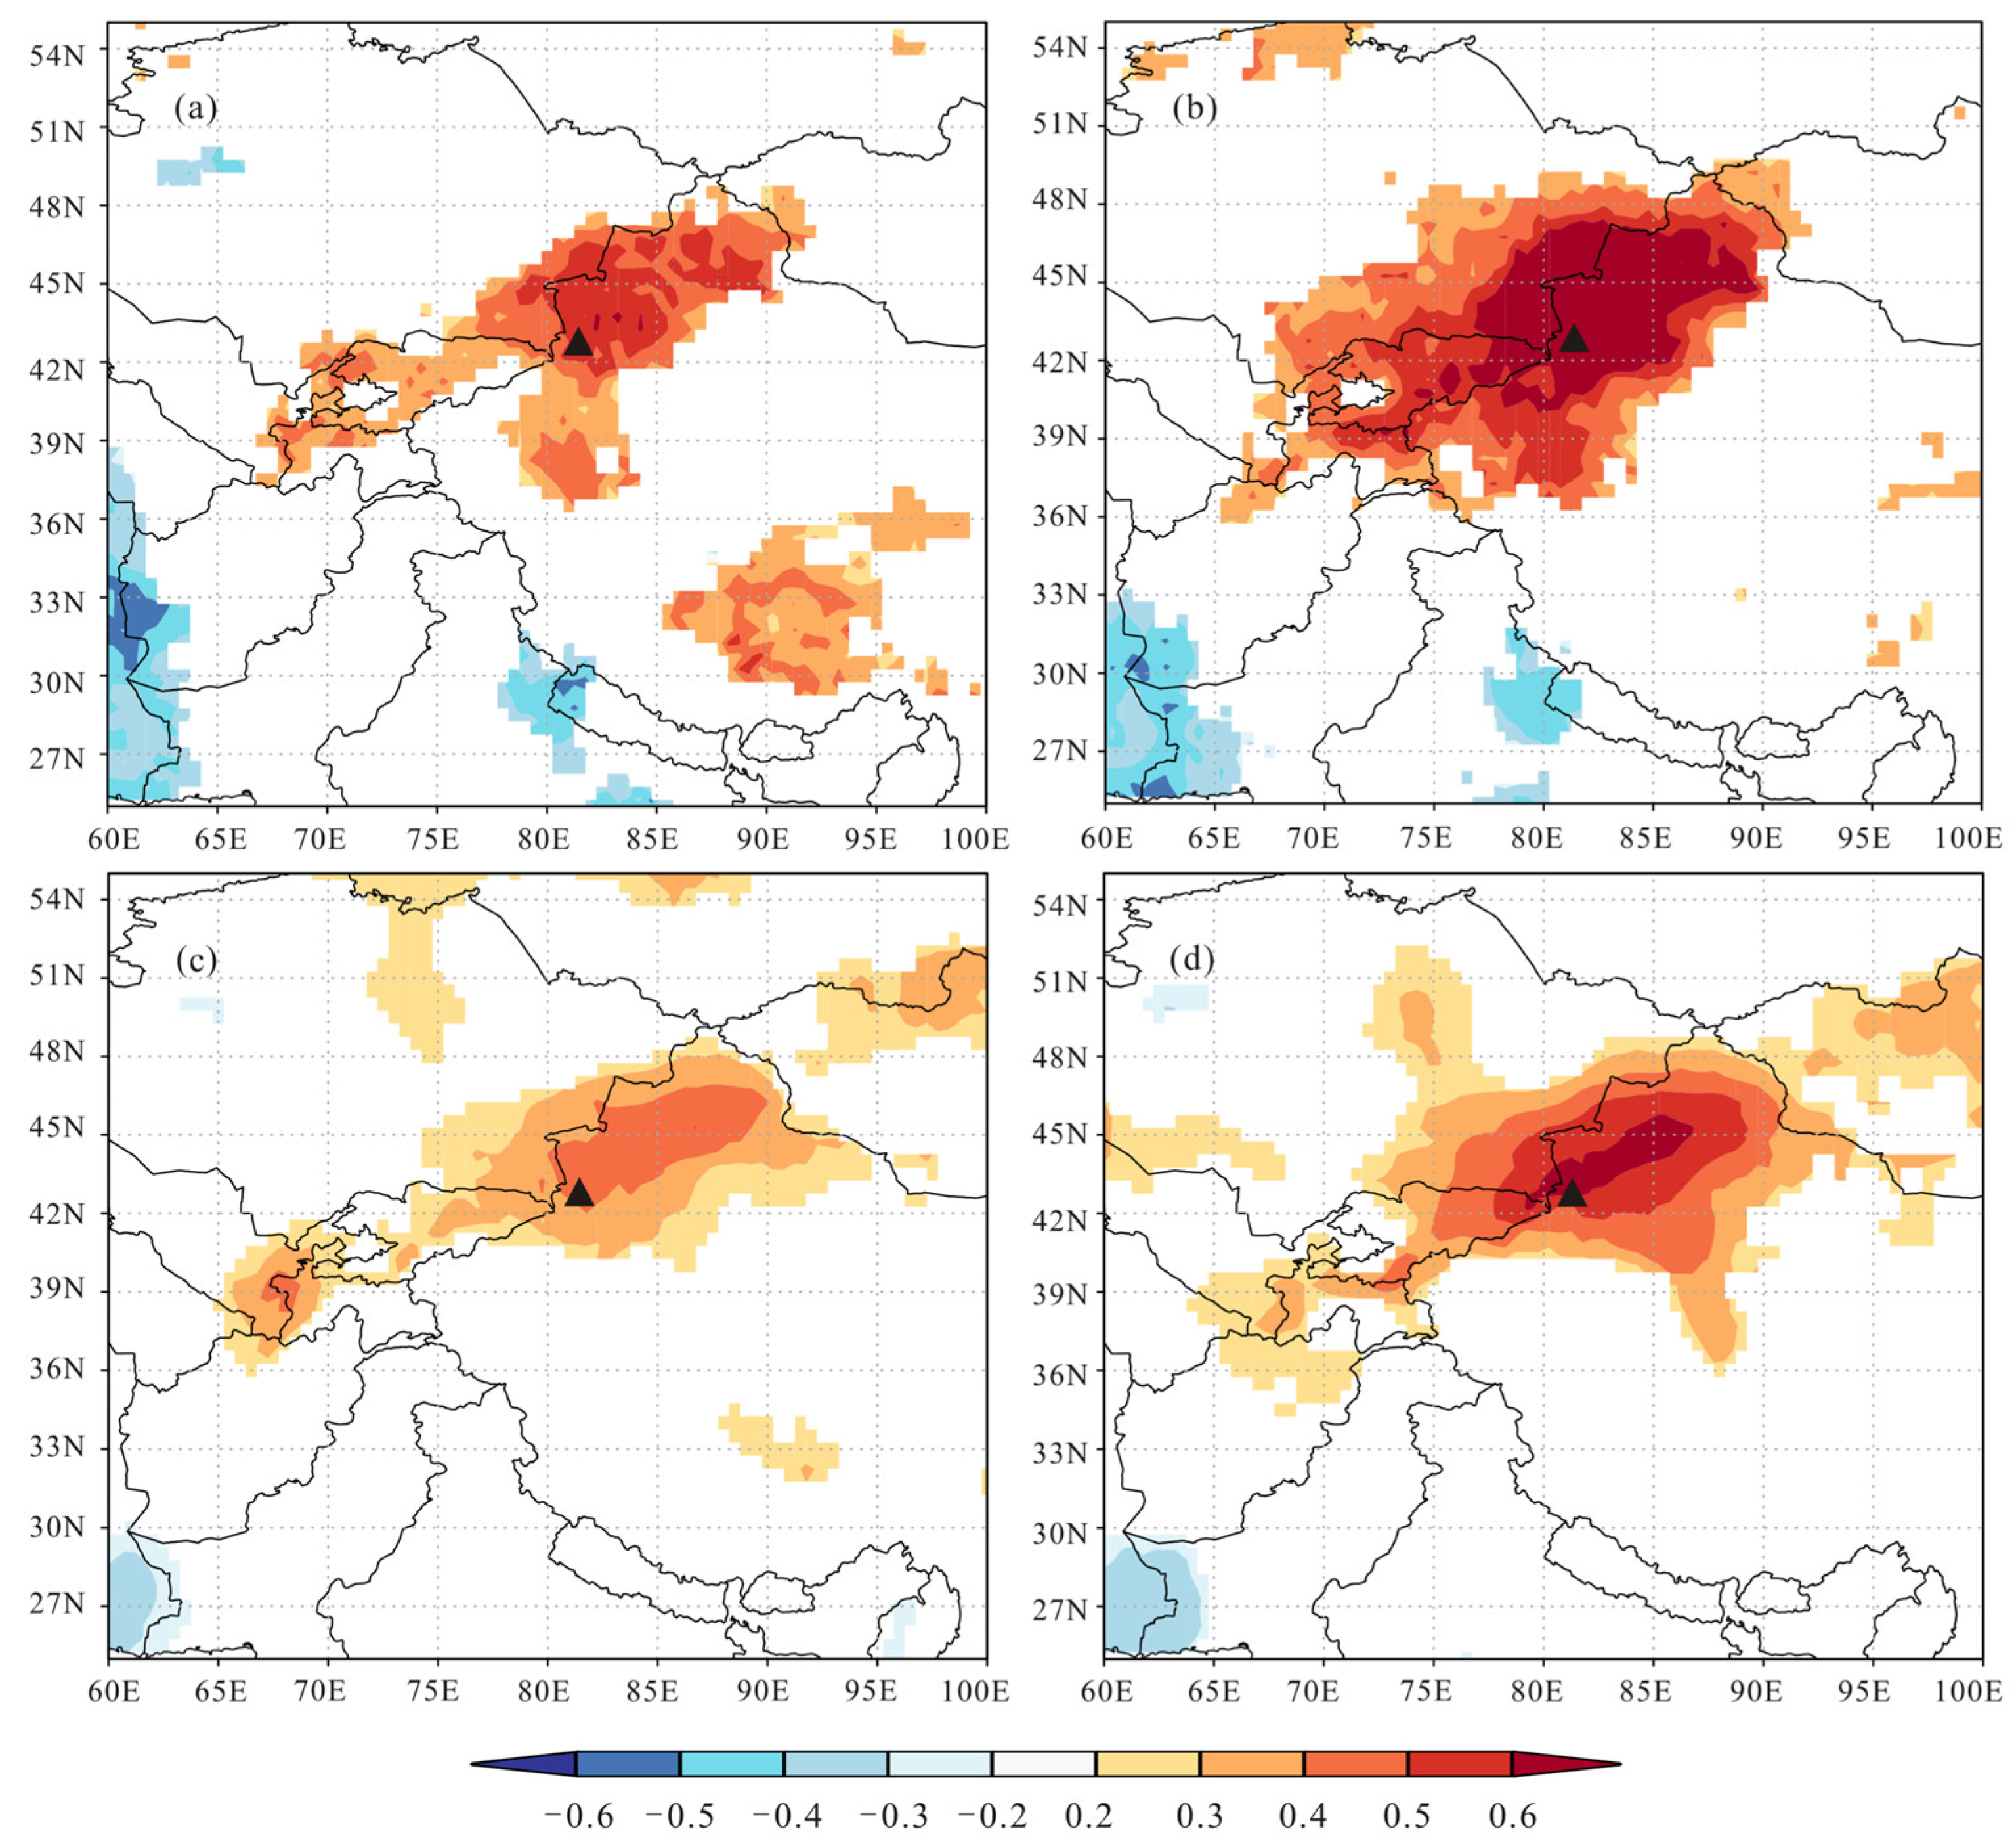
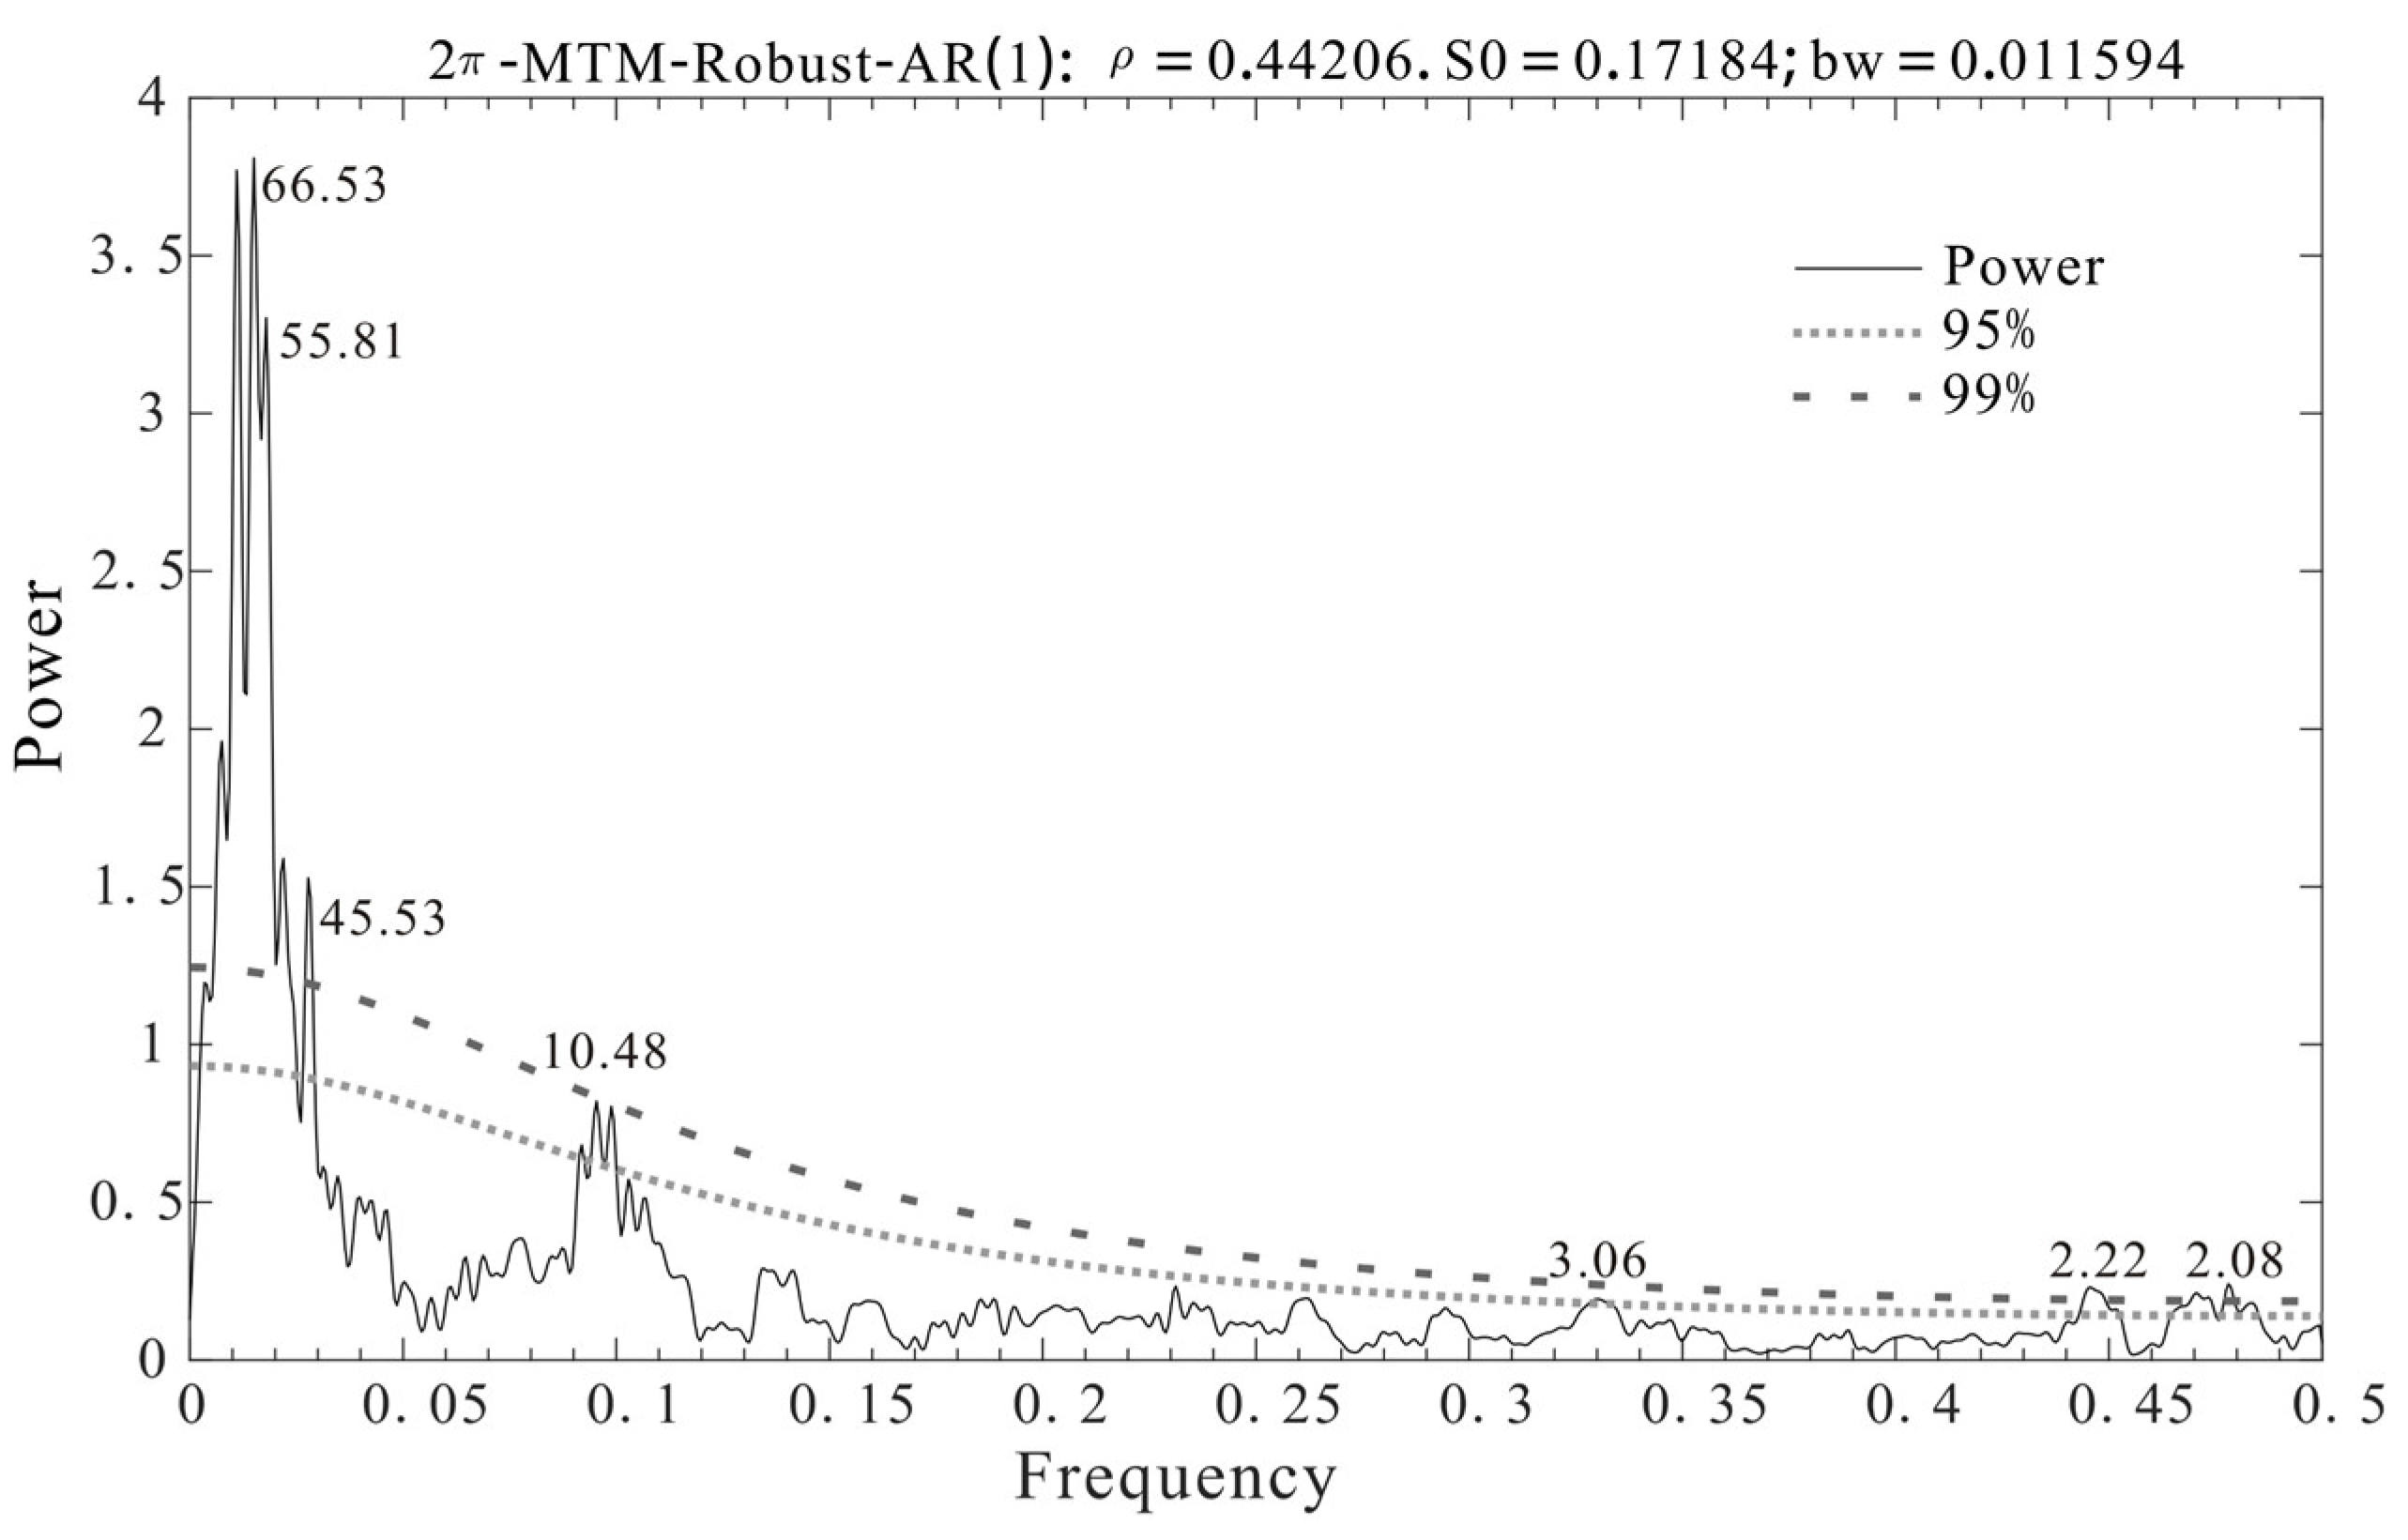
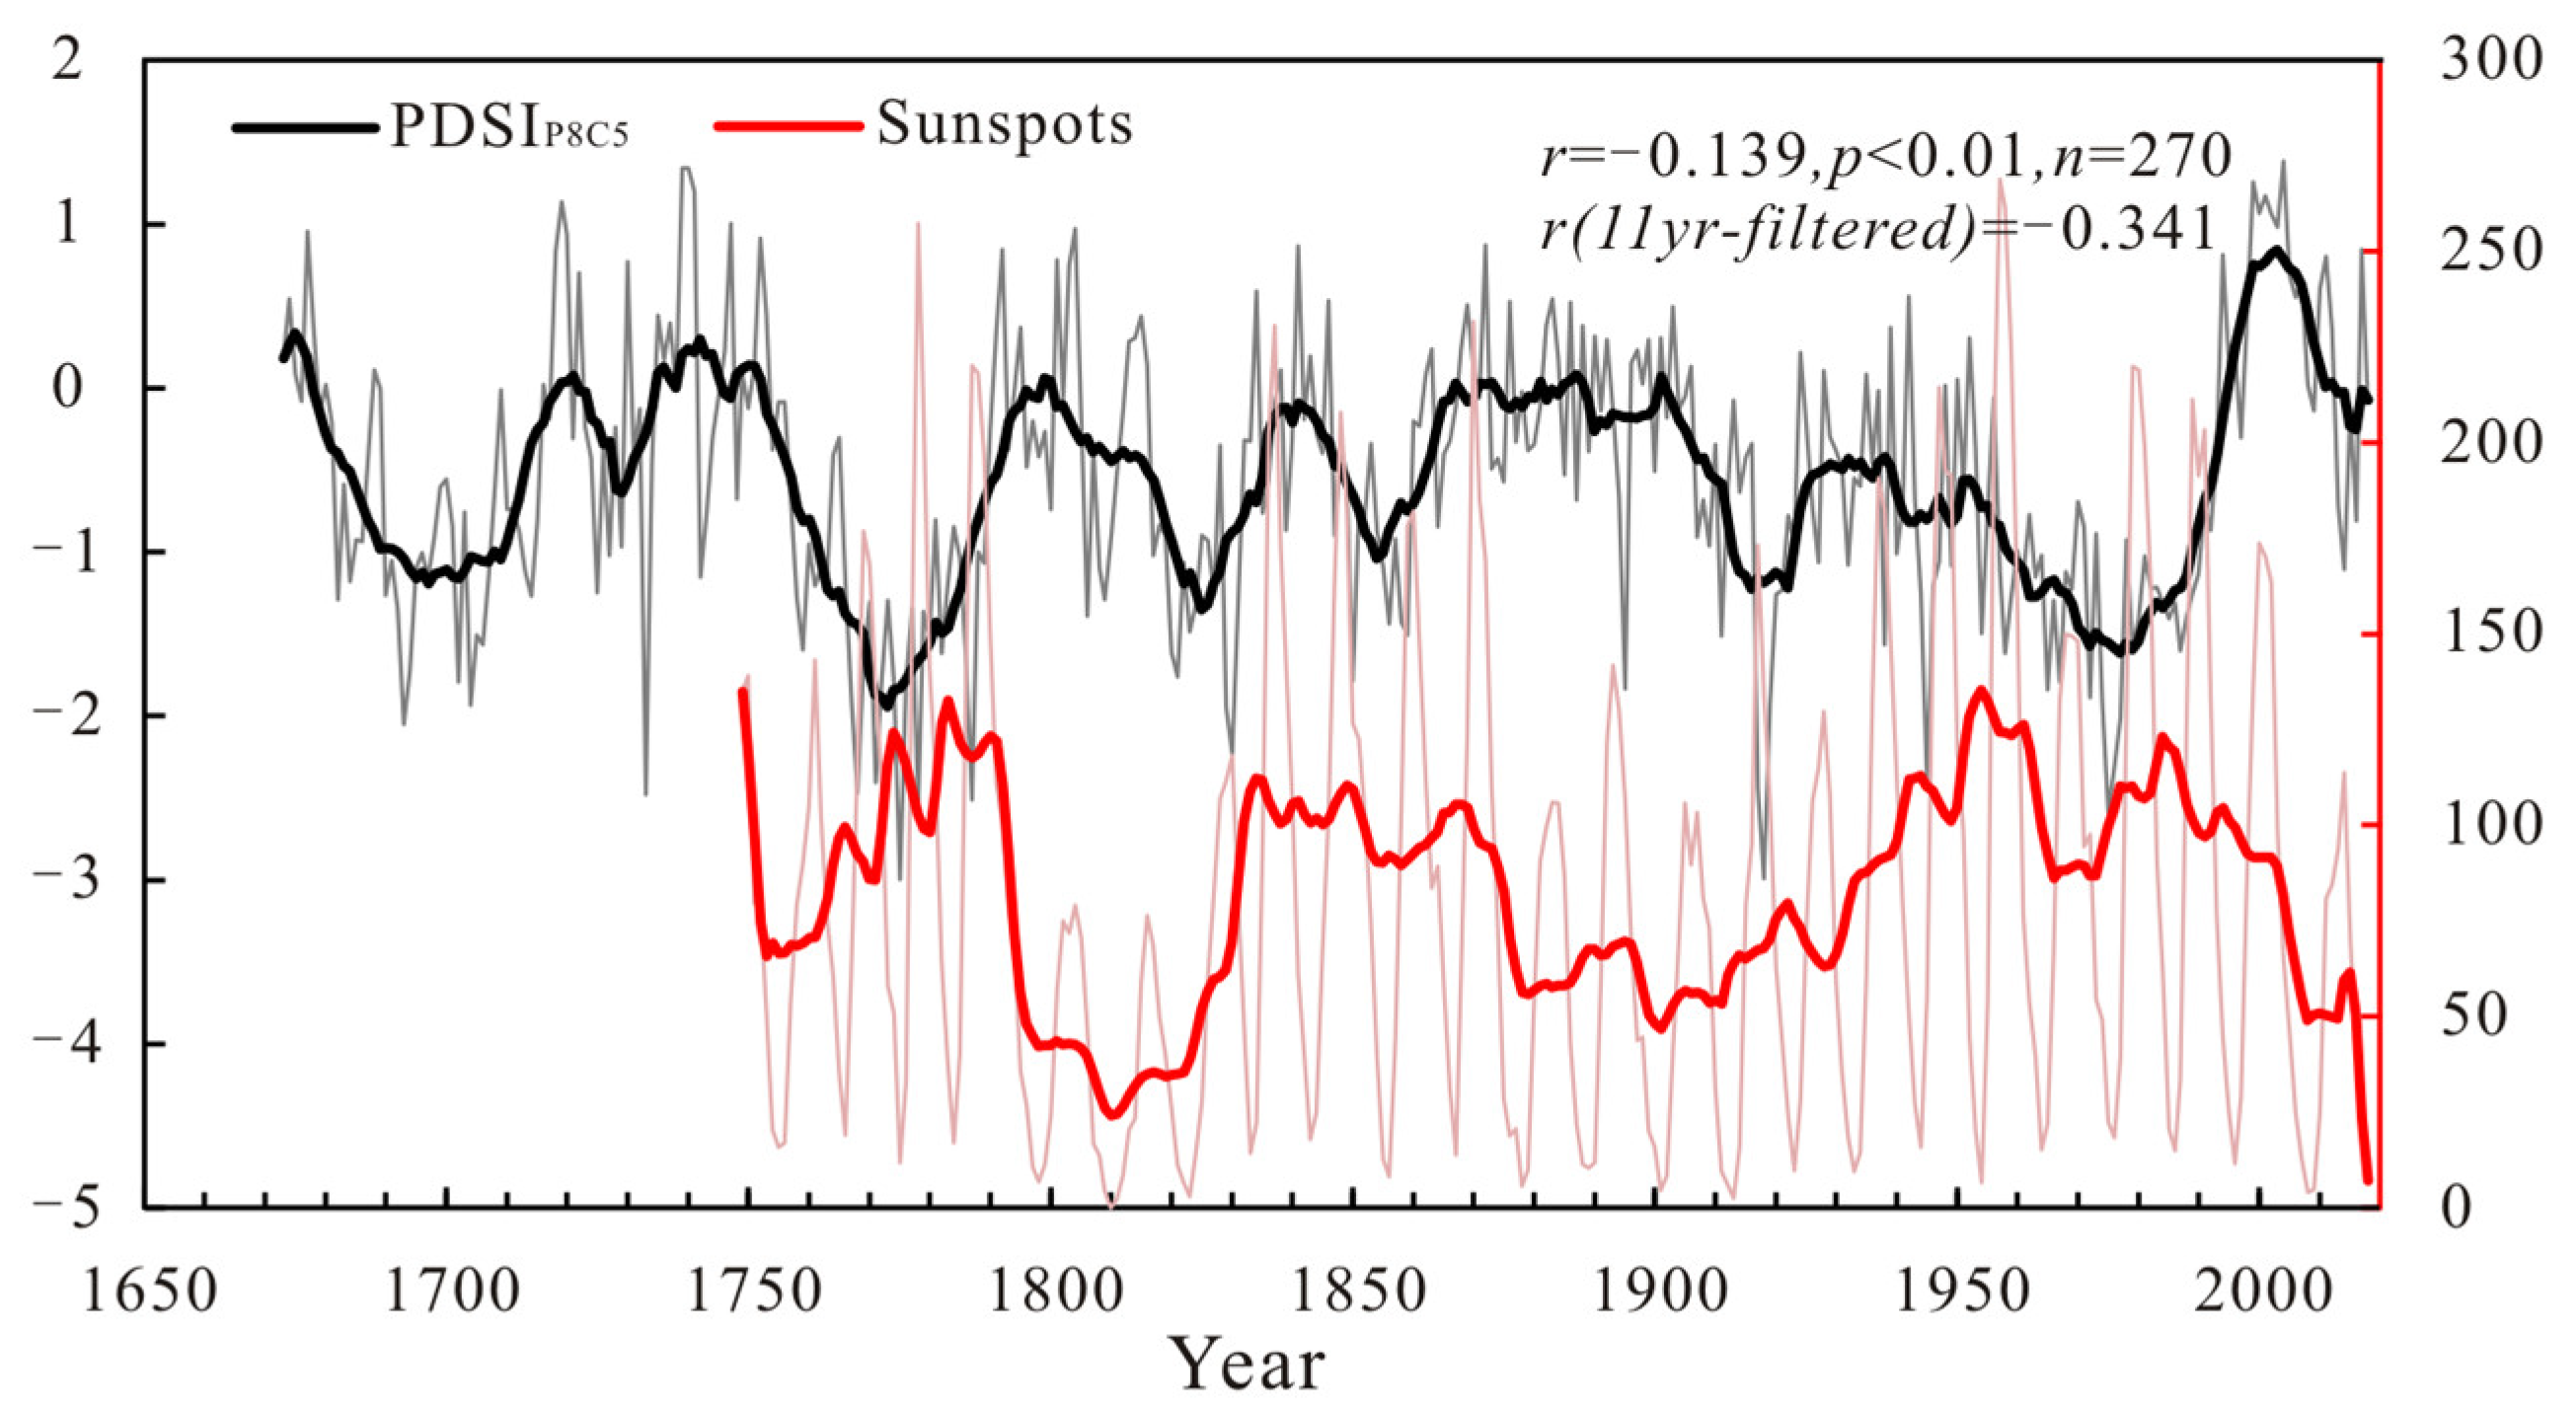
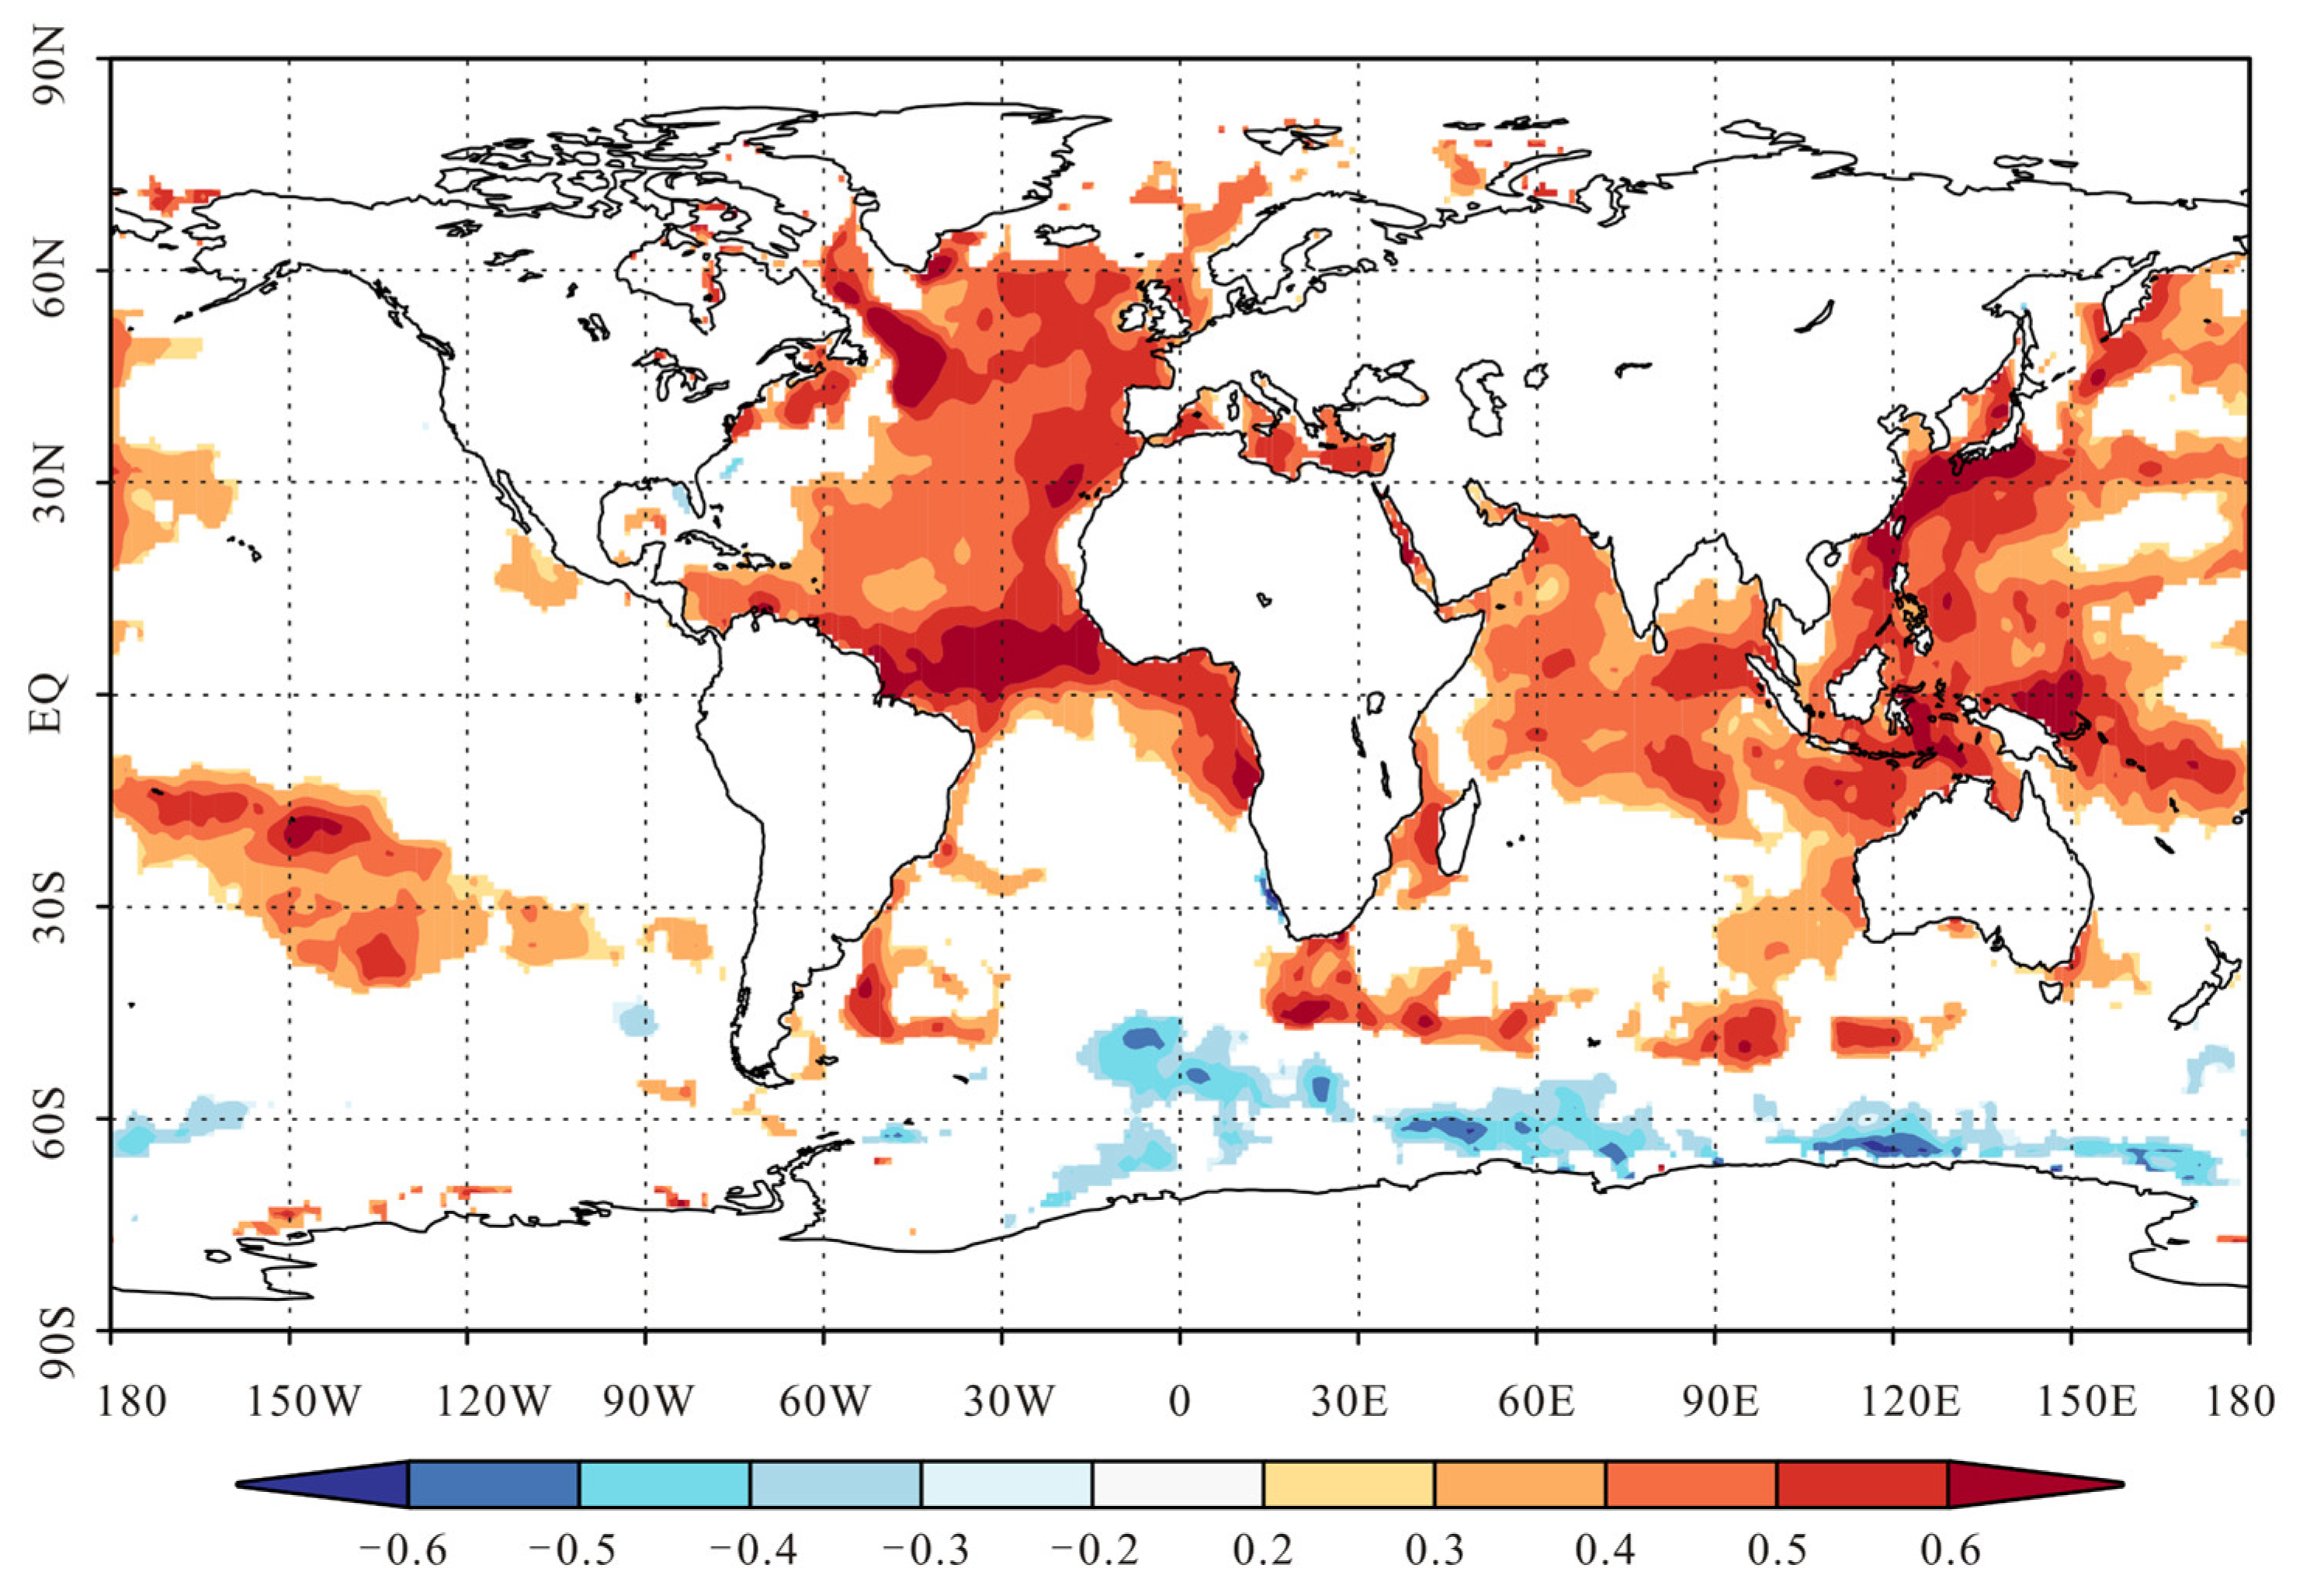
3.4. Potential Drivers of Regional Climate Change

Periodic analysis of reconstructed PDSIP8C5 during 1673–2018 using the MTM identified some significant inter-annual (2–3 years, 10–11 years) and inter-decadal (55.8 years, 66.5 years) quasi-periodicity (Figure 7). The 2–3-year cycle is consistent with the quasi-biennial atmospheric oscillation [57]. This cycle has also been found in other dendroclimatic studies in arid Central Asia [46,58]. And the 10–11-year cycle may be related to the sunspot activity [59]. The analysis of reconstructed PDSI and sunspot activity shows that the long-term variation of the two has an apparent anti-phase relationship (r = −0.139, p < 0.01, 1749–2018) (Figure 8). Increased solar activity causes the Earth’s surface to receive more solar radiant energy, which may accelerate water evaporation from the surface, leading to greater drought. The 55-year cycle has also been observed in the streamflow reconstruction of the Qingshui River [60], the temperature reconstruction of the Altai Mountains [61], and drought reconstruction for the Aksu area [41]. The 55.8-year cycle may be related to a 40–50-year cycle of oscillation in the climatic system, which could potentially correlate with abnormal fluctuations in the thermohaline circulation of the North Atlantic [41,62]. The 66.5-year cycle may coincide with solar activity [63,64], suggesting that moisture variability in the Yili region may be strongly associated with solar activity.
The oceans have a big part in modifying the climate all over the world. Figure 9 shows the positive spatial relationships between the reconstructed PDSI series and the Atlantic, Indian, and Western Pacific Sea Surface Temperatures from 1960 to 2018. This correlation suggests that moisture conditions in the study area may be related to large-scale oceanic and terrestrial circulatory systems.
The North Atlantic is a significant contributor to climate change in the Northern Hemisphere. The Yili Basin is a typical westerly region, and the North Atlantic Oscillation (NAO) is significantly associated with the intensity of westerly winds in the mid and high latitudes, which has an important influence on the dry and wet variations of the westerly winds [65]. In winter, NAO may result in abnormal north-south pressure over arid Central Asia, with increased pressure gradients and anomalous westerly winds bringing more moisture [66]; thus, we compare the reconstructed PDSIP8C5 in this paper with two reconstructed NAO index series [65,67] (Figure 10b,c), using an 11-year moving average to emphasize the trend on a decadal scale. The analysis revealed a positive correlation between PDSI and long-term variations in NAO. When the NAO is negative, the southward migration of Westerlies [68] leads to the weakening of cyclones over Central Asia; as a result, the cyclone center moves in a westward direction and water vapor transport decreases, reducing the amount of water vapor entering Central Asia [69]. In conclusion, NAO exerts a significant influence on water conditions in the study area.
AMO is considered a significant driver of regional climate change. AMO refers to a quasi-periodic oscillation of warming and cooling within the North Atlantic region on a basin scale. Tree-ring studies have demonstrated that AMO has the potential to influence climate change across a significant area. The Western Tianshan Mountains [71] and the Tibetan Plateau [72] are examples of regions subject to AMO’s effects despite their distance from the Atlantic Ocean. AMO could generate anomalies in atmospheric circulation by affecting heating and cooling in the middle and upper troposphere [73]. The positive phase of AMO strengthens the East Asian summer monsoon and weakens the winter monsoon, which results in positive anomalies of temperature and precipitation in arid and semi-arid areas of China [74,75]. Comparison of the reconstructed PDSIP8C5 with the previous year’s AMO index [70] since 1874 showed a significant positive relationship (r = 0.33, p < 0.01, n = 145) (Figure 10d).
The results indicate that the NAO and AMO positive and negative phases correspond to the relative wet and dry periods of the Yili Basin, respectively. As discussed above, the drought degree of the Yili Basin may be mainly controlled by the water vapor carried by the westerly circulation. We also noticed some differences between NAO and PDSI, such as 1870s–1900s and 1910s–1940s, indicating that other factors may affect the variation of regional drought conditions. Therefore, more high-resolution climate proxy indicators still need to be recorded and studied to understand further the effects of AMO and NAO on regional climate variability.

4. Conclusions

We reconstructed the mean PDSI from August to May, covering the period from 1673 to 2018, using a regional tree-ring width chronology of P. schrenkiana. The reconstructed PDSI recorded strong inter-annual and inter-decadal variations and revealed dry and wet periods. Historical documentary records support severe droughts in around 1770 and 1920. The trend towards a gradually wetter climate since the 1980s is also evident, suggesting that Xinjiang’s climate has been transitioning to a “warm and wet” climate since the 1980s. Compared with the reconstruction records of other surrounding areas, it is found that the dry events and wet events are consistent. The spatial correlation analysis shows that the reconstructed sequence can reflect the PDSI variation across a broad area around the sampling sites. In recent centuries, we found that sunspot activity, NAO, and AMO jointly influenced the PDSIP8C5.

Author Contributions

Conceptualization, methodology, software, and writing-original draft, Y.W.; supervision, project administration, and funding acquisition, Y.L.; supervision, methodology, and editing, Q.L. and Q.C.; investigation, and data curation, M.R.; addition of the financing, H.S. and C.S.; investigation, T.Z. and M.Y. All authors have read and agreed to the published version of the manuscript.

Funding

This study was financially supported by grants from the second Tibetan Plateau Scientific Expedition and Research Program (STEP, 2019QZKK0101), the National Natural Science Foundation of China (U1803245), and the Chinese Academy of Sciences (XDB40010300).This work was supported by the Fund of Shandong Province (LSKJ202203300).

Data Availability Statement

Meteorological data are contained within the article, and all data sources are mentioned.

Acknowledgments

We gratefully acknowledge Congxi Fang for his software support. We also express our gratitude to Teng Li and Yuanda Ye for their help in sample collection.

Conflicts of Interest

The authors declare no conflict of interest.

References

  1. Nakanyete, N.F.; Shikangalah, R.; Vatuva, A. Drought as a Disaster in the Namibian Context. Int. J. Sci. Res. 2020, 9, 377–386. [Google Scholar]
  2. Du, J.; Fang, J.; Xu, W.; Shi, P.J. Analysis of dry/wet conditions using the standardized precipitation index and its potential usefulness for drought/flood monitoring in Hunan Province, China. Stoch. Environ. Res. Risk Assess. 2013, 27, 377–387. [Google Scholar] [CrossRef]
  3. Jiang, D.B.; Wang, X.X. A brief interpretation of drought change from IPCC Sixth Assessment Report. Trans. Atmos. Sci. 2021, 44, 650–653. [Google Scholar] [CrossRef]
  4. Wu, P.; Gu, X.Y.; Wang, P.L. China’s Blue Book on Climate Change (2022) released. China Meteorological News, 8 April 2022. [Google Scholar]
  5. Chen, D.; Huang, F.; Li, Q.; Li, L. Spatial variation of humidity and its influencing factors in the north and south slopes of the Tianshan Mountains, China during 1966–2015. Progress. Inquisitiones Mutat. Clim. 2018, 14, 562–572. [Google Scholar]
  6. Wang, J.; Xiao, H. The spatial-temporal pattern changes and driving factors of grain production in Xinjiang province. J. China Agric. Resour. Reg. Plan. 2018, 39, 58–66. [Google Scholar]
  7. Wolff, C.; Plessen, B.; Dudashvilli, A.S.; Breitenbach, S.F.; Cheng, H.; Edwards, L.R.; Strecker, M.R. Precipitation evolution of Central Asia during the last 5000 years. Holocene 2017, 27, 142–154. [Google Scholar] [CrossRef]
  8. Yao, J.Q.; Zeng, Y.; Li, J.G.; Yang, L.M. A review of dry-wet climate change and extreme precipitation in Central Asia. Adv. Meteorol. Sci. Technol. 2020, 10, 7–14. [Google Scholar]
  9. Jiang, J.; Zhou, T.J.; Chen, X.L.; Wu, B. Central Asian Precipitation Shaped by the Tropical Pacific Decadal Variability and the Atlantic Multidecadal Variability. J. Clim. 2021, 34, 7541–7553. [Google Scholar] [CrossRef]
  10. Esper, J.; Cook, E.R.; Schweingruber, F.H. Low-frequency signals in long tree-ring chronologies for reconstructing past temperature variability. Science 2002, 295, 2250–2253. [Google Scholar] [CrossRef]
  11. Buntgen, U.; Tegel, W.; Nicolussi, K.; McCormick, M.; Frank, D.; Trouet, V.; Kaplan, J.O.; Herzig, F.; Heussner, K.U.; Wanner, H.; et al. 2500 Years of European Climate Variability and Human Susceptibility. Science 2011, 331, 578–582. [Google Scholar] [CrossRef]
  12. Liu, Y.; Song, H.M.; Sun, C.F.; Song, Y.; Cai, Q.F.; Liu, R.S.; Lei, Y.; Li, Q. The 600-mm precipitation isoline distinguishes tree-ring-width responses to climate in China. Natl. Sci. Rev. 2019, 6, 359–368. [Google Scholar] [CrossRef] [PubMed]
  13. Zhang, R.B.; Yuan, Y.J.; Wei, W.S.; Gou, X.H.; Yu, S.L.; Shang, H.M.; Zhang, T.W.; Chen, F.; Qin, L. Research advances of dendroclimatology in Tianshan Mountains. Desert Oasis Meteorol. 2016, 10, 1–9. [Google Scholar]
  14. Yuan, Y.J.; Li, J.F.; Hu, R.J.; Liu, C.H.; Jiao, K.Q.; Li, Z.Q. Reconstruction of precipitation in the recent 350a from tree-rings in the middle Tianshan Mountains. J. Glaciol. Geocryol. 2001, 23, 34–40. [Google Scholar]
  15. Shang, H.M.; Wei, W.S.; Yuan, Y.J.; Yu, S.L.; Chen, X.; Zhang, T.W.; Liu, X.H. The 150-year Precipitation Change Recorded by Tree Ring in the Central Tianshan Mountains. Arid Zone Res. 2010, 27, 443–449. [Google Scholar] [CrossRef]
  16. Gao, W.D.; Yuan, Y.J.; Zhang, R.B.; Liu, Z.H. The recent 338-year precipitation series reconstructed form tree-ring in northern slope of Tianshan mountains. J. Desert Res. 2011, 31, 1535–1540. [Google Scholar]
  17. Zhang, R.B.; Wei, W.S.; Yuan, Y.J.; Yang, Q.; Yu, S.L.; Zhang, T.W.; Shang, H.M.; Chen, F. Changes of runoff in Aksu river on southern slopes of Tianshan Mountains in past 300 years, recorded in tree-rings. J. Glaciol. Geocryol. 2011, 33, 744–751. [Google Scholar]
  18. Zhang, T.W.; Liu, Y.; Yuan, Y.J.; Wei, W.S.; Yu, S.L.; Chen, F. Tree ring based mean maximum temperature reconstruction for the Gongnaisi region on the southern slope of the central Tien Shan Mountains, China since A.D. 1777. Quat. Sci. 2011, 31, 1011–1021. [Google Scholar]
  19. Zhang, T.W.; Wang, L.L.; Yuan, Y.J.; Wei, W.S.; Yu, S.L.; Zhang, R.B.; Chen, F.; Shang, H.M.; Fan, Z.A. A 645-year precipitation reconstruction in Baluntai region on southern slope of mid-Tianshan mountains based on tree-ring width. Sci. Geogr. Sin. 2011, 31, 251–256. [Google Scholar] [CrossRef]
  20. Zhang, R.B.; Yuan, Y.J.; Wei, W.S.; Yu, S.L.; Zhang, T.W.; Shang, H.M.; Chen, F.; Qin, L. Monthly mean temperature from February to March in Aksu river basin on southern slope of Tianshan mountain recorded by tree ring. Plateau Meteorol. 2012, 31, 804–809. [Google Scholar]
  21. Qin, L.; Yuan, Y.J.; Yu, S.L.; Fan, Z.A.; Shang, H.M.; Chen, F.; Zhang, T.W. Response of tree-ring growth of Picea schrenkiana climate change in the Sayram Lake basin, Xinjiang, China. J. Desert Res. 2015, 35, 113–119. [Google Scholar]
  22. Jiao, L.; Ma, L.; Zhang, T.W.; Wang, S.J. Changes of mean minimum temperature in June-July since 1798 in central Altay Mountain recorded by tree rings. Acta Ecol. Sin. 2021, 41, 1944–1958. [Google Scholar]
  23. Yang, L.; Qin, L.; Liu, K.X.; Zhang, T.W.; Zhang, R.B. Response of tree radial growth to snow cover change in southern Ili mountains, Xinjiang. Desert Oasis Meteorol. 2022, 16, 78–86. [Google Scholar]
  24. Wang, Z.W.; Li, Q.; Liu, Y.; Yang, Y.K.; Ren, M.; Cui, L.L. PDSI variations recorded by tree rings in the northern Lüliang Mountains during the past 175 years. J. Earth Environ. 2020, 11, 72–80. [Google Scholar]
  25. Chen, J.; Wang, L.L.; Zhu, H.F.; Wu, P. Reconstruction of spring and summer mean maximum temperature variation by the maximum density of Picea schrenkiana in Tianshan Mountains, Xinjiang. Chin. Sci. Bull. 2009, 54, 1295–1302. [Google Scholar]
  26. Fan, M.J.; Yuan, Y.J.; Wei, W.S.; Yu, S.L. Reconstruction of precipitation series from tree-rings at the northern slopes of south Tianshan mountains of Yili prefecture. Arid Land Geogr. 2007, 30, 268–273. [Google Scholar] [CrossRef]
  27. Ye, B.S.; Lai, Z.M.; Shi, Y.F. Some characteristics of precipitation and temperature in the Yili River basin. Arid Land Geogr. 1997, 20, 46–52. [Google Scholar] [CrossRef]
  28. Zhang, J.M. Study on temporal and spatial distribution of climate resource in Yili River basin. J. Arid Meteorol. 2006, 2, 1–4. [Google Scholar]
  29. Wu, Y.L.; Gan, M.; Yu, R.D.; Yang, M.L.; Guo, Y.F.; Zhao, P. Process-based modeling radial growth of Picea schrenkiana in the eastern Tianshan Mountains. Arid Land Geogr. 2020, 43, 64–71. [Google Scholar]
  30. Holmes, R.L. Computer-Assisted Quality Control in Tree-Ring Dating and Measurement. Tree-Ring Bull. 1983, 43, 51–67. [Google Scholar]
  31. Cook, E. A Time Seires Analysis Approach to Tree ring Standardization. Ph.D. Thesis, The University of Arizona, Tuscon, AZ, USA, 1985. [Google Scholar]
  32. Liu, Y.; Xiang, N.; Song, H.M. Tree-ring temperature records in Arxan, Inner Mongolia for the past 187 years. J. Earth Environ. 2012, 3, 862–867. [Google Scholar]
  33. Wigley, T.M.L.; Briffa, K.R.; Jones, P.D. On the average value of correlated time series, with applications in dendroclimatology and hydrometeorology. J. Clim. Appl. Meteorol. 1984, 23, 201–213. [Google Scholar] [CrossRef]
  34. Fritts, H.C. Tree-Rings and Climate; Academic Press: London, UK, 1976. [Google Scholar]
  35. Efron, B. Bootstrap Methods: Another Look at the Jackknife. Ann. Stat. 1979, 7, 1–26. [Google Scholar] [CrossRef]
  36. Thomson, D.J. Spectrum estimation and harmonic analysis. Proc. IEEE 1982, 70, 1055–1096. [Google Scholar] [CrossRef]
  37. Cai, Q.F.; Liu, Y.; Wang, Y.C.; Ma, Y.Y.; Liu, H. Recent warming evidence inferred from a tree-ring-based winter-half year minimum temperature reconstruction in northwestern Yichang, South Central China, and its relation to the large-scale circulation anomalies. Int. J. Biometeorol. 2016, 60, 1885–1896. [Google Scholar] [CrossRef] [PubMed]
  38. Cook, E.R.; Esper, J.; D’Arrigo, R.D. Extra-tropical Northern Hemisphere land temperature variability over the past 1000 years. Quat. Sci. Rev. 2004, 23, 2063–2074. [Google Scholar] [CrossRef]
  39. Wang, H.L.; Shao, X.M.; Li, M.Q. A 2917-year tree-ring-based reconstruction of precipitation for the Buerhanbuda Mts., Southeastern Qaidam Basin, China. Dendrochronologia 2019, 55, 80–92. [Google Scholar] [CrossRef]
  40. Chen, Y.P.; Chen, F.; Zhang, H.L. A Tree-Ring-Based Precipitation Reconstruction since 1760 CE from Northeastern Tibetan Plateau, China. Atmosphere 2021, 12, 416. [Google Scholar] [CrossRef]
  41. Wang, H.; Zhang, Y.; Shao, X. A tree-ring-based drought reconstruction from 1466 to 2013 CE for the Aksu area, western China. Clim. Change 2021, 165, 39. [Google Scholar] [CrossRef]
  42. Durbin, J.; Watson, G.S. Testing for serial correlation in least squares regression. 3. Biometrika 1971, 58, 1. [Google Scholar] [CrossRef]
  43. Liu, Y.S.; Shi, J.F.; Yang, Y.K.; Cai, Q.F.; Sun, J.Y.; Wang, L. A generalized approach for protein design based on the relative entropy. Chin. Sci. Bull. 2004, 49, 265–269. [Google Scholar]
  44. Shi, Y.G. Chinese Meteorological Disaster Ceremony: Xinjiang Volume; China Meteorological Press: Beijing, China, 2006.
  45. Liang, E.Y.; Shao, X.M.; Huang, L.; Wang, L.L. Tree rings in Central and western China as indicators of drought hazards in the 1920s. Prog. Nat. Sci. 2004, 4, 111–116. [Google Scholar]
  46. Li, J.B.; Gou, X.H.; Cook, E.R.; Chen, F.H. Tree-ring based drought reconstruction for the central Tien Shan area in northwest China. Geophys. Res. Lett. 2006, 33, L07715. [Google Scholar] [CrossRef]
  47. Deng, Y.; Gou, X.H.; Gao, L.L.; Zhao, Z.Q.; Cao, Z.Y.; Yang, M.X. Aridity changes in the eastern Qilian Mountains since AD 1856 reconstructed from tree-rings. Quat. Int. 2013, 283, 78–84. [Google Scholar] [CrossRef]
  48. Chen, F.; Yuan, Y.J.; Wei, W.S.; Zhang, R.B.; Yu, S.L.; Shang, H.M.; Zhang, T.W.; Qin, L.; Wang, H.Q.; Chen, F.H. Tree-ring-based annual precipitation reconstruction for the Hexi Corridor, NW China: Consequences for climate history on and beyond the mid-latitude Asian continent. Boreas 2013, 42, 1008–1021. [Google Scholar] [CrossRef]
  49. Xu, G.B.; Liu, X.H.; Qin, D.H.; Chen, T.; Wang, W.Z.; Wu, G.J.; Sun, W.Z.; An, W.L.; Zeng, X.M. Tree-ring delta O-18 evidence for the drought history of eastern Tianshan Mountains, northwest China since 1700 AD. Int. J. Climatol. 2014, 34, 3336–3347. [Google Scholar] [CrossRef]
  50. Li, Y.; Zhang, L.; Ye, Y.; Lu, Y. Drought Event in the Midwest Region of Northwest China in 1876–1878. Sci. Geogr. Sin. 2018, 38, 780–789. [Google Scholar]
  51. Zhang, T.; Yuan, Y.; Chen, X.; Fan, Z.a.; Yu, S.; Chen, F.; Shang, H.; Zhang, R.; Qin, L. Tree-ring-width based precipitation for the Mulei region in the eastern Tien Shan Mountains. Quat. Sci. 2015, 35, 1121–1133. [Google Scholar]
  52. Xu, G.B.; Liu, X.H.; Wu, G.J.; Chen, T.; Wang, W.Z.; Zhang, Q.; Zhang, Y.F.; Zeng, X.M.; Qin, D.H.; Sun, W.Z.; et al. Tree ring δ18O’s indication of a shift to a wetter climate since the 1880s in the western Tianshan Mountains of northwestern China. J. Geophys. Res. Atmos. 2015, 120, 6409–6425. [Google Scholar] [CrossRef]
  53. Qin, L.; Yuan, Y.; Yu, S.; Fan Zi, A.; Shang, H.; Chen, F.; Zhang, T.; Zhang, R. Tree-ring-based precipitation variability over the past 373 years in the Sayram Lake Basin, Tianshan Mountians. Acta Ecol. Sin. 2017, 37, 1084–1092. [Google Scholar]
  54. Wu, X.L.; Zhang, T.X.; Wang, H.; Yu, X.J.; Zheng, X.N.; Li, H.Y. Characteristics of temperature and precipitation change in Xinjiang during 1961–2017. Desert Oasis Meteorol. 2020, 14, 27–34. [Google Scholar]
  55. Shi, Y.; Shen, Y.; Li, D.; Zhang, G.; Bureau of Hydrology and Water Resources; Ding, Y.; Hu, R.; Kang, E. Discussion on the present climate change from warm-dry to warm-wet in Northwest China. Quat. Sci. 2003, 23, 152–164. [Google Scholar]
  56. Zhao, Y.; Zhang, H.Q. Impacts of SST Warming in tropical Indian Ocean on CMIP5 model-projected summer rainfall changes over Central Asia. Clim. Dyn. 2016, 46, 3223–3238. [Google Scholar] [CrossRef]
  57. Baldwin, M.P.; Gray, L.J.; Dunkerton, T.J.; Hamilton, K.; Haynes, P.H.; Randel, W.J.; Holton, J.R.; Alexander, M.J.; Hirota, I.; Horinouchi, T.; et al. The quasi-biennial oscillation. Rev. Geophys. 2001, 39, 179–229. [Google Scholar] [CrossRef]
  58. Chen, F.H.; Huang, W.; Jin, L.Y.; Chen, J.H.; Wang, J.S. Spatiotemporal precipitation variations in the arid Central Asia in the context of global warming. Sci. China Earth Sci. 2011, 54, 1812–1821. [Google Scholar] [CrossRef]
  59. Li, K.J.; Su, T.W.; Liang, H.F. Periodicity of Sunspot Activity in modern Sunspot Observations. Chin. Sci. Bull. 2004, 24, 2511–2516. [Google Scholar]
  60. Zhang, T.; Shang, H.; Fan, Y.; Yu, S.; Zhang, R.; Qin, L.; Jiang, S. A 475-year tree-ring-width record of streamflow for the Qingshui River originating in the southern slope of the central Tianshan Mountains, China. Geogr. Ann. Ser. A Phys. Geogr. 2020, 102, 247–266. [Google Scholar] [CrossRef]
  61. Zhang, T.W.; Yuan, Y.J.; Hu, Y.C.; Wei, W.S.; Shang, H.M.; Huang, L.P.; Zhang, R.B.; Chen, F.; Yu, S.L.; Fan, Z.A.; et al. Early summer temperature changes in the southern Altai Mountains of Central Asia during the past 300 years. Quat. Int. 2015, 358, 68–76. [Google Scholar] [CrossRef]
  62. Greatbatch, R.J.; Zhang, S. An Interdecadal Oscillation in an idealized ocean-basin forced by constant heat-flux. J. Clim. 1995, 8, 81–91. [Google Scholar] [CrossRef]
  63. Mazzarella, A. The 60-year solar modulation of global air temperature: The Earth’s rotation and atmospheric circulation connection. Theor. Appl. Climatol. 2007, 88, 193–199. [Google Scholar] [CrossRef]
  64. Ogurtsov, M.; Lindholm, M.; Jalkanen, R.; Veretenenko, S. Evidence for the Gleissberg solar cycle at the high-latitudes of the Northern Hemisphere. Adv. Space Res. 2015, 55, 1285–1290. [Google Scholar] [CrossRef]
  65. Glueck, M.F.; Stockton, C.W. Reconstruction of the North Atlantic Oscillation, 1429–1983. Int. J. Climatol. 2001, 21, 1453–1465. [Google Scholar] [CrossRef]
  66. Huang, W.; Chen, F.H.; Feng, S.; Chen, J.H.; Zhang, X.J. Interannual precipitation variations in the mid-latitude Asia and their association with large-scale atmospheric circulation. Chin. Sci. Bull. 2013, 58, 3962–3968. [Google Scholar] [CrossRef]
  67. Jones, P.D.; Jonsson, T.; Wheeler, D. Extension to the North Atlantic oscillation using early instrumental pressure observations from Gibraltar and south-west Iceland. Int. J. Climatol. 1997, 17, 1433–1450. [Google Scholar] [CrossRef]
  68. Lan, J.H.; Wang, T.L.; Dong, J.B.; Kang, S.G.; Cheng, P.; Zhou, K.E.; Liu, X.X.; Wang, Y.Q.; Ma, L. The influence of ice sheet and solar insolation on Holocene moisture evolution in northern Central Asia. Earth-Sci. Rev. 2021, 217, 103645. [Google Scholar] [CrossRef]
  69. Ren, G.; Zhao, Y. Decadal Variability of the Subtropical Westerly Jet and Its Association with Circulation and Rainfall over Central Asia. Clim. Environ. Res. 2023, 28, 356–366. [Google Scholar]
  70. Kennedy, J.J.; Rayner, N.A.; Atkinson, C.P.; Killick, R.E. An Ensemble Data Set of Sea Surface Temperature Change From 1850: The Met Office Hadley Centre HadSST.4.0.0.0 Data Set. J. Geophys. Res. Atmos. 2019, 124, 7719–7763. [Google Scholar] [CrossRef]
  71. Chen, F.; Yuan, Y.J.; Chen, F.H.; Wei, W.S.; Yu, S.L.; Chen, X.J.; Fan, Z.A.; Zhang, R.B.; Zhang, T.W.; Shang, H.M.; et al. A 426-year drought history for Western Tian Shan, Central Asia, inferred from tree rings and linkages to the North Atlantic and Indo-West Pacific Oceans. Holocene 2013, 23, 1095–1104. [Google Scholar] [CrossRef]
  72. Li, T.; Li, J.B. A 564-year annual minimum temperature reconstruction for the east central Tibetan Plateau from tree rings. Glob. Planet. Change 2017, 157, 165–173. [Google Scholar] [CrossRef]
  73. O’Reilly, C.H.; Woollings, T.; Zanna, L. The Dynamical Influence of the Atlantic Multidecadal Oscillation on Continental Climate. J. Clim. 2017, 30, 7213–7230. [Google Scholar] [CrossRef]
  74. Lu, R.Y.; Dong, B.W.; Ding, H. Impact of the Atlantic multidecadal oscillation on the Asian summer monsoon. Geophys. Res. Lett. 2006, 33, L24701. [Google Scholar] [CrossRef]
  75. Li, S.L.; Bates, G.T. Influence of the Atlantic multidecadal oscillation on the winter climate of East China. Adv. Atmos. Sci. 2007, 24, 126–135. [Google Scholar] [CrossRef]
Figure 1. An overview of the sampling sites and nearby meteorological stations.
Forests 14 02127 g001
Figure 2. The STD chronology and sample depth (gray line) (a); The Rbar and EPS statistics (b). The vertical dashed line indicates the year 1673 when the SSS > 0.85.
Forests 14 02127 g002
Figure 3. Correlations between the STD chronology and precipitation, mean temperature, and PDSI from 1960 to 2018. The gray dotted line indicates the 99% confidence level.
Forests 14 02127 g003
Figure 4. Comparison of the actual (gray) PDSI and reconstructed (black) August–May mean PDSI (a) and first differences of them (b) during the 1960–2018 calibration period; (c) reconstructed PDSIP8C5 since 1673 (gray curve) and its 11-year moving average (dark black curve).
Forests 14 02127 g004
Figure 5. Spatial correlation between the reconstructed/actual PDSIP8C5 and CRU scPDSI TS 4.05 (a,b) and CRU TS 4.03 Precipitation (c,d) during 1960–2018. The black triangle represents the sampling site.
Forests 14 02127 g005
Figure 6. Comparisons between (b) the reconstructed PDSI in this study (1673–2018) and (a) the CRU scPDSI TS 4.05 (1901–2018), (c) the reconstructed September–March PDSI in the Aksu area (1466–2013) [41], (d) the reconstructed April–June PDSI for the central Tianshan Mountains (1794–2002) [46]. All gray lines represent the original series, the dotted gray lines represent the mean value of sequences, and black lines are the 11-year moving average series. Green and gray bands mark the wet and dry periods.
Forests 14 02127 g006
Figure 7. MTM spectral analysis of the reconstructed PDSIP8C5.
Forests 14 02127 g007
Figure 8. Comparison between the reconstructed PDSIP8C5 (black line) and sunspots (red line). The thin line represents the original series, and the heavy line shows an 11-year moving average curve.
Forests 14 02127 g008
Figure 9. Spatial correlation between reconstructed PDSI and August–May HadISST1 (1960–2018).
Forests 14 02127 g009
Figure 10. Comparisons between (a) our reconstructed PDSI and (b) the reconstructed winter NAO index (1673–1983) [65], (c) the reconstructed winter NAO index (1821–2000) [67], and (d) the AMO index (1874–2018) [70]. All gray lines represent the original series, the dotted gray lines represent the mean value of sequences, and black lines depict the 11-year moving average series. Light green and gray bands mark the wet and dry periods.
Forests 14 02127 g010
Table 1. Statistical characteristics of the STD chronology.
Mean Sensitivity (MS)0.132
Standard deviation (SD)0.181
First-order autocorrelation (AR1)0.63
SSS > 0.851673–2018
Mean correlation among all series (r1)0.366
Mean correlation between trees (r2)0.328
Mean correlation within trees (r3)0.510
Expressed population signal (EPS)0.897
Signal-to-noise ratio (SNR)8.663
Table 2. Verification results from Bootstrap and Jackknife methods.
Statistical ItemsJackknifeBootstrap (100 Iterations)
Mean (Range)Mean (Range)
r0.61 (0.58–0.66)0.62 (0.36–0.76)
R20.38 (0.33–0.43)0.38 (0.08–0.65)
R2adj0.37 (0.32–0.42)0.37 (0.06–0.64)
SE1.33 (1.24–1.34)1.29 (0.99–1.61)
F33.29 (27.57–42.02)36.81 (4.96–104.33)
p5 × 10–7 (3 × 10⁻⁸–3 × 10⁻⁶)4 × 10⁻⁴ (2 × 10⁻¹⁴–3 × 10⁻²)
D/W0.99 (0.8–1.08)1.98 (1.41–2.65)
Table 3. List of wet and dry periods.
No.Dry PeriodDuration (Years)Wet PeriodDuration (Years)
11685–1712281678–16847
21758–1790331713–172715
31818–1834171730–175728
41849–1861131791–181727
51911–1925151835–184814
61940–1951121862–191049
71953–1992401926–193914
8 1993–201321
Disclaimer/Publisher’s Note: The statements, opinions and data contained in all publications are solely those of the individual author(s) and contributor(s) and not of MDPI and/or the editor(s). MDPI and/or the editor(s) disclaim responsibility for any injury to people or property resulting from any ideas, methods, instructions or products referred to in the content.

