Article

Aerial Imaging-Based Fuel Information Acquisition for Wildfire Research in Northeastern South Korea

1
Mechanical Engineering, Korea University, Seongbuk-gu, Seoul 02841, Republic of Korea
2
National Institute of Forest Science, Dongdaemun-gu, Seoul 02455, Republic of Korea
3
Department of Forest Science, Andong National University, Andong 36729, Gyeongsangbuk-do, Republic of Korea
*
Author to whom correspondence should be addressed.
Forests 2023, 14(11), 2126; https://doi.org/10.3390/f14112126
Submission received: 7 October 2023 / Revised: 16 October 2023 / Accepted: 23 October 2023 / Published: 25 October 2023
(This article belongs to the Section Forest Inventory, Modeling and Remote Sensing)

Abstract

:
Tree detection and fuel amount and distribution estimation are crucial for the investigation and risk assessment of wildfires. The demand for risk assessment is increasing due to the escalating severity of wildfires. A quick and cost-effective method is required to mitigate foreseeable disasters. In this study, a method for tree detection and fuel amount and distribution prediction using aerial images was proposed for a low-cost and efficient acquisition of fuel information. Three-dimensional (3D) fuel information (height) from light detection and ranging (LiDAR) was matched to two-dimensional (2D) fuel information (crown width) from aerial photographs to establish a statistical prediction model in northeastern South Korea. Quantile regression for 0.05, 0.5, and 0.95 quantiles was performed. Subsequently, an allometric tree model was used to predict the diameter at the breast height. The performance of the prediction model was validated using physically measured data by laser distance meter triangulation and direct measurement from a field survey. The predicted quantile, 0.5, was adequately matched to the measured quantile, 0.5, and most of the measured values lied within the predicted quantiles, 0.05 and 0.95. Therefore, in the developed prediction model, only 2D images were required to predict a few of the 3D fuel details. The proposed method can significantly reduce the cost and duration of data acquisition for the investigation and risk assessment of wildfires.

1. Introduction

The severity of wildfires, such as the 2019–2020 Australian bushfires and the 2018–2020 California wildfires, has significantly increased worldwide owing to climate change [1,2,3]. In the Republic of Korea, historically severe wildfires were recorded in 2019 and 2022 [4]. Severe wildfires cause environmental, ecological, and societal damage. Wildfires have affected residences and facilities near the wildland–urban interface (WUI) owing to increased anthropological activity in this vicinity. The impact of wildfires in human society has significantly increased and necessitated the investigation and assessment of WUI fires and associated risks to inform mitigation measures [5,6].
Numerous efforts have been undertaken to assess fire dynamics at the WUI [7,8]; laboratory- and field-scale experimental and computational studies have been conducted [9,10,11,12,13]. However, large-scale wildfire experiments are resource-intensive. Therefore, the numerical approach has been widely used for large field-scale investigations of wildfires. For example, Mell et al. developed a physics-based simulation model for a WUI fire called the Wildland–Urban Interface Fire Dynamics Simulator (WFDS), based on the Fire Dynamics Simulator (FDS) developed by the National Institute of Standards and Technology (NIST) in the United States. Various WUI fire scenarios can be simulated using the WFDS [14]. Various wildfire risk assessment methods [15,16,17] rely heavily on geometrical, meteorological, and ecological information [18,19,20].
Fuel information must be acquired for both investigation and risk assessment of wildfires. Therefore, detecting vegetation and estimating the amount and distribution of fuel are necessary. One of the simplest ways of measuring fuel information is conducting a field survey [21]. However, field surveys are labor- and time-intensive. Therefore, remote sensing has been used to effectively gather fuel information [22,23,24]. Multispectral and hyperspectral images from satellites [25,26,27] and light detection and ranging (LiDAR), which can gather relatively detailed three-dimensional fuel information with reasonable spatial resolution, are remote-sensing methods commonly used for fuel detection over vast areas. LiDAR data are processed using a digital elevation model (DEM) and canopy height model (CHM) to estimate fuel information [28,29,30].
In South Korea, several rural communities and heritage sites are located at the wildland and thereby exposed to the threat of wildfires. Similar situations have been observed in many other countries. Local-scale risk assessment and mitigation are necessary, and gathering detailed fuel information near rural communities and heritage sites is crucial for risk assessment, for which LiDAR is a promising approach. However, gathering fuel information using LiDAR is considerably resource- and time-intensive, creating the need for the development of low-cost and efficient methods for utilizing LiDAR data. Therefore, this study proposes the use of aerial photographs (RGB images) captured by an unmanned aerial vehicle (UAV). To collect fuel information from aerial photographs, algorithms such as watershed segmentation and edge detection were applied for tree detection [31]. These conventional algorithms provide sufficient performance for rough estimations. However, accurate prediction using these conventional algorithms has been challenging. Recently, machine learning-based techniques for tree detection have shown better detection performance than conventional algorithms. Specifically, these machine learning approaches provide more precise and accurate prediction of crown shapes in RGB images [32].
UAV image tree detection was performed using a typical commercial camera, and the image collection time was relatively shorter than that of LiDAR. The captured images were used to generate an orthophoto. A mask recursive convolutional neural network (R-CNN), which is one of the effective machine-learning image segmentation networks, was introduced to detect trees and predict crown width (CW) as representative fuel metrics. Additionally, tree height (TH) for modeling was collected with UAV aerial LiDAR. For the validation process, TH and diameter of breast height (DBH) were collected in a field survey using laser triangulation and direct measurement. The correlation between CW from the orthophoto to TH from the LiDAR was established to match the two- and three-dimensional information utilizing a statistical tree allometric model providing a reasonable uncertainty. After the model was established, only RGB images were required to acquire fuel information, at least for the modeled vegetation species. The synergistic impact of precise CW estimation based on machine learning-based tree detection and the reasonable prediction from a statistical model using LiDAR data allowed for rapid and accurate estimation of fuel information, consequently reducing the cost and duration of fuel measurements.

2. Materials and Methods

The overall process for estimating the fuel amount and distribution is depicted in Figure 1. For fuel distribution predictions, a UAV captured aerial images that were preprocessed for fuel detection algorithms. Consequently, the fuel dimension correlations between the aerial RGB and LiDAR images were established. The dimensions estimated only using 2D RGB images based on dimension correlations were then compared with the values obtained by physical measurements. Details on each step are provided in the subsequent subsections.

2.1. Test Site and Data Collection
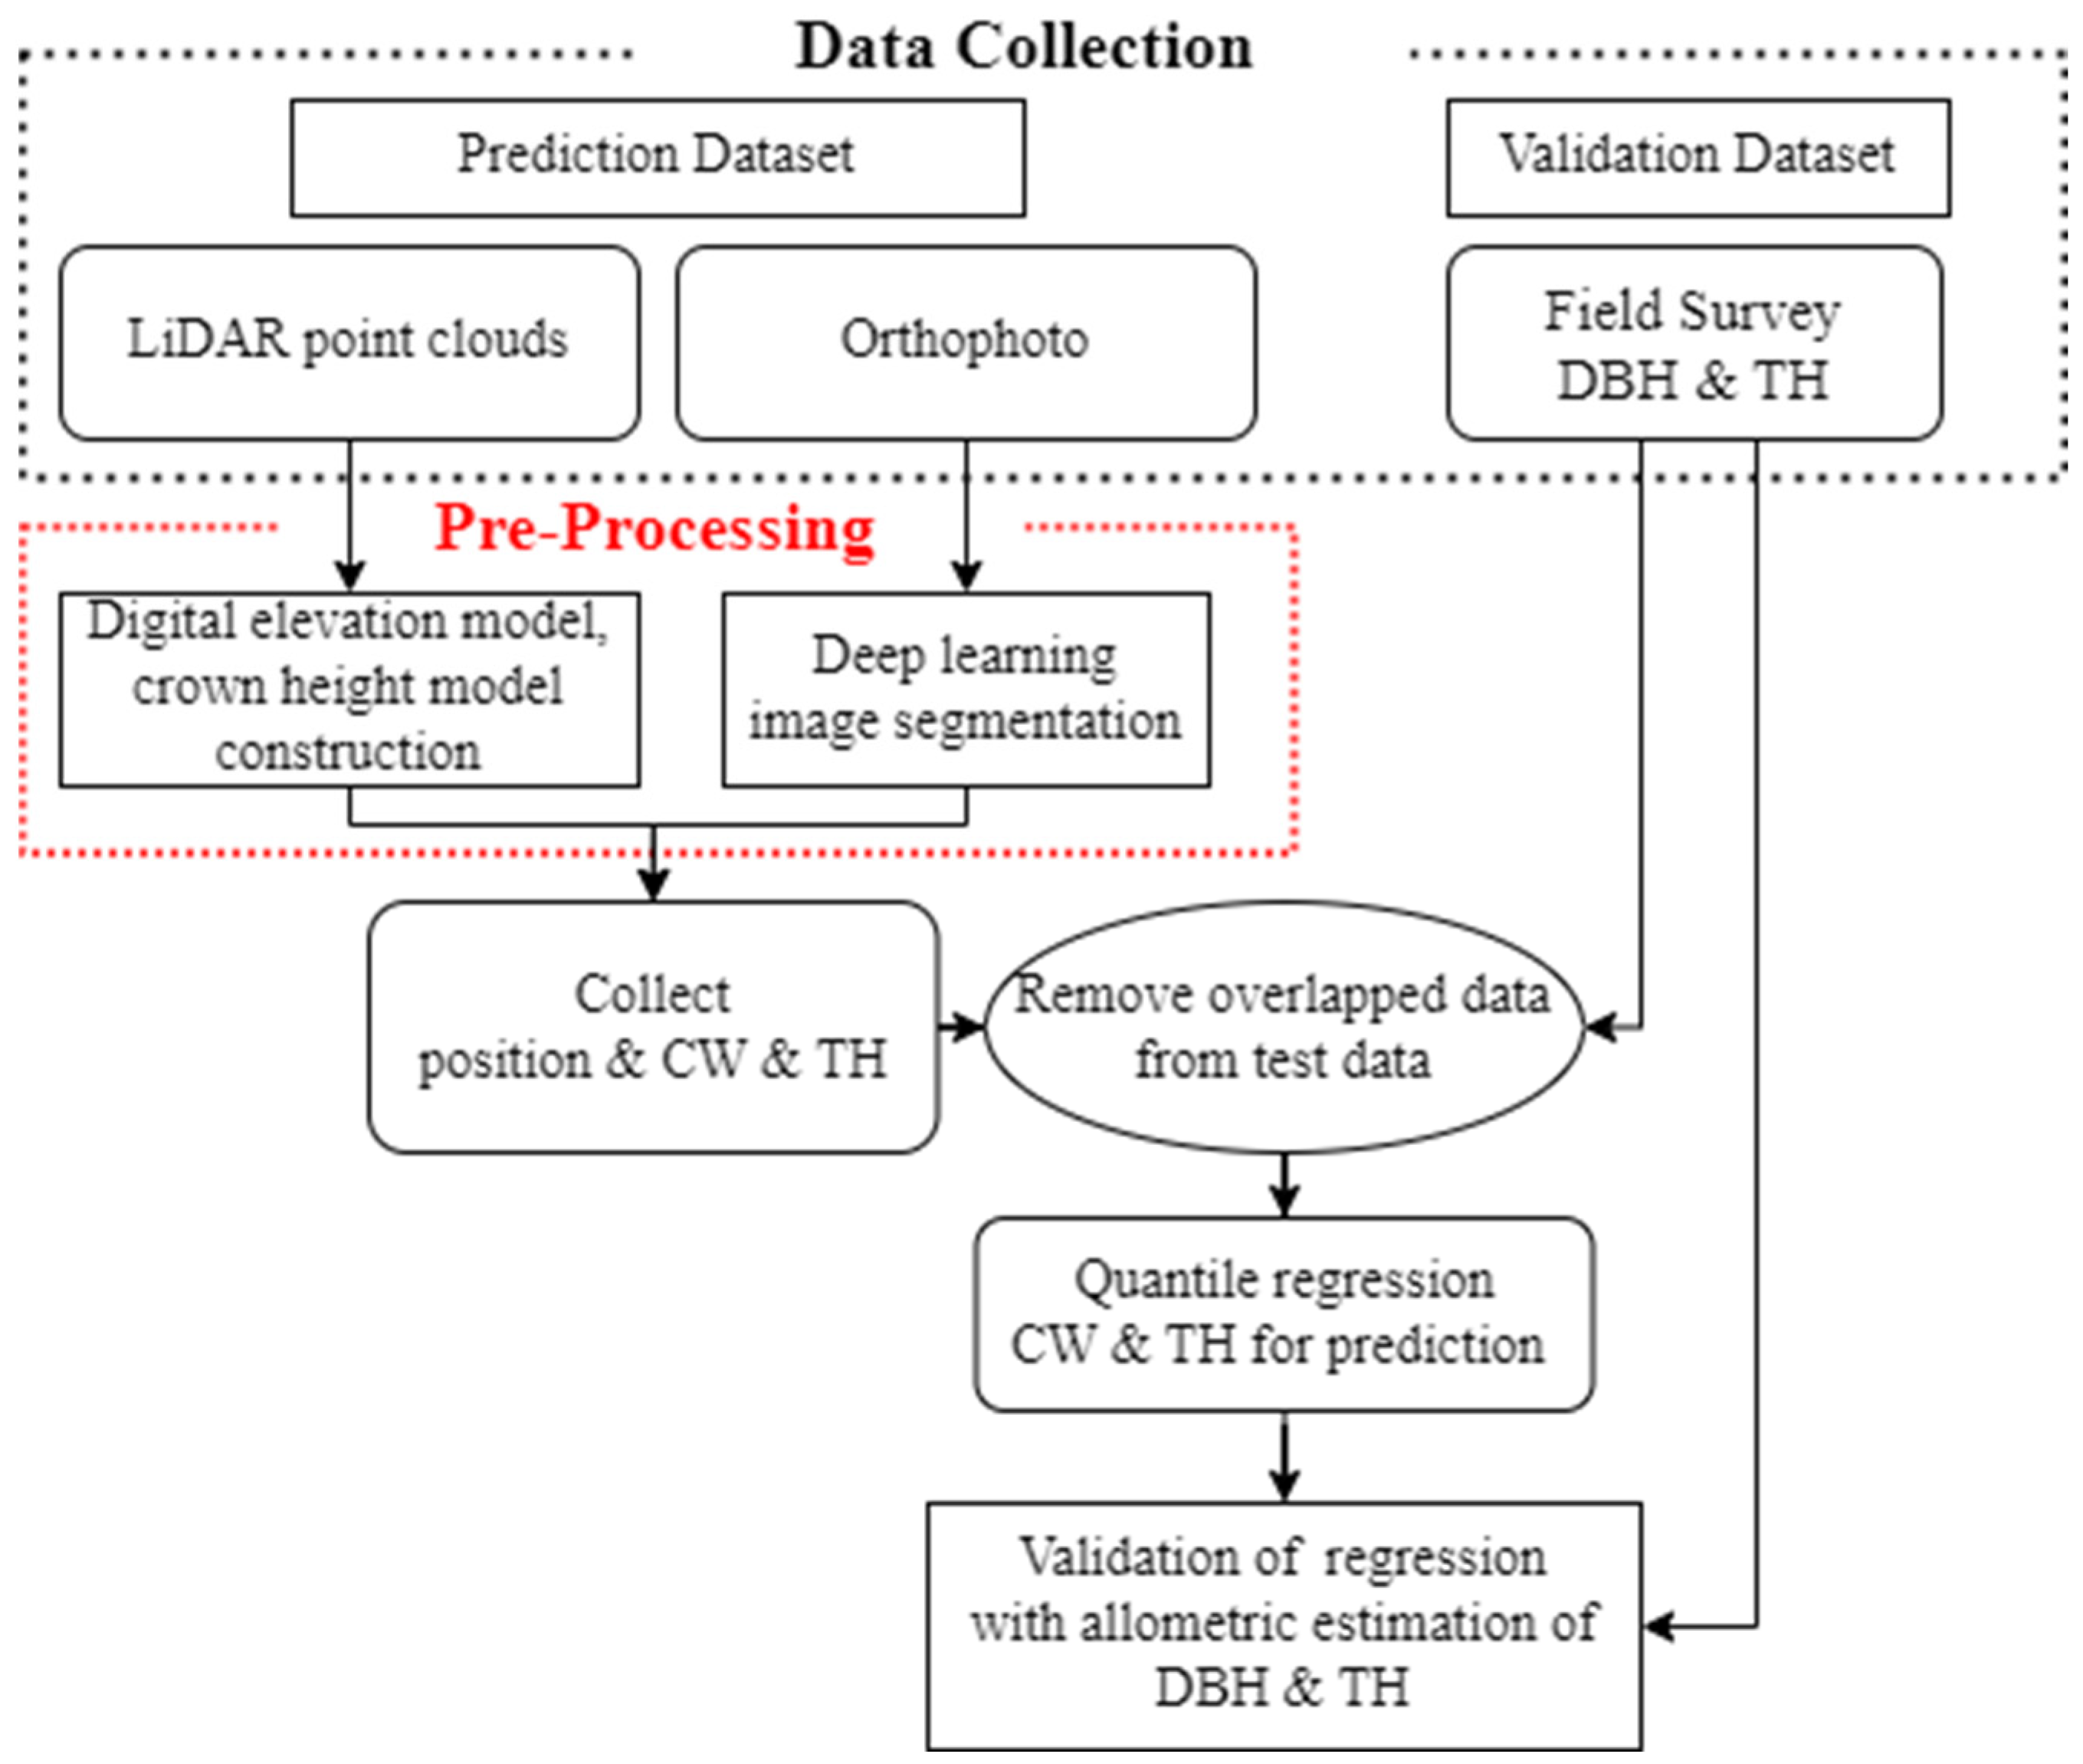
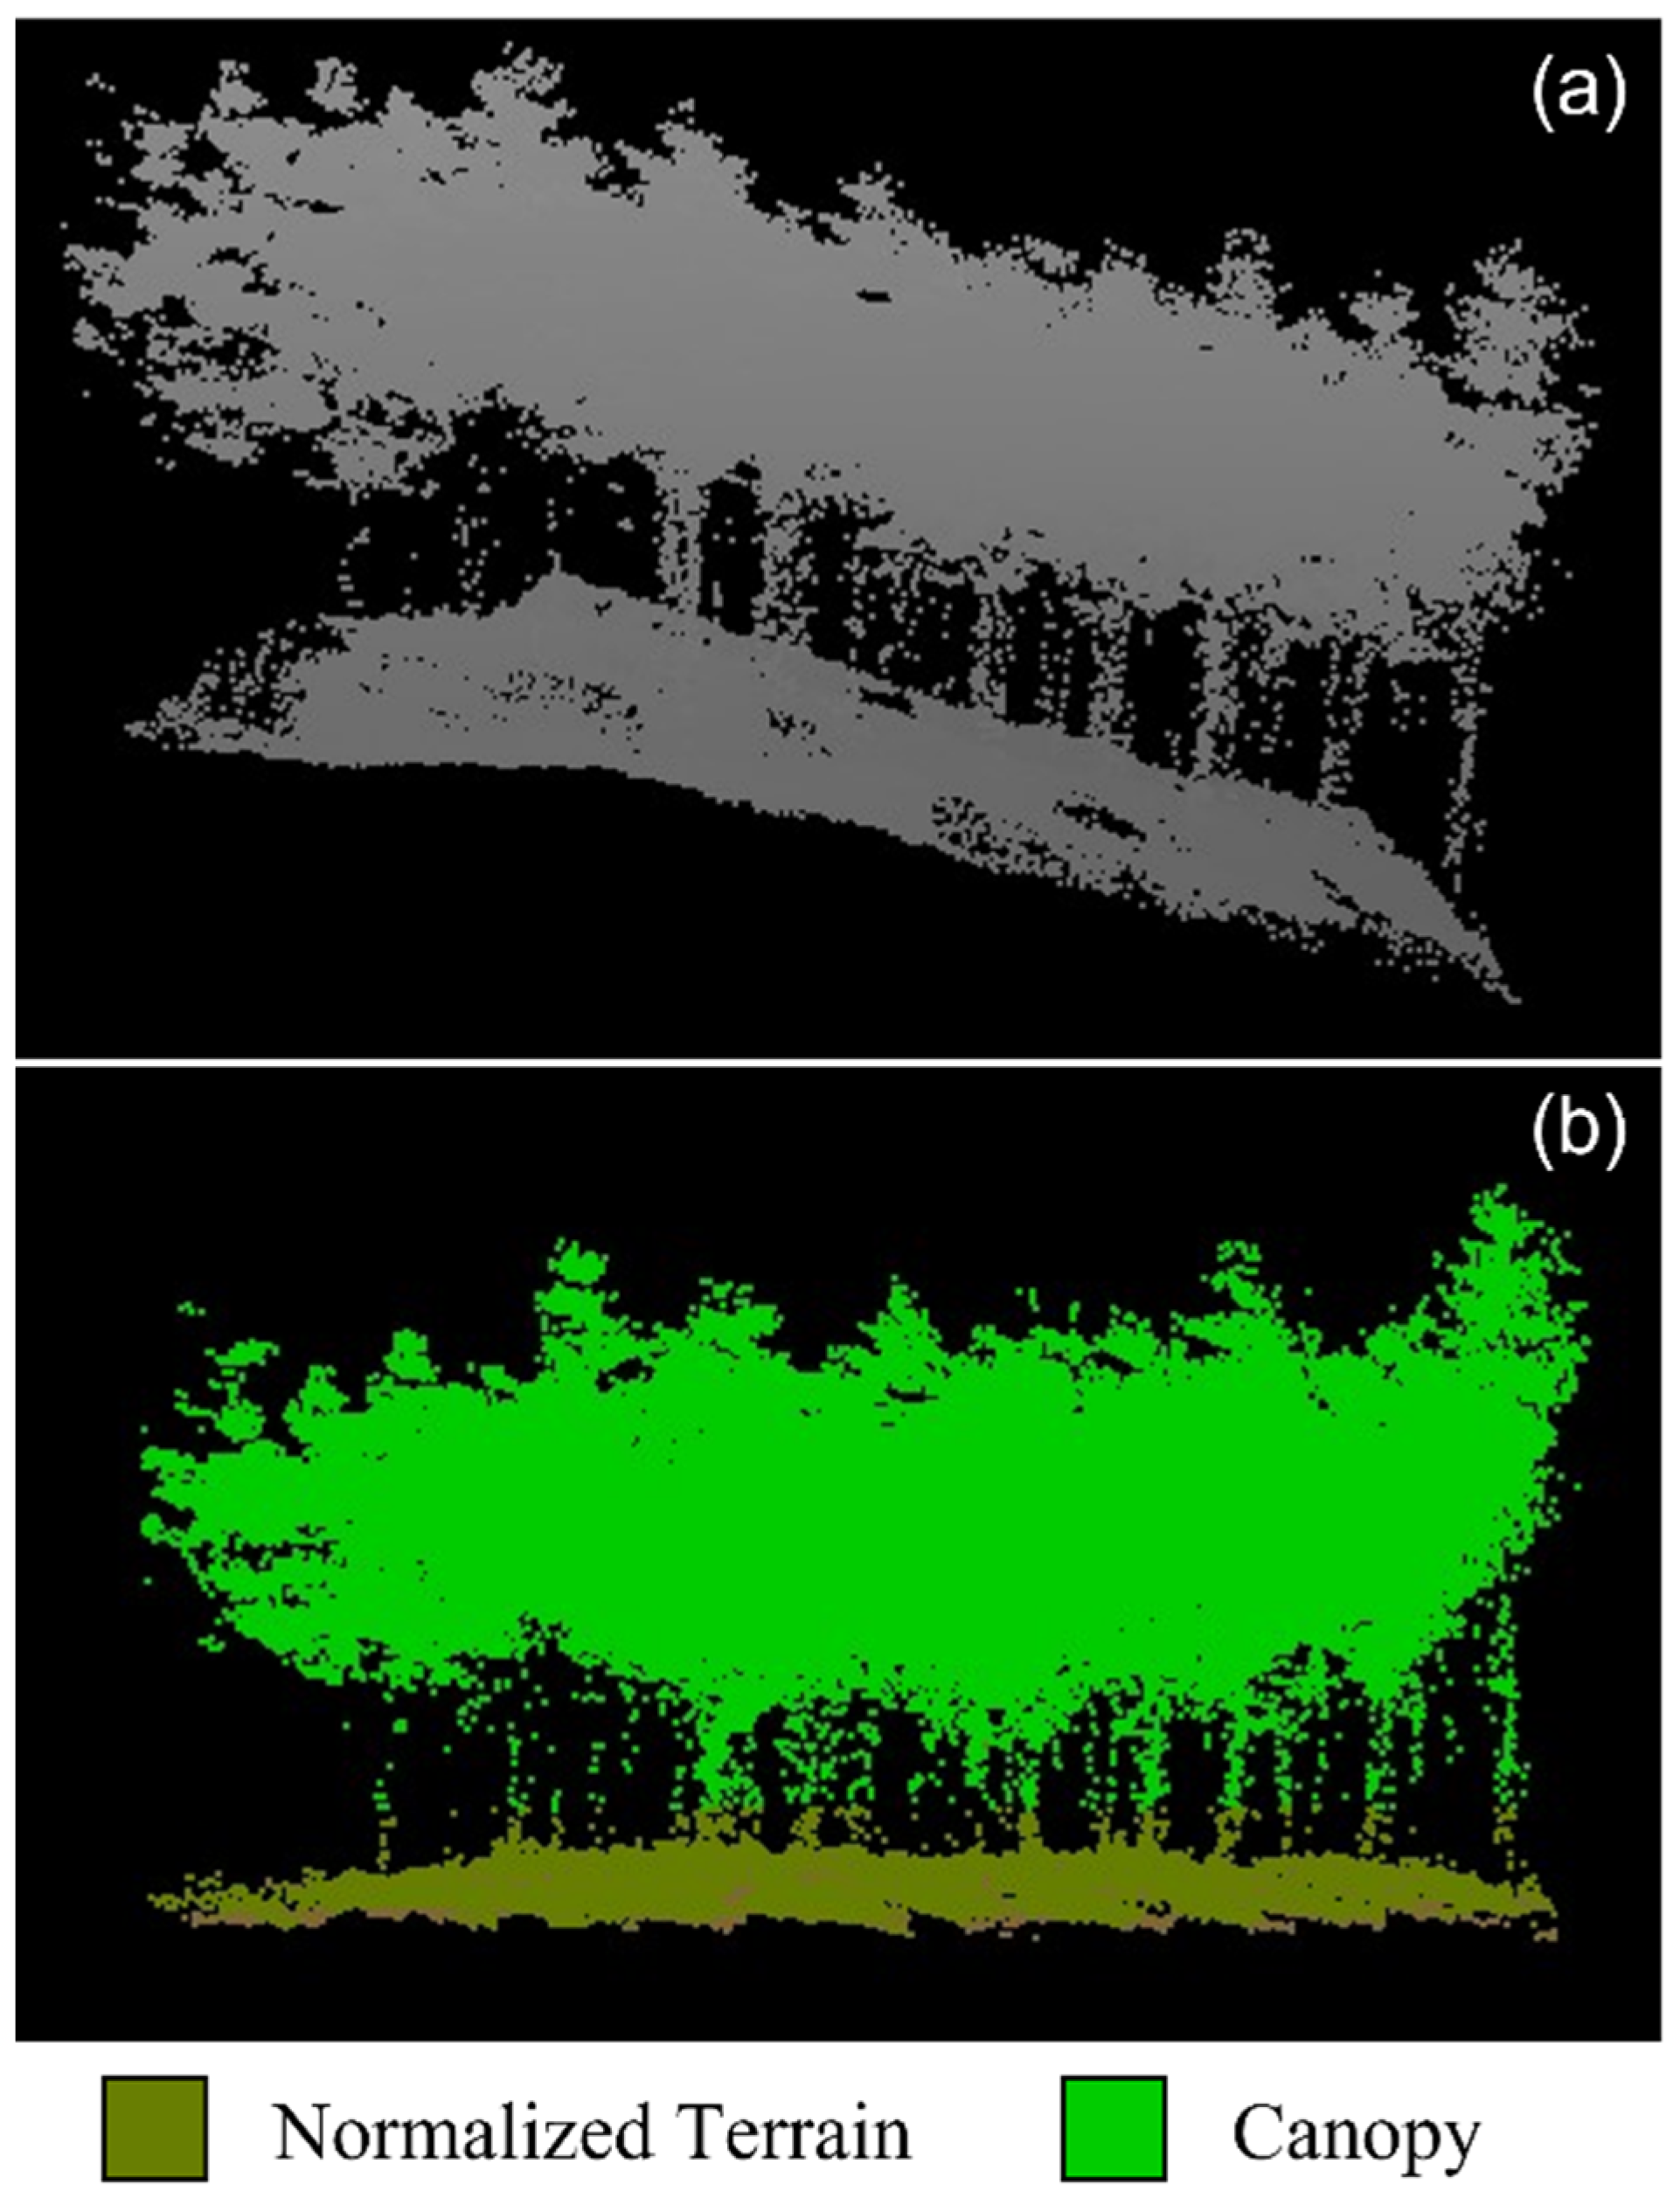
An orthophoto of the test site, located in Goseong-gun, Gangwon-do, South Korea, (N38.31105°, E128.48861°) is depicted in Figure 2. The area of interest within the test site was approximately 220 × 200 m, as indicated by the dashed red box in Figure 1. The site was a damaged area affected by the 2019 Goseong-gun fire, one of the largest wildfires in South Korea. The burnt area was approximately 1300 ha, and multiple casualties were reported. The site was recovered and designed to grow Pinus densiflora after the wildfire for various fuel densities because P. densiflora is the primary species for wildfire spread in South Korea. This test site is supposed to deliver the fuel distribution and loading information for various fuel treatment densities (0%, 25%, and 50%), an important variable for a wildfire risk assessment.
A UAV was flown over the test site with constant overlap operation using an RGB camera (Zenmuse L1, DJI, Shenzhen, China) and LiDAR equipment (AVIA, Livox, Wanchai, Hong Kong). The unit length per pixel of the orthophoto captured using the RGB camera was 21.5 mm, and the operating conditions and point clouds of LiDAR had a resolution of 2 cm. The RGB camera captured an aerial view of the test site, and the images captured by the RGB camera were post-processed to construct the orthophoto of the test site as a raster image. LiDAR collects information on the vegetation distribution in the form of three-dimensional point cloud data. The relative positioning of the GPS and ground control points were used to obtain the geographical information of the test site. UTM52N, a reference geographical coordinate system, was used to calculate latitude and longitude. To establish a validation dataset, physical dimensions such as TH and DBH were measured for 476 individual fuels.

2.2. Pre-Processing

For individual tree detection from orthophoto aerial images, a deep-learning image segmentation method, Detectron2 (https://github.com/facebookresearch/detectron2, accessed on 9 August 2023) from Facebook AI Research [33], was used. Detectron2 provides a pre-established network for segmentation and is used for object detection in various research fields [34]. In this study, a mask recursive convolutional neural network (R-CNN) was selected for detection, which is one of most effective networks for instance segmentation [35]. While other networks with slightly higher effectiveness exist, these networks have not been fully validated. Furthermore, the applicability of mask R-CNN was validated for individual tree detection with various tree species by other researchers [36,37]. The trained mask R-CNN model that provided segmented pixel groups of individual trees on the orthophoto was used. For training mask R-CNN, a training dataset was constructed using the cropped regions of the orthophoto; the constructed training area was smaller than 5% of the entire area, and the target loss was set below 0.001. Although the lower target loss has the possibility of overfitting, the interest is confined to local forest and single species. The generalization of detection is less required for fuel prediction in this study. Additionally, data augmentations, such as clipping, flipping and scaling, were applied to the training process to prevent overfitting [38]. An example of the segmentation results is illustrated in Figure 3, which shows the true positive (TP), false positive (FP), and false negative (FN) results. The segmentation performance was evaluated using recall (r), precision (p), and F1-score, which are commonly used performance indicators for object detection, as defined in Equations (1)–(3), respectively.
r = T P T P + F N
p = T P T P + F P  
F 1 = 2 r p   r + p
Each pixel group identified by the mask R-CNN model represented an individual tree crown area. The locations of the trees were estimated using the centroids of the crown areas and marked on the orthophoto. The pixel number was converted to a metric-dimensional unit using geographical information from the orthophoto. The CW of the trees was estimated using the pixel point farthest from the centroid.
LiDAR point clouds provide the three-dimensional distribution of objects but do not classify each point datum; for example, terrain and tree are not distinguishable from the raw data. Therefore, the raw LiDAR point clouds need to be classified. Prior to classification, the raw LiDAR data were pre-processed for the improved accuracy of classification because it may contain false data points owing to laser perturbation and missing data because of laser blockage. To reduce the number of false points, a method for comparing the spatial mean and standard deviation was used for filtering. Notably, distinguishing all false points is challenging, but identifying false points along the height direction is achievable. When false points exist in the region of interest, the position of the false points in the height direction is in far proximity from the mean height value. The false points typically lie above one standard deviation from the mean value. In this study, the size of the spatial filter for mean–standard deviation comparison was 5 × 5 m. The filter was applied to the entire domain of the LiDAR point clouds to remove false points and prevent data contamination [39].
Missing data points typically occur for terrain information because of the high density of the forest canopy. Therefore, a DEM construction algorithm for terrain prediction was established to alleviate the impact of missing terrain information on fuel distribution estimation. Firstly, the lowest LiDAR anchor points along the height direction within segmented regions, which has the same size of the spatial filter at each location, were collected and grouped with the nearby continuous points. Next, if the grouped points had numerous points over a certain threshold and exhibited an acceptable distribution compared to lowest anchor points, they were assumed to be possible terrain point cloud groups. For points where these groups exist, the basis of DEM could be constructed. Subsequently, the missing terrain points were reconstructed using interpolation and median filtering. The weights for interpolation were determined based on the gradient of nearby data points and distance from possible terrain points. Finally, DEM was applied to distinguish terrain on LiDAR points clouds. The raw and pre-processed LiDAR point clouds are shown in Figure 4. Using the constructed terrain information, the canopy height can be estimated for the regions of interest. The LiDAR point cloud domain was matched to the orthophoto to map the two-dimensional information onto three-dimensional information. Subsequently, TH was obtained by applying the CHM to the tree locations marked on the orthophoto.

2.3. Prediction and Validation

The pre-processed RGB images and LiDAR point clouds were used to establish a fuel geometry prediction model. A tree allometric approach was utilized based on the Huxley relative growth equation, Y = a X B [40], where X and Y are quantitative dimensions of the tree, such as crown width and tree height. Occasionally, the relative growth equation was used in logarithmic form: ln Y = A + B ln X . Parameter B is associated with the ratio of the specific growth rates of X and Y, while parameter A does not have a biological implication. For the prediction model, quantile regression was used, which was robust based on the outliers and provided the distribution of variables [41]. In the current study, the 5%, 50%, and 95% quantiles were used for regression to represent the upper and lower boundaries of tree allometry to provide uncertainty of prediction within a statistical approach. For fuel geometry prediction, only aerial RGB images were used with the established relative growth equation. Therefore, with the detected CW from the RGB images, TH was predicted. The predicted TH was then used to estimate DBH, a representative factor describing the approximate age class of the forest. For DBH estimation, the form of the Weibull function for the tree allometric relationship between TH and DBH for Korean P. densiflora was applied, as shown in Equation (4) [42].
T H = 1.2 + 31.510 ( 1 exp ( 0.055   D B H 0.684 ) )  
The estimated TH and DBH from the CW were compared with the measured values to validate the prediction performance. The validation results are discussed in the subsequent sections.

3. Results

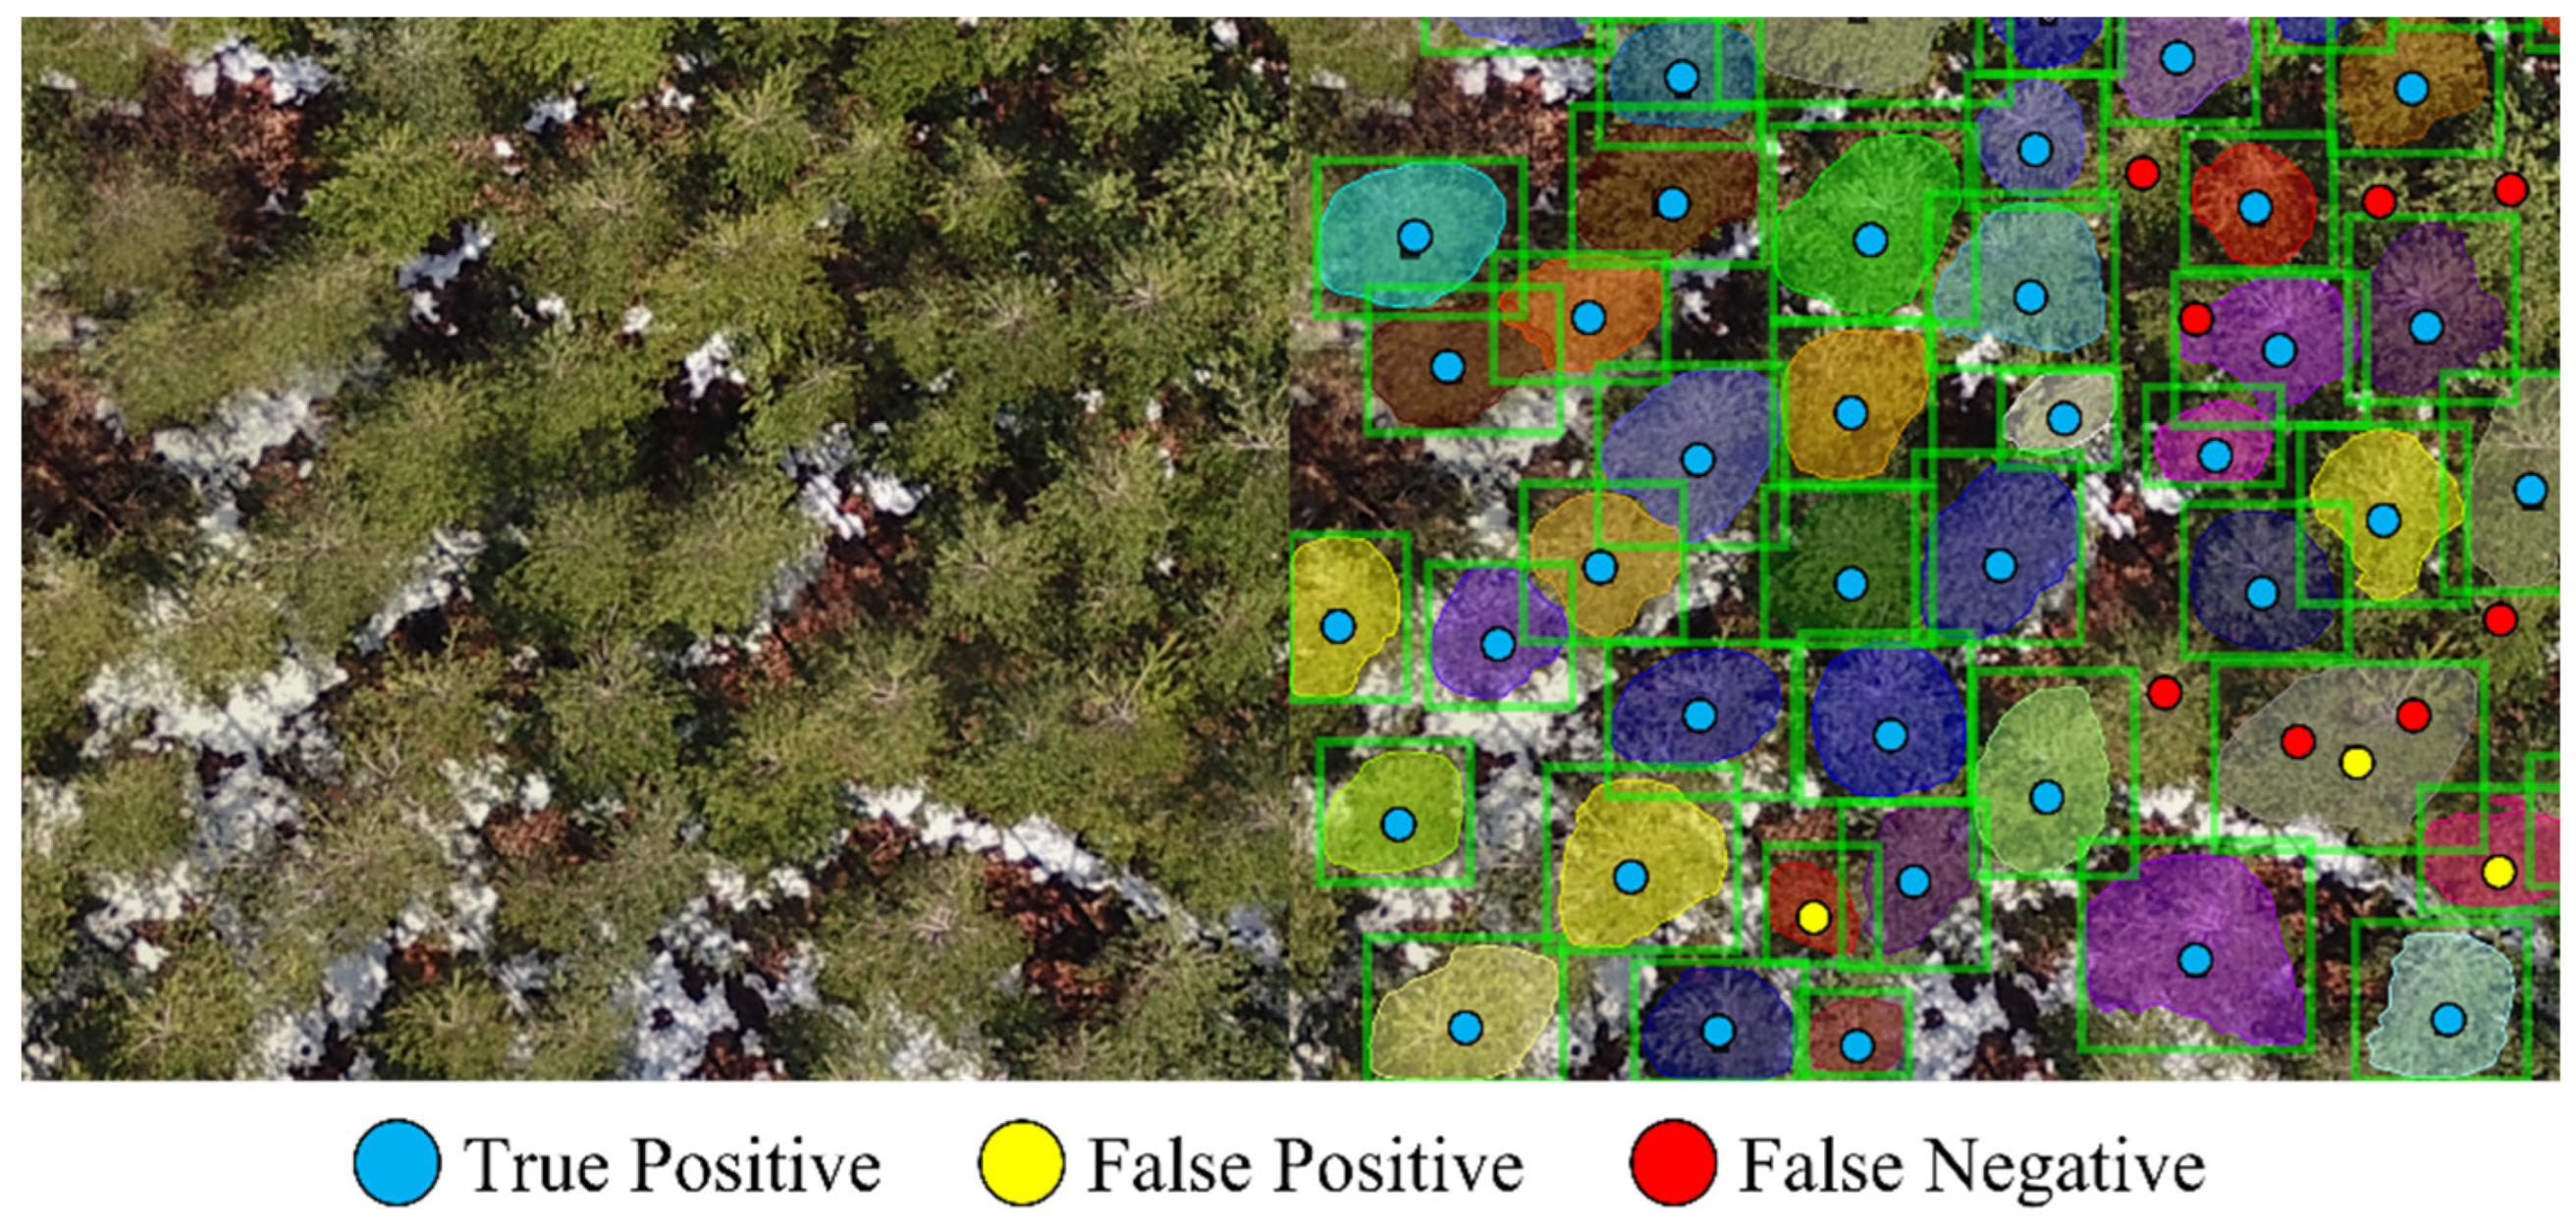
3.1. Tree Detection and Data Collection

The performance of the trained mask R-CNN model for tree detection was assessed using r, p, and F1-score. The average F1-score was 0.775, and the average r and p values were approximately 0.8 and 0.785, respectively. Reasonably acceptable detection model performance was observed for a relatively dense canopy area, whereas a thin canopy area resulted in poor performance. Fortunately, most false detections showed a relatively small CW, below 1 m, and falsely detected data could be removed by applying a spatial filter, after which the total number of detected trees was 3102. The locations of the detected trees in the orthophoto were compared with the locations of the measured trees during a field survey using GPS values, and 236 trees were matched between the detected and measured results. The matched trees were removed to construct the prediction model and were later used for validation. The remaining detected trees were matched to the LiDAR data, and the CW of each tree was matched to the TH obtained using the CHM. During the matching process, trees near the LiDAR point cloud boundaries were removed because of the considerable amount of information missing near the boundaries. Therefore, the final number of trees used to develop the prediction model was 2709.
Figure 5 shows the TH histograms of the dataset used to establish the prediction model for various CW ranges. Each bin in the histograms has a range of 0.25 m and in each sub-figure, the red dashed line represents the mean TH in the CW range. The mean value of TH monotonically increased as CW increased. Because the TH distributions appeared to approach normal distributions, using the mean and standard deviation values for statistical predictions was reasonable.

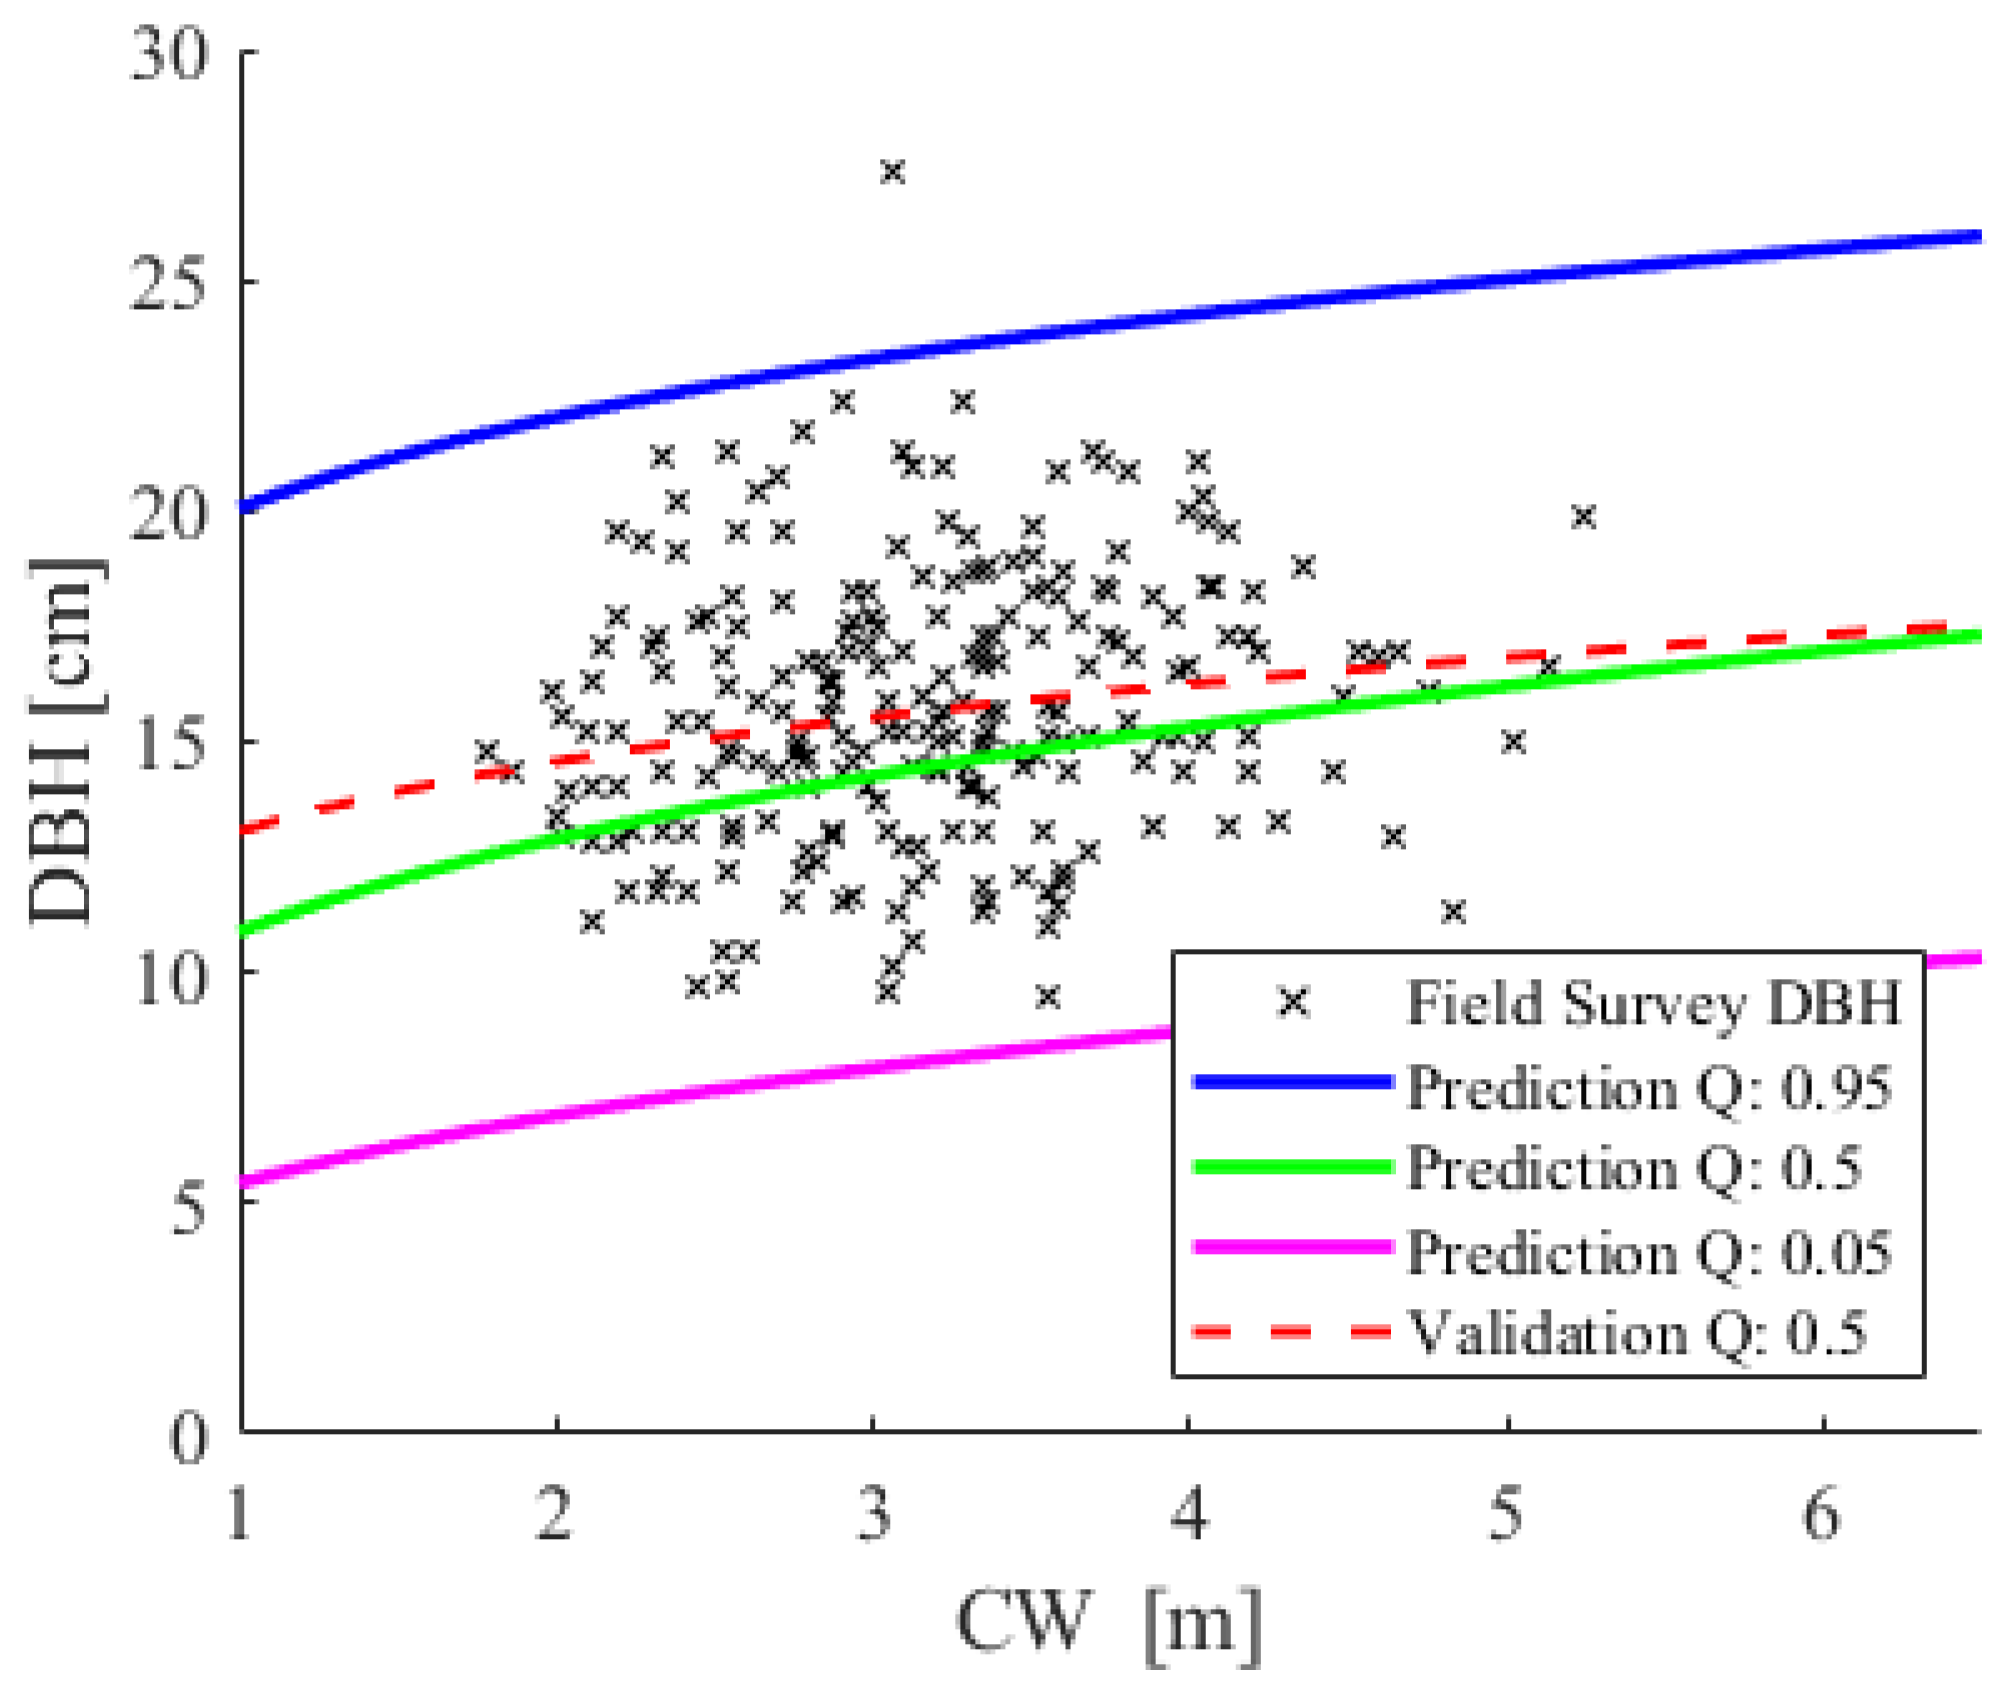
3.2. Statistical Prediction Model

For the statistical prediction model, quantile regression of TH on CW was conducted based on the allometric tree model with Huxley’s relative growth function in logarithmic form, ln T H = A + B ln C W . Quantiles of 0.05, 0.5, and 0.95 were obtained, and the results are summarized in Table 1. The p-values for both coefficients and constants were below 0.001, demonstrating the validity of the quantile regression. Notably, a lower value of B was calculated for the 0.95 quantile compared to the value of B at quantiles 0.05 and 0.5, indicating that the estimation of TH at the 0.95 quantile could not reflect a TH increment relative to increasing CW.
Estimated TH values for the detected CW and quantile regression lines are depicted in Figure 6a. The 0.05 and 0.95 quantiles are the estimated boundaries for the tree allometric prediction. As analyzed, the line of the 0.95 quantile was relatively flatter compared to others. Their margins relative to the median (quantile 0.5) were within 2 m, which was an acceptable range considering the uncertainties in the measurements. Figure 6b illustrates the LiDAR-measured TH for validation. As expected, most validation data tress fell within the 0.05 and 0.95 quantiles.

3.3. Tree Allometric Prediction

The 0.05, 0.5, and 0.95 quantile lines for DBH were acquired from the predicted TH values using the TH–DBH relationship equation. The prediction results and measured DBH values are plotted in Figure 7 as functions of CW. Most of the measured DBH values lie within the predicted 0.05 and 0.95 quantiles. In addition, the predicted 0.5 quantile line is consistent with the 0.5 quantiles from the measured DBH. Therefore, the developed statistical prediction model was applicable for TH and DBH prediction with the estimated CW by the aerial images.

3.4. Simulation with Predicted Fuel Information

To discuss applicability for wildfire research, the predicted fuel information using the proposed method was used for WFDS calculations as an example of application. The simulated domain was a fraction of the entire test site and covered an area of 30 × 20 m, and LiDAR point cloud data for the area is shown in Figure 8a. LiDAR-detected solid surfaces were classified into terrain and fuel, and the fuel mass information for the detected fuel volume was implemented into WFDS (Figure 8b) using the crown bulk density of Korean P. densiflora considering the forest age class. The fuel information predicted using the proposed model was also expressed in a WFDS calculation domain (Figure 8c). An ellipsoid tree shape was assumed, and fuel mass was obtained using the allometric prediction and vertical tree distribution of Korean P. densiflora [43]. In Figure 8, orthophoto-based fuels in the WFDS calculation domain had lower crown base height and were located closer to the base height compared to LiDAR-based fuels. For both cases, the same surface fuel was assumed. Line ignition on the surface fuel was applied where 3 m/s wind entered the calculation domain. The average slope of terrain was 18°. To minimize the effect of mesh size, fine mesh criteria were followed according to a reference guide [44]. The mesh size for the simulation was 0.2 m.
Both cases had similar crown fire transition locations. The fire spread rate and strength were also similar to each other as the total heat release rate (HRR) and dry fuel mass loss rate (MLR) were similar between the two cases, as depicted in Figure 9. Initially, flat rates were observed because of a constant ignition source before the surface fire ignited. Subsequently, surface fire was initiated and intensified until it was self-sustaining. Afterward, it was detached from the ignition source and moved forward for approximately 30 s in simulation time. Simultaneously, the crown fuel was heated and partially combusted. At approximately 45 s, HRR fluctuation increased owing to the ignition of the crown fire. Finally, stable MLR was observed after 50 s, indicating that the crown fire was fully developed. Notably, MLR increased after 65 s owing to the numerical instability caused by the interference of mesh boundaries. Based on the results, we confirmed the validity of the predicted fuel information for simulation as LiDAR-based data.
Figure 10 provides a visualization of the simulation results at key moments, including the surface fire, the transition to a crown fire, and a fully developed crown fire. Fuel is not displayed to ensure clear visibility of the flame shape. During the surface fire phase, flames leaned towards the ground and had a wide fire front influenced by the wind. Subsequently, an unstable crown fire, similar to a shooting flame, was occasionally observed. Consequently, the crown fire was fully developed. Notably, surface fires in both cases were similar because terrain and fuel conditions were the same compared to the crown fuel information. The visualized comparison showed that the fire exhibited similar behavior.

4. Discussion

4.1. Machine Learning-Based Individual Tree Detection

To evaluate the effectiveness of mask R-CNN for individual tree detection in this study, the performance was compared to that from previous research [45,46,47,48,49]. Considering the widely accepted performance metric, the F1 score, the highest score of machine learning-based methods was 0.95, which exceeded the highest scores reported in a recent study utilizing traditional methods. Furthermore, the lowest scores obtained through machine learning-based and traditional methods were >0.7 and approximately 0.4, respectively. Although machine learning-based methods exhibited remarkable performance, the performance of individual tree detection could be influenced by multiple factors, including tree species and data quality [50]. Therefore, the average F1 score obtained in this study (0.775) was reasonable and fell within the range of F1 scores achieved from other studies utilizing machine learning-based methods.

4.2. TH Predictions Using Combined Data from UAV Images and Aerial LiDAR

Compared to the proposed methods, TH prediction using either UAV images or aerial LiDAR alone had limitations. For TH prediction using UAV images, an additional CHM was necessary to determine TH. If a CHM in the area of interest is not established, a CHM should be established with structure from motion. The processing time and workload of establishing a CHM from UAV imagery are high. Moreover, multispectral images were required to achieve high performance for tree detection [48]. On the other hand, aerial LiDAR allowed for light computation on CHM construction using point clouds, but the horizontal information was less precise compared to that from UAV images [51]. As a result, tree segmentation was not accurate for determining CW. Additionally, the covered area of aerial LiDAR was smaller than that of UAV images.
The proposed method was based on a combined approach of using UAV images and aerial LiDAR. Therefore, it did not require a pre-established CHM and high computational resources. Additionally, the estimated CW was more reliable than in LiDAR-based estimation. Consequently, a more rapid and cost-effective estimation of fuel information was enabled with the statistical prediction model for TH prediction.

4.3. Uncertainties of Measurements and Predictions

In this study, we collected data using field-survey and remote-sensing techniques, including aerial LiDAR and photography. Uncertainties were inevitable in the measurements and calculation process; for example, the uncertainty of CW estimation should be considered. The performance of machine learning-based tree detection was reasonable for detecting tree position, but the estimation of the tree shape on an orthophoto was still imperfect. Therefore, we estimated CW based on the equivalent diameter of estimated tree envelopes. Although this approach was suitable for acquiring the tendency of CW, the uncertainty of the calculation process was unavoidable.
Similarly, even the data collection process was conducted carefully to minimize uncertainty caused by measurement procedures; the differences between field survey results and remote sensing were observed. As depicted in Figure 11a, the measured TH from a field survey and the TH obtained from the LiDAR point clouds were comparatively analyzed. To facilitate this comparison, the differences were normalized with respect to the TH values acquired through the field survey. The results showed that the mean LiDAR-measured TH represented an overestimation of approximately 13%, and 80% of the LiDAR-measured TH was within 20% of the field-surveyed TH error. This discrepancy was inevitable because of the uncertainties in both field-survey and remote-sensing processes.
During the field survey, TH measurement was conducted by triangulation from the ground using a laser distance meter. This method, while effective in the field, is limited in precisely identifying the highest point of trees from a surface. Moreover, the identified point could be distorted due to variation in the observation position. Consequently, with the triangulation using a laser distance meter, the typical measurement error is several meters. Additionally, LiDAR measurements exhibit uncertainty. According to the manufacturer’s specification, errors ideally fall within a few centimeters. However, climatic conditions influence the uncertainty of LiDAR equipment. Considering the mean TH, which was approximately 10 m, approximately 20% uncertainty was anticipated for TH.
Figure 11b shows the relative error histogram of the predicted TH with respect to the field-surveyed TH. The distribution of the relative error was similar to that of the normalized difference between the LiDAR-measured and field-surveyed TH. The predicted TH was within the anticipated range of measurement uncertainty. Therefore, the quantile regression yielded TH prediction with acceptable margins.

4.4. Alternative Prediction Model

Although the quantile regression result was acceptable compared to the uncertainty of the procedure, a wide range of prediction was induced by the distribution of tree growth. Analysis results showed that TH distribution closely matched the normal distribution within the most frequently observed range of CW (2–4 m). Therefore, we employed quantile regression to establish a prediction model and expected that the model would provide accurate prediction boundaries. However, margins might become less accurate beyond the observed region due to the sensitivity of margins of quantile regression to the sample size. It explained the inappropriate shrinkage of margins in larger CW regions where the sample size was limited.
To improve the prediction model, we examined alternative regression methods, and one of these methods yielded remarkable outcomes. Bayesian regression is a probabilistic approach grounded in the Bayes’ theorem of probability [52]. Typically, the analytic calculation of Bayesian regression is impractical for multiple parameters. Therefore, Bayesian regression utilizes arbitrarily selected parameters within a pre-defined distribution and derives approximate results through Bayes’ theorem [53]. Bayesian regression is particularly valuable for predicting accurate probabilistic distributions based on a limited number of samples. The results of Bayesian regression are depicted in Figure 12. Compared to quantile regression, the mean prediction and lower boundary of 95% prediction were similar to the 0.5 and 0.05 quantiles, respectively. However, the upper boundary of 95% prediction was significantly different. Although Bayesian regression is more suitable than quantile regression for the probabilistic aspect, the uncertainty of approximative results should be noted. Therefore, the results of Bayesian regression should be analyzed and evaluated in a further study.

4.5. Applicability for the Wildfire Research

Using the suggested methods, fuel information such as TH and DBH was collected with margins of error. This predicted information could be utilized for a procedure requiring tree metrics; for example, constructing a tree inventory. Furthermore, the current study showed that the expensive and time-consuming LiDAR data collection can be applied to a fraction of the entire area to develop a prediction model, and low-cost and efficient UAV RGB imaging can gather useable information from the remaining areas for prediction. The predicted results can then be used for wildfire research such as wildfire risk assessment. For further elucidation, we conducted a three-dimensional wildfire simulation as an illustrative example of applying predicted fuel information in risk assessment.
The simulation utilizing predicted fuel information exhibited a slight overestimation of fire intensity. However, the results with the predicted fuel were within a reasonable margin based on the fuel consumption rate and flame shapes compared to simulation results with LiDAR-based fuel information. Although the validity of the proposed method is limited to the current study, the proposed method for obtaining fuel information can be reasonably used for WFDS fuel implementation.

4.6. The Limitations Related to Species Dependency

Based on the results in this study, it seems that using a machine-learning technique was effective for individual tree detection. The allometric relationship between CW obtained from machine-learning detection and LiDAR-measured TH were also established. However, there are notable limitations to the proposed tree information detection technique. The proposed technique must be further validated for various tree species because a single species was used in the current study. Thus, the generalizability of the proposed methods remains uncertain.
In the current study, crown contours were successfully segmented with individual tree detection. Thus, the equivalent diameter of the contour could be adopted to represent CW. On the contrary, improper separation of crown contours may induce inaccuracies in CW determination. Moreover, trees with highly overlapping crowns can create a dense canopy layer that obstructs laser penetration. It leads to a substantial loss of information below the canopy layer with airborne LiDAR point clouds. In such a case, TH measurement becomes unfeasible with LiDAR due to the impossibility of terrain reconstruction. Fortunately, trees characterized by extreme crown overlapping are not present. According to botanical research, tree crowns naturally separate to allow for individual growth spaces [54,55]. However, this phenomenon, known as crown shyness, occasionally occurs on three-dimensional surfaces depending on tree species [56]. The generalizability of our study for various tree species should be assessed through additional research.

5. Conclusions

In this study, a method for tree detection and geometry prediction using UAV images and LiDAR was proposed. Trees in images were properly detected and separated using machine learning-based image segmentation, and the CW of trees were collected. To establish the prediction model, TH were measured from three-dimensional information captured by aerial LiDAR. Additionally, field-surveyed substantial fuel information, TH, and DBH were utilized to validate the prediction model. With quantile regression and Bayesian regression, CW correlated with TH in the statistical approach. The prediction provided reasonable TH value ranges for various CW values considering the measurement uncertainties. Additionally, a tree allometry model was developed to predict DBH for the estimated TH. The validity of the model was confirmed by comparing the predicted DBH quantiles with the measured DBH values. Although the prediction results were limited to the study test site, the current study demonstrates the application of the model. LiDAR data can be collected for a fraction of the area of interest to establish a prediction model, and UAV RGB imaging can be used to collect fuel information (CW) from the remaining areas for TH and DBH prediction. Using this method, the resources and time required for risk assessment data collection can be significantly reduced. The fuel information obtained using the proposed method can be used for fuel amount and distribution estimation and conveyed to WFDS simulations. The results of this study provide cost-effective fuel prediction to assist wildfire research. For example, it will be helpful for rapid risk assessment in extensive rural and forest areas. Nevertheless, there are still remaining challenges related to evaluating the generalizability of the suggested methods. Consequently, its applicability will be analyzed for various tree species and within diverse forest types.

Author Contributions

K.K. developed the analysis method, analyzed and interpreted the fuel data, and wrote the manuscript. Y.-e.L., S.Y.K. and C.G.K. collected, post-processed, and analyzed the fuel data. S.-k.I. secured funding, developed the analytical method, interpreted the fuel data, and wrote the manuscript. All authors have read and agreed to the published version of the manuscript.

Funding

This work, including the study design, data collection, analysis, and interpretation, was supported by the Korea National Institute of Forest Science.

Data Availability Statement

The data presented in this study are available on request from the corresponding author.

Acknowledgments

The authors thank Jieun Kang and Youngjin Jeon for assisting in the development of machine learning-based individual fuel detection algorithms.

Conflicts of Interest

The authors declare no conflict of interest.

References

  1. Doerr, S.H.; Santín, C. Global trends in wildfire and its impacts: Perceptions versus realities in a changing world. Philos. Trans. R. Soc. B Biol. Sci. 2016, 371, 20150345. [Google Scholar] [CrossRef] [PubMed]
  2. Dupuy, J.-l.; Fargeon, H.; Martin-StPaul, N.; Pimont, F.; Ruffault, J.; Guijarro, M.; Hernando, C.; Madrigal, J.; Fernandes, P. Climate change impact on future wildfire danger and activity in southern Europe: A review. Ann. For. Sci. 2020, 77, 35. [Google Scholar] [CrossRef]
  3. Dye, A.W.; Gao, P.; Kim, J.B.; Lei, T.; Riley, K.L.; Yocom, L. High-resolution wildfire simulations reveal complexity of climate change impacts on projected burn probability for Southern California. Fire Ecol. 2023, 19, 20. [Google Scholar] [CrossRef]
  4. Korea Forest Service. 2022 Annual Statistics Report on Wildfire; Korea Forest Service: Daejeon, Republic of Korea, 2023. [Google Scholar]
  5. Kramer, H.A.; Mockrin, M.H.; Alexandre, P.M.; Radeloff, V.C. High wildfire damage in interface communities in California. Int. J. Wildland Fire 2019, 28, 641. [Google Scholar] [CrossRef]
  6. Vacca, P.; Caballero, D.; Pastor, E.; Planas, E. WUI fire risk mitigation in Europe: A performance-based design approach at home-owner level. J. Saf. Sci. Resil. 2020, 1, 97–105. [Google Scholar] [CrossRef]
  7. Manzello, S.L.; Blanchi, R.; Gollner, M.J.; Gorham, D.; McAllister, S.; Pastor, E.; Planas, E.; Reszka, P.; Suzuki, S. Summary of workshop large outdoor fires and the built environment. Fire Saf. J. 2018, 100, 76–92. [Google Scholar] [CrossRef]
  8. Manzello, S.L.; Suzuki, S.; Gollner, M.J.; Fernandez-Pello, A.C. Role of firebrand combustion in large outdoor fire spread. Prog. Energy Combust. Sci. 2020, 76, 100801. [Google Scholar] [CrossRef]
  9. Manzello, S.L.; Cleary, T.G.; Shields, J.R.; Maranghides, A.; Mell, W.; Yang, J.C. Experimental investigation of firebrands: Generation and ignition of fuel beds. Fire Saf. J. 2008, 43, 226–233. [Google Scholar] [CrossRef]
  10. Clements, C.B.; Kochanski, A.K.; Seto, D.; Davis, B.; Camacho, C.; Lareau, N.P.; Contezac, J.; Restaino, J.; Heilman, W.E.; Krueger, S.K.; et al. The FireFlux II experiment: A model-guided field experiment to improve understanding of fire–atmosphere interactions and fire spread. Int. J. Wildland Fire 2019, 28, 308–326. [Google Scholar] [CrossRef]
  11. Frangieh, N.; Accary, G.; Rossi, J.-L.; Morvan, D.; Meradji, S.; Marcelli, T.; Chatelon, F.-J. Fuelbreak effectiveness against wind-driven and plume-dominated fires: A 3D numerical study. Fire Saf. J. 2021, 124, 103383. [Google Scholar] [CrossRef]
  12. Mueller, E.V.; Skowronski, N.S.; Clark, K.L.; Gallagher, M.R.; Mell, W.E.; Simeoni, A.; Hadden, R.M. Detailed physical modeling of wildland fire dynamics at field scale—An experimentally informed evaluation. Fire Saf. J. 2021, 120, 103051. [Google Scholar] [CrossRef]
  13. Thomas, J.C.; Mueller, E.V.; Santamaria, S.; Gallagher, M.; El Houssami, M.; Filkov, A.; Clark, K.; Skowronski, N.; Hadden, R.M.; Mell, W.; et al. Investigation of firebrand generation from an experimental fire: Development of a reliable data collection methodology. Fire Saf. J. 2017, 91, 864–871. [Google Scholar] [CrossRef]
  14. Mell, W.E.; Manzello, S.L.; Maranghides, A.; Butry, D.; Rehm, R.G. The wildlandurban interface fire problem current approaches and research needs. Int. J. Wildland Fire 2010, 19, 238–251. [Google Scholar] [CrossRef]
  15. Scott, J.; Helmbrecht, D.; Thompson, M.P.; Calkin, D.E.; Marcille, K. Probabilistic assessment of wildfire hazard and municipal watershed exposure. Nat. Hazards 2012, 64, 707–728. [Google Scholar] [CrossRef]
  16. Chuvieco, E.; Aguado, I.; Jurdao, S.; Pettinari, M.L.; Yebra, M.; Salas, J.; Hantson, S.; de la Riva, J.; Ibarra, P.; Rodrigues, M.; et al. Integrating geospatial information into fire risk assessment. Int. J. Wildland Fire 2014, 23, 606–619. [Google Scholar] [CrossRef]
  17. Abo El Ezz, A.; Boucher, J.; Cotton-Gagnon, A.; Godbout, A. Framework for spatial incident-level wildfire risk modelling to residential structures at the wildland urban interface. Fire Saf. J. 2022, 131, 103625. [Google Scholar] [CrossRef]
  18. Aguado, I.; Chuvieco, E.; Borén, R.; Nieto, H. Estimation of dead fuel moisture content from meteorological data in Mediterranean areas. Applications in fire danger assessment. Int. J. Wildland Fire 2007, 16, 390–397. [Google Scholar] [CrossRef]
  19. Finney, M.A.; McHugh, C.W.; Grenfell, I.C.; Riley, K.L.; Short, K.C. A simulation of probabilistic wildfire risk components for the continental United States. Stoch. Environ. Res. Risk Assess. 2011, 25, 973–1000. [Google Scholar] [CrossRef]
  20. Mercer, D.E.; Prestemon, J.P. Comparing production function models for wildfire risk analysis in the wildland–urban interface. For. Policy Econ. 2005, 7, 782–795. [Google Scholar] [CrossRef]
  21. Lee, S.-J.; Lee, Y.-J.; Ryu, J.-Y.; Kwon, C.-G.; Seo, K.-W.; Kim, S.-Y. Prediction of Wildfire Fuel Load for Pinus densiflora Stands in South Korea Based on the Forest-Growth Model. Forests 2022, 13, 1372. [Google Scholar] [CrossRef]
  22. Arroyo, L.A.; Pascual, C.; Manzanera, J.A. Fire models and methods to map fuel types: The role of remote sensing. For. Ecol. Manag. 2008, 256, 1239–1252. [Google Scholar] [CrossRef]
  23. Yebra, M.; Quan, X.; Riaño, D.; Rozas Larraondo, P.; van Dijk, A.I.J.M.; Cary, G.J. A fuel moisture content and flammability monitoring methodology for continental Australia based on optical remote sensing. Remote Sens. Environ. 2018, 212, 260–272. [Google Scholar] [CrossRef]
  24. Gale, M.G.; Cary, G.J.; Van Dijk, A.I.J.M.; Yebra, M. Forest fire fuel through the lens of remote sensing: Review of approaches, challenges and future directions in the remote sensing of biotic determinants of fire behaviour. Remote Sens. Environ. 2021, 255, 112282. [Google Scholar] [CrossRef]
  25. Goodenough, D.; Li, J.; Asner, G.; Schaepman, M.; Ustin, S.; Dyk, A. Combining Hyperspectral Remote Sensing and Physical Modeling for Applications in Land Ecosystems. In Proceedings of the 2006 IEEE International Symposium on Geoscience and Remote Sensing, Denver, CO, USA, 31 July–4 August 2006; pp. 2000–2004. [Google Scholar]
  26. Chuvieco, E.; Aguado, I.; Salas, J.; García, M.; Yebra, M.; Oliva, P. Satellite Remote Sensing Contributions to Wildland Fire Science and Management. Curr. For. Rep. 2020, 6, 81–96. [Google Scholar] [CrossRef]
  27. Shaik, R.U.; Fusilli, L.; Giovanni, L. New Approach of Sample Generation and Classification for Wildfire Fuel Mapping on Hyperspectral (Prisma) Image. In Proceedings of the 2021 IEEE International Geoscience and Remote Sensing Symposium IGARSS, Brussels, Belgium, 11–16 July 2021; pp. 5417–5420. [Google Scholar]
  28. Morsdorf, F.; Meier, E.; Kötz, B.; Itten, K.I.; Dobbertin, M.; Allgöwer, B. LIDAR-based geometric reconstruction of boreal type forest stands at single tree level for forest and wildland fire management. Remote Sens. Environ. 2004, 92, 353–362. [Google Scholar] [CrossRef]
  29. Skowronski, N.S.; Clark, K.L.; Gallagher, M.; Birdsey, R.A.; Hom, J.L. Airborne laser scanner-assisted estimation of aboveground biomass change in a temperate oak–pine forest. Remote Sens. Environ. 2014, 151, 166–174. [Google Scholar] [CrossRef]
  30. Skowronski, N.S.; Haag, S.; Trimble, J.; Clark, K.L.; Gallagher, M.R.; Lathrop, R.G. Structure-level fuel load assessment in the wildland–urban interface: A fusion of airborne laser scanning and spectral remote-sensing methodologies. Int. J. Wildland Fire 2016, 25, 547–557. [Google Scholar] [CrossRef]
  31. Ke, Y.; Quackenbush, L.J. A review of methods for automatic individual tree-crown detection and delineation from passive remote sensing. Int. J. Remote Sens. 2011, 32, 4725–4747. [Google Scholar] [CrossRef]
  32. Yu, K.; Hao, Z.; Post, C.J.; Mikhailova, E.A.; Lin, L.; Zhao, G.; Tian, S.; Liu, J. Comparison of Classical Methods and Mask R-CNN for Automatic Tree Detection and Mapping Using UAV Imagery. Remote Sens. 2022, 14, 295. [Google Scholar] [CrossRef]
  33. Yuxin, W.; Alexander, K.; Francisco, M.; Wan-Yen, L.; Ross, G. Detectron2. 2019. Available online: https://github.com/facebookresearch/detectron2 (accessed on 9 August 2023).
  34. Tassis, L.M.; Tozzi de Souza, J.E.; Krohling, R.A. A deep learning approach combining instance and semantic segmentation to identify diseases and pests of coffee leaves from in-field images. Comput. Electron. Agric. 2021, 186, 106191. [Google Scholar] [CrossRef]
  35. Minaee, S.; Boykov, Y.; Porikli, F.; Plaza, A.; Kehtarnavaz, N.; Terzopoulos, D. Image Segmentation Using Deep Learning: A Survey. IEEE Trans. Pattern Anal. Mach. Intell. 2022, 44, 3523–3542. [Google Scholar] [CrossRef] [PubMed]
  36. Zheng, J.; Li, W.; Xia, M.; Dong, R.; Fu, H.; Yuan, S. Large-Scale Oil Palm Tree Detection from High-Resolution Remote Sensing Images Using Faster-RCNN. In Proceedings of the IGARSS 2019—2019 IEEE International Geoscience and Remote Sensing Symposium, Yokohama, Japan, 28 July–2 August 2019; pp. 1422–1425. [Google Scholar]
  37. Ocer, N.E.; Kaplan, G.; Erdem, F.; Kucuk Matci, D.; Avdan, U. Tree extraction from multi-scale UAV images using Mask R-CNN with FPN. Remote Sens. Lett. 2020, 11, 847–856. [Google Scholar] [CrossRef]
  38. Shorten, C.; Khoshgoftaar, T.M. A survey on Image Data Augmentation for Deep Learning. J. Big Data 2019, 6, 60. [Google Scholar] [CrossRef]
  39. Peirce, B.O. Criterion for the rejection of doubtful observations. Astron. J. 1852, 2, 161–163. [Google Scholar] [CrossRef]
  40. Huxley, J.S. Problems of Relative Growth; The University of Chicago Press: Chicago, IL, USA, 1932. [Google Scholar]
  41. Pretzsch, H.; Biber, P.; Uhl, E.; Dahlhausen, J.; Rötzer, T.; Caldentey, J.; Koike, T.; van Con, T.; Chavanne, A.; Seifert, T.; et al. Crown size and growing space requirement of common tree species in urban centres, parks, and forests. Urban For. Urban Green. 2015, 14, 466–479. [Google Scholar] [CrossRef]
  42. Park, J.H.; Jung, S.Y.; Lee, K.-S.; Kim, C.H.; Park, Y.B.; Yoo, B.O. Classification of Regional Types for Pinus densiflora stands Using Height-DBH Growth in Korea. J. Korean Soc. For. Sci. 2016, 105, 336–341. [Google Scholar] [CrossRef]
  43. Lee, S.J.; Kwon, C.G.; Kim, S.Y. The Analysis of Forest Fire Fuel Structure Through the Development of Crown Fuel Vertical Distribution Model: A Case Study on Managed and Unmanaged Stands of Pinus densiflora in the Gyeongbuk Province. Korean J. Agric. For. Meteorol. 2021, 23, 46–54. [Google Scholar] [CrossRef]
  44. Kevin, M.; Randall, M.; Craig, W.; Glenn, F. Fire Dynamics Simulator Users Guide, 6th ed.; Special Publication (NIST SP), National Institute of Standards and Technology: Gaithersburg, MD, USA, 2013. [Google Scholar] [CrossRef]
  45. Miraki, M.; Sohrabi, H.; Fatehi, P.; Kneubuehler, M. Individual tree crown delineation from high-resolution UAV images in broadleaf forest. Ecol. Inform. 2021, 61, 101207. [Google Scholar] [CrossRef]
  46. Hui, Z.; Cheng, P.; Yang, B.; Zhou, G. Multi-level self-adaptive individual tree detection for coniferous forest using airborne LiDAR. Int. J. Appl. Earth Obs. Geoinf. 2022, 114, 103028. [Google Scholar] [CrossRef]
  47. Li, Y.; Xie, D.; Wang, Y.; Jin, S.; Zhou, K.; Zhang, Z.; Li, W.; Zhang, W.; Mu, X.; Yan, G. Individual tree segmentation of airborne and UAV LiDAR point clouds based on the watershed and optimized connection center evolution clustering. Ecol. Evol. 2023, 13, e10297. [Google Scholar] [CrossRef]
  48. Hao, Z.; Lin, L.; Post, C.J.; Mikhailova, E.A.; Li, M.; Chen, Y.; Yu, K.; Liu, J. Automated tree-crown and height detection in a young forest plantation using mask region-based convolutional neural network (Mask R-CNN). ISPRS J. Photogramm. Remote Sens. 2021, 178, 112–123. [Google Scholar] [CrossRef]
  49. Mubin, N.A.; Nadarajoo, E.; Shafri, H.Z.M.; Hamedianfar, A. Young and mature oil palm tree detection and counting using convolutional neural network deep learning method. Int. J. Remote Sens. 2019, 40, 7500–7515. [Google Scholar] [CrossRef]
  50. Ferreira, M.P.; Almeida, D.R.A.d.; Papa, D.d.A.; Minervino, J.B.S.; Veras, H.F.P.; Formighieri, A.; Santos, C.A.N.; Ferreira, M.A.D.; Figueiredo, E.O.; Ferreira, E.J.L. Individual tree detection and species classification of Amazonian palms using UAV images and deep learning. For. Ecol. Manag. 2020, 475, 118397. [Google Scholar] [CrossRef]
  51. Thiel, C.; Schmullius, C. Comparison of UAV photograph-based and airborne lidar-based point clouds over forest from a forestry application perspective. Int. J. Remote Sens. 2017, 38, 2411–2426. [Google Scholar] [CrossRef]
  52. Mitchell, T.J.; Beauchamp, J.J. Bayesian Variable Selection in Linear Regression. J. Am. Stat. Assoc. 1988, 83, 1023–1032. [Google Scholar] [CrossRef]
  53. Jackman, S. Estimation and inference via Bayesian simulation: An introduction to Markov chain Monte Carlo. Am. J. Political Sci. 2000, 44, 375–404. [Google Scholar] [CrossRef]
  54. Putz, F.E.; Parker, G.G.; Archibald, R.M. Mechanical Abrasion and Intercrown Spacing. Am. Midl. Nat. 1984, 112, 24–28. [Google Scholar] [CrossRef]
  55. Goudie, J.W.; Polsson, K.R.; Ott, P.K. An empirical model of crown shyness for lodgepole pine (Pinus contorta var. latifolia [Engl.] Critch.) in British Columbia. For. Ecol. Manag. 2009, 257, 321–331. [Google Scholar] [CrossRef]
  56. van der Zee, J.; Lau, A.; Shenkin, A. Understanding crown shyness from a 3-D perspective. Ann. Bot. 2021, 128, 725–736. [Google Scholar] [CrossRef]
Figure 1. Schematic of the fuel-estimation procedure.
Forests 14 02126 g001
Figure 2. (a) Location of the study site, (b) aerial photographs of the study site.
Forests 14 02126 g002
Figure 3. Tree detection results using Detectron2.
Forests 14 02126 g003
Figure 4. (a) Raw and (b) pre-processed LiDAR point clouds.
Forests 14 02126 g004
Figure 5. Tree height histograms of the prediction dataset.
Forests 14 02126 g005
Figure 6. Results of quantile regression of TH on CW using scatter plots with the (a) prediction and (b) validation dataset.
Forests 14 02126 g006
Figure 7. Diameter at breast height (DBH) prediction results and comparison with the measured DBH.
Forests 14 02126 g007
Figure 8. (a) LiDAR point clouds and WFDS simulation domains using (b) LiDAR-based and (c) orthophoto-based fuel information.
Forests 14 02126 g008
Figure 9. Total heat loss rate and dry fuel mass loss rate.
Forests 14 02126 g009
Figure 10. Visualized results of a WFDS simulation using varying fuel information: (a) LiDAR-based, (b) orthophoto-based.
Forests 14 02126 g010
Figure 11. Histogram of the normalized difference between (a) the field-surveyed and LiDAR-measured TH, (b) the field-surveyed and the predicted TH.
Forests 14 02126 g011
Figure 12. Bayesian regression results based on (a) prediction and (b) validation datasets.
Forests 14 02126 g012
Table 1. Summary of quantile regressions for TH prediction.
QuantileAStd. Err.p-ValueBStd. Err.p-Value
0.051.82840.0374>0.00010.19680.0336>0.0001
0.52.18740.0156>0.00010.14000.0140>0.0001
0.952.48220.0225>0.00010.07220.02030.0004
Disclaimer/Publisher’s Note: The statements, opinions and data contained in all publications are solely those of the individual author(s) and contributor(s) and not of MDPI and/or the editor(s). MDPI and/or the editor(s) disclaim responsibility for any injury to people or property resulting from any ideas, methods, instructions or products referred to in the content.

