Article

Microhabitat Conditions Influencing Ground Vegetation Dominants in an Ecotone between a Spruce (Picea abies (L.) H.Karst.) Forest and Clear-Cut Site during Ten Post-Logging Years

by
Nadezhda Genikova
1,* and
Viktor Mamontov
2
1
Laboratory for Boreal Forest Dynamics and Productivity, Forest Research Institute, KarRC RAS, 185910 Petrozavodsk, Russia
2
Laboratory for Biological Resources and Ethnography, Institute of Biogeography and Genetic Resources, FECIAR Ural Branch RAS, 163000 Arkhangelsk, Russia
*
Author to whom correspondence should be addressed.
Forests 2023, 14(11), 2125; https://doi.org/10.3390/f14112125
Submission received: 26 September 2023 / Revised: 13 October 2023 / Accepted: 23 October 2023 / Published: 25 October 2023
(This article belongs to the Special Issue Clear-Cutting in Modern Forestry: New Approaches and Latest Findings)

Abstract

:
The logging of mature tree stands, where part of the forest is clear-cut, results in the formation of an ecotone complex (EC) consisting of the forest (F), a transition from forest to a clear-cut site under canopy cover (forest edge—FE), a transition from forest to a clear-cut site outside of canopy cover (clear-cutting edge—CE), and the clear-cut site per se (C). Ground vegetation descriptions (percentage cover of dominants and height of subshrubs) were carried out on the sampling subplots along the transects running from spruce forest into the clear-cut site. We studied the effects of the time since logging and some microhabitat factors (aspect, coniferous and deciduous regeneration, downed deadwood, microrelief, and the abundance of subshrubs, grasses, and forbs) on the abundance of the main ground vegetation dominants of the bilberry-type spruce stands and the clear-cut sites: Vaccinium myrtillus, V. vitis-idaea, Deschampsia flexuosa, and Epilobium angustifolium, in different EC zones. The factor found to have the greatest modifying effect on the abundance of all the species in the CE and C zones was the time since clear-cutting. The clear-cutting pioneer species Deschampsia flexuosa and Epilobium angustifolium preferred open areas in the clear-cut site, whereas the abundance of V. myrtillus and V. vitis-idaea positively correlated with the amount of coniferous and deciduous regeneration. Some factors (downed deadwood, microrelief, coniferous regeneration) were found to act similarly on subshrubs both under the tree canopy (F and FE) and in clear-cut microhabitats (CE and C). The shoot height of subshrubs as well as its percentage cover varied depending on the time since clear-cutting and the microhabitat conditions.

1. Introduction

The more-than-half-century of industrial-scope timber harvesting has resulted in a complex mosaic of coniferous and deciduous forests of varying age in the European North of Russia.
The microclimate in the harvested areas is significantly altered, with the consequential transformation of the plant communities in the sites. These sharp changes occur during the first several years after logging [1,2,3]. In the following years, as the tree layer regenerates, usually with a prevalence of deciduous species, the ground vegetation develops through a few more succession stages and regains its original state only several decades later.
The microclimate change, however, also extends beyond the actual clear-cut site to the forest strip along the clear-cutting edge [4,5,6,7]. A finding in boreal coniferous forests is that solar irradiation, air humidity and temperature changed the most significantly, with the closest approximation to the background conditions under the forest canopy, at a distance of some 8 m from the clear-cutting edge into the forest [8,9].
The forest left intact also has a significant effect on the adjoining clear-cut strip, where the microclimate remains less different from the canopy-covered area. As a result, the ground vegetation in this strip is not so profoundly transformed and recovers sooner.
The above features of the microclimate and development of vegetation communities along the clear-cutting/forest interface are reason to speak of an ecotone complex (EC), which is a transition from typical forest vegetation communities to communities of cutover sites. This transitional area is some 16 m wide (8 m into the contacting communities on each side of the forest/clear-cutting interface).
The changes taking place in the transitional area are of both theoretical and practical interest. Ecotones are places of concentration of some bird and mammal species [10,11,12,13]; they may contain greater resources of economically valuable ground vegetation species [14,15]. Our aim here was to study the abundance of the ground vegetation dominants (Vaccinium myrtillus, V. vitis-idaea, Epilobium angustifolium, Deschampsia flexuosa) and to identify the principal microhabitat factors influencing these species in the ecotone between forest and clear-cut site in the first post-logging decade.

2. Materials and Methods
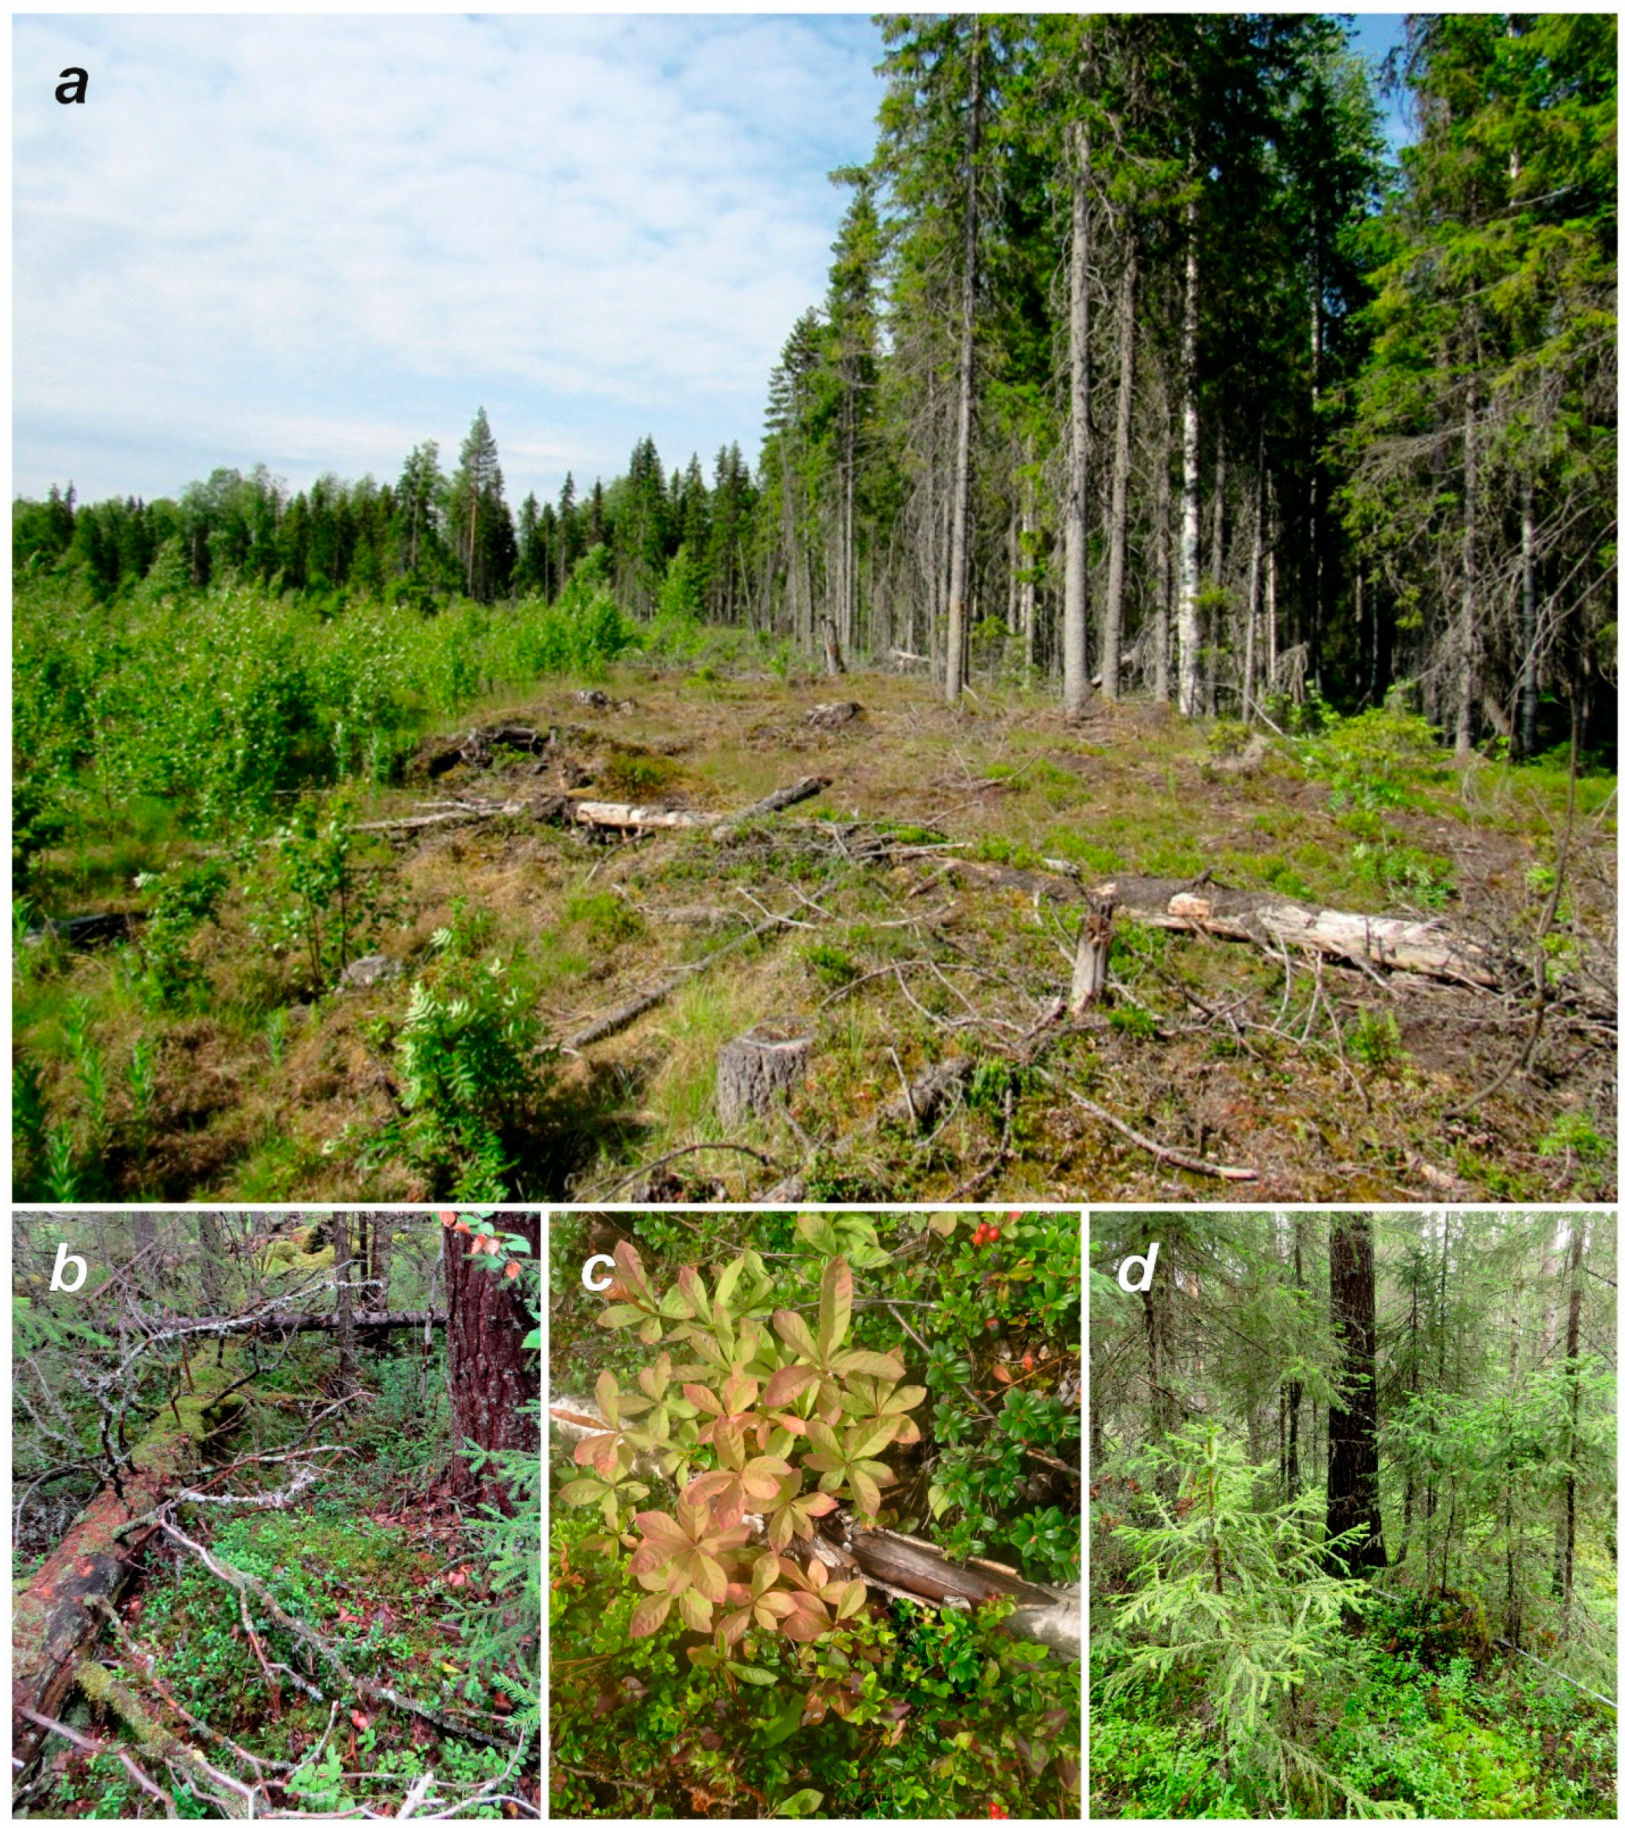
2.1. Study Area

The surveys were carried out in the Arkhangelsk Region, Russia (64.4° N, 41.8° E) in 2014–2017. The territory belongs to the boreal biome. The mean annual air temperature (averaged over the past 10 years) in the study area is +2.8 °C, and the mean annual precipitation is 660 mm. The coldest month is January (−11.7 °C); the warmest month is July (+17.2 °C). The snow-covered period lasts from early November to late April, and the duration of the growing season is 150 days—from mid-May through September (Weather Archive in Kholmogory (www.rp5.ru, accessed on 16.09.2022)). The most widespread forest in the study area is the bilberry spruce (Picea abies (L.) H.Karst.) type of forest, and small Sphagnum pine (Pinus sylvestris L.) stands and haircap-moss spruce stands also occur. Much of the spruce forests have been logged down and areas of secondary mixed forest dominated by aspen (Populus tremula L.) and birch (Betula pubescens Ehrh.) are common.

2.2. Data Collection

Surveys were carried out in the adjoining communities of a bilberry-type spruce forest and a wavy hair-grass-dominated clear-cut site (2 to 10 years after clear-cutting) constituting an ecotone complex (EC) (Figure 1a). Characteristics of the spruce stands and clear-cuts were given in our previous publication [16]. Based on the results of previous studies [16,17], we assumed the transitional zone to be 8 m wide on each side of the forest/clear-cutting interface. The ground vegetation was studied in 40–50 m long transects running from inside the forest into the clear-cut site (20–25 m into each of the forest and the clear-cut site). The transects were located at a distance of at least 5 m from each other. Thus, the transects for studying forest community characteristics were conventionally divided into EC zones of varying extents: F (forest)—12–17 m, FE (forest edge)—8 m, CE (clear-cutting edge)—8 m, C (clear-cut site)—12–17 m. The transects were broken down into 50 × 50 cm sampling subplots for estimating the percentage covers of plant species in the moss–lichen and herb–subshrub layers and the average height of bilberry and cowberry shoots. Ground vegetation descriptions were produced in the same transects in the 2nd, 3rd, 4th, and 5th years after clear-cutting in one of the sampling sites, and 5 and 10 years after clear-cutting in the other sampling site. The analysis included data from 34 transects and 2942 sampling subplots (983 in each of the F and C zone, 488 in each of the FE and CE zones).

2.3. Data Analysis

The species composition of vascular plants was determined for each EC zone. The vascular-species dominance structure in different EC zones was estimated using Pielou’s evenness index, which takes values from 0 to 1, where 1 means that all species are represented in equal numbers. Pielou’s index is a variant of the Shannon index [18]: H/logN, where H is the Shannon index and N is the number of species.
The effect of different factors on the percentage cover of major ground vegetation dominants (bilberry Vaccinium myrtillus L.; cowberry V. vitis-idaea L.; wavy hair-grass Deschampsia flexuosa (L.) Trin.; fireweed Epilobium angustifolium L.) and on the height of subshrubs (V. myrtillus, V. vitis-idaea) in different EC zones was studied using analysis of variance (Kruskal–Wallis test). The Kruskal–Wallis test was followed up by Dunn’s test to identify which groups were different.
The following factors were selected for the study: time since clear-cutting (2, 3, 4, 5, and 10 years after logging), forest edge aspect (north-, east-, south-, and west-facing), microrelief (flat site, microelevation occupying within 30% of the sampling subplot, microelevation occupying over 30% of the subplot, microdepression), plant litter (absent, less than 30%, more than 30%), coniferous and deciduous regeneration (absent, under-canopy advance regeneration in less than 30% of the subplot, under-canopy regeneration in more than 30% of the subplot), fresh and overgrown downed deadwood (absent, less than 30%, more than 30%), and the abundance of subshrubs, grasses, and forbs (absent, less than 30%, more than 30%). Examples of some microhabitat conditions are shown in Figure 1b–d.

3. Results

A total of 29 vascular plant species were found in the ground vegetation of all the sampling sites. The number of plant species in clear-cut communities (C) and in mature bilberry-type spruce stands (F) was nearly the same (Table 1). The average number of species per sampling subplot was also approximately the same in these highest-contrast EC zones.
Pielou’s evenness index was applied to study the species dominance structure in the herb–subshrub layer. The values of this index in the forest (F) and transitional zones were relatively low because the ground vegetation was dominated by two subshrub species—bilberry and cowberry. The clear-cut site (C) had higher values of this index owing to a greater diversity of microenvironments, where different plant species can prevail. Overall, the species composition varied little among EC zones and only the contributions of species to the ground vegetation were different.
All the vascular plant species fall into three groups: subshrubs, grasses, and forbs. The F and FE zones were dominated by subshrubs, while the share of grasses and forbs was minor. In the CE zone, the share of grasses and forbs was higher than in the forest. In the clear-cut site, subshrubs generally retained the dominant position in the ground vegetation but grasses and forbs were also abundant (Table 1).
The results of the analysis of variance for the effect of the time since clear-cutting and microhabitat conditions on the ground vegetation dominants in different EC zones are given in Table 2.
Bilberry and cowberry are the main subshrub species in north-boreal spruce forests. These two species dominate the ground vegetation in the surveyed bilberry-type spruce stands, their percentage covers estimated at an average of 20%–25% and 10%–20%, respectively.
The analysis of variance performed for each EC zone showed that the factor of time since the disturbance had no significant effect on the abundance of bilberry in zones F and FE, i.e., the species’ percentage cover in these EC zones underwent no significant change throughout the monitoring period (Table 2). In the first years after tree-stand removal, the abundance of bilberry and its average height decreased sharply in the clear-cut site compared to the original forest community (Table 3). As the overstory canopy formed in the clear-cut site, the percentage cover and height of bilberry shoots increased, but even 10 years after clear-cutting, these parameters remained significantly lower than in the forest community adjoining the clear-cut site (Table 3).
The abundance and height of bilberry in zone C were always confidently lower than in zone F. These parameters in the transitional zones (FE and CE) were, in all variants, confidently lower than in zone F and were higher or equal to those of zone C (Table 3). The reduction in shoot height from forest towards clear-cut site in bilberry was accompanied by a decline in its percentage cover.
The aspect had an effect on bilberry abundance in all EC zones. Bilberry percentage cover on average was the highest in north-facing sites and the lowest in east- and/or south-facing sites.
The microrelief mattered for bilberry abundance only under the tree canopy (F and FE). Bilberry abundance was lower in the sampling subplots with inhomogeneous microrelief.
Bilberry percentage cover was augmented by the presence of coniferous regeneration in all EC zones with an especially pronounced effect in CE and C. Deciduous regeneration had an effect only in zone F, where a slight amount of such regeneration promoted bilberry abundance.
The presence of overgrown as well as fresh (non-overgrown) downed deadwood in canopy-covered zones (F and FE) negatively affected bilberry abundance. The abundance of this subshrub generally negatively correlated with the amount of plant litter.
The presence of forbs had an effect only in transitional zones of the EC. Bilberry abundance was the highest where the percentage cover of forbs was quite low.
Bilberry shoot height was influenced by the time since clear-cutting in all EC zones. This is probably explained by the fact that the time series includes different sampling sites within the study area. While we see that the species percentage cover in zone F shows no significant variation among different bilberry spruce forest communities, the height of the subshrub on the other hand is a functional trait that is apparently strongly influenced by the site conditions.
The response of bilberry shoot height to the aspect was more pronounced than in the case of the percentage cover, but the patterns were the same.
In subplots with both coniferous and deciduous regeneration in different EC zones, bilberry shoots were higher on average than in subplots lacking tree regeneration.
The relationship between bilberry height and the percentage cover of all subshrubs is consistently positive. Grasses growing in subplots in zones CE and C negatively affect the height of this subshrub. A limited abundance of forbs (within 30%) has a positive effect on bilberry shoot height in different EC zones.
Cowberry percentage cover in zone F varied notably among different bilberry-type spruce F zones. Cowberry abundance in clear-cut sites in the first 2–3 years after the harvest was lower than in the forest, then its percentage cover increased to the same level as in the forest but declined again 10 years after clear-cutting (Table 4). Cowberry abundance in transitional zones was higher than in zones F and C. Conversely to the percentage cover, the height of the subshrub decreased in the transitional area from the forest towards the clear-cut site.
The factors that proved to be important for cowberry abundance were the aspect and the microrelief. The lowest percentage covers of the species were found in north-facing subplots in different EC zones. Subplots containing microelevations featured confidently higher cowberry abundances.
The presence of coniferous regeneration promoted the species’ abundance only in zone C. Richness in non-overgrown downed deadwood in zone F, on the contrary, was associated with a reduction in the percentage cover of cowberry.
The effect of the plant litter was the greatest in zones CE and C—cowberry abundance was lower in litter-rich sites.
The effects of grasses and forbs varied. A limited contribution of grasses to the ground vegetation cover (within 30%) in zones CE and C promoted the abundance of cowberry compared to the subplots that lacked grasses or featured their higher abundance. The effect of forbs on cowberry abundance appeared in zones F and FE, where the percentage cover of the subshrub was the highest in the total absence of forbs.
The shoot height of cowberry as well as its percentage cover varied depending on the time since clear-cutting in each of the four EC zones.
The aspect also proved to be an important factor for the height of the subshrub in each EC zone. The highest values of the parameter were found in north-facing subplots and the lowest values in south-facing ones.
Subplot shading by coniferous or deciduous advance regeneration in zones CE and C was associated with taller cowberry shoots, as opposed to a lower average shoot height in open locations.
In zone F, high amounts of non-overgrown downed deadwood correlated with low average cowberry shoot height. Within the same zone, the subshrub was confidently taller in subplots rich in plant litter (more than 30%) compared to the subplots where litter covered less than 30%.
A positive correlation in all EC zones was detected between cowberry shoot height and the abundance of subshrubs. Also, cowberry tended to be taller in subplots containing forbs. In zone C, the average height of cowberry shoots decreased where grasses were more abundant.
The average percentage cover of wavy hair-grass, Deschampsia flexuosa, in all sampling sites in the forest section of the EC remained stable, not exceeding 2%, while its frequency of occurrence was quite high (30%–70%). The abundance of D. flexuosa and other grasses in the transitional zone was low. In the clear-cut site, hair-grass abundance grew slightly already in the second year after tree stand removal. The percentage cover of the species reached a maximum in 5-year-old clear-cut sites (Figure 2). By the time of canopy closure 10 years after logging, its abundance declined notably.
The factors found to be significant for the percentage cover of wavy hair-grass in zones CE and/or C were the presence of non-overgrown downed deadwood, and the abundance of subshrubs and forbs.
The presence of non-overgrown downed deadwood proved to negatively correlate with wavy hair-grass abundance in the sampling subplots. Hair-grass abundance was the highest where the percentage cover of subshrubs was relatively low. Wavy hair-grass percentage cover tended to increase with a rise in the abundance of forbs.
Fireweed, Epilobium angustifolium, was rare in the forest section of the transects—its percentage cover there was within 1%. Zone FE totally lacked this species. The abundance and occurrence of fireweed in zone CE were very low (Figure 3).
The occurrence and percentage cover of fireweed were notably higher in the clear-cut site (zone C) compared to other EC zones. The abundance of this species peaked in 4-5-year-old clear-cut sites and declined sharply 10 years after clear-cutting.
The lowest values of fireweed parameters were found in zone C in east-facing subplots. Microelevations, the presence of non-overgrown downed deadwood, and the absence of subshrubs in the subplots had a positive effect of the abundance of this species. The presence of coniferous regeneration negatively affected the percentage cover of fireweed.

4. Discussion

Each of the selected habitat factors produced an effect on the percentage cover and/or shoot height of the main ground vegetation dominants in the ecotone between bilberry-type spruce forest and sites clear-cut at different times in the past (2 to 10 years before). To interpret the effects of the factors in different EC zones correctly, we need to understand the differences between the zones. In our previous publications, we characterized the ECs in terms of tree regeneration amounts and microclimate parameters (irradiance and surface air temperature) [8,16].
Zone F is the original undisturbed forest community with low solar irradiance, gentler daily air temperature fluctuations, a limited amount of coniferous regeneration, and scarce deciduous regeneration. The ground vegetation dominants in this zone are subshrubs (chiefly bilberry and cowberry); the plant litter mainly consists of coniferous needles, bark, and twigs. Zone C lacks a closed tree canopy, the consequences being a sharp rise in insolation, the augmentation of daily air temperature fluctuations, a change in the dominants of the ground vegetation (grasses and some forbs begin to prevail) and the regeneration and understory layer (share of deciduous species increases significantly), and an overall increase in tree regeneration amounts. Zone C has litter dominated by leaves shed by deciduous regeneration and herbaceous plants, and is rich in deadwood consisting of coarse logging debris and trees uprooted after stand removal. The microclimate and plant community parameters of zones FE and CE generally have values intermediate between those of F and C.
As demonstrated above, the number of vascular plant species is nearly equal in zones F and C but the ground vegetation dominants change (Table 1). Where zone F is vastly dominated by two species—bilberry and cowberry—the ground vegetation of individual subplots in zone C can be dominated by virtually any species (Trientalis europaea L., Maianthemum bifolium (L.) F.W. Schmidt, Linnaea borealis L., etc.). The diversity of conditions across EC zones can be illustrated by an ordination plot mapping the variation of subplots by percentage covers of vascular plant species in the factor space (Figure 4). Clearly, zone C stands out for the highest variation along the two axes.
Bilberry abundance in zones F and FE did not change over time after clear-cutting and was generally at about the same level (20% and 10%–15%, respectively) in all the sampled forest sites (Table 3). A limited presence of coniferous and deciduous regeneration promoted the percentage cover of bilberry. The presumable reasons are the rise in soil productivity due to leaf litterfall [19] and the shade tolerance of bilberry, which can live in low light [20,21]. A negative factor for bilberry abundance in these two zones was the presence of downed deadwood, apparently because it occupied the space otherwise available to the subshrub.
The EC sections where the tree stand had been removed (CE and C) experienced a sharp reduction in bilberry abundance in the first years after clear-cutting. A reduction in the percentage cover, current-year increment, and number of shoots in bilberry in clear-cut sites in boreal forests has been reported by other researchers as well [22,23,24]. The principal reason for a sharp decline in bilberry abundance in zones C and CE is the increase in insolation after tree-stand removal. Bilberry leaves get sunburned and shoots wither following a sharp rise in transpiration [25]. Shading of any sort, e.g., under regenerating spruce plants or by a fallen trunk or a stump, is beneficial for the subshrub’s survival. It also helps to withstand the spring and early-summer frosts to which bilberry is highly sensitive [25]. In our studies, the presence of coniferous regeneration was found in all zones, but especially in C and CE, in positive correlation with bilberry abundance. Another positive factor for bilberry abundance was the temporal remoteness of clear-cutting, which implied a gradual increase in the amount of coniferous and deciduous regeneration, its height growth and, hence, greater shading of the field layer and smaller fluctuations of daily air temperatures.
Bilberry height positively correlated with its percentage cover and both these parameters were mostly influenced by the same factors.
The strongly negative response of bilberry and the moderately positive response of cowberry to tree stand removal in coniferous forests have been corroborated by other researchers [23,26]. Changes in cowberry abundance in a recently clear-cut site were similar to those for bilberry. However, as cowberry is ecologically a heliophyte [27] and physiologically better adapted than bilberry to relatively high insolation, its recovery was faster than in bilberry [28]. Cowberry abundance peaked in the 3rd–5th post-logging years but declined notably 10 years after logging (Table 4), apparently due to the regeneration- and understory layer forming in the surveyed clear-cut sites [16]. Abundant plant litter and grasses in zones CE and C reduced the percentage cover of cowberry. Litter reportedly inhibits the emergence of new cowberry shoots [29]. It is known that, as they form a dense turf, rhizomatous grasses also hinder the emergence of other ground vegetation species and tree seedlings [30,31]. In canopy-covered EC zones (F and FE) cowberry abundance negatively correlated with the percentage cover of forbs.
Cowberry abundance in different EC zones was found to be consistently higher on microelevations (overgrown stumps, tree-base mounds, overgrown tree roots projecting above land surface, etc.) compared to other microrelief features [32,33].
Cowberry height positively correlates with its percentage cover, so many factors influence the two parameters similarly. This is true for the microrelief in zone C, availability of coniferous and deciduous regeneration and abundance of grasses and plant litter in different EC zones, and availability of non-overgrown downed deadwood in zone F.
Time since clear-cutting is the main factor for wavy hair-grass abundance in CE and C. The species’ abundance grew sharply in these EC zones in the first years after logging, reached a maximum in the 4th–5th post-logging years, and then declined. Such a pattern for coenosis-scale populations of grasses, namely D. flexuosa, after logging in spruce stands conforms to published data [34,35,36]. Generally speaking, a rise in the abundance of grasses after logging is a characteristic feature of spruce forest regeneration successions [2,37].
The presence of non-overgrown downed deadwood and richness in plant litter were found to reduce the percentage cover of wavy hair-grass. Apparently, downed deadwood and dense litter hinder the vegetative spread of this rhizomatous grass and the emergence of new shoots [38,39].
High amounts of coniferous regeneration, as well as the high percentage cover of subshrubs in zones CE or C, correlate with a low abundance of wavy hair-grass. This correlation is due to the competition arising between elements of the original forest vegetation (coniferous regeneration and subshrubs) and wavy hair-grass, as a species that spreads out rapidly after tree stand removal [40].
Fireweed is a common species in spruce and pine forests [41]. Owing to the long-range transport of seeds by wind and to vegetative spread, it quickly colonizes the spaces vacated after logging, windthrow, or a mild forest fire [2,14,42].
In felled sites, fireweed settles in open areas, such as a skid road consisting of fresh logging residues, where the ground vegetation has been totally destroyed and there is no tree advance regeneration or understory. This fact explains the negative relationship between the abundance of fireweed and advance regeneration. In our studies, the abundance of this species reached a maximum 3-5 years after clear-cutting. In the sites clear-cut 10 years before, where the tree layer was forming, its percentage cover decreased. This finding agrees with published data on felled sites in the study area [34].
The negative correlation found between fireweed and subshrubs is likely explained by the different microhabitat choices of these plants. The ordination plot (Figure 5) demonstrates that the subplots with high abundances of fireweed and of subshrub species are spaced apart in the factor space (Figure 5). In felled sites, fireweed is usually localized in logging residue piling areas, where subshrubs cannot grow.

5. Conclusions

Our studies revealed the patterns of change in the abundance of the main ground vegetation dominants in the ecotone between bilberry-type spruce forests and clear-cut sites depending on various factors. The factor found to have the greatest modifying effect on the abundance of all the species was the time since clear-cutting.
In the first post-logging years, zones FE, CE, and C experienced a gradual decline in bilberry abundance and a reduction in the average height of the subshrub compared to the original forest. As the overstory was forming in the cutover site, bilberry abundance started recovering but remained below the level inside the forest even ten years after clear-cutting. Cowberry, on the other hand, featured a higher abundance in the FE zone versus the F zone throughout the study period. The highest percentage covers compared to the forest were found in CE and C in the 5th year after clear-cutting.
The percentage covers of wavy hair-grass and fireweed in canopy-covered habitats (F and FE) remained very low (1%–2%) throughout the study period. The percentage covers of these species in the transitional zone on the clear-cut side (CE) increased but were still several times lower than in the clear-cut site (C). In the CE and C zones, the percentage covers of these species reached a maximum 4–5 years after stand removal, while 10 years after clear-cutting, their abundance decreased notably.
Richness in plant litter reduced the abundance of cowberry and wavy hair-grass in zones CE and C. Coniferous and deciduous advance regeneration in CE and C promoted the abundance of bilberry but reduced the percentage covers of wavy hair-grass and fireweed. The presence of downed deadwood was associated with lower hair-grass abundance, while the availability of microelevations contributed to cowberry growth.
The abundance of fireweed and wavy hair-grass negatively correlated with the percentage cover of the subshrubs in zones CE and C, revealing the different ecological and phytocoenotic characteristics of these four forest species exhibited in response to the abrupt change in the habitat after clear-cutting.

Author Contributions

Conceptualization, N.G. and V.M.; methodology, N.G.; formal analysis, N.G.; investigation, N.G. and V.M.; writing—original draft preparation, N.G.; writing—review and editing, N.G. and V.M. All authors have read and agreed to the published version of the manuscript.

Funding

The authors acknowledge the financial support from the federal budget under state research assignment to KarRC RAS (Forest Research Institute) and from N. Laverov Federal Center for Integrated Arctic Research of the Ural Branch of the Russian Academy of Sciences (project № 122011400382-8).

Data Availability Statement

Not applicable.

Conflicts of Interest

The authors declare no conflict of interest.

References

  1. Marozas, V. Early succession of ground vegetation after clear-cuttings in spruce forests in a boreonemoral zone, Lithuania. Acta Biol. Univ. Daugavp. 2005, 5, 127–136. [Google Scholar]
  2. Kryshen, A.M. Plant Communities of Clear-Cut Areas in Karelia; Nauka: Moscow, Russia, 2006; p. 262. (In Russian) [Google Scholar]
  3. Genikova, N.; Mamontov, V. Decade-long dynamics of the ground vegetation in an ecotone between coniferous forest and clear-cut site. Environ. Sci. Proc. 2022, 22, 15. [Google Scholar] [CrossRef]
  4. Chen, J.; Franklin, J.F.; Spies, T.A. Growing-season microclimatic gradients from clearcut edges into old-growth Douglas-fir forests. Ecol. Appl. 1995, 5, 74–86. [Google Scholar] [CrossRef]
  5. Redding, T.E.; Hope, G.D.; Fortin, M.-J.; Schmidt, M.G.; Bailey, W.G. Spatial patterns of soil temperature and moisture across subalpine forest–clearcut edges in the southern interior of British Columbia. Can. J. Soil Sci. 2003, 83, 121–130. [Google Scholar] [CrossRef]
  6. Spittlehouse, D.L.; Adams, R.S.; Winkler, R.D. Forest, Edge, and Opening Microclimate at Sicamous Creek; Research Report 24; Ministry of Forests: Victoria, BC, Canada, 2004; 43p. [Google Scholar]
  7. Schmidt, M.; Jochheim, H.; Kersebaum, K.-C.; Lischeid, G.; Nendel, C. Gradients of microclimate, carbon and nitrogen in transition zones of fragmented landscapes—A review. Agric. For. Meteorol. 2017, 232, 659–671. [Google Scholar] [CrossRef]
  8. Genikova, N.V.; Mamontov, V.N.; Kryshen, A.M. Abundance of forest dwarf shrubs and microclimatic conditions in the bilberry spruce forest–clear-cut ecotone. Rastit. Resur. 2021, 2, 99–114. (In Russian) [Google Scholar] [CrossRef]
  9. Feklistov, P.A.; Sobolev, A.N.; Babich, N.A.; Sungurova, N.R.; Melekhov, V.I.; Bolotov, I.N. Edge effect in pine stands in the northern taiga. Russ. For. J. 2023, 2, 26–37. [Google Scholar] [CrossRef]
  10. Hansson, L. Bird Numbers across Edges between Mature Conifer Forest and Clearcuts in Central Sweden. Ornis Scand. 1983, 14, 97–103. Available online: https://www.jstor.org/stable/3676012 (accessed on 16 August 2023). [CrossRef]
  11. Kroodsma, R. Edge effect on breeding birds along power-line corridors in East Tennessee. Am. Midl. Nat. 1984, 118, 275–283. [Google Scholar] [CrossRef]
  12. Kollmann, J.; Buschor, M. Edges effects on seed predation by rodents in deciduous forests of northern Switzerland. Plant Ecol. 2002, 164, 249–261. [Google Scholar] [CrossRef]
  13. Kopij, G. Diversity and structure of avian communities in extensive lowland pine forests in relation to the distance from the forest edge. Biosyst. Divers. 2018, 26, 206–212. [Google Scholar] [CrossRef]
  14. Bergstedt, J.; Milber, P. The impact of logging intensity on field-layer vegetation in Swedish boreal forests. For. Ecol. Manag. 2001, 154, 105–115. [Google Scholar] [CrossRef]
  15. Marozas, V.; Grigaitis, V.; Brazaitis, G. Edge effect on ground vegetation in clear-cut edges of pine-dominated forests. Scand. J. For. Res. 2005, 20 (Suppl. 6), 43–48. [Google Scholar] [CrossRef]
  16. Genikova, N.V.; Mamontov, V.N.; Kryshen, A.M.; Kharitonov, V.A.; Moshnikov, S.A.; Toropova, E.V. Natural Regeneration of the Tree Stand in the Bilberry Spruce Forest—Clear-Cutting Ecotone Complex in the First Post-Logging Decade. Forests 2021, 12, 1542. [Google Scholar] [CrossRef]
  17. Genikova, N.V.; Kryshen, A.M. Dynamics of ground cover in Piceetum Myrtillosum in northern taiga during the first years after clear-cutting. Botanicheskii Zhurnal 2018, 103, 364–381. [Google Scholar] [CrossRef]
  18. MacArthur, R.H. Fluctuations of animal populations and a measure of community stability. Ecology 1955, 36, 533–536. [Google Scholar] [CrossRef]
  19. Chávez, V.; Macdonald, S.E. The influence of canopy patch mosaics on understory plant community composition in boreal mixedwood forest. For. Ecol. Manag. 2010, 259, 1067–1075. [Google Scholar] [CrossRef]
  20. Ellenberg, H. Zeigerwerte der Gefasspflanzen Mitteleuropas; Goltze: Gottingen, Germany, 1974. (In German) [Google Scholar]
  21. Eldegard, K.; Scholten, J.; Stokland, J.N.; Granhus, A.; Lie, M. The influence of stand density on bilberry (Vaccinium myrtillus L.) cover depends on stand age, solar irradiation, and tree species composition. For. Ecol. Manag. 2019, 432, 582–590. [Google Scholar] [CrossRef]
  22. Atlegrim, O.; Sjöberg, K. Response of bilberry (Vaccinium myrtillus) to clear-cutting and single-tree selection harvests in uneven-aged boreal Picea abies forests. For. Ecol. Manag. 1996, 86, 39–50. [Google Scholar] [CrossRef]
  23. Bergstedt, J.; Hagner, M.; Milberg, P. Effects on vegetation composition of a modified forest harvesting and propagation method compared with clear-cutting, scarification and planting. Appl. Veg. Sci. 2008, 11, 159–168. [Google Scholar] [CrossRef]
  24. Johnson, S.; Strengbom, J.; Kouki, J. Low levels of tree retention do not mitigate the effects of clearcutting on ground vegetation dynamics. For. Ecol. Manag. 2014, 330, 67–74. [Google Scholar] [CrossRef]
  25. Balandina, T.P.; Vakhrameeva, M.G. Vaccinium myrtillus. In Biologicheskaja Flora Moskovskoj Oblasti [Biological Flora of Moscow Region]; Publishing House of Moscow University: Moscow, Russia, 1980; Volume 6, pp. 132–145. [Google Scholar]
  26. Daubaras, R.; Česonienė, L.; Stakėnas, V.; Tamutis, V.; Zych, M. Impact of clear cuttings on biodiversity of boreal forests. Braz. J. For. Res. Colombo Embrapa Florestas 2019, 39, 487. [Google Scholar]
  27. Plantarium. Plants and Lichens of Russia and Neighboring Countries: Open Online Galleries and Plant Identification Guide. 2007–2022. Available online: https://www.plantarium.ru/lang/en.html (accessed on 22 September 2022).
  28. Česonienė, L.; Daubaras, R.; Bimbiraitė-Survilienė, K.; Kaškonienš, V.; Maruška, A.; Tiso, N.; Kaškonas, P.; Zych, M. Effects of clear-cuts in Scots Pine-dominated forests on Vaccinium myrtillus and Vaccinium vitis-idaea vegetative characteristics, and accumulation of phenolic compounds. Balt. For. 2018, 24, 278–286. [Google Scholar]
  29. Lebedeva, V.C.; Tikhodeeva, M.Y.; Ipatov, V.S. The effect of the tree layer on the soil cover in the bilberry aspen forest. Bot. Zhurnal 2008, 7, 996–1010. [Google Scholar]
  30. Hester, A.J.; Miles, J.; Gimingham, C.H. Succession from heather moorland to birch woodland. II. Growth and competition between Vaccinium myrtillus, Deschampsia flexuosa and Agrostis capillaris. J. Ecol. 1991, 79, 317–328. [Google Scholar] [CrossRef]
  31. Coll, L.; Balandier, P.; Picon-Cochard, C.; Prévosto, B.; Curt, T. Competition for water between beech seedlings and surrounding vegetation in different light and vegetation composition conditions. Ann. For. Sci. 2003, 60, 593–600. [Google Scholar] [CrossRef]
  32. Havas, P.; Kubin, E. Structure, growth and organic matter content in the vegetation cover of an old spruce forest in Northern Finland. Ann. Bot. Fennici 1983, 20, 115–149. [Google Scholar]
  33. Zubkova, E.V.; Frolov, P.V.; Bykhovets, S.S.; Nadporozhskaya, M.A.; Frolova, G.G. Bilberry and lingonberry cenopopulation mosaic structures and soil organic matter dynamics in southern Moscow region pine stands. Contemp. Probl. Ecol. 2022, 15, 908–918. [Google Scholar] [CrossRef]
  34. Melekhov, I.S.; Korkonosova, L.I.; Chertovskoy, V.G. Rukovodstvo po Izucheniju Tipov Koncentrirovannyh Vyrubok [A Guide to the Study of Types of Concentrated Clear-Cuts]; Nauka: Moscow, Russia, 1965; 180p. (In Russian) [Google Scholar]
  35. Ulanova, N.G.; Demidova, A.N. Population biology of Calamagrostis canescens (Web.) Roth in clearcuttings of spruce forests in south taiga. Byulleten MOIP 2001, 106, 51–58. (In Russian) [Google Scholar]
  36. Palvainen, M.; Finér, L.; Mannerkoski, H.; Piirainen, S.; Starr, M. Responses of ground vegetation species to clear-cutting in a boreal forest: Aboveground biomass and nutrient contents during the first 7 years. Ecol. Res. 2005, 20, 652–660. [Google Scholar] [CrossRef]
  37. Pykälä, J. Immediate increase in plant species richness after clear-cutting of boreal herb-rich forests. Appl. Veg. Sci. 2004, 7, 29–34. [Google Scholar] [CrossRef]
  38. Olsson, B.A.; Staaf, H. Influence of harvesting intensity of logging residues on ground vegetation in coniferous forests. J. Appl. Ecol. 1995, 32, 640–654. [Google Scholar] [CrossRef]
  39. Xiong, S.; Nilsson, C. The effects of plant litter on vegetation: A meta-analysis. J. Ecol. 1999, 87, 984–994. [Google Scholar] [CrossRef]
  40. Uotila, A.; Kouki, J. Understorey vegetation in spruce-dominated forests in eastern Finland and Russian Karelia: Successional patterns after anthropogenic and natural disturbances. For. Ecol. Manag. 2005, 215, 113–137. [Google Scholar] [CrossRef]
  41. Kravchenko, A.V. A Compendium of Karelian Flora (Vascular Plants); KarNC RAN: Petrozavodsk, Russia, 2007; 403p. (In Russian) [Google Scholar]
  42. Broderick, D.H. The biology of Canadian weeds. 93. Epilobium angustifolium L. (Onagraceae). Can. J. Plant Sci. 1990, 70, 247–259. [Google Scholar] [CrossRef]
Figure 1. The ecotone complex example and examples of microhabitat factors: (a)—“bilberry-type spruce forest—5-year-old clear-cut site” EC; (b)—downed deadwood; (c)—forbs (Trientalis europaea L.) and subshrubs (Vaccinium vitis-idaea L.) in the ground vegetation; (d)—coniferous regeneration (Picea abies (L.) H.Karst.).
Forests 14 02125 g001
Figure 2. Deschampsia flexuosa percentage cover (%) trends. Notations for ecotone complex zones: F—forest, FE—forest edge, CE—clear-cutting edge, C—clear-cut site; M—the same monitoring sites re-sampled (between 2 and 5 years after clear-cutting).
Forests 14 02125 g002
Figure 3. Epilobium angustifolium percentage cover (%) trends. Notations for ecotone complex zones: F—forest, FE—forest edge, CE—clear-cutting edge, C—clear-cut site; M—the same monitoring sites re-sampled (between 2 and 5 years after clear-cutting).
Forests 14 02125 g003
Figure 4. Ordination plot for subplot variation by percentage covers of vascular plant species: (a)—all EC zones together (1—F, 2—FE, 3—CE, 4—C), (b)—EC zones shown individually (same notations). Axis loadings: 1st—50.6%, 3rd—14.7%.
Forests 14 02125 g004
Figure 5. Ordination plot for sampling subplot variation by percentage covers of vascular plant species (1—F, 2—FE, 3—CE, 4—C). Symbol size in each plot represents the species abundance (the larger the symbol, the higher the percentage cover of the species in the subplot).
Forests 14 02125 g005
Table 1. Characteristics of the herb–subshrub layer in the EC (averaged data).
EC ZoneTotal Number of Vascular PlantsMean Number of Vascular Plant Species Per SubplotPielou’s IndexPercentage Shares of Plant Groups in the Herb–Subshrub Layer
SubshrubsGrassesForbs
F10.7 ± 0.4 a4.9 ± 0.1 a0.48 ± 0.01 a88.2 ± 1.4 a1.6 ± 0.2 a10.2 ± 1.4 ab
FE7.4 ± 0.4 b3.8 ± 0.2 b0.49 ± 0.02 a91.7 ± 1.4 a1.4 ± 0.5 a6.9 ± 1.2 a
CE8.7 ± 0.4 c4.6 ± 0.2 a0.54 ± 0.02 b77.4 ± 2.6 b10.0 ± 1.8 b12.6 ± 1.8 b
C10.6 ± 0.5 a4.7 ± 0.2 a0.64 ± 0.02 c48.5 ± 3.1 c26.4 ± 2.8 c25.0 ± 2.8 c
Note: letters indicate differences (p < 0.05) between means in different EC zones (based on the Kruskal–Wallis test, and post hoc pairwise comparison Dunn’s test).
Table 2. Analysis of variance results for the effect of different factors on the abundance of ground vegetation dominants and subshrub height across EC zones.
Zone of the Ecotone Complex
F—ForestFE—Forest EdgeCE—Clear-Cutting EdgeC—Clear-Cut Site
χ2dfp-Valueχ2dfp-Valueχ2dfp-Valueχ2dfp-Value
Bilberry percentage cover
time since logging5.1440.278.7440.0733.244<0.00115.8640.003
aspect50.983<0.00129.033<0.00146.183<0.001* 14.8530.002
microrelief12.4530.0069.9730.024.4130.2243.6430.30
coniferous regeneration13.5720.0016.2620.0434.272<0.00167.002<0.001
deciduous regeneration17.262<0.0010.9220.631.9320.384* 27.532<0.001
overgrown downed deadwood3.76920.1514.252<0.0010.1620.9244.0720.13
fresh downed deadwood13.4220.00137.712<0.0013.9720.141.5420.46
plant litter7.0620.0316.021<0.001* 34.202<0.001* 63.022<0.001
PC of subshrubs- - - -
PC of grasses* 8.6310.003* 11.631<0.001* 7.9720.020.5820.75
PC of forbs0.6420.7211.0220.00431.672<0.0013.5520.17
Cowberry percentage cover
time since logging54.604<0.00141.764<0.00161.504<0.00199.394<0.001
aspect11.0430.0128.273<0.00132.663<0.001204.003<0.001
microrelief20.213<0.0012.4530.4816.1330.00144.583<0.001
coniferous regeneration3.3720.181.0320.590.3920.8213.992<0.001
deciduous regeneration2.2820.31850.0920.950.9020.642.3420.31
overgrown downed deadwood0.8920.640.2220.890.1620.920.7620.68
fresh downed deadwood12.7520.0022.7820.255.8120.0548.0820.02
plant litter6.8820.030.1510.6929.482<0.001135.352<0.001
PC of subshrubs- - - -
PC of grasses2.5910.110.7110.3921.062<0.00126.942<0.001
PC of forbs18.542<0.00119.622<0.0018.0920.021.7220.42
Wavy hair-grass percentage cover
time since logging* 72.274<0.001* 33.584<0.00136.734<0.001144.044<0.001
aspect* 54.703<0.001* 76.293<0.0015.3330.15119.773<0.001
microrelief5.2830.152.3130.513.6630.306.5830.09
coniferous regeneration2.6420.26* 6.3920.0418.632<0.0014.5120.10
deciduous regeneration2.0220.362.4220.290.5220.773.1920.20
overgrown downed deadwood1.0920.57* 8.3320.024.7320.092.9120.23
fresh downed deadwood* 27.592<0.001* 30.652<0.00113.3520.00112.1520.002
plant litter* 34.132<0.001* 35.471<0.0016.8520.0384.572<0.001
PC of subshrubs4.6620.090.6720.71* 22.812<0.00144.302<0.001
PC of grasses- - - -
PC of forbs0.3220.85* 13.0020.00214.532<0.0013.2820.19
Fireweed percentage cover
time since logging* 11.7240.02** * 31.674<0.001109.214<0.001
aspect5.9030.11 * 8.7630.0360.753<0.001
microrelief6.3930.09 4.8330.1822.513<0.001
coniferous regeneration0.6020.74 6.020.0520.862<0.001
deciduous regeneration0.1620.92 0.7920.671.8120.40
overgrown downed deadwood0.2520.87 0.6120.74* 11.9920.002
fresh downed deadwood0.1720.91 7.2020.034.6320.09
plant litter1.0620.58 5.4620.06* 11.6120.003
PC of subshrubs0.3020.85 3.8420.1410.6220.005
PC of grasses1.4910.22 * 15.622<0.001* 20.122<0.001
PC of forbs- - -
Average height of bilberry shoots
time since logging22.723<0.00136.613<0.0018.7230.0333.713<0.001
aspect67.973<0.00132.393<0.00180.973<0.0012.9230.40
microrelief3.8930.277.4930.061.6930.648.1630.04
coniferous regeneration0.1220.940.2120.8927.632<0.00111.1120.004
deciduous regeneration15.162<0.0015.6720.0611.6420.00326.592<0.001
overgrown downed deadwood5.4320.061.8520.395.8320.051.1720.55
fresh downed deadwood1.1320.567.8720.023.3120.191.7420.42
plant litter14.072<0.0011.5510.464.6620.092.7020.26
PC of subshrubs98.321<0.00129.891<0.0019.6420.00241.782<0.001
PC of grasses3.3110.075.0910.0210.4420.00532.092<0.001
PC of forbs13.2320.0012.2020.3320.642<0.0012.2820.32
Average height of cowberry shoots
time since logging146.563<0.00199.463<0.00133.693<0.001140.263<0.001
aspect110.203<0.00137.283<0.00191.903<0.00118.713<0.001
microrelief1.0130.799.5730.021.4530.6913.6730.003
coniferous regeneration1.5920.456.6220.0423.992<0.00128.782<0.001
deciduous regeneration8.1020.022.8120.2411.6820.00334.592<0.001
overgrown downed deadwood1.6020.455.1120.081.5520.461.2420.54
fresh downed deadwood20.062<0.0011.3220.521.3120.528.6620.01
plant litter51.122<0.0010.5010.789.3620.0096.4820.04
PC of subshrubs31.311<0.00124.711<0.00128.642<0.00179.722<0.001
PC of grasses0.0110.935.5510.023.8720.147.0620.03
PC of forbs5.5220.068.7720.0114.282<0.00130.632<0.001
Note: p-values below 0.05 are in bold type; * within the percentage cover (PC) visual estimation error; ** fireweed not found in this EC zone.
Table 3. Mean percentage cover and shoot height of bilberry in the ecotone complex at different times after clear-cutting.
EC ZoneTime Since Clear-Cutting
2 Years (M)3 Years (M)4 Years (M)5 Years (M)5 Years10 Years
Percentage cover of bilberry:
F19.3 ± 1.0 a
(100%)
20.1 ± 1.6 a
(100%)
19.2 ± 1.4 a
(100%)
23.3 ± 1.4 a
(100%)
21.7 ± 1.3 a
(100%)
22.4 ± 1.4 a
(100%)
FE12.0 ± 1.2 b
(62%)
12.7 ± 1.7 b
(63%)
11.7 ± 1.4 b
(61%)
17.1 ± 1.6 b
(73%)
9.5 ± 1.3 b
(44%)
16.6 ± 1.7 b
(74%)
CE6.3 ± 0.8 c
(33%)
7.2 ± 1.2 c
(36%)
6.7 ± 1.0 c
(35%)
8.3 ± 1.0 c
(36%)
8.2 ± 1.1 b
(38%)
14.1 ± 1.4 b
(63%)
C2.6 ± 0.4 d
(13%)
3.6 ± 0.6 c
(18%)
4.2 ± 0.7 c
(22%)
5.1 ± 0.6 c
(22%)
3.1 ± 0.4 c
(14%)
6.8 ± 0.8 c
(30%)
Height of bilberry shoots:
F– *17.8 ± 0.4 a
(100%)
15.6 ± 0.4 a
(100%)
14.8 ± 0.3 a
(100%)
16.7 ± 0.3 a
(100%)
17.1 ± 0.4 a
(100%)
FE15.4 ± 0.6 b
(86%)
14.0 ± 0.4 b
(76%)
12.1 ± 0.5 b
(82%)
12.5 ± 0.3 b
(75%)
14.1 ± 0.4 b
(82%)
CE11.9 ± 0.6 c
(67%)
10.4 ± 0.5 c
(67%)
10.0 ± 0.4 c
(68%)
12.7 ± 0.5 b
(76%)
12.4 ± 0.4 c
(75%)
C8.8 ± 0.4 d
(49%)
9.2 ± 0.3 c
(59%)
8.7 ± 0.2 d
(59%)
9.6 ± 0.3 c
(57%)
11.7 ± 0.5 c
(68%)
Note: indicating mean and standard error of the mean; percentages in parenthesis are the levels relative to the forest zone. Letter “M” in years since logging indicates the same monitoring sites re-sampled (between 2 and 5 years after clear-cutting). Letter indexes refer to significant differences (p < 0.05) in the parameter among EC zones (Kruskal–Wallis test, post hoc pairwise comparison Dunn’s test). * No data.
Table 4. Mean percentage cover and shoot height of cowberry in the ecotone complex at different times after clear-cutting.
EC ZoneTime Since Clear-Cutting
2 Years (M)3 Years (M)4 Years (M)5 Years (M)5 Years10 Years
Percentage cover of cowberry:
F14.1 ± 0.7 a
(100%)
19.7 ± 1.3 a
(100%)
25.1 ± 1.3 a
(100%)
27.4 ± 1.4 a
(100%)
13.4 ± 0.8 a
(100%)
21.4 ± 1.1 a
(100%)
FE17.3 ± 1.1 b
(123%)
24.8 ± 2.1 b
(126%)
32.4 ± 1.9 b
(129%)
31.7 ± 2.0 ab
(116%)
16.5 ± 1.1 b
(123%)
24.7 ± 1.9 a
(115%)
CE16.0 ± 1.3 ab
(113%)
29.6 ± 2.6 b
(150%)
35.8 ± 2.4 b
(143%)
34.2 ± 2.6 b
(125%)
14.1 ± 1.3 ab
(105%)
14.3 ± 1.3 b
(67%)
C8.0 ± 0.7 c
(57%)
15.2 ± 1.2 c
(77%)
24.3 ± 1.5 a
(97%)
26.5 ± 1.5 a
(97%)
10.9 ± 0.6 c
(81%)
12.9 ± 1.0 b
(60%)
Height of cowberry shoots:
F– *14.9 ± 0.3 a
(100%)
13.3 ± 0.3 a
(100%)
12.3 ± 0.3 a
(100%)
12.1 ± 0.2 a
(100%)
16.1 ± 0.3 a
(100%)
FE14.1 ± 0.4 a
(95%)
12.2 ± 0.4 b
(92%)
10.5 ± 0.4 b
(85%)
9.6 ± 0.2 b
(79%)
13.2 ± 0.4 b
(82%)
CE11.1 ± 0.6 b
(74%)
9.6 ± 0.4 c
(72%)
8.5 ± 0.3 c
(69%)
8.7 ± 0.3 c
(72%)
10.6 ± 0.4 c
(66%)
C8.2 ± 0.3 c
(55%)
8.8 ± 0.2 c
(66%)
8.4 ± 0.3 c
(68%)
6.7 ± 0.1 d
(55%)
11.0 ± 0.3 c
(68%)
Note: notations as in Table 3.
Disclaimer/Publisher’s Note: The statements, opinions and data contained in all publications are solely those of the individual author(s) and contributor(s) and not of MDPI and/or the editor(s). MDPI and/or the editor(s) disclaim responsibility for any injury to people or property resulting from any ideas, methods, instructions or products referred to in the content.

