
Changes in the Number of Vascular Plant Species during Reforestation of Clearcut Forests

Abstract
:1. Introduction
2. Materials and Methods
2.1. Data Collection
2.2. Data Analysis
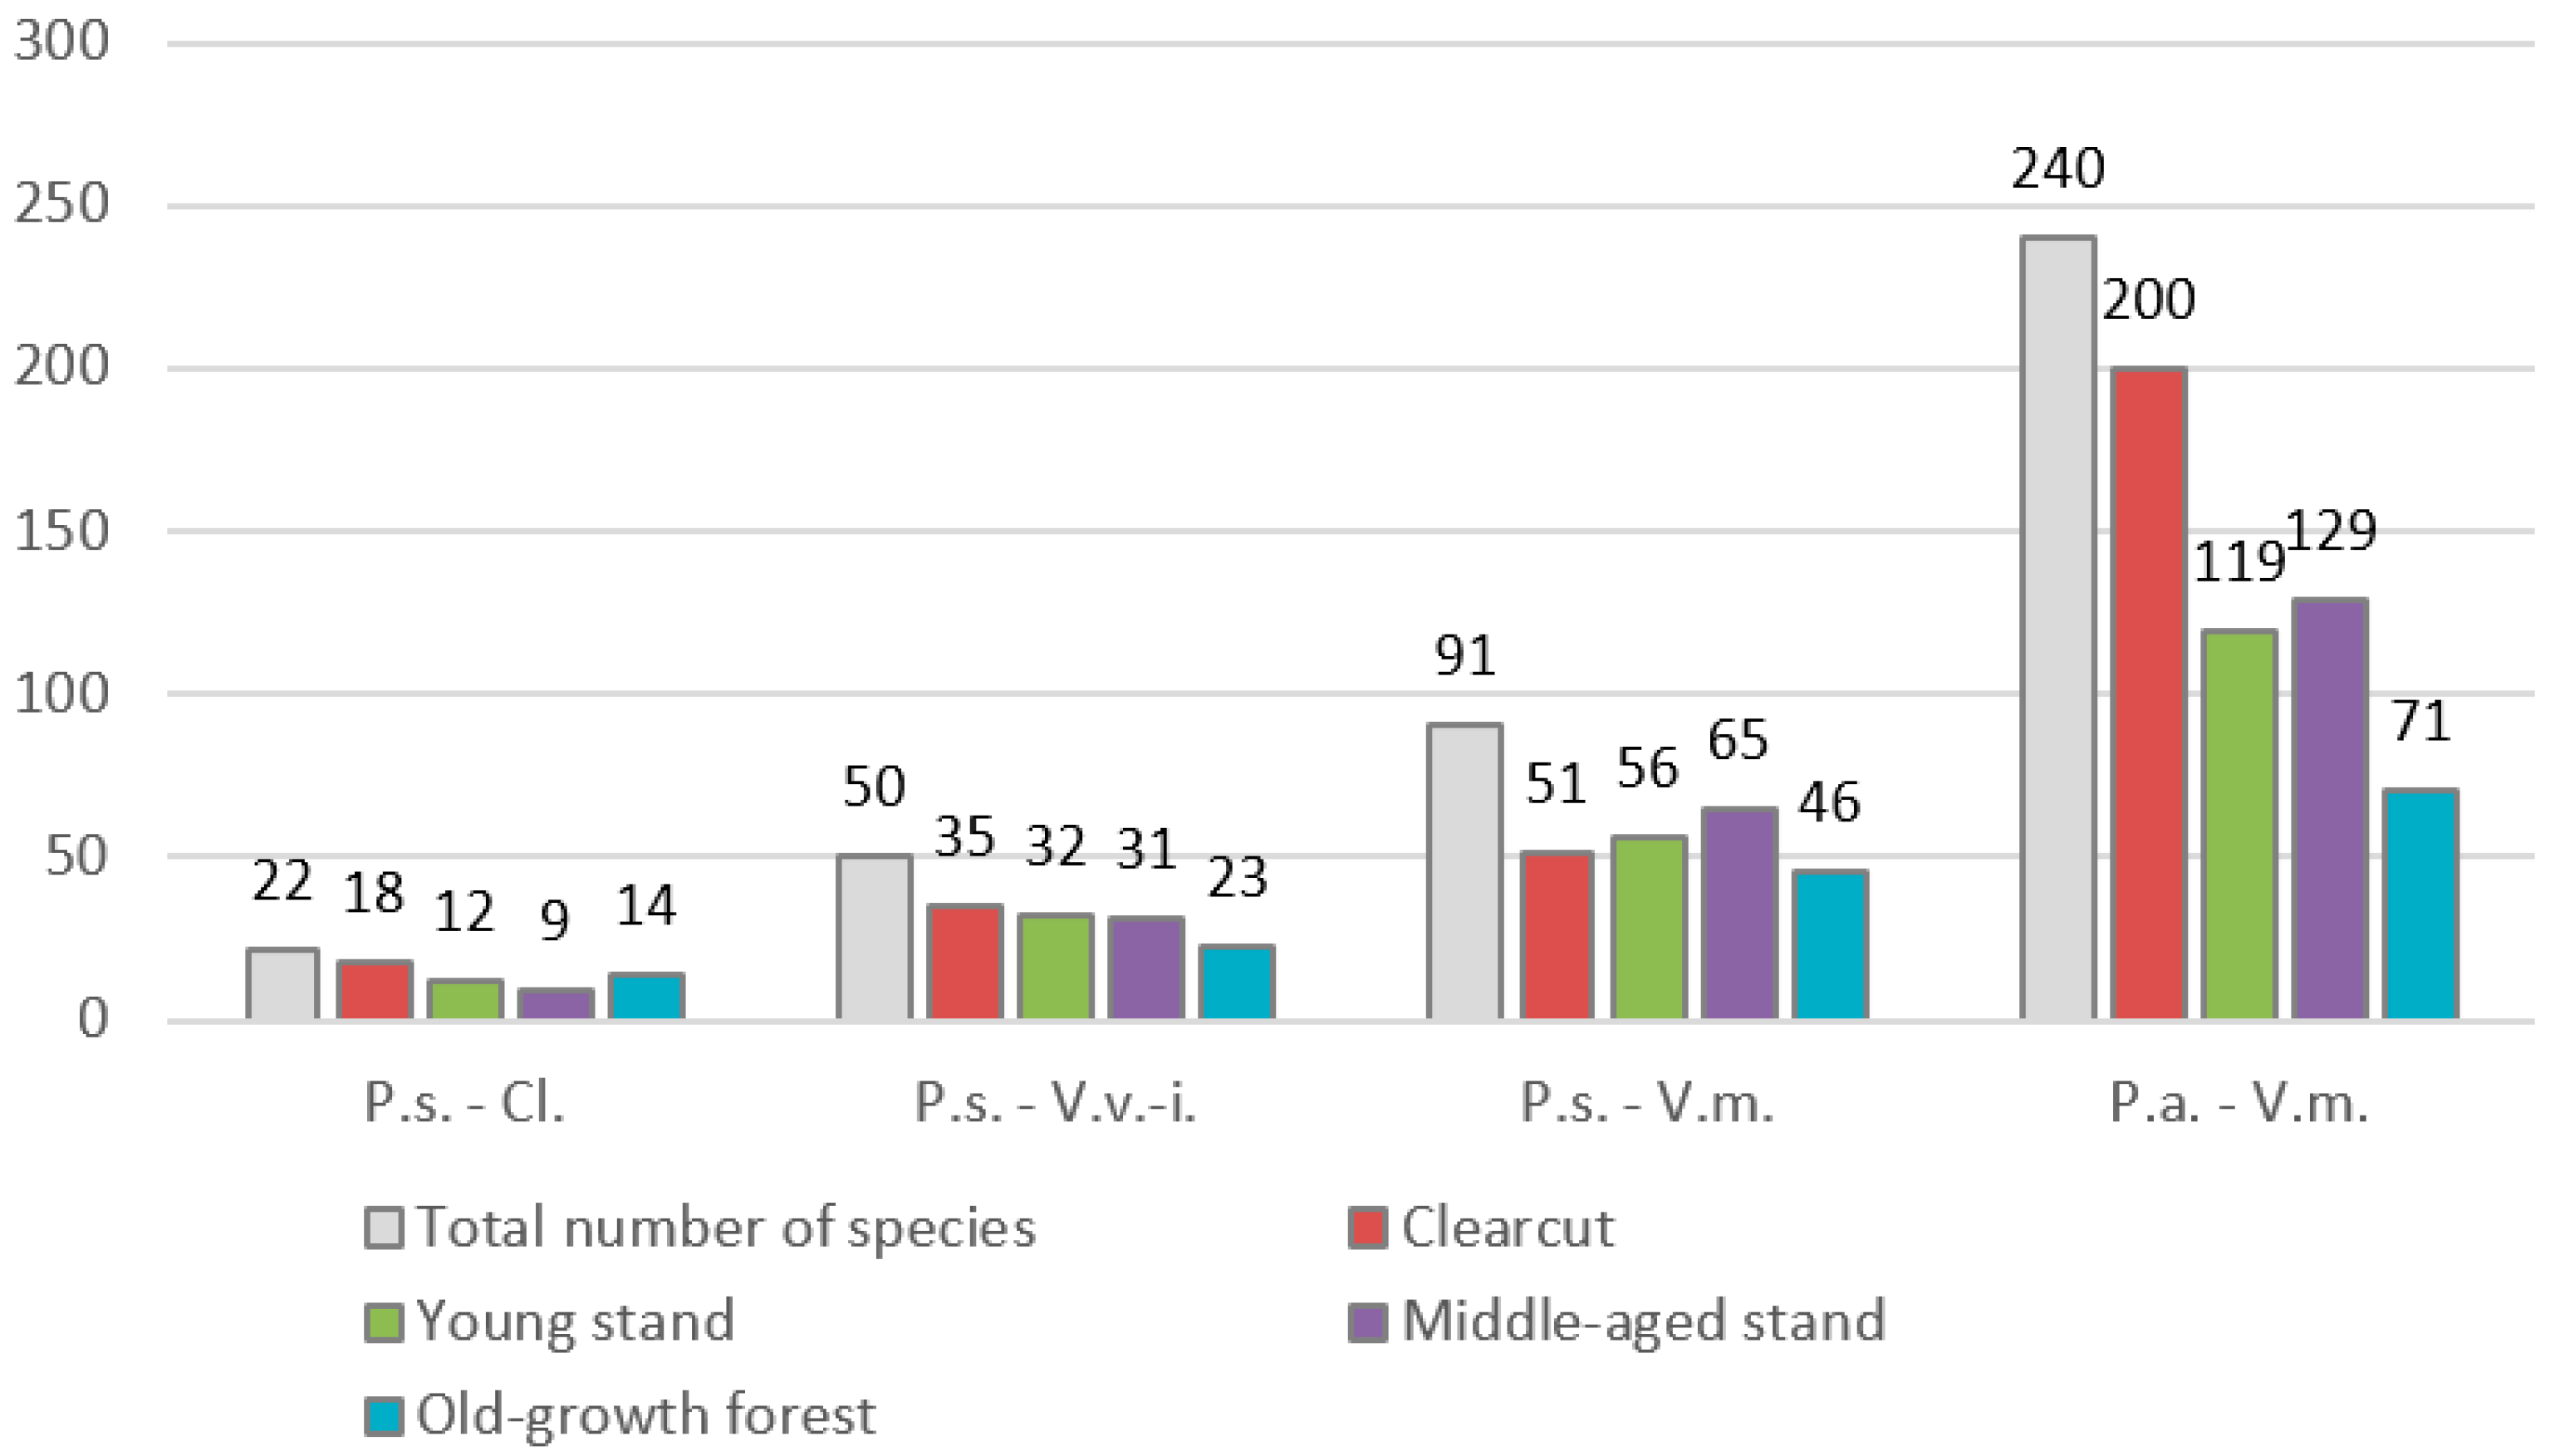
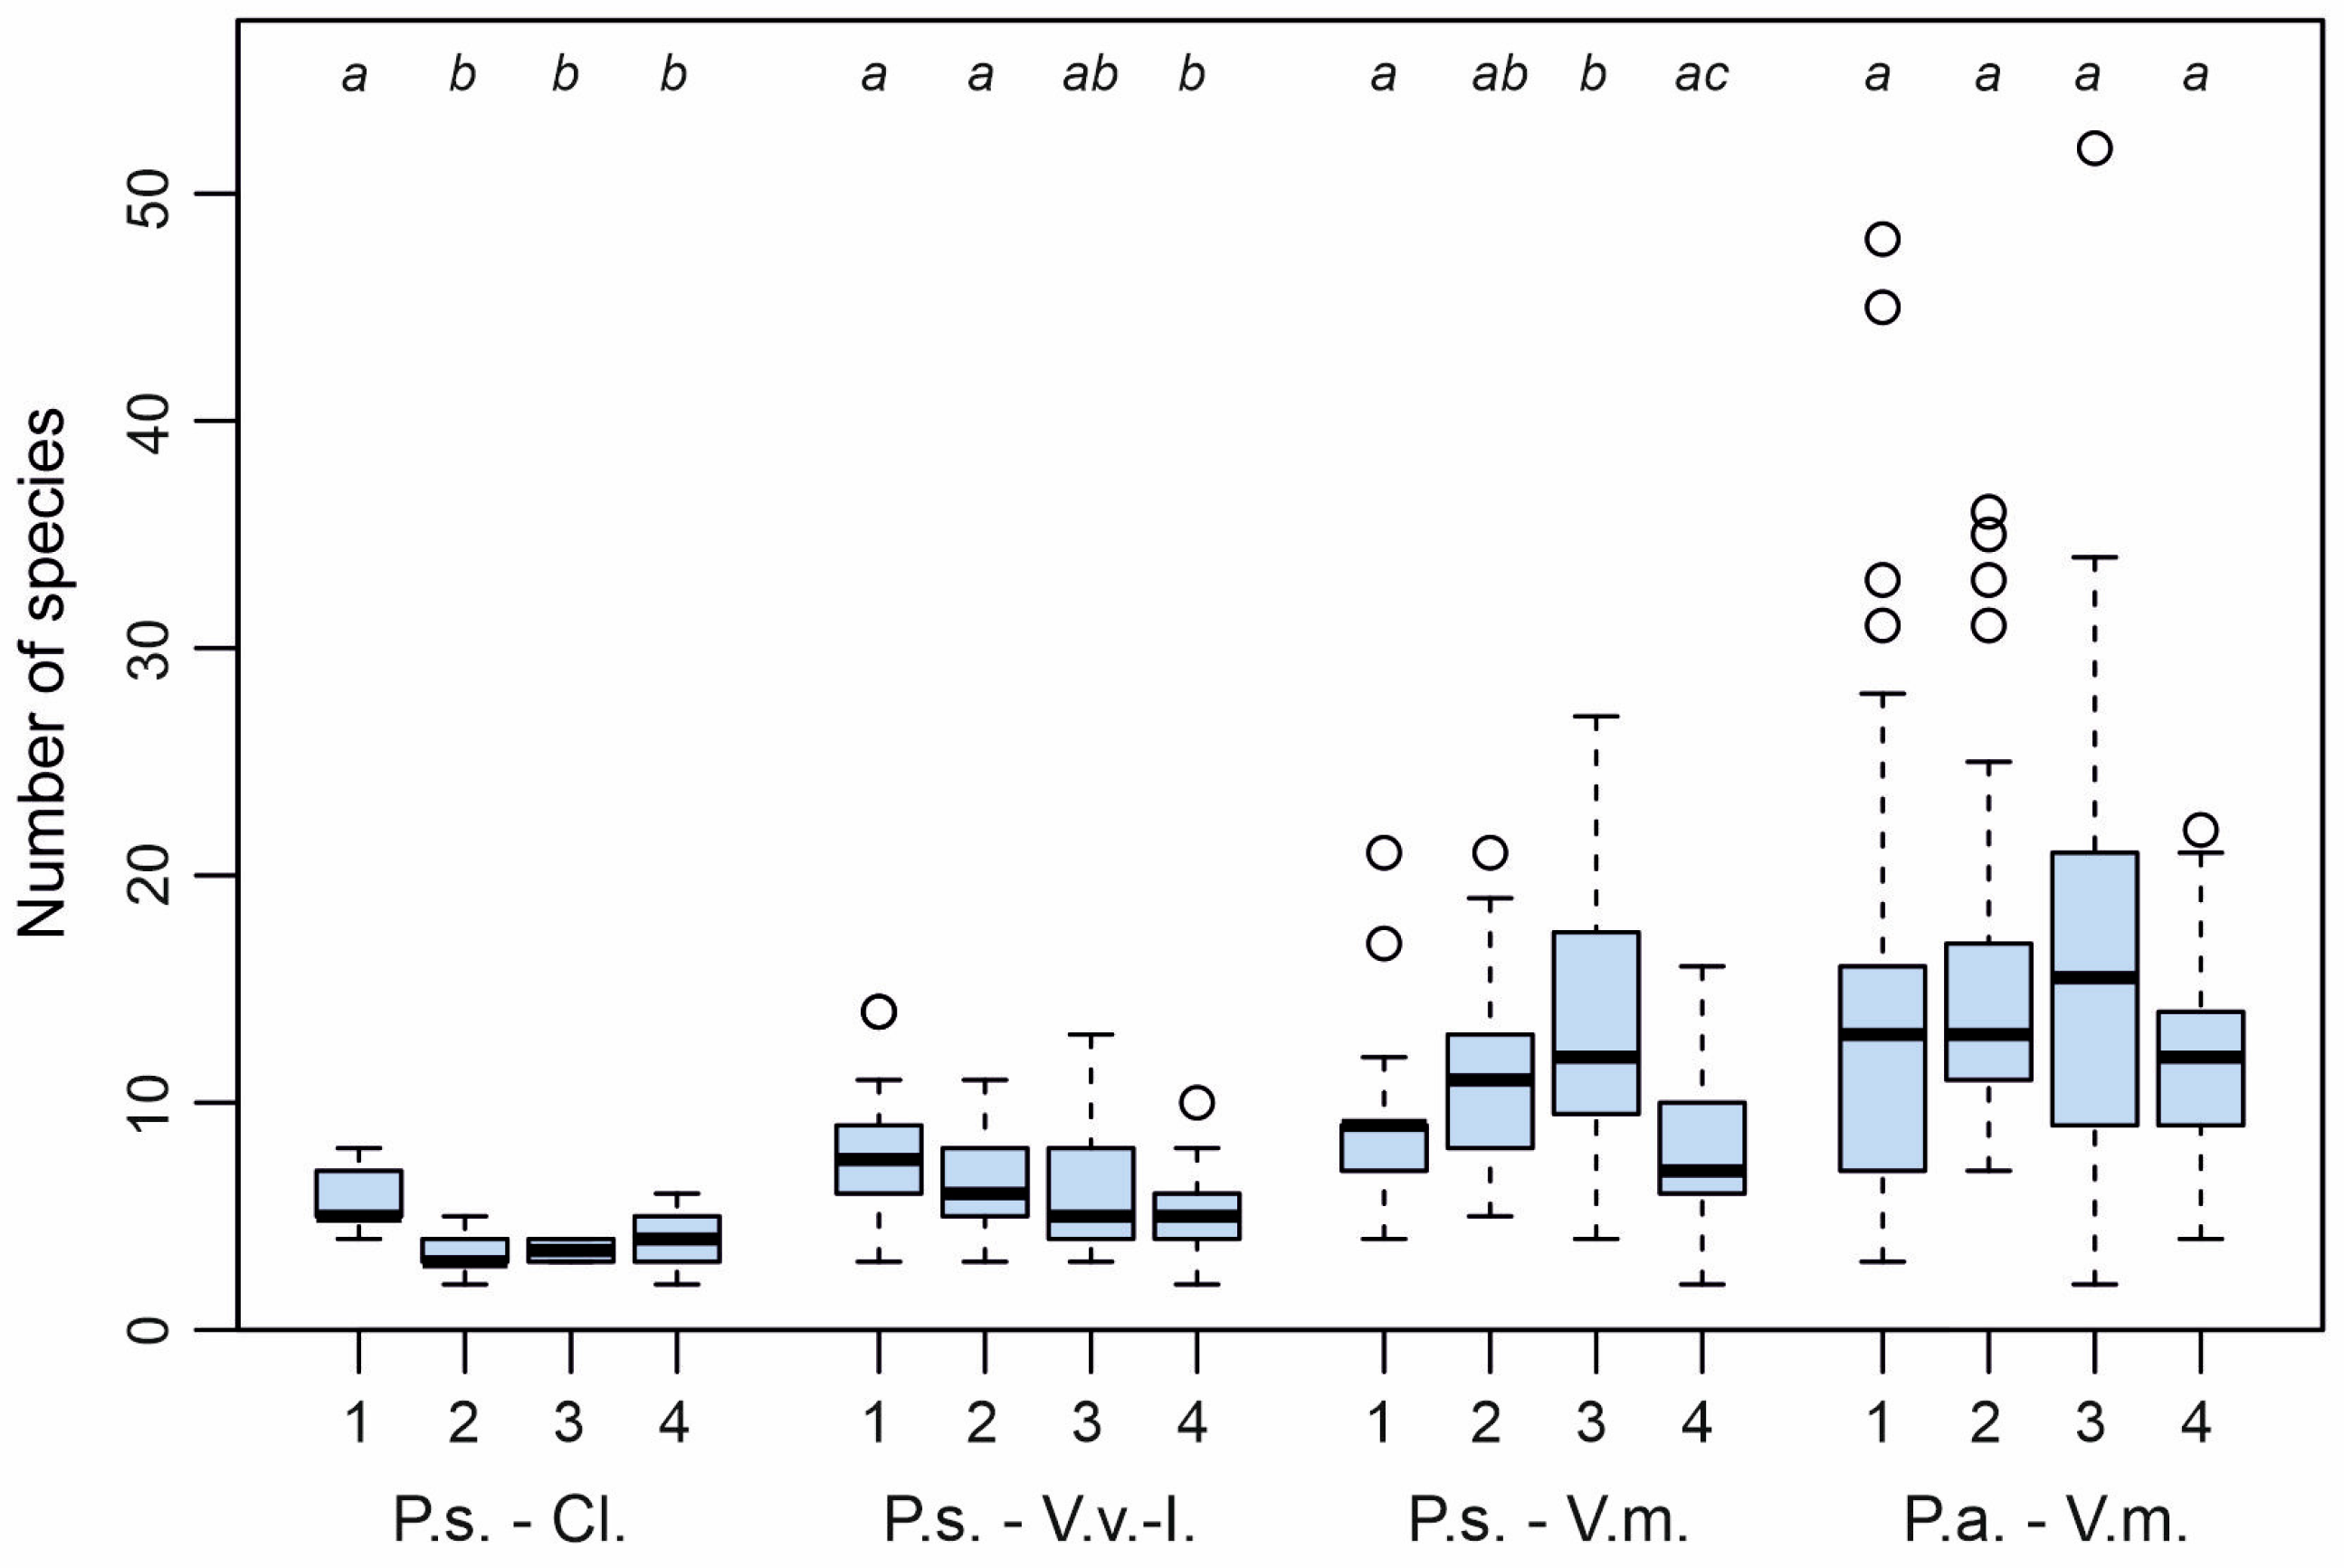
3. Results
4. Discussion
5. Conclusions
Author Contributions
Funding
Data Availability Statement
Conflicts of Interest
References
- Secretariat of the Convention on Biological Diversity. Global Biodiversity Outlook 3; Secretariat of the Convention on Biological Diversity: Montreal, QC, Canada, 2010; 94p.
- Brondizio, S.; Settele, J.; Diaz, S.; Ngo, H.T. (Eds.) Global Assessment Report on Biodiversity and Ecosystem Services of the Intergovernmental Science-Policy Platform on Biodiversity and Ecosystem Services; IPBES: Bonn, Germany, 2019. [Google Scholar] [CrossRef]
- Burton, P.; Bergeron, Y.; Bogdanski, B.; Juday, G.; Kuuluvainen, T.; Mcafee, B.; Ogden, A.; Teplyakov, V.; Alfaro, R.; Francis, D.A.; et al. Sustainability of Boreal Forests and Forestry in a Changing Environment. In Forests and Society—Responding to Global Drivers of Change; IUFRO World, Series; Mery, G., Katila, P., Galloway, G., Alfaro, R.I., Kanninen, M., Lobovikov, M., Varjo, J., Eds.; International Union of Forest Research Organizations: Vienna, Austria, 2010; Volume 25, pp. 247–282. [Google Scholar]
- Qiao, X.; Hautier, Y.; Geng, Y.; Wang, S.; Wang, J.; Zhang, N.; Zhang, Z.; Zhang, C.; Zhao, X.; von Gadow, K. Biodiversity contributes to stabilizing ecosystem productivity across spatial scales as much as environmental heterogeneity in a large temperate forest region. For. Ecol. Manag. 2023, 529, 120695. [Google Scholar] [CrossRef]
- Tikkanen, O.P.; Matero, J.; Mönkkönen, M.; Juutinen, A.; Kouki, J. To thin or not to thin: Bio-economic analysis of two alternative practices to increase amount of coarse woody debris in managed forests. Eur. J. For. Res. 2012, 131, 1411–1422. [Google Scholar] [CrossRef]
- Hunault-Fontbonne, J.; Eyvindson, K. Bridging the gap between forest planning and ecology in biodiversity forecasts: A review. Ecol. Indic. 2023, 154, 110620. [Google Scholar] [CrossRef]
- Isaev, A.S.; Bartalev, S.A.; Lupyan, E.A.; Lukina, N.V. Earth observations from satellites as a unique instrument to monitor Russia’s forests. Her. Russ. Acad. Sci. 2014, 84, 413–419. (In Russian) [Google Scholar] [CrossRef]
- Ministry of Natural Resources and Environment of the Republic of Karelia. State Report on the Environment of the Republic of Karelia in 2021; Gromtsev, A.N., Ed.; Ministry of Natural Resources and Environment of the Republic of Karelia: Petrozavodsk, Russia, 2022; 263p. Available online: http://resources.krc.karelia.ru/krc/doc/presentations/gosdoklad-rk-2021.pdf (accessed on 23 September 2023). (In Russian)
- Djupström, L.B.; Perhans, K.; Weslien, J.; Schroeder, L.M.; Gustafsson, L.; Wikberg, S. Co-variation of lichens, bryophytes, saproxylic beetles and dead wood in Swedish boreal forests. Syst. Biodivers. 2010, 8, 247–256. [Google Scholar] [CrossRef]
- Gao, T.; Nielsen, A.B.; Hedblom, M. Reviewing the strength of evidence of biodiversity indicators for forest ecosystems in Europe. Ecol. Indic. 2015, 57, 420–434. [Google Scholar] [CrossRef]
- Tonteri, T. Species richness of boreal understorey forest vegetation in relation to site type and successional factors. Ann. Zool. Fennici 1994, 31, 53–60. [Google Scholar]
- Ulanova, N.G. Main Trends of biodiversity dynamics after natural and anthropogenic “catastrophes” in spruce forests of the European Part of Russia. In Ecology and Geography of Plants and Plant Communities; Ural State University: Ekaterinburg, Russia, 2018; pp. 968–971. (In Russian) [Google Scholar]
- Kryshen, A.M. Plant Communities of Clearcuts in Karelia; Nauka: Moscow, Russia, 2006; 259p. (In Russian) [Google Scholar]
- Gustafsson, L.; Hannerz, M.; Koivula, M.; Shorohova, E.; Vanha-Majamaa, I.; Weslien, J. Research on retention forestry in Northern Europe. Ecol. Process. 2020, 9, 3. [Google Scholar] [CrossRef]
- Tikhonova, T.V. Logging activities in the north: Assessing the impact on biodiversity conservation. Sev. Rynok Form. Ekon. Poryadka [North Mark. Form. Econ. Order] 2023, 26, 24–37. [Google Scholar] [CrossRef]
- Kravchenko, A.V.; Gnatiuk, E.P.; Kryshen, A.M. Anthropogenic transformation of the flora in intensively managed forest areas. In Anthropogenic Transformation of Taiga Ecosystems in Europe: Environmental, Resource and Economic Implications, Proceedings of the International Conference, Petrozavodsk, Russia, 23–25 November 2004; KarNC RAN: Petrozavodsk, Russia, 2004; pp. 74–84. (In Russian) [Google Scholar]
- Federal Law “On Environmental Protection” of 10.01.2002 N 7-FZ. Available online: http://pravo.gov.ru/proxy/ips/?docbody=&nd=102074303 (accessed on 23 September 2023).
- Forest Code of the Russian Federation of 04.12.2006 N 200-FZ (ed. of 04.08.2023). Available online: http://pravo.gov.ru/proxy/ips/?docbody=&nd=102110364 (accessed on 23 September 2023).
- Qiao, X.; Geng, Y.; Zhang, C.; Han, Z.; Zhang, Z.; Zhao, X.; von Gadow, K.; Simova, I. Spatial asynchrony matters more than alpha stability in stabilizing ecosystem productivity in a large temperate forest region. Glob. Ecol. Biogeogr. 2022, 31, 1133–1146. [Google Scholar] [CrossRef]
- Fedrowitz, K.; Koricheva, J.; Baker, S.C.; Lindenmayer, D.B.; Palik, B.; Rosenvald, R.; Beese, W.; Franklin, J.F.; Kouki, J.; Macdonald, E.; et al. REVIEW: Can retention forestry help conserve biodiversity? A meta-analysis. J. Appl. Ecol. 2014, 51, 1669–1679. [Google Scholar] [CrossRef]
- Genikova, N.V.; Gnatyuk, E.P.; Kryshen’, A.M.; Ryzhkova, N.I. Formation of the composition of plant communities in an anthropogenically fragmented landscape at the southern/middle taiga interface. Proc. Karelian Sci. Cent. Russ. Acad. Sci. 2014, 2, 27–35. [Google Scholar]
- Coote, L.; Dietzsch, A.C.; Wilson, M.W.; Graham, C.T.; Fuller, L.; Walsh, A.T.; Irwin, S.; Kelly, D.L.; Mitchell, F.J.G.; Kelly, T.C.; et al. Testing indicators of biodiversity for plantation forests. Ecol. Indic. 2013, 32, 107–115. [Google Scholar] [CrossRef]
- Bartels, S.F.; Macdonald, S.E. Dynamics and recovery of forest understory biodiversity over 17 years following varying levels of retention harvesting. J. Appl. Ecol. 2023, 60, 725–736. [Google Scholar] [CrossRef]
- Johnson, E.A.; Miyanishi, K. Testing the assumptions of chronosequencesin succession. Ecol. Lett. 2008, 11, 419–431. [Google Scholar] [CrossRef]
- Zinko, U.; Seibert, J.; Dynesius, M.; Nilsson, C. Plant species numbers predicted by a topography-based groundwater flow index. Ecosystems 2005, 8, 430–441. [Google Scholar] [CrossRef]
- Echiverri, L.; Macdonald, E. Utilizing a topographic moisture index to characterize understory vegetation patterns in the boreal forest. For. Ecol. Manag. 2019, 447, 35–52. [Google Scholar] [CrossRef]
- Seymour, R.S.; Hunter, M.L. Principles of Ecological Forestry. In Maintaining Biodiversity in Forest Ecosystems; Hunter, M.L., Ed.; Cambridge University Press: Cambridge, UK, 1999; pp. 22–62. [Google Scholar] [CrossRef]
- Spence, J.R. The new boreal forestry: Adjusting timber management to accommodate biodiversity. Trends Ecol. Evol. 2001, 16, 591–593. [Google Scholar] [CrossRef]
- Koivula, M.; Vanha-Majamaa, I. Experimental evidence on biodiversity impacts of variable retention forestry, prescribed burning, and deadwood manipulation in Fennoscandia. Ecol. Process. 2020, 9, 11. [Google Scholar] [CrossRef]
- Frelich, L.E.; Jõgiste, K.; Stanturf, J.A.; Parro, K.; Baders, E. Natural Disturbances and Forest Management: Interacting Patterns on the Landscape. In Ecosystem Services from Forest Landscapes; Perera, A., Peterson, U., Pastur, G., Iverson, L., Eds.; Springer: Cham, Switzerland, 2018. [Google Scholar] [CrossRef]
- Beese, W.J.; Deal, J.; Dunsworth, B.G.; Mitchell, S.J.; Philpott, T.J. Two decades of variable retention in British Columbia: A review of its implementation and effectiveness for biodiversity conservation. Ecol. Process. 2019, 8, 33. [Google Scholar] [CrossRef]
- Kuuluvainen, T.; Aakala, T. Natural Forest Dynamics in Boreal Fennoscandia: A Review and Classification. Silva Fenn. 2011, 45, 823–841. [Google Scholar] [CrossRef]
- Ananyev, V.A.; Pekkoev, A.N.; Grabovik, S.I.; Moshnikov, S.A.; Medvedeva, M.V.; Ruokolainen, A.V.; Kolesnikova, V.M.; Grabeklis, V.V. Biodiversity dynamics in primary mid-taiga spruce forests after total windthrow in the Vodlozersky national park, Russia. Nat. Conserv. Res. 2023, 8, 75–93. [Google Scholar] [CrossRef]
- Ackzell, L. Natural regeneration on planted clear-cuts in boreal Sweden. Scand. J. For. Res. 1994, 9, 245–250. [Google Scholar] [CrossRef]
- Gryaz’kin, A.V.; Novikova, N.A.; Novikov, Y.A. Features of Natural Birch Regeneration in Cutting. Lesn. Zhurnal 2016, 4, 81–88. [Google Scholar] [CrossRef]
- Fleischer, P.; Koreň, M. Selected forest soil properties after the windfall 2004 in the Tatra Mts. In Sustainable Development and BioclimateProceedings, Stará Lesná, 5–8 October 2009; Pribullová, A., Bičarová, S., Eds.; Slovak Academy of Sciences: Staré Mesto, Slovakia, 2009; pp. 77–78. [Google Scholar]
- Vašutová, M.; Edwards-Jonášová, M.; Veselá, P.; Effenberková, L.; Fleischer, P.; Cudlín, P. Management regime is the most important factor influencing ectomycorrhizal species community in Norway spruce forests after windthrow. Mycorrhiza 2018, 28, 221–233. [Google Scholar] [CrossRef]
- Gibb, H.; Pettersson, R.B.; Hilszczanski, J.; Ball, J.P.; Johansson, T.; Atlegrim, O.; Danell, K. Conservation-oriented forestry and early successional saproxylic beetles: Responses of functional groups to manipulated dead wood substrates. Biol. Conserv. 2006, 129, 437–450. [Google Scholar] [CrossRef]
- Urbanovičová, V.; Miklisová, D.; Kováč, Ľ. Forest disturbance enhanced the activity of epedaphic collembola in windthrown stands of the High Tatra mountains. J. Mt. Sci. 2014, 11, 449–463. [Google Scholar] [CrossRef]
- Sterzyńska, M.; Shrubovych, J.; Tajovský, K.; Čuchta, P.; Starý, J.; Kaňa, J.; Smykla, J. Responses of soil microarthropod taxon (Hexapoda: Protura) to natural disturbances and management practices in forest-dominated subalpine lake catchment areas. Sci. Rep. 2020, 10, 5572. [Google Scholar] [CrossRef]
- Fischer, A.; Lindner, M.; Abs, C.; Lasch, P. Vegetation dynamics in central european forest ecosystems (near-natural as well as managed) after storm events. Folia Geobot. 2002, 37, 17–32. [Google Scholar] [CrossRef]
- Fischer, A. Long term vegetation development in Bavarian Mountain Forest ecosystems following natural destruction. Vegetatio 1992, 103, 93–104. [Google Scholar] [CrossRef]
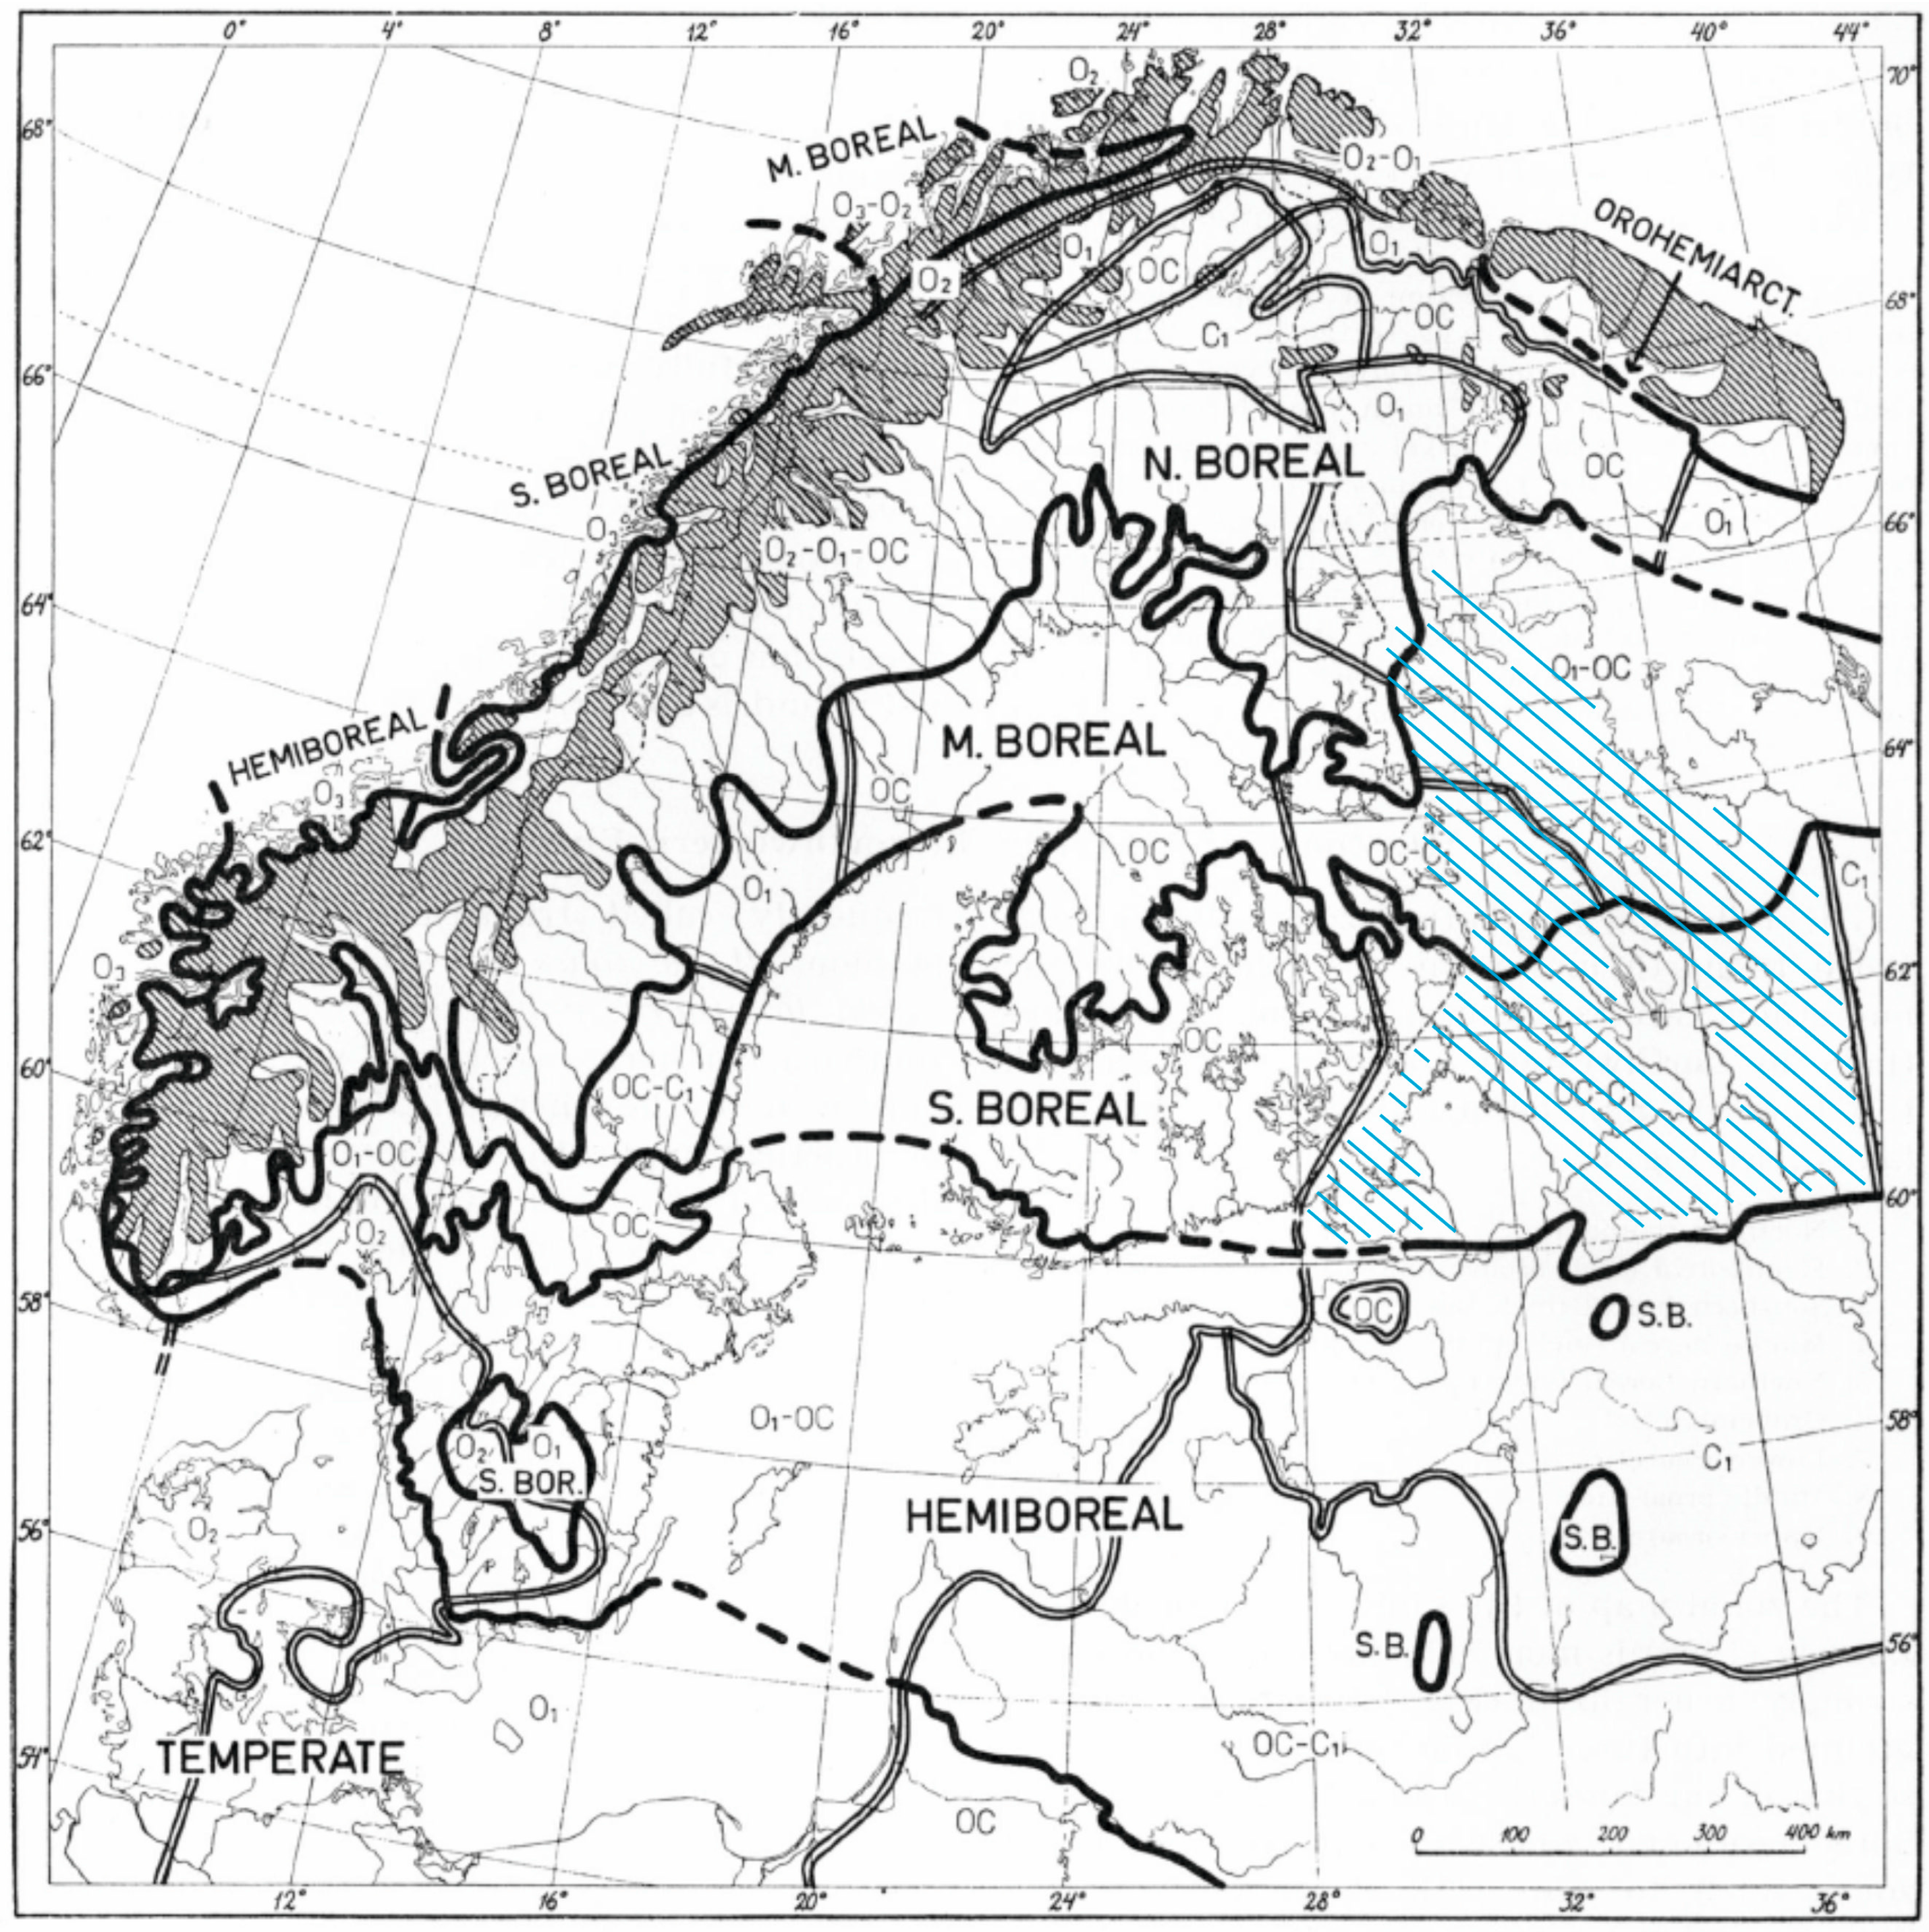
- Geobotanical Zoning of the Nechernozem Region of the European Part of the RSFSR; Aleksandrova, V.D.; Yurkovskaya, T.K. (Eds.) Nauka Publ.: Saint Petersburg, Russia, 1989; 64p. (In Russian) [Google Scholar]
- Ahti, T.; Hamet-Ahti, L.; Jalas, J. Vegetation zones and their sections in northwestern Europe. Ann. Bot. Fenn. 1968, 5, 169–211. [Google Scholar]
- EBFVD, GIVD ID: EU-00-027. Available online: http://euroveg.org/evadatabase-participating-databases (accessed on 1 September 2023).
- Jašková, A.; Braslavskaya, T.Y.; Tikhonova, E.; Paal, J.; Rūsiņa, S.; Laiviņš, M.; Kucherov, I.B.; Genikova, N.V.; Knollová, I.; Chernenkova, T.V.; et al. European Boreal Forest Vegetation Database. Phytocoenologia 2020, 50, 79–92. [Google Scholar] [CrossRef]
- European Commission, Directorate-General for Environment. Corine Biotopes Manual—A Method to Identify and Describe Consistently Sites of Major Importance for Nature Conservation; Publications Office: 1991; Volume III, Data Specifications, Part II. Available online: https://op.europa.eu/en/publication-detail/-/publication/664c5360-7eb1-4bcf-88ba-9cd778ab8708 (accessed on 23 September 2023).
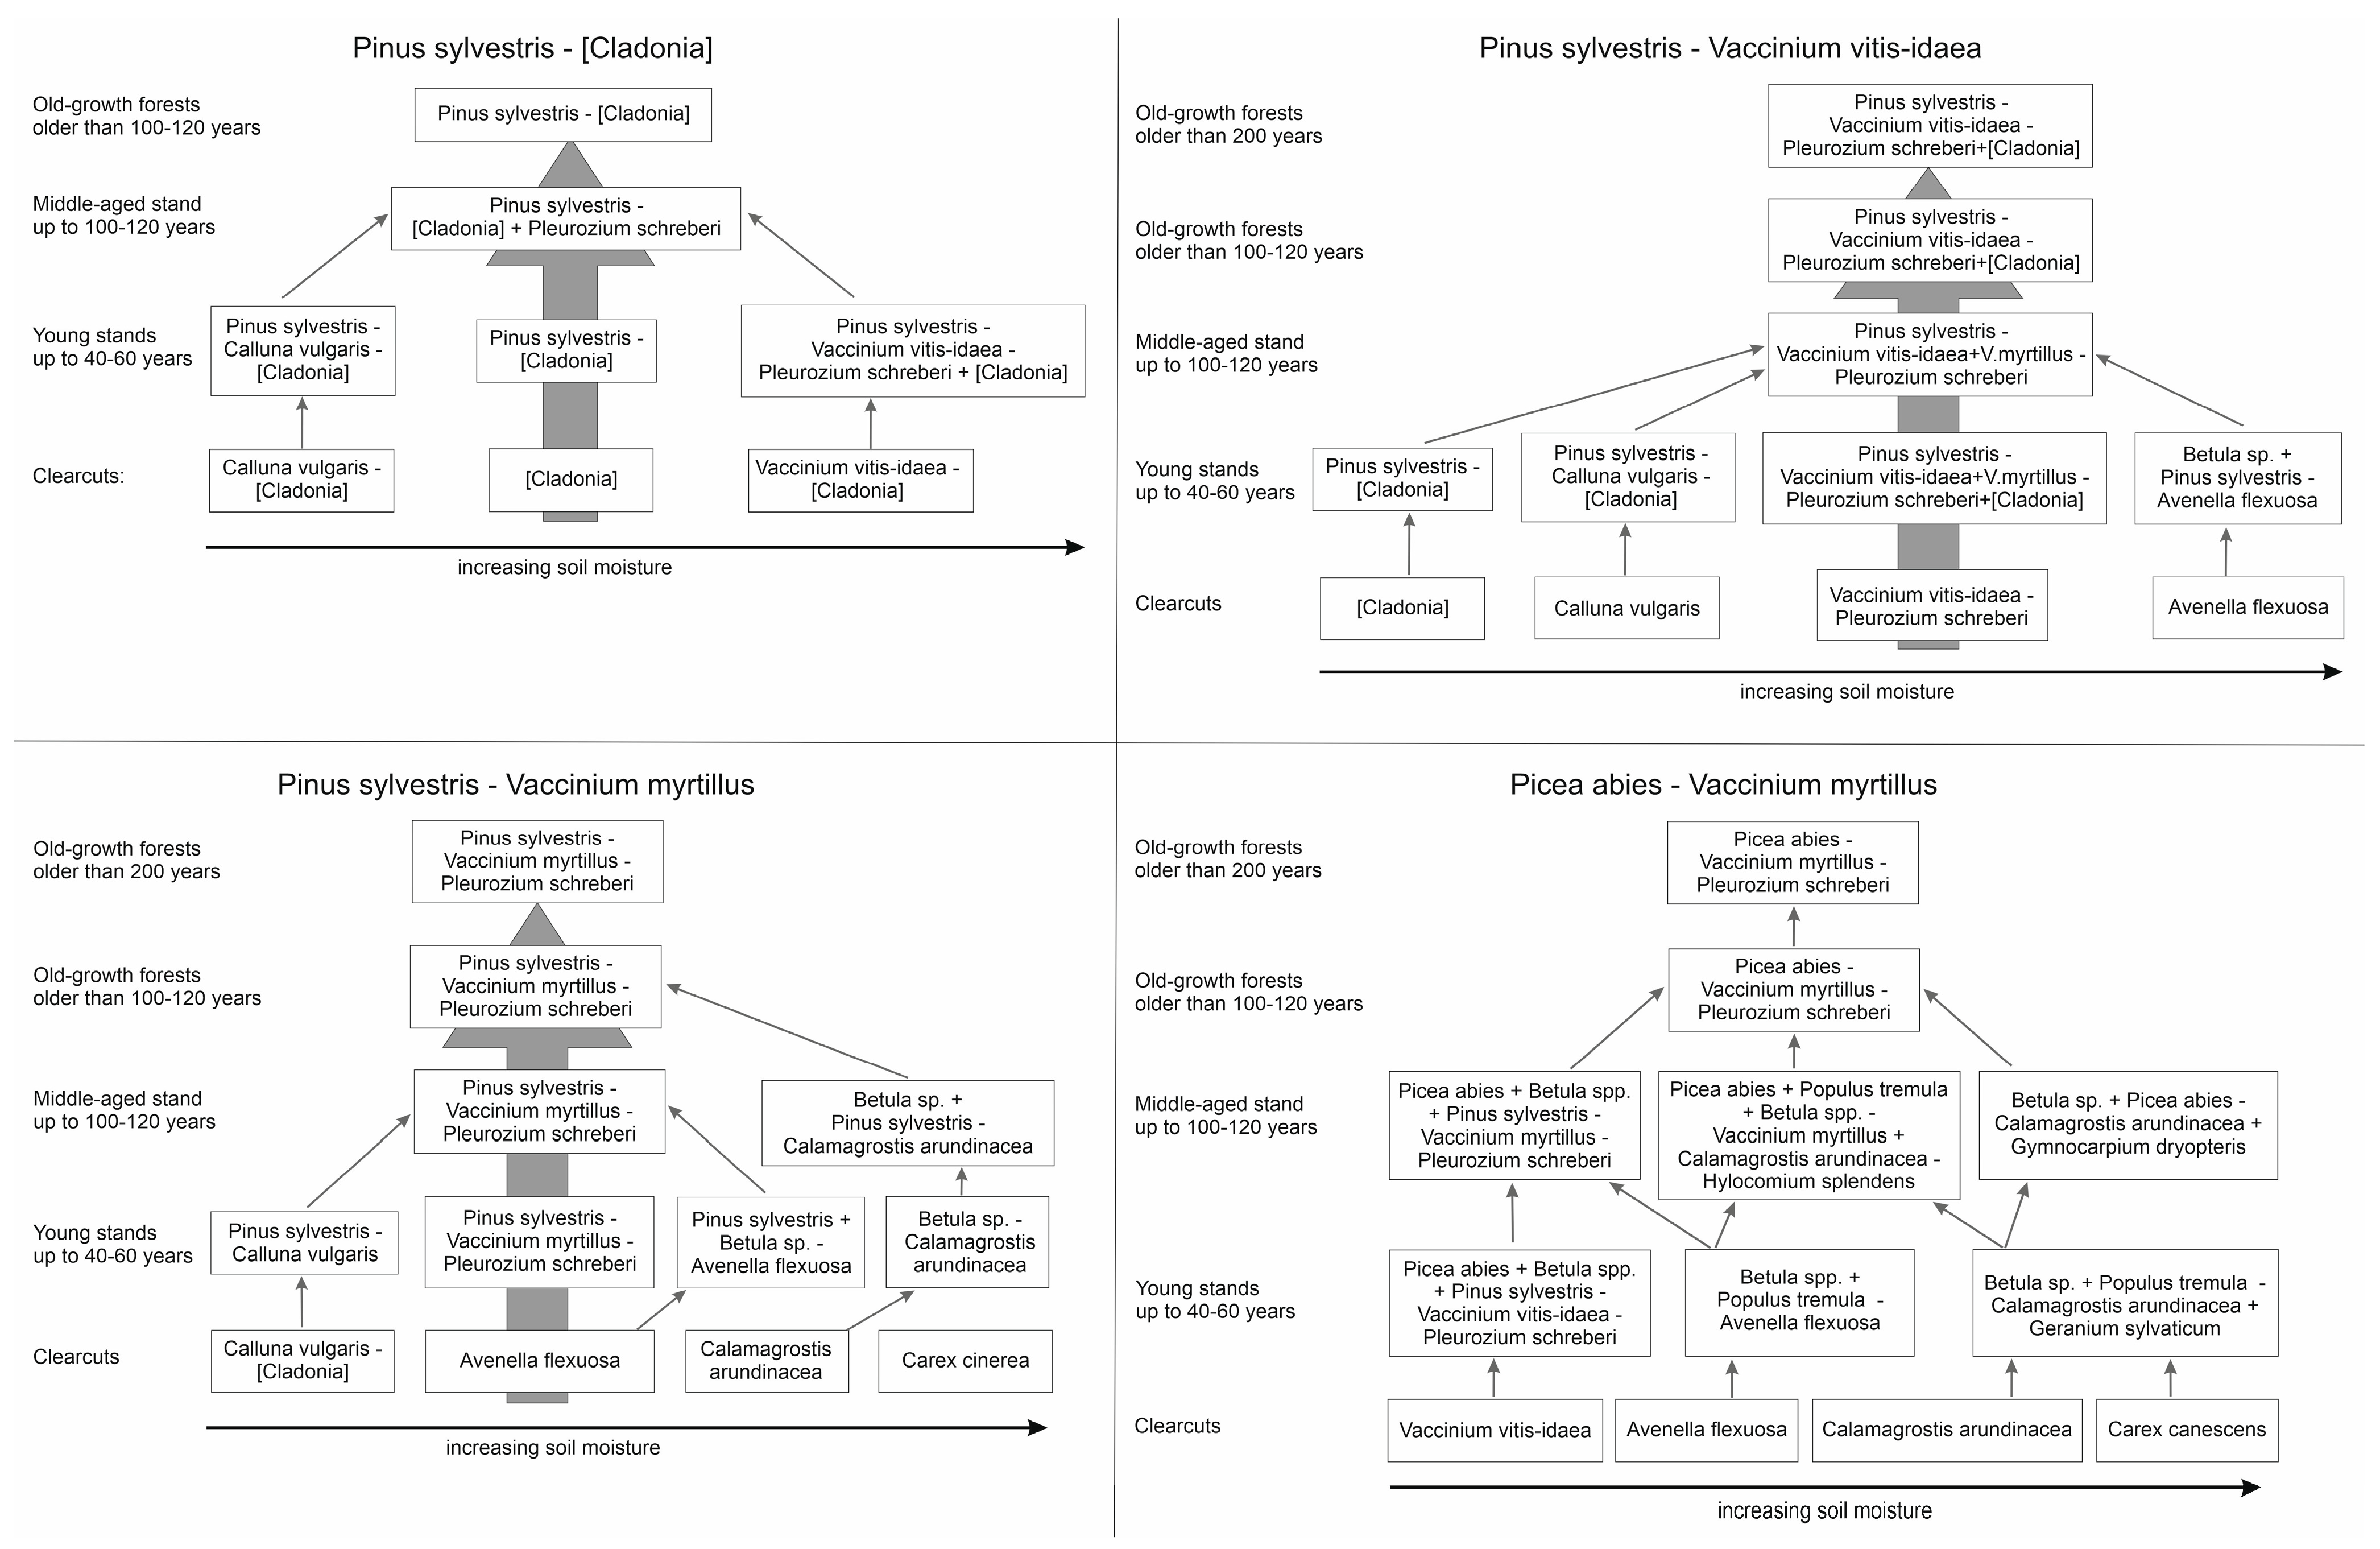
- Kryshen, A. Types of forest habitats over automorphic soils in Karelia. Bot. Z. 2010, 95, 281–297. (In Russian) [Google Scholar]
- Kryshen, A.M.; Genikova, N.V.; Presnukhin, Y.V. Reforestation series of bilberry spruce forests in eastern Fennoscandia. Bot. Z. 2021, 106, 107–125. (In Russian) [Google Scholar] [CrossRef]
- Simpson, E.H. Measurement of diversity. Nature 1949, 163, 688. [Google Scholar] [CrossRef]
- McCune, B.; Mefford, M.J. PC-ORD. Multivariate Analysis of Ecological Data, version 6.0; MjM Software: Gleneden Beach, OR, USA, 2011. [Google Scholar]
- Hart, S.A.; Chen, H.Y.H. Fire, logging, and overstory affect understory abundance, diversity, and composition in boreal forest. Ecol. Monogr. 2008, 78, 123–140. [Google Scholar] [CrossRef]
- Venier, L.A.; Thompson, I.D.; Fleming, R.; Malcolm, J.; Aubin, I.; Trofymow, J.A.; Langor, D.; Sturrock, R.; Patry, C.; Outerbridge, R.O.; et al. Effects of natural resource development on the terrestrial biodiversity of Canadian boreal forests. Environ. Rev. 2014, 22, 457–490. [Google Scholar] [CrossRef]
- Hekkala, A.; Jönsson, M.; Kärvemo, S.; Strengbom, J.; Sjögren, J. Habitat heterogeneity is a good predictor of boreal forest biodiversity. Ecol. Indic. 2023, 148, 110069. [Google Scholar] [CrossRef]

| Features | P.s.-Cl. | P.s.-V.v.-i. | P.s.-V.m. | P.a.-V.m. |
|---|---|---|---|---|
| Soil | sandy, dry | sandy, slightly moist | sandy, slightly moist | sandy loam, slightly moist |
| Main tree species | only pine | pine dominated, rare spruce trees in the second layer | pine dominated, common spruce trees in the first and second layer | spruce dominated, rare trees of pine, birch and aspen |
| Undergrowth (young trees of main species) | mostly pine, single spruce | mostly pine, rare spruce | abundantly spruce, rare pine, birch and aspen | abundantly spruce, rare birch and aspen |
| Undergrowth (shrubs, deciduous species that do not extend into the upper layers) | single Salix caprea L. | rare: Salix caprea and Sorbus aucuparia L., Juniperus communis L. | Salix caprea, Juniperus communis, Sorbus aucuparia are common | Salix caprea, Juniperus communis, Sorbus aucuparia, Rosa spp. L., Alnus incana (L.) Moench are common and abundant |
| Lichens | dominate | in patches, abundant | in patches, rare | absent |
| Green mosses | in patches | dominate | dominate | dominate |
| Forest grasses | absent | rare | common, can dominate in gaps | common, can dominate in gaps |
Disclaimer/Publisher’s Note: The statements, opinions and data contained in all publications are solely those of the individual author(s) and contributor(s) and not of MDPI and/or the editor(s). MDPI and/or the editor(s) disclaim responsibility for any injury to people or property resulting from any ideas, methods, instructions or products referred to in the content. |
© 2023 by the authors. Licensee MDPI, Basel, Switzerland. This article is an open access article distributed under the terms and conditions of the Creative Commons Attribution (CC BY) license (https://creativecommons.org/licenses/by/4.0/).
Share and Cite
Kryshen, A.; Genikova, N. Changes in the Number of Vascular Plant Species during Reforestation of Clearcut Forests. Forests 2023, 14, 2395. https://doi.org/10.3390/f14122395
Kryshen A, Genikova N. Changes in the Number of Vascular Plant Species during Reforestation of Clearcut Forests. Forests. 2023; 14(12):2395. https://doi.org/10.3390/f14122395
Chicago/Turabian StyleKryshen, Alexander, and Nadezhda Genikova. 2023. "Changes in the Number of Vascular Plant Species during Reforestation of Clearcut Forests" Forests 14, no. 12: 2395. https://doi.org/10.3390/f14122395
APA StyleKryshen, A., & Genikova, N. (2023). Changes in the Number of Vascular Plant Species during Reforestation of Clearcut Forests. Forests, 14(12), 2395. https://doi.org/10.3390/f14122395