Article

Mapping Feasibility for Wood Supply: A High-Resolution Geospatial Approach to Enhance Sustainable Forest Management in Galicia (NW Spain)

1
Escola de Enxeñaría Forestal, Universidade de Vigo, 36005 Pontevedra, Spain
2
Grupo Xestión Segura e Sostible de Recursos Minerais (XESSMin), CINTECX, Universidade de Vigo, 36310 Vigo, Spain
*
Author to whom correspondence should be addressed.
Forests 2023, 14(11), 2124; https://doi.org/10.3390/f14112124
Submission received: 26 September 2023 / Revised: 17 October 2023 / Accepted: 23 October 2023 / Published: 25 October 2023
(This article belongs to the Section Forest Ecology and Management)

Abstract

:
The forest value chain is key to the European transition to a climate-neutral economy. Sustainable forest management is essential for this task. To plan sustainable forest management, it is essential to track forest resources in relation to their feasibility for wood supply. This means considering the constraints that may limit the incorporation of these resources into the forest value chain. Maps adapted to specific regional constraints and to the characteristics of specific forests are essential for performing sustainable forest management at a local scale. This study presents a methodology for the integrated analysis of geospatial data focused on classifying the land and the forest resources of a region according to their feasibility for wood supply. It produces maps of the feasibility for wood supply in an area and of the existing forest resources at a 10 m spatial resolution. This was done by integrating information about the legal and technical constraints present in the area according to decision rules. The land was classified into three classes: favorable, intermediate or unfavorable. Additionally, updated forest-oriented land cover maps were produced to analyze the feasibility for wood supply of the forest resources present in the region. It was found that 42% of the Eucalyptus spp., 48% of the conifers and 30% of the broadleaves in the study area were located in favorable areas. These maps would help in the quest for more sustainable forest management in the region and aid in boosting the competitiveness of the regional forest value chain.

1. Introduction

The transition to a climate-neutral economy has become a strategic goal for the European Union [1], and as a consequence, wood and wood-based products are expected to gradually substitute fossil-based products and non-renewable resources in the coming years [2]. This projected future increase in the demand for wood will require sustainable forest management policies [3,4], something which is also essential for ensuring other important ecosystem services like climate change mitigation, biodiversity conservation and cultural services [1]. Sustainable forest management seeks to maintain and enhance the economic, social and environmental value of all types of forests, with the ultimate aim of benefiting present and future generations [5]. To this end, having updated and complete information about the conditions of forest resource stocks is fundamental [6]. Traditionally, forest inventories have focused on the geospatial distribution and characterization of forest resources in terms of their composition and the characterization of the stands [7,8]. However, knowledge of the constraints that might limit forest availability for wood supply (FAWS) or the feasibility for wood supply (FWS) of the resources present in a certain area is also crucial for implementing sustainable forest management policies [9,10].
According to Alberdi et al. [9], there are three main types of constraints that affect wood supply: environmental constraints, social constraints and economic constraints. Environmental constraints refer to protected areas and landscapes, while social constraints include land uses where human activities limit the FAWS or the FWS, for instance, in military areas, heritage sites and game enclosures, among others [11]. The identification of forested areas affected by environmental and social limitations can be performed through the identification of these land uses and the areas surrounding them that are affected by specific legal regulations. The primary legal restrictions that are considered in the literature are those that establish environmentally protected areas (i.e., strict reserves or national parks), hydrological protection areas, cultural heritage sites and areas related to the maintenance of physical goods and services (i.e., buildings and road setbacks) [10,11,12,13].
Economic constraints include market prices, cost-efficiency and the techniques used [11,14,15]. Market prices may not be taken into account in the analysis of harvesting feasibility since they are subject to short-term fluctuations [9]. Cost efficiency and extraction techniques, however, are closely related. According to Soman et al. [16], extraction techniques and their costs outweigh the impact of other operational phases of harvesting in terms of importance for the overall cost-efficiency. The costs of the extraction techniques are determined by the performance and productivity of the forest machinery, and this depends greatly on certain technical restrictions that the terrain may present.
One of the technical restrictions that can significantly impact the performance of the harvesting systems is the slope of the terrain. Lundbäck et al. [17] remark that the slope frequently determines the harvesting system that can be applied in a certain area. The slope also determines the productivity of some ground-based harvesting machinery: the greater the terrain slope, the lower the productivity of forwarders and skidders [18]. Other technical factors that can limit harvest productivity are the size of the property and the distance from the extraction site to the closest road. The strong relation between forwarder productivity and the distance from the extraction site to the road was indicated by Proto et al. [19] and Gagliardi et al. [20]. Poje et al. [21] and Verkerk et al. [13] found that the size of the stand property can explain the forest harvesting intensity in a certain area. Despite these studies, it should be mentioned that it is difficult to establish clear threshold values for slope, distance to roads and property size in terms of their effects on wood availability and feasibility, since this can vary regionally [10,11]. For example, Ireland establishes a slope threshold of 30 degrees for the whole country [22]. However, Spain defines different slope thresholds within the country, the limit being 45%–50% in all of Spain except for in the Atlantic region, where it is 75%–80% [23].
In recent years, the National Forest Iinventories (NFI) in some countries have integrated parameters constraining the availability and feasibility of forests for wood supply. This is the case for the NFIs in Italy and Finland, which include data on forest ownership, infrastructures, conservation areas, cultural heritage sites and even wood availability [24,25]. The analysis of these variables is also performed at larger scales. This is the case for the study of Alberdi et al. [11], which estimates the overall amount of forest area and above-ground biomass that is available for the wood supply of 13 European countries. Vauhkonen et al. [14] is another example, providing harmonized projections of future forest resource availability in some European countries.
The systematic gathering of information related to legal and technical constraints has enabled the production of explicit maps of forests that are available or feasible for wood supply. For instance, Verkerk et al. [26] provided wood production likelihood maps for European forests using a 1 km grid and considering legal and technical constraints. They observed that there were specific regions where the likelihood map differed greatly from the reality; this was the case in northwestern Spain and in southwestern France. Another example is the map created by Pucher et al. [27], which provides an updated European map which identifies forests available for wood supply and feasibility of harvesting depending on the harvesting system that can be applied. However, the coarse resolution of this map (500 m grid) hinders its operational utilization at local and regional scales.
In this context, it is necessary to produce updated regional maps that report the feasibility for wood supply of the forest resources given the regional particularities. Additionally, given the increasing number of disturbances that are currently affecting forests (such as wildfires, windstorms or insect outbreaks) [28,29,30], it may also be necessary to create methodologies that allow for feasibility information to be continuously updated to reflect the current forest cover.
This study performs a quantitative and geospatial analysis of the FWS for forests at a regional level and characterizes the current principal forest resources in terms of their FWS. The current legal constraints for forest management and the major economic constraints affecting wood mobilization in the study area were considered to determine the FWS. The study area is Galicia (in northwestern Spain), a region characterized by small holding regimes, high disturbance rates and some of the highest rates of wood production and harvesting intensity in Europe [26,31]. The methodology was designed to allow for the information to be continuously updated on an annual basis.
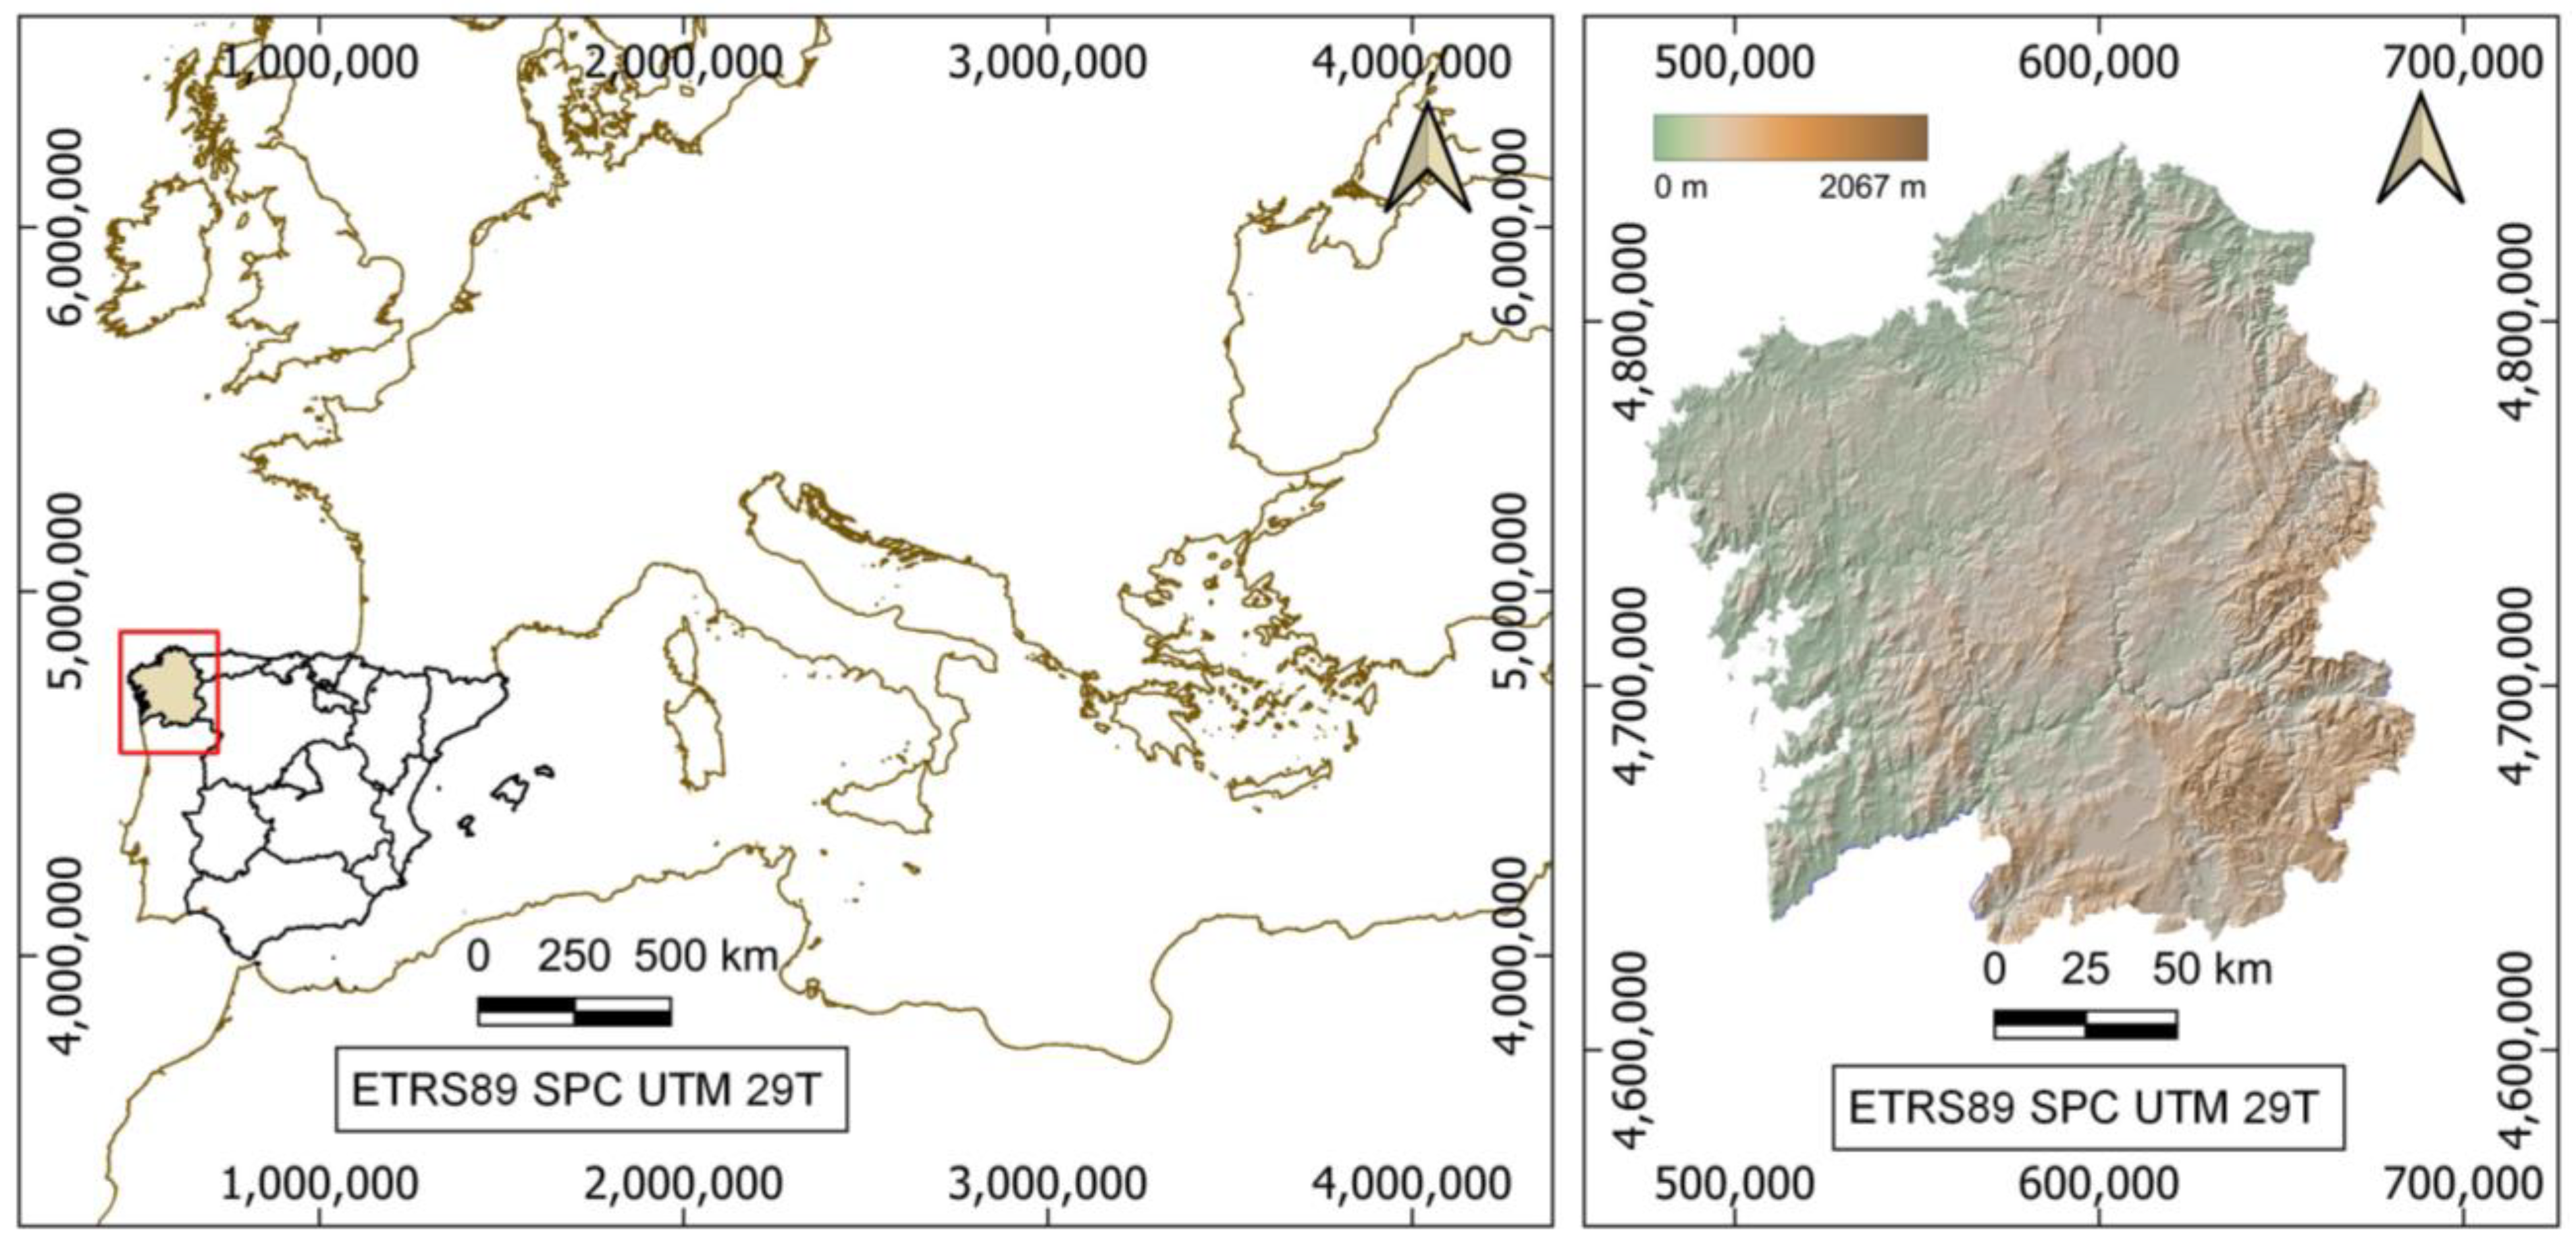
2. Case Study

This study was performed in Galicia, a region in northwestern Spain (see Figure 1) that has a total surface area of 29,578 km2 [32]. In this region, forests play an important economic, social and environmental role. According to the latest official report by the regional forestry administration, 69% of the total surface area is covered by forests [33] and 1.6% of the Galician gross domestic product (GDP) in 2019 corresponded to the Galician forest value chain [34]. Galician forests are mainly composed of blue gum (Eucalyptus globulus Labill.), shining gum (Eucalyptus nitens (H. Deane & Maiden) Maiden), maritime pine (Pinus pinaster Ait.), radiata pine (Pinus radiata D. Don), scots pine (Pinus sylvestris L.) and broadleaf species. Broadleaf forests are composed mainly of oak trees (Quercus spp.) and sweet chestnut (Castanea sativa Mill.) along with riparian species such as black alder (Alnus glutinosa (L.) Gaertn) and willow trees (Salix spp.). Ninety-seven percent of Galician forests are privately owned [35]. Forest ownership is constituted principally by small-holding regimes, with roughly 40% of the Galician forest area being divided into cadastral parcels smaller than 0.5 ha [36].
The main natural disturbance affecting Galician forests is wildfires. From 2018 to 2022, there were a total of 1499 wildfires in Galicia that were larger than 1 hectare; this is an annual average of 300 wildfires [37]. They affected a total of 80,144 hectares of forest land, which accounts for almost 1% of forest area burned annually [37]. Furthermore, this region has some of the highest levels of wood production and harvesting intensity in Europe [26,31]. According to the latest Spanish forest reports (from 2018 to 2021), Galicia harvests more than 50% of the total volume of wood harvested annually in Spain [38]. This great incidence of harvesting and wildfires, coupled with small property sizes, make Galicia a region that is subject to frequent and ongoing forest changes. Meanwhile, Galicia is also involved in a land-abandonment process which, in some areas, increases forest land every year [39]. As a consequence, gaining a comprehensive understanding of the feasibility of using forest resources for wood supply is especially challenging.
The Galician topography is characterized by plains, small mountains with steep valleys and a long coastline. Altitude ranges from sea level to mountains around 2000 m and the average altitude is 502 m [40]. It has an average slope of 21%. 
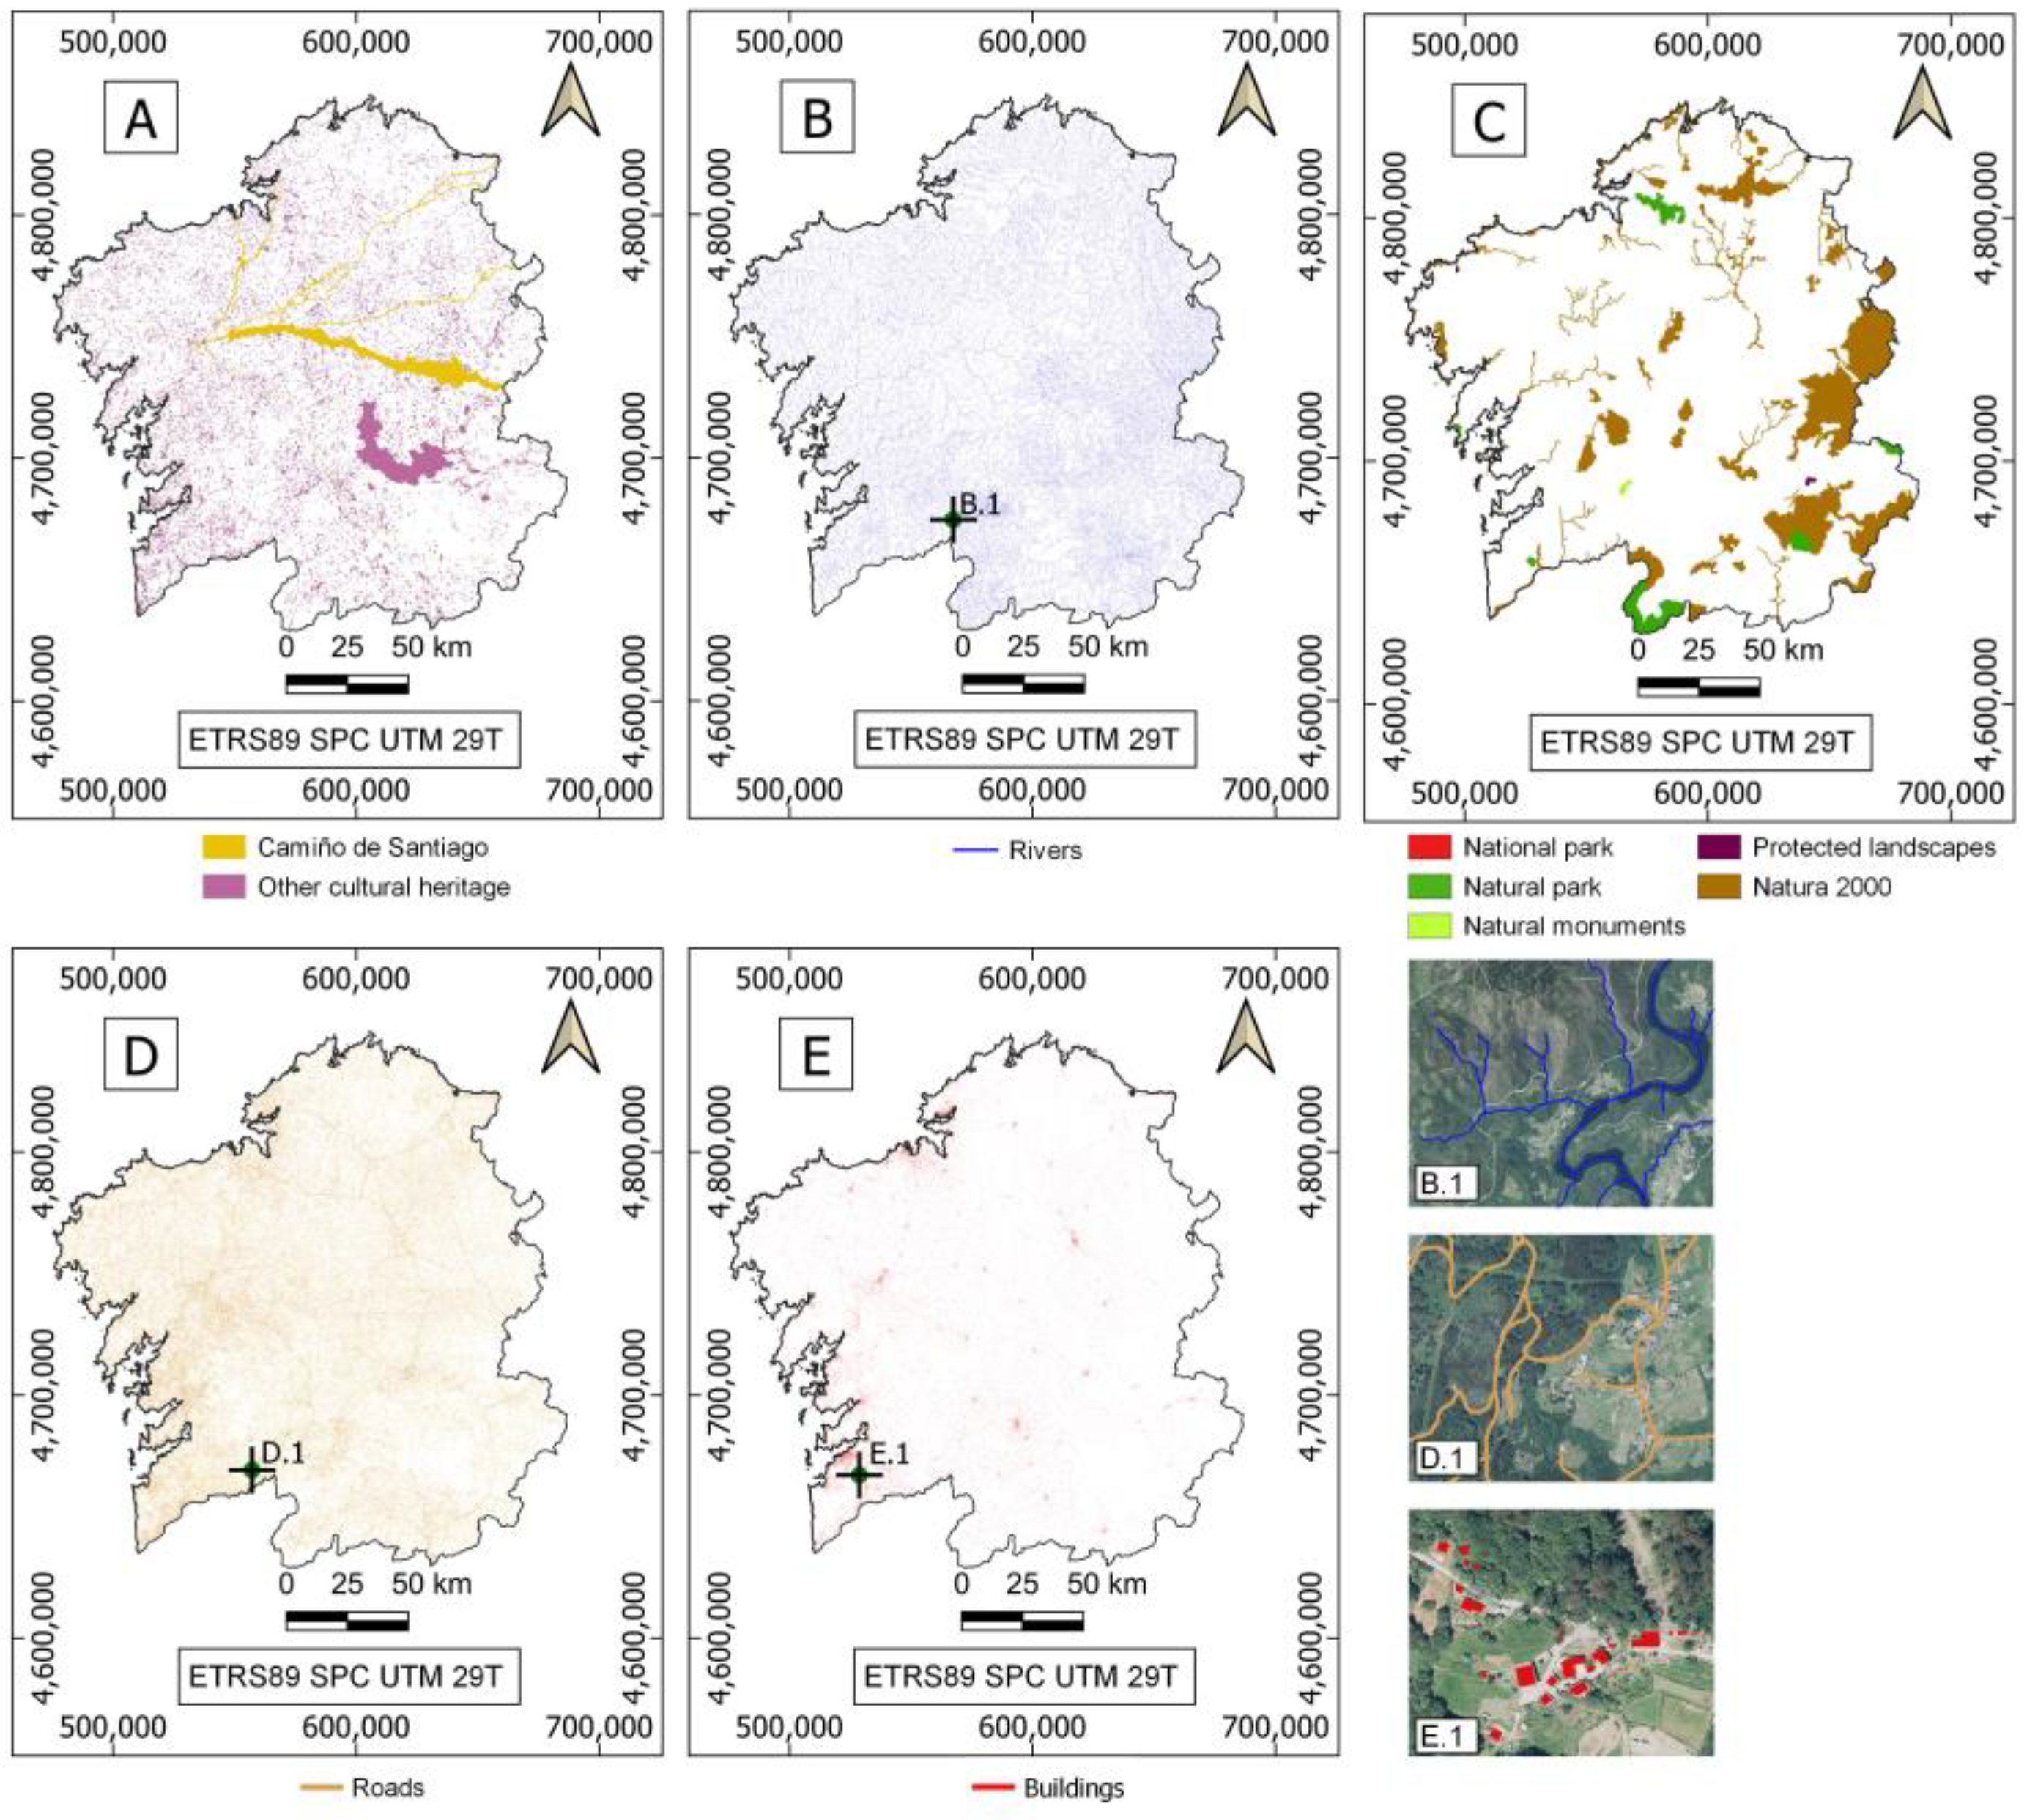
Figure 1 shows a hillshade of the digital terrain model of Galicia. The topography of the area along with a high rainfall result in a very dense hydrographic network in most of the Galician territory as shown in Figure 2. In order to guarantee the environmental functions of riparian zones and coastal areas, they are subject to legal restrictions regarding the forest activities permitted [41,42].
Galicia has important cultural and natural heritage, as shown in Figure 2. The cultural heritage sites are found both in populated areas and in forests. The natural protected areas include a national park (The Galician Atlantic Islands Maritime-Terrestrial National Park), six natural parks, eight natural monuments, two protected landscapes and several Nature 2000 areas [43]. They cover a total of 398,497 ha [44], of which 79% is forest surface [38]. Performing any type of forest management in these areas requires special permission [41]. The type of activities allowed, and the type of permissions needed, varies in each protected area and within each of them. This information is recorded in the management plan of each protected area.
Galicia is characterized by intense population dispersion. According to the latest data from the National Statistics Institute, Galicia is the region in Spain with the largest number of small villages and isolated constructions: 10,417 and 20,781, respectively [45]. As a result, there is a very dense network of service and communication infrastructures, as shown in Figure 2. In Galicia, the forest surrounding settlements, buildings and infrastructures is subject to forest management regulations aimed at wildfire prevention and ensuring the safety of infrastructures [41,46,47].

3. Materials

3.1. Geospatial Data Sources

Various official cartographic sources were compiled for the study area to analyze specific features of interest. Three types of geospatial data sources were used: data that are openly available to the public for visualization and download under an open-access regime, data that are only available to the public for visualization but not for download and data that are not available to the public. The data that are not available to the public were provided by the forestry administration of the regional government of Galicia specifically for use in this study. The information used is presented in Table 1.

3.2. Satellite Imagery

Sentinel-2 data were used in this study [52]. The Sentinel-2 product used was the Level 2A product, which includes geometric, radiometric and atmospheric corrections. Images were downloaded from the Copernicus open-access hub [53]. For the entirety of the study area, one image was downloaded per month and per Sentinel-2 tile for the period between 2020 and 2022. For each month, the image selected was the one with the least cloud cover. In cases where all the images available for a certain month had cloud cover greater than 50%, an image with the smallest cloud cover (always below 50%) was selected from the closest month possible.

3.3. Reference Images

Aerial orthorectified images (PNOA images) were used. They were downloaded from the Spanish National Cartographical Institute (IGN) [54]. The images date from 2020. They have a spatial resolution of 0.15 m with a georeferencing mean square error of ≤0.40 m [55].

4. Methodology

A flow chart of the methodology is provided in Figure 3. The methodology followed to evaluate the FWS in forests in the study area includes the following steps:
  • Identification and mapping of restrictions, Section 4.1. Two types of restrictions are considered: legal and technical. The specific restrictions of each type affecting wood supply feasibility in the study area are identified. The geodata sources and the cartographic operations required to map and characterize these restrictions are also defined.
  • Harmonization of the format of the restriction maps, Section 4.2. The restriction maps obtained in the first step of the methodology are harmonized in terms of their format (through vector to raster transformations) and their technical specifications (spatial resolution).
  • Categorization of restrictions, Section 4.3. Each restriction map is transformed into a qualitative category of the FWS.
  • Territory characterization, Section 4.4. The restriction maps are combined through decision rules to obtain a sole map for the whole study region. As a result, the map obtained corresponds to the FWS for the area, considering all the variables affecting FWS except for the presence or absence of woody species.
  • Forest resources characterization. A land cover map is obtained to geolocate the forested areas in the study region. The feasibility map is combined with the land cover map to characterize the forest stands in terms of their FWS.
Figure 3. Flow-chart representing the followed methodology.
Forests 14 02124 g003

4.1. Identification and Mapping of Restrictions

Any legal regulations that entail a certain limitation on forest management are considered to be legal constraints for FWS in the study area. This includes regulations that mandate special permissions or declarations of responsibility to perform forest management actions. A review of the regional law has revealed that there are legal restrictions affecting forestry management actions in the areas surrounding cultural heritage sites, rivers, coastal areas, buildings and roads. Environmentally protected areas are also affected by restrictions. Geospatial data sources were used to determine the location and extension of these areas. In some cases, the data sources include the surrounding areas that are affected by the restrictions; in other cases, simple geospatial operations were used to define the surrounding areas according to the specifications of the regulations.
The geodatabase used to map the areas surrounding cultural heritage sites and riparian zones that are affected by forest restrictions in the study area was the GDB20 [41]. According to the Spanish law that regulates coastal areas, any type of exploitation taking place within 100 m (or greater than 100 m in some specific areas) of coastal boundaries requires special permission from the competent authority [42]. The area affected by this law in Galicia is also contained in the GDB20 database. The areas affected by environmental protection were obtained from the ZEPVN geodatabase.
Special permission is needed when performing any type of forestry activity in the area surrounding roads [47]. Different procedures have been required to map the boundary of the areas affected depending on the type of road. For regional roads, the area affected by forest restrictions is contained in the BTG20 database. In the case of national roads, the corresponding vector layer in the BTG20 contains only the layout; the surrounding area affected by forest restrictions was obtained by applying a buffer of 120 m to the vector layer.
The law that regulates wildfire prevention in Galicia defines specific limitations in the presence of certain tree species in proximity of buildings, and mandates the removal of all biomass of these species from these areas. This regulation involves limitations on the type of forestry management that can be applied in these areas. The area affected by this law was obtained by applying a 50 m buffer to the buildings mapped on the BTG20. A complete summary of the restrictions detected and the geodatabases used to identify them is presented in Table 2.
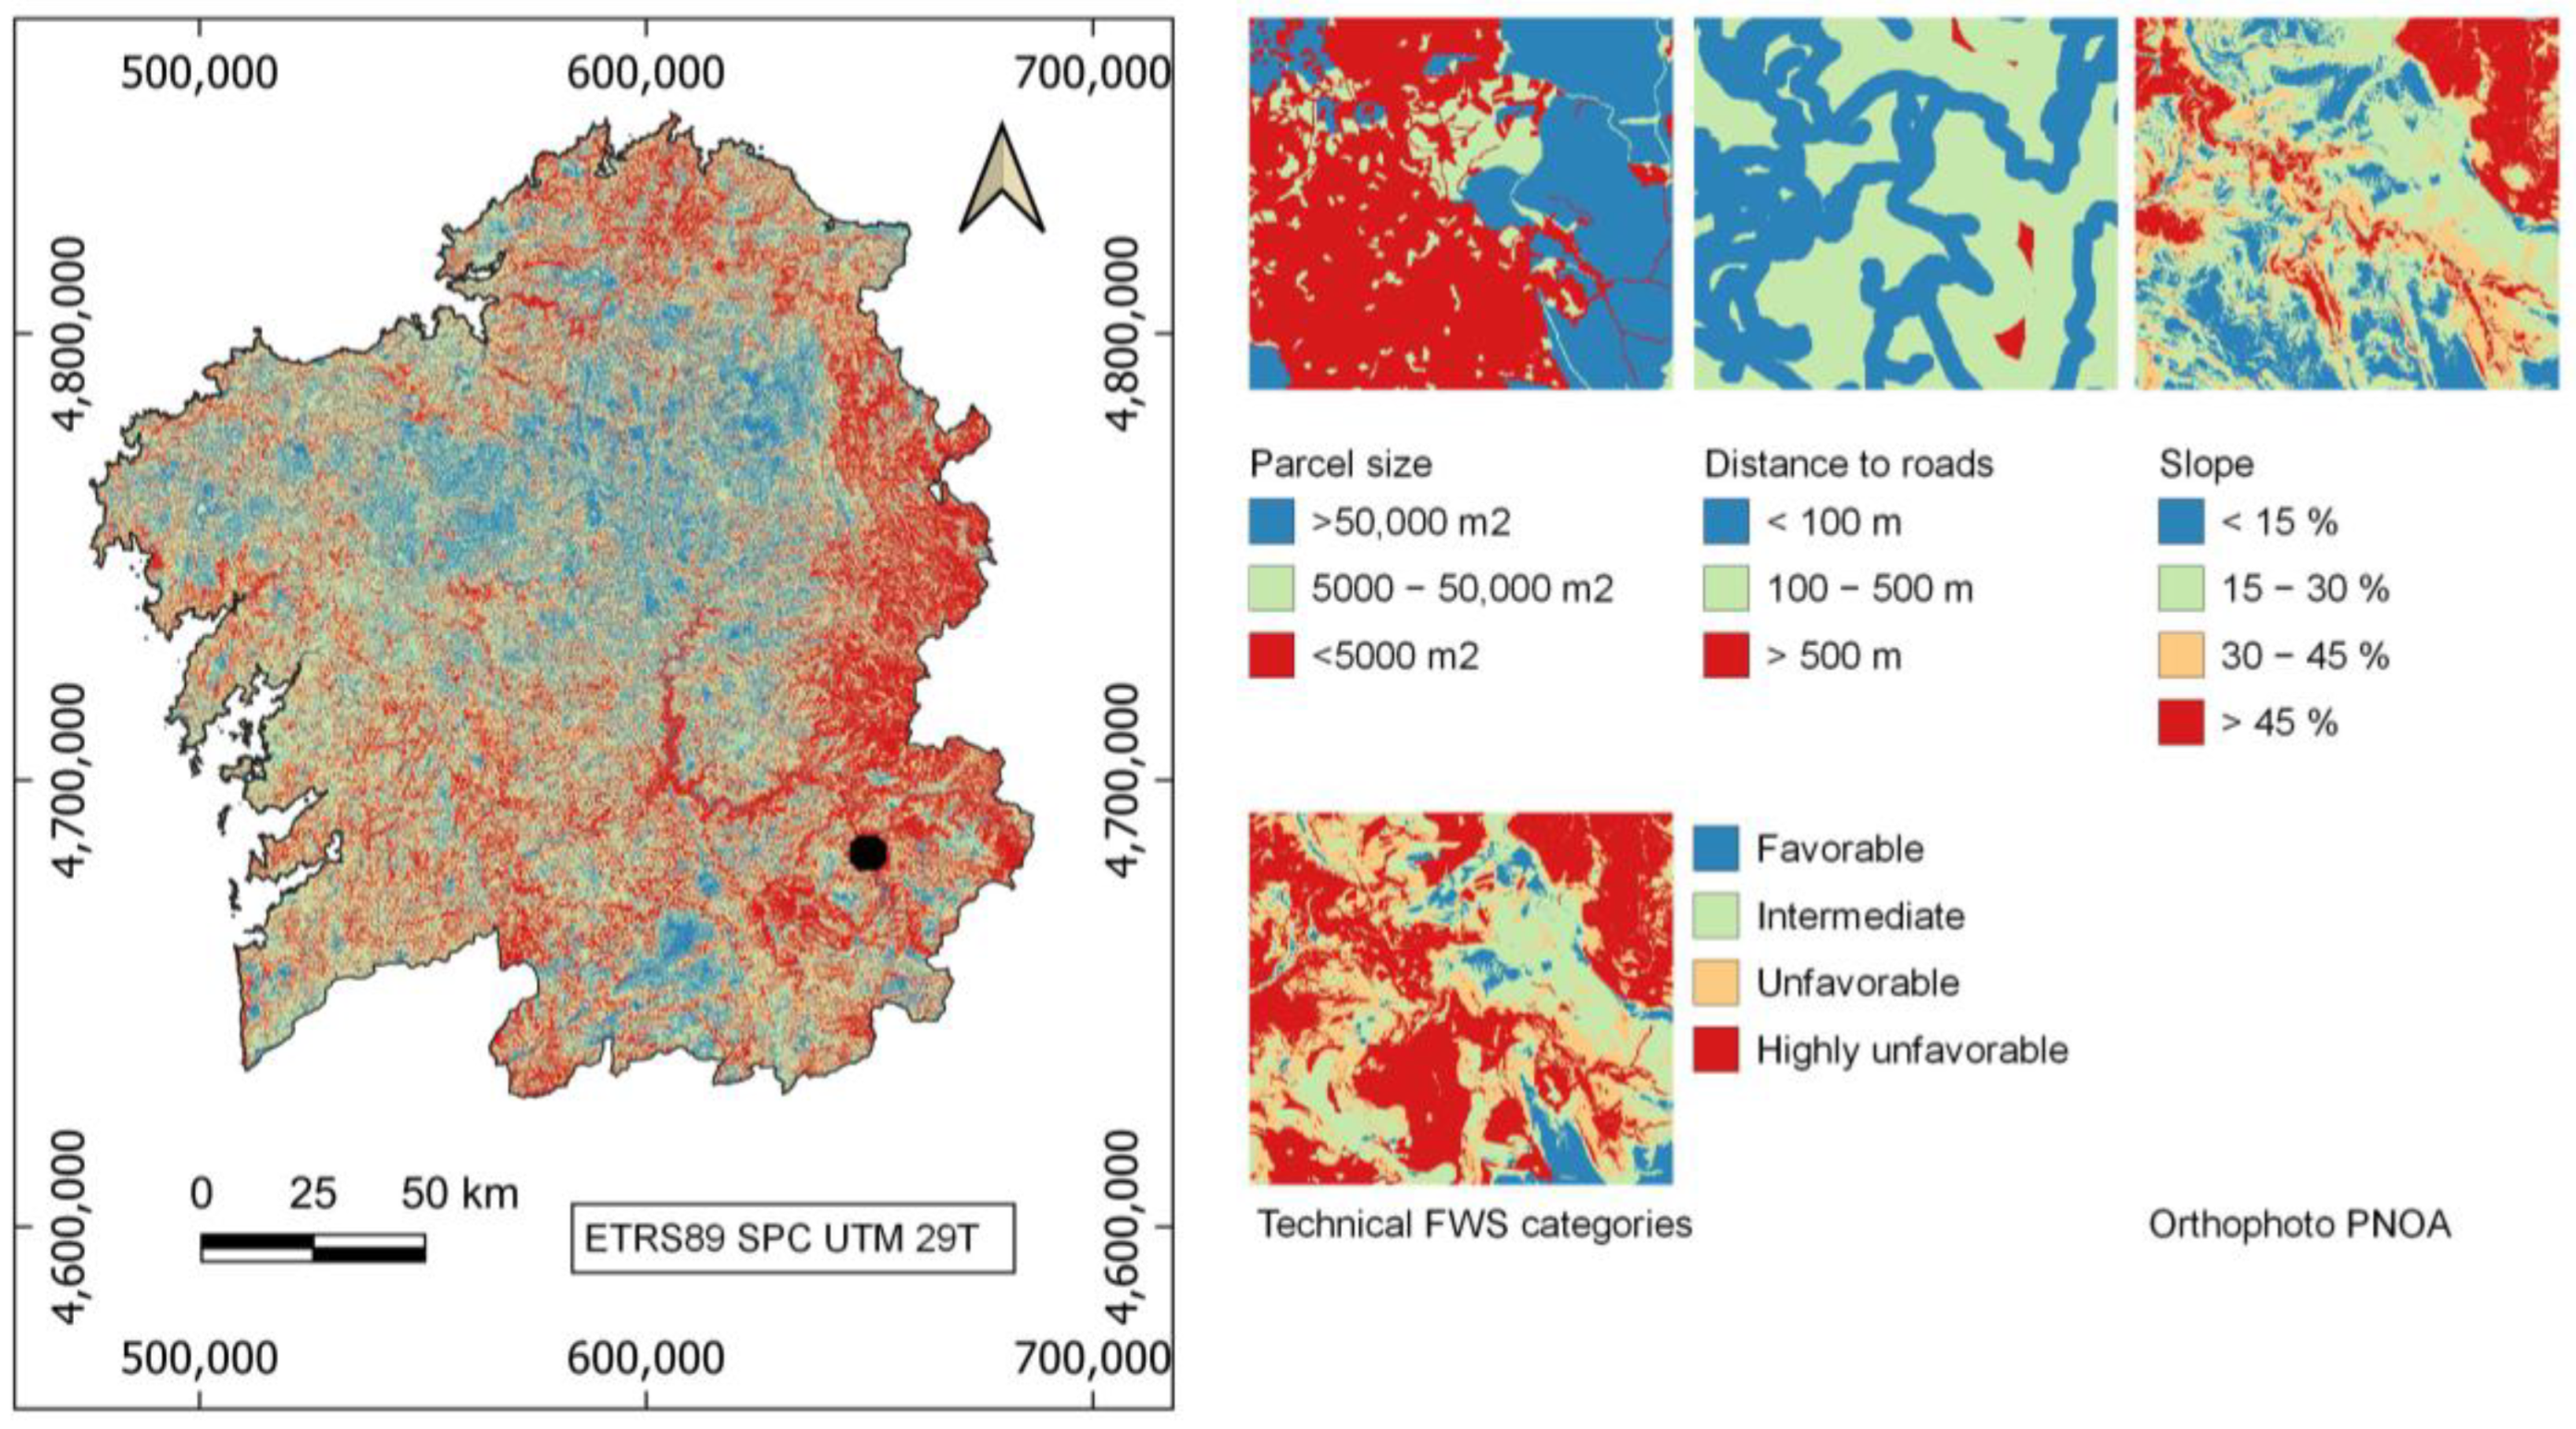
The technical restrictions considered for the study correspond to the characteristics of the terrain that affect the cost-efficiency of wood supply. They were selected according to previous studies related to this topic and to the geospatial information available for the study area. The final restrictions selected were slope, distance to roads and parcel size. Slope was obtained from the SLOPE map. Distance to roads was defined as the Euclidean distance to potential loading areas. Highways were therefore not included in this analysis. The geodatabase used to characterize the territory according to this factor was BTG20. Parcel size was obtained from the CADASTRAL map, which contains information about the area of each parcel.
Table 2 compiles the selected legal restrictions and the geodatabases used to obtain them. It also shows the technical restrictions and the geospatial information used to characterize the land according to these restrictions. As a result of this process, a map is obtained for each of the restrictions affecting the FWS in the study area.

4.2. Harmonization of Formats of the Restriction Maps

The geospatial data sources used to detect the restrictions in the previous section are available in varying vector and raster formats. To harmonize them, the vector layers were transformed into raster layers, and the raster layers were resampled at a common spatial resolution that was fixed at a 10 × 10 m pixel size.
The geodatabases used to define the areas affected by legal restrictions are vector files. These vectors were rasterized into binary rasters, where pixels with a value of 0 correspond to areas that are not affected by any legal conditioning factors and pixels with a value of 1 correspond to areas affected by legal conditioning factors. This step was done using the Rasterize algorithm in the SAGA v7.8.2 tool [56] in the Quantum Geographic Information Systems (QGIS) software v3.22.7 [57].
Slope data are housed in a raster file with a 5 m resolution. To harmonize this information with the rest of the factors, this raster was resampled at 10 m using the resampling tool in SAGA v7.8.2 [56] in the QGIS software v3.22.7 [57]. The characterization of the land in terms of distance to roads was done by obtaining a 10 m raster where each pixel value represents the Euclidean distance from the central point of the pixel to the closest road (excluding highways and forest roads) appearing on the BTG20. This step was done using the Euclidian distance algorithm in ArcGIS v10.4.1 [58]. Finally, a raster layer representing the parcel sizes is obtained. To build it, the CADASTRAL vector file was used. The digital value of every pixel corresponds to the area of the cadastral parcel to which the pixel belongs to. It was done using the Rasterize algorithm in the SAGA v7.8.2 tool [56] in the QGIS software v3.22.7 [57]. The spatial resolution of the layer is 10 m.

4.3. Categorization of Restrictions

The digital values of the technical restriction maps were transformed into categorical variables, as was done with the legal restrictions. The thresholds for each of the categories were defined according to the productivity and the operability of forest machinery according to previously published scientific studies [23,59]. Three homogeneous intervals of 15% slope amplitude were fixed below 45% and a fourth interval was established for values above 45%. The distance to roads was categorized into three intervals. Parcel size was categorized according to the distribution of the parcel sizes in the study area. Finally, the defined categories were assigned to one of the following qualitative FWS classes: favorable, intermediate, unfavorable or highly unfavorable (see Table 3). The defined intervals and the corresponding qualitative classes for each restriction are presented in Table 3.

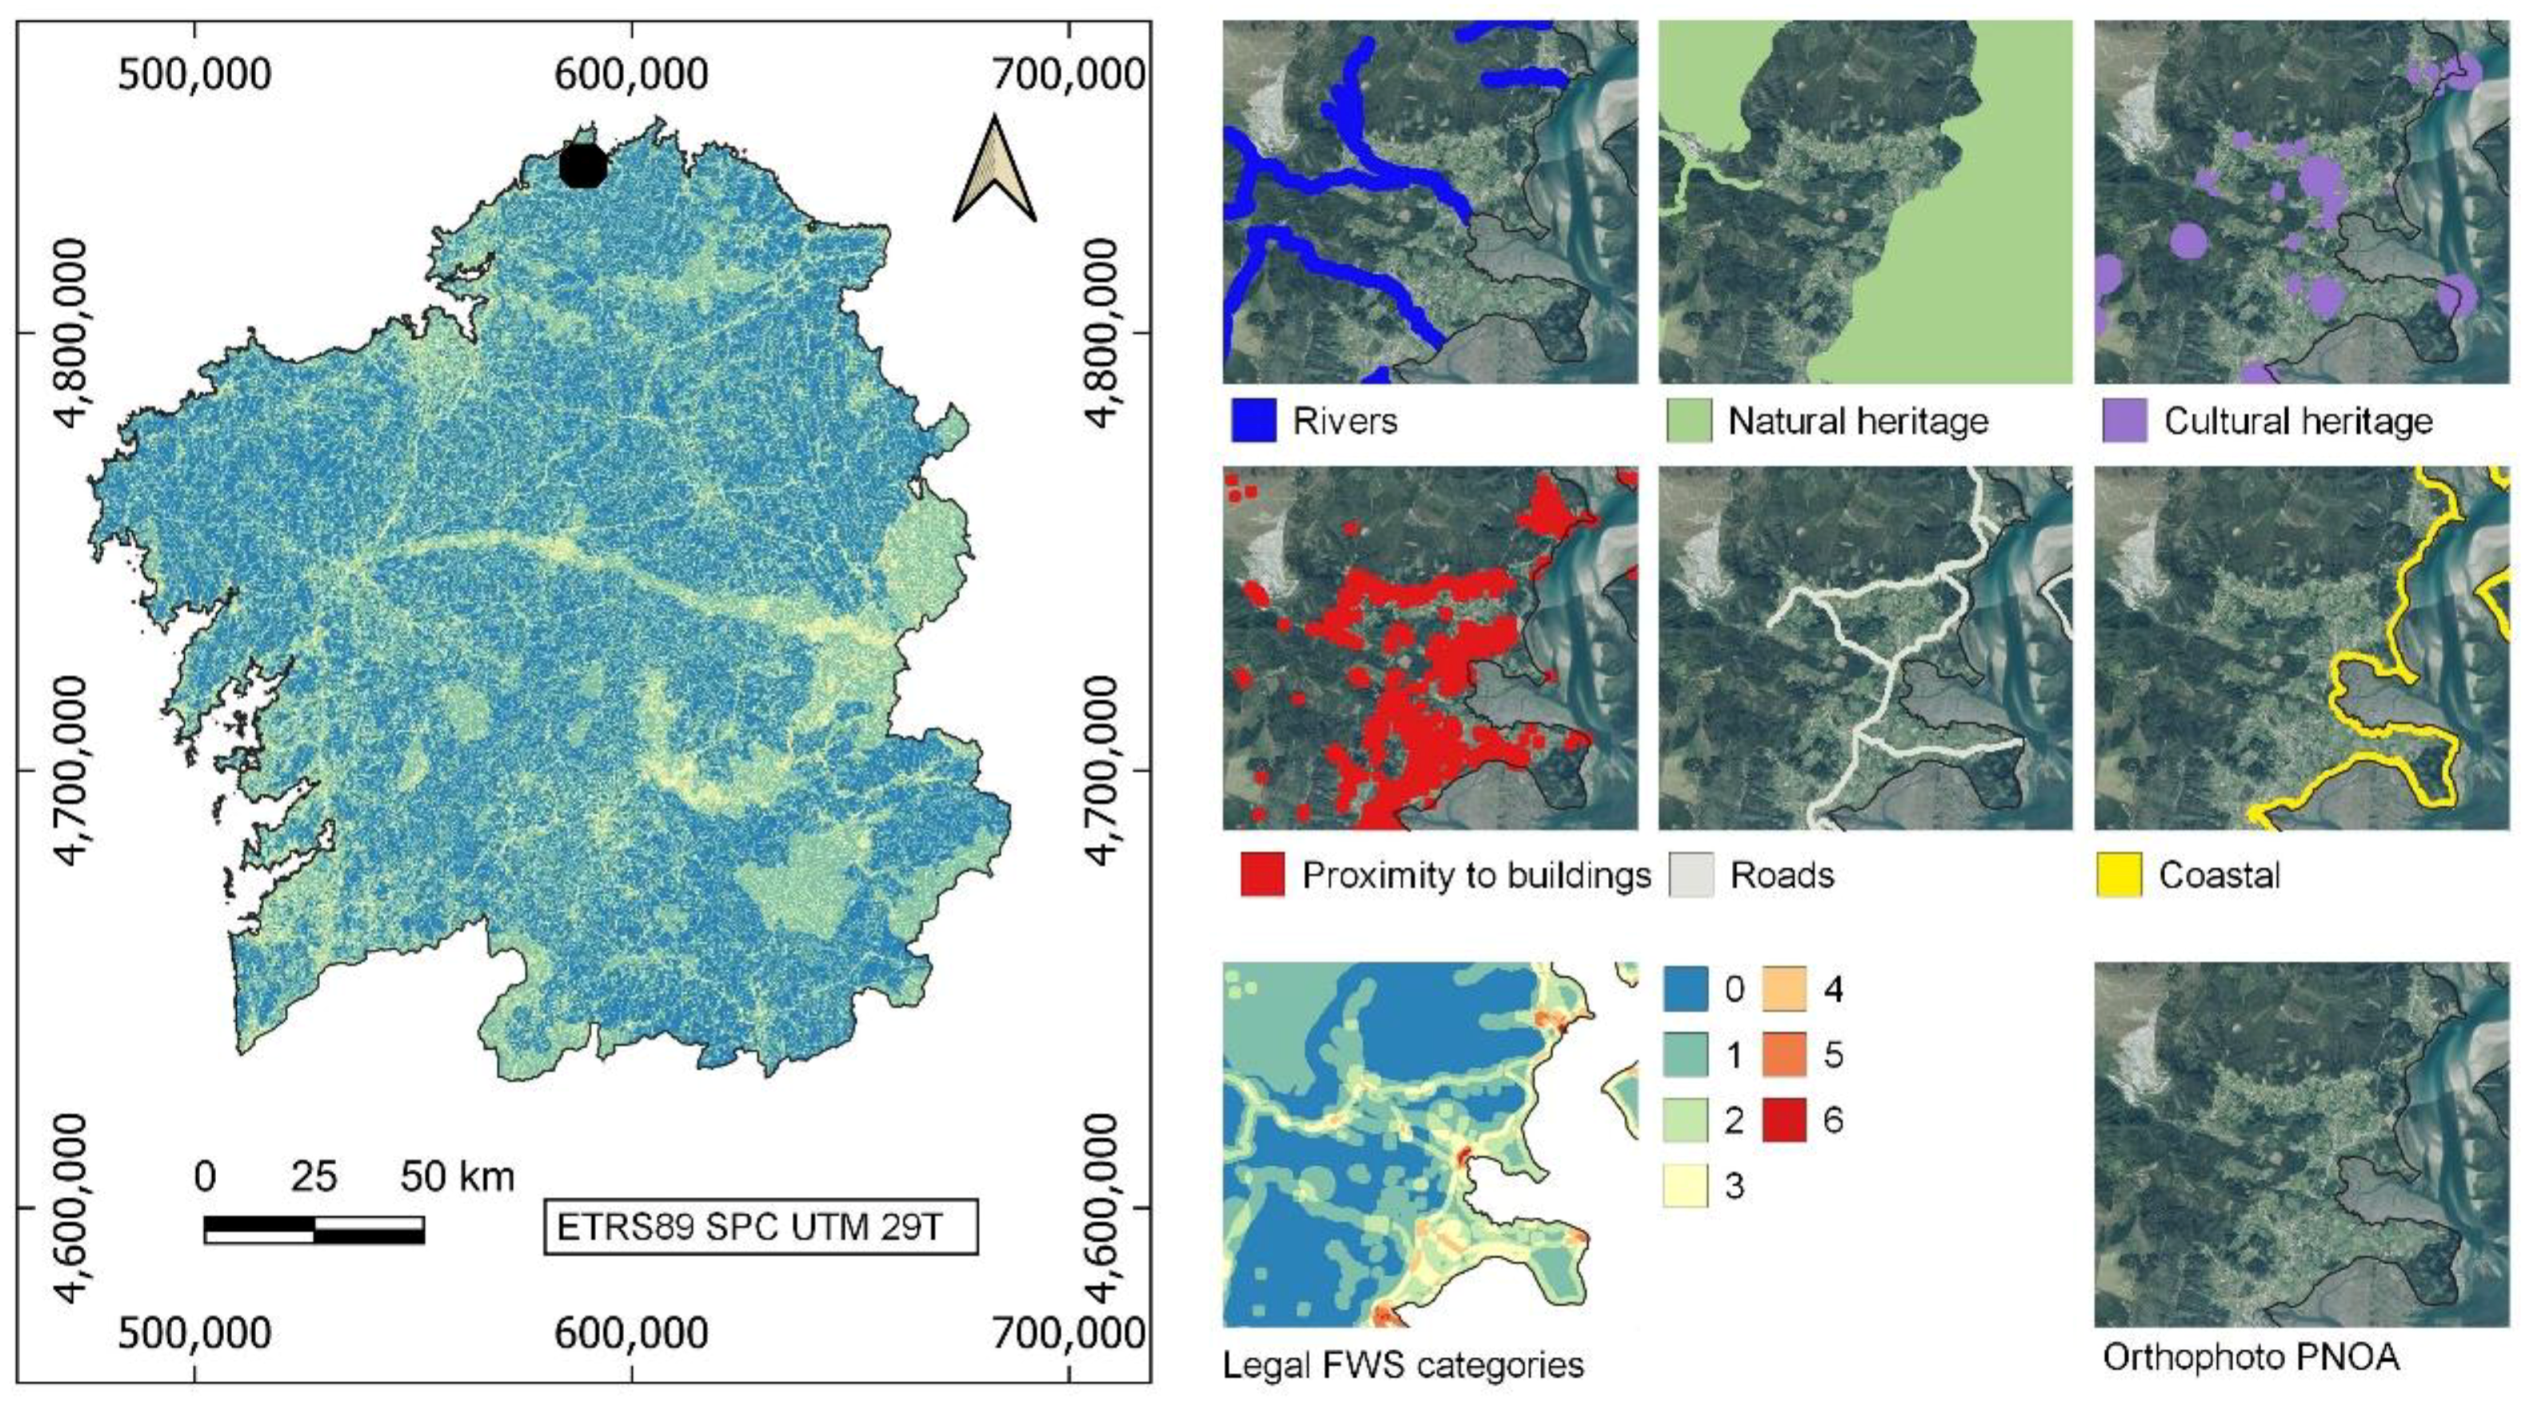
4.4. Territory Characterization

All the rasters obtained in the previous step were aggregated to obtain a map that categorizes the land area according to FWS. This was done by combining the different restrictions using decision criteria. The entire study area was analyzed in this step, independent of whether woody cover was present or not. First, the legal restrictions were aggregated by summing the corresponding raster layers. As a result, a single raster was obtained containing the number of legal restrictions for each pixel. This raster was deemed the legal raster and represents the legal FWS.
The technical factors were combined following a set of decision rules. The first decision rule was defined to combine parcel size and distance to roads into a size–distance raster. They were combined to obtain a single raster with three feasibility classes (favorable, intermediate and unfavorable). The favorable class was assigned where the two categories coincided as favorable or where one was favorable and the other intermediate. The unfavorable class was assigned where the two categories coincided as unfavorable or where one was unfavorable and the other intermediate. The rest of the possible combinations were assigned to the intermediate category. A summary of the decision criteria is shown in Table 4. Once the raster layer containing the area and distance to roads categories was obtained it was combined with the slope raster. A decision table was defined analogously to the previous one. A summary of the decision table used is shown in Table 5. The resulting raster contains the aggregation of the technical variables; it is considered to be the raster layer that represents the technical FWS.
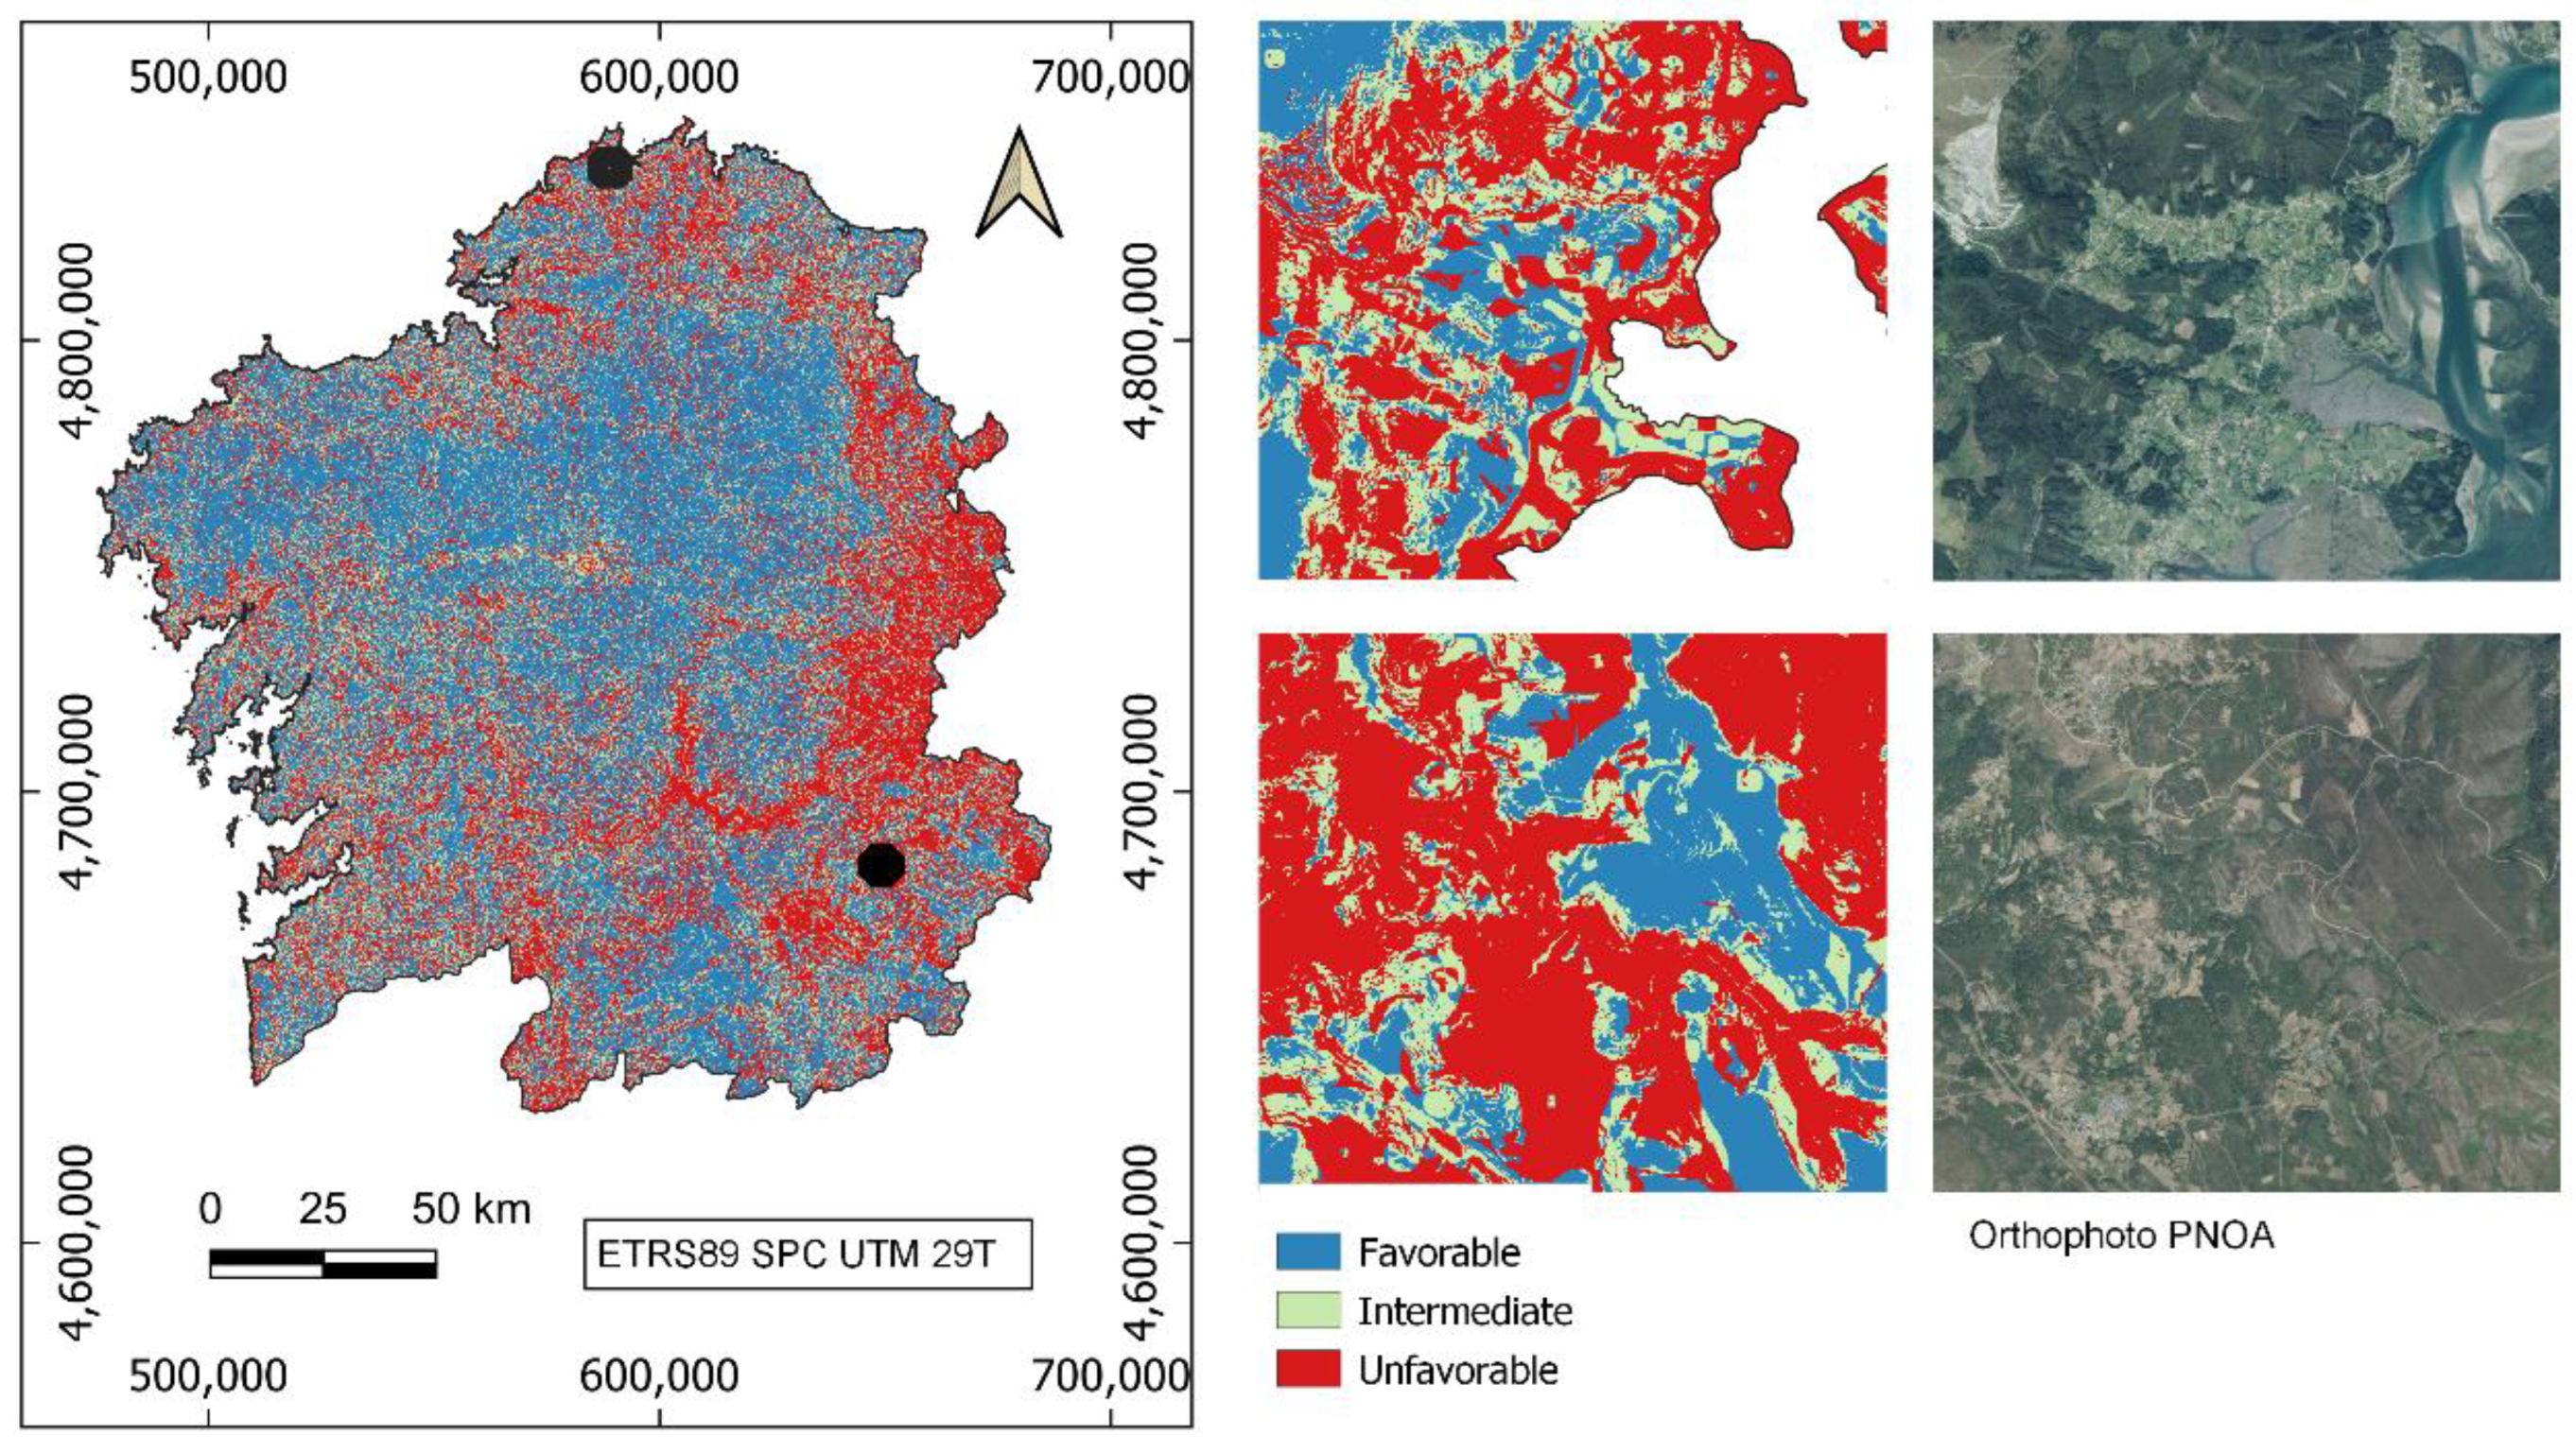
Finally, the legal and the technical feasibility maps were aggregated using decision criteria. The decision table used for this step is presented in Table 6. As a result, one single raster layer is obtained that characterizes the land according to its FWS, independent of the current land cover.

4.5. Forest Resources Characterization

The characterization of the forests in the study area in terms of their FWS required an updated land cover map. For the study area, the Spanish cartography currently available in the study area cannot be considered updated given the dynamism of the Galician forests and the date of elaboration of the map: 2011 [33]. Therefore, an updated map of the forest resources was elaborated using Sentinel-2 images from the period between 2020 and 2022. The following sections describe the procedure used to map the land covers in the study area and the procedure used to characterize forest covers in terms of their FWS.

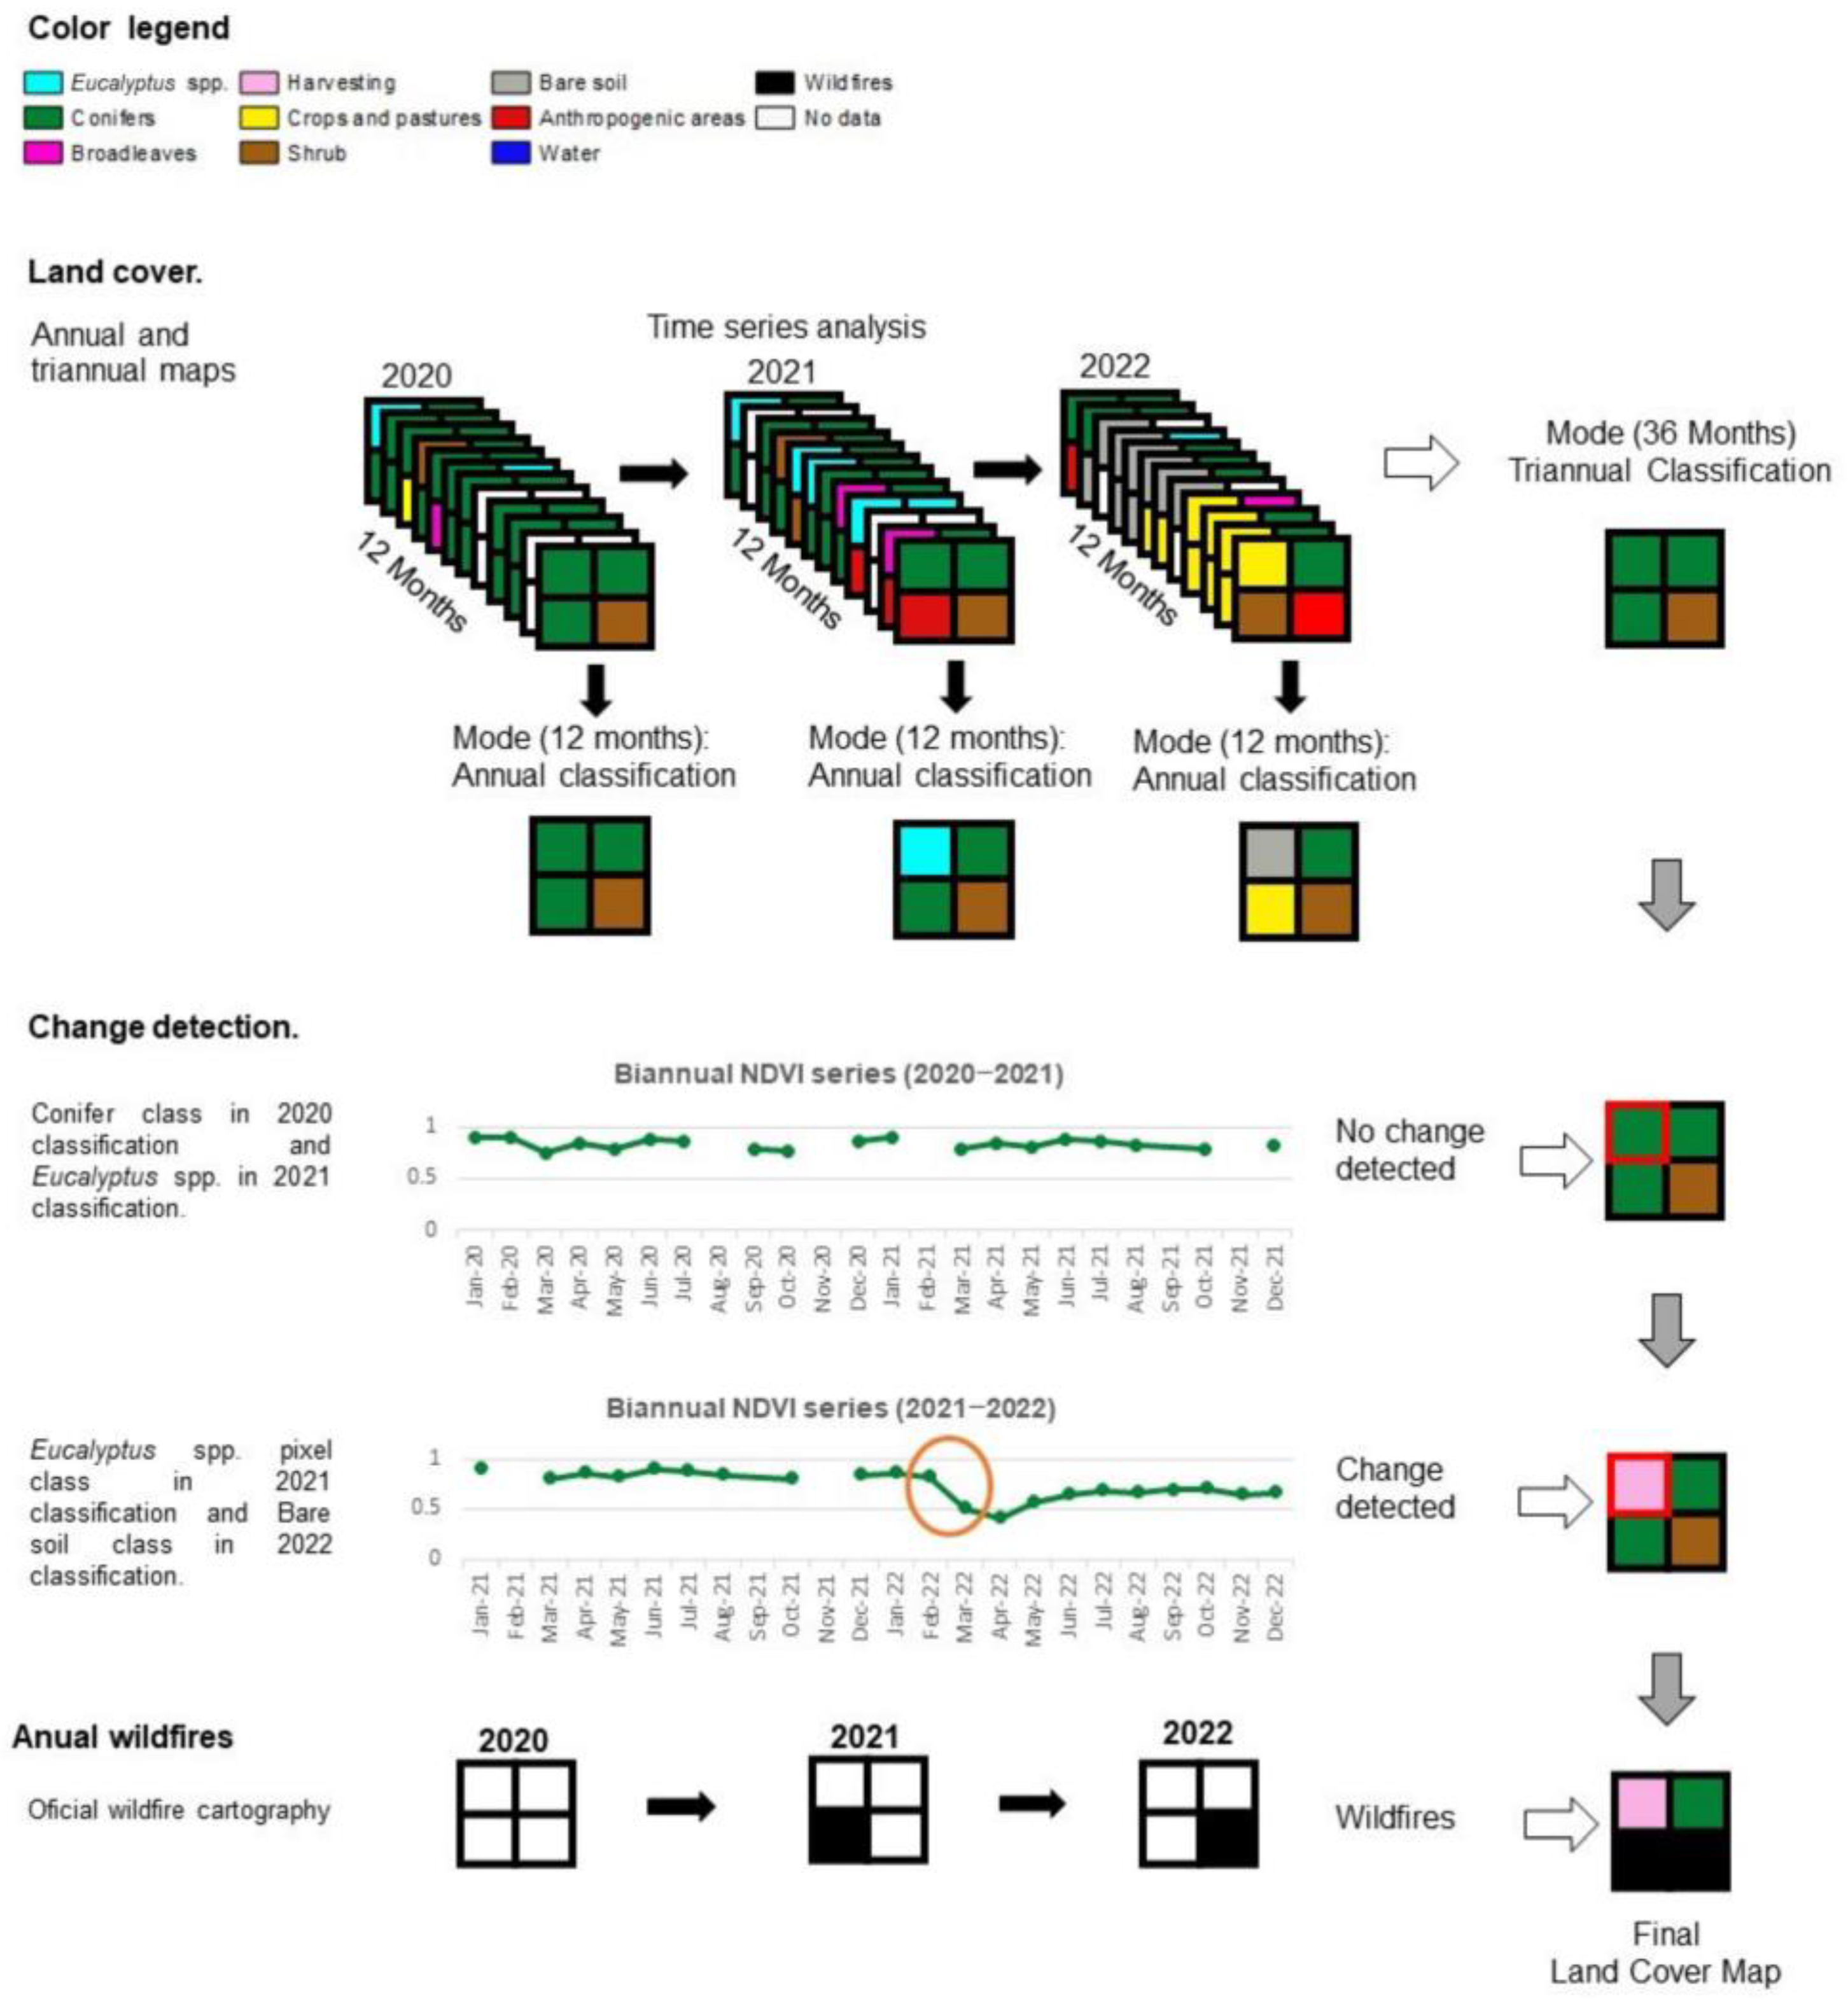
4.5.1. Land Cover Mapping

The forest-oriented Sentinel-2 land cover map was elaborated through supervised classification with the aim of identifying the location of the main forest covers in the study area in 2022. The land cover map was obtained by combining two procedures: the first allows for the mapping of land covers that have remained undisturbed for a certain period of time (stable land covers) and the second allows for the mapping of land covers that present recent forest disturbances, mainly harvestings and wildfires.
The mapping of stable land covers was accomplished through supervised classifications according to the methodology described in Alonso et al. [
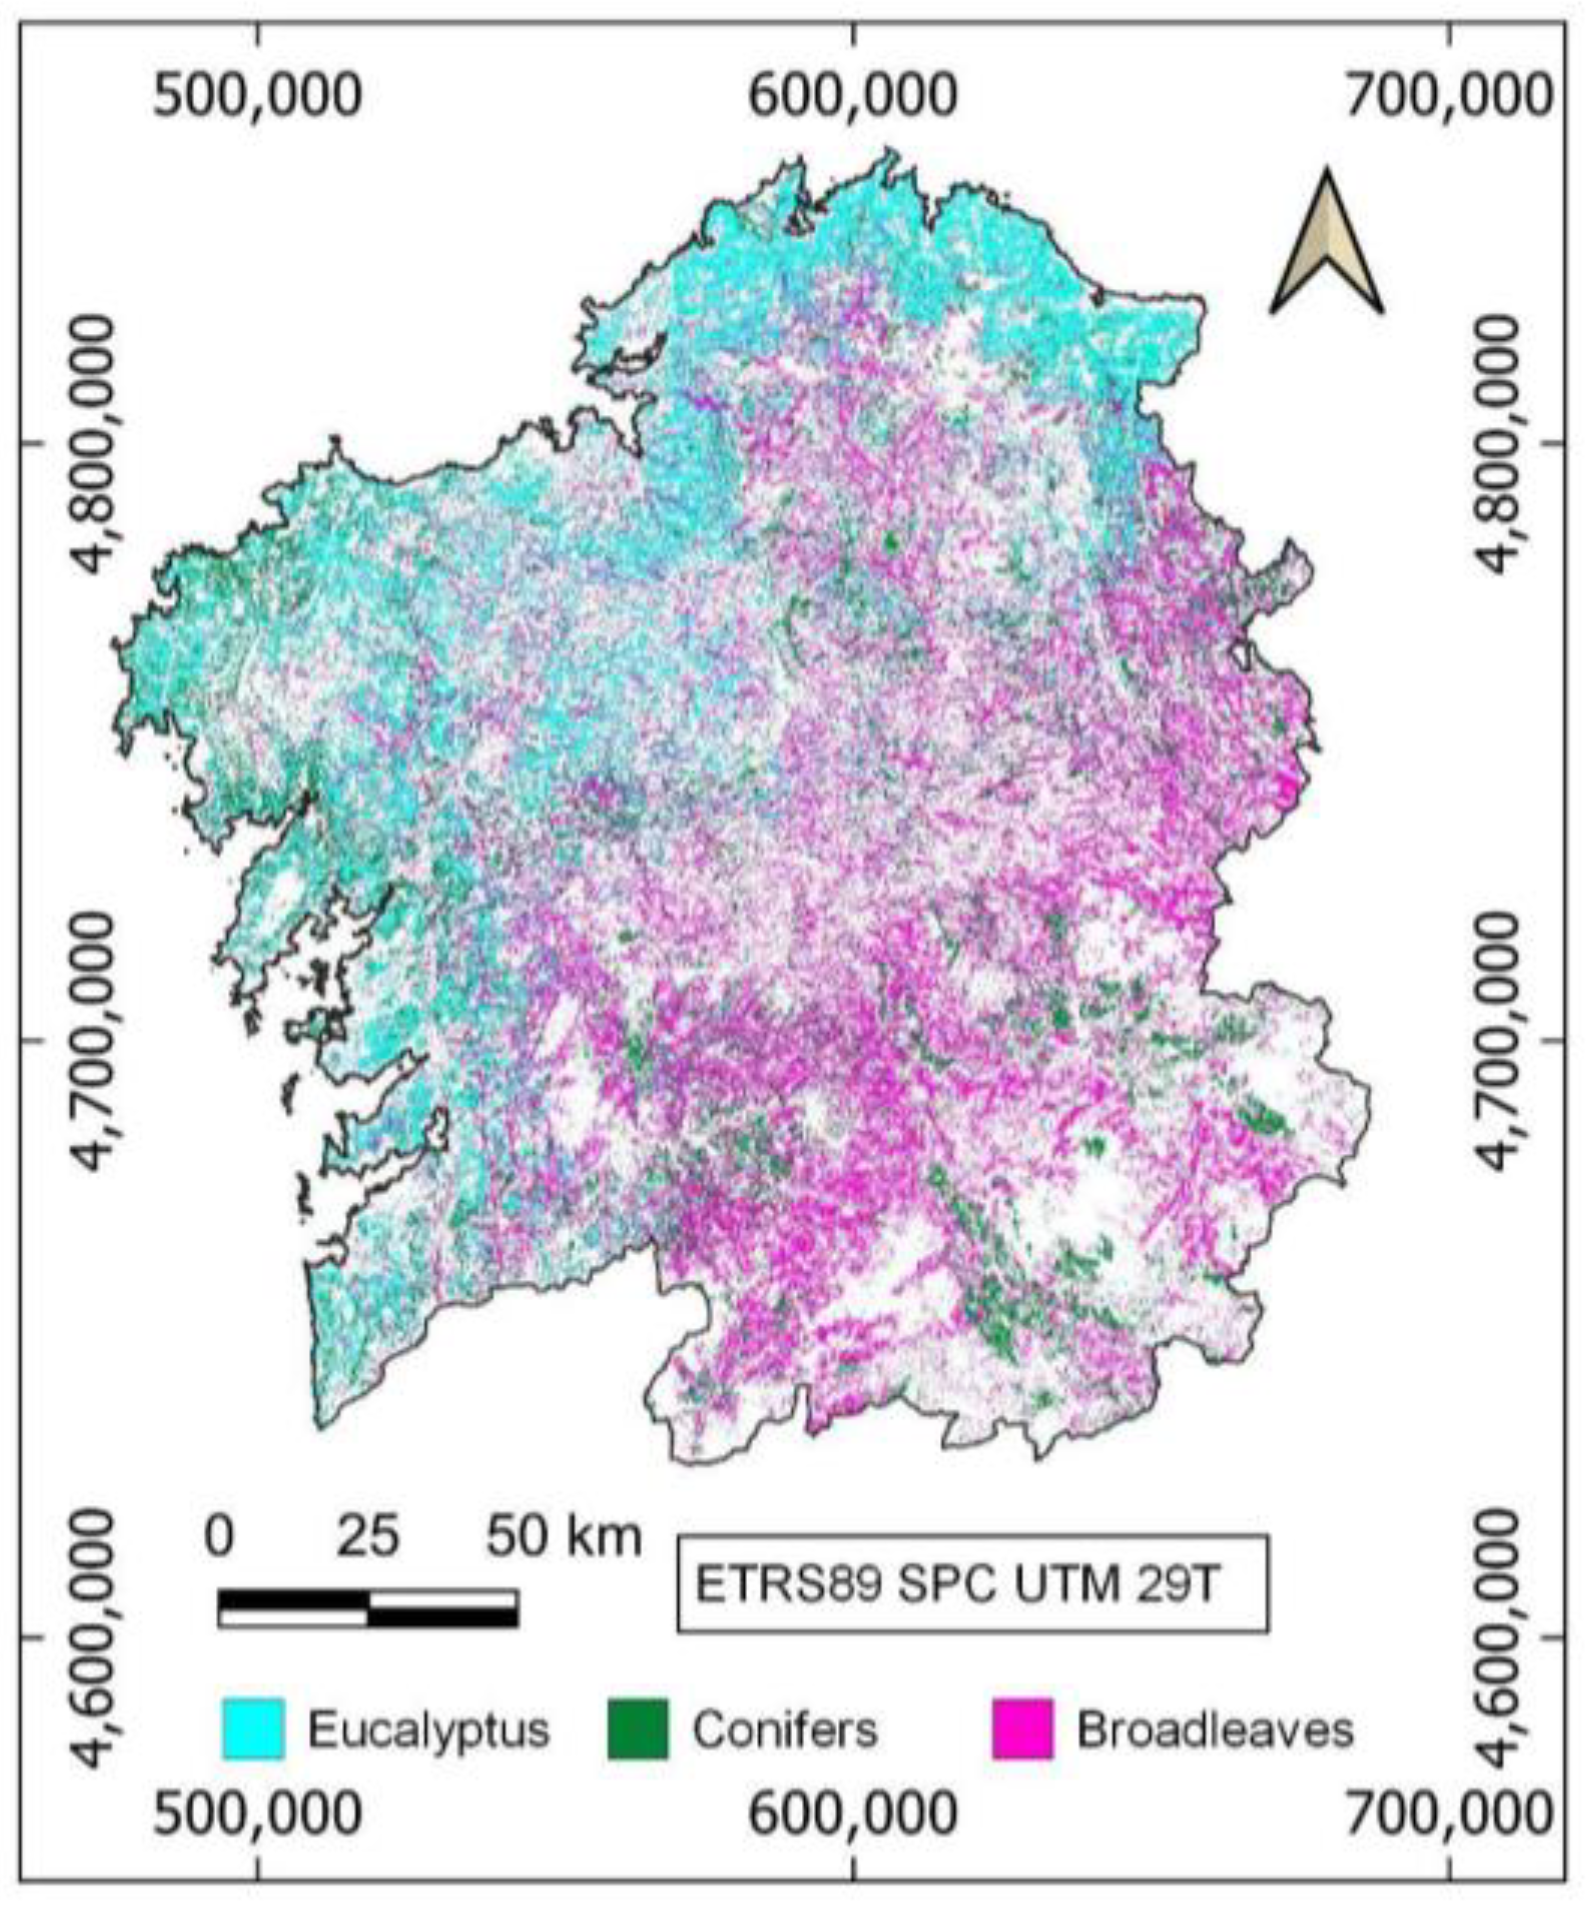
60], which was specifically designed to map forest covers in Galicia. The methodology consists of classifying monthly Sentinel-2 images using the random forest algorithm. The training data were collected disaggregating the main forest covers into Eucalyptus forests, coniferous forests and broadleaf forests. A complete list of the thematic classes is shown in Table 7. The time series in this study was 36 months (2020–2022) in order to ensure the detection of steady land covers. The whole set of monthly classifications are aggregated using decision criteria. The applied criterion consisted in assigning the most frequent land cover detected along the time series to a certain pixel [61]. The resolution of the map was 10 m.
Forest disturbances were mapped separately. Harvest detection was performed following the methodology described by Alonso et al. [62]. First, potential disturbance pixels were identified through the comparison of consecutive-year stable land cover maps. The consecutive year pairs analyzed were 2020–2021 and 2021–2022. Then, real disturbances were detected by analyzing bi-annual series of the NDVI index [63]; specifically, the NDVI decision tree described by Alonso et al. [62] was used to identify pixels that correspond to real changes and harvesting. Finally, wildfires were incorporated using the WILDFIRE database described in the Section 3.1. All pixels within a wildfire polygon for the years 2020, 2021 and 2022 were classified as wildfire pixels on the final map. Both wildfires and harvesting were mapped at a 10 m resolution. An overview of the entire methodology used to generate the updated forest map is shown in Figure 4.
The final map was verified using a random stratified sample of ground truth points. A total of 570 points per class were sampled. The harvesting class was verified separately for Eucalyptus, conifers and broadleaves; the land cover map for the year 2020 was used for support. The ground truth of the points was obtained by analyzing the PNOA images presented in the Section 3.3. A confusion matrix was created, and the following metrics were calculated: Overall Accuracy (OA), Producer’s Accuracy (PA), User’s Accuracy (UA), F-Score and Kappa Index. The ground truth of wildfires was not verified since the wildfire data come from an official data source.

4.5.2. Forest Characterization in Terms of FWS

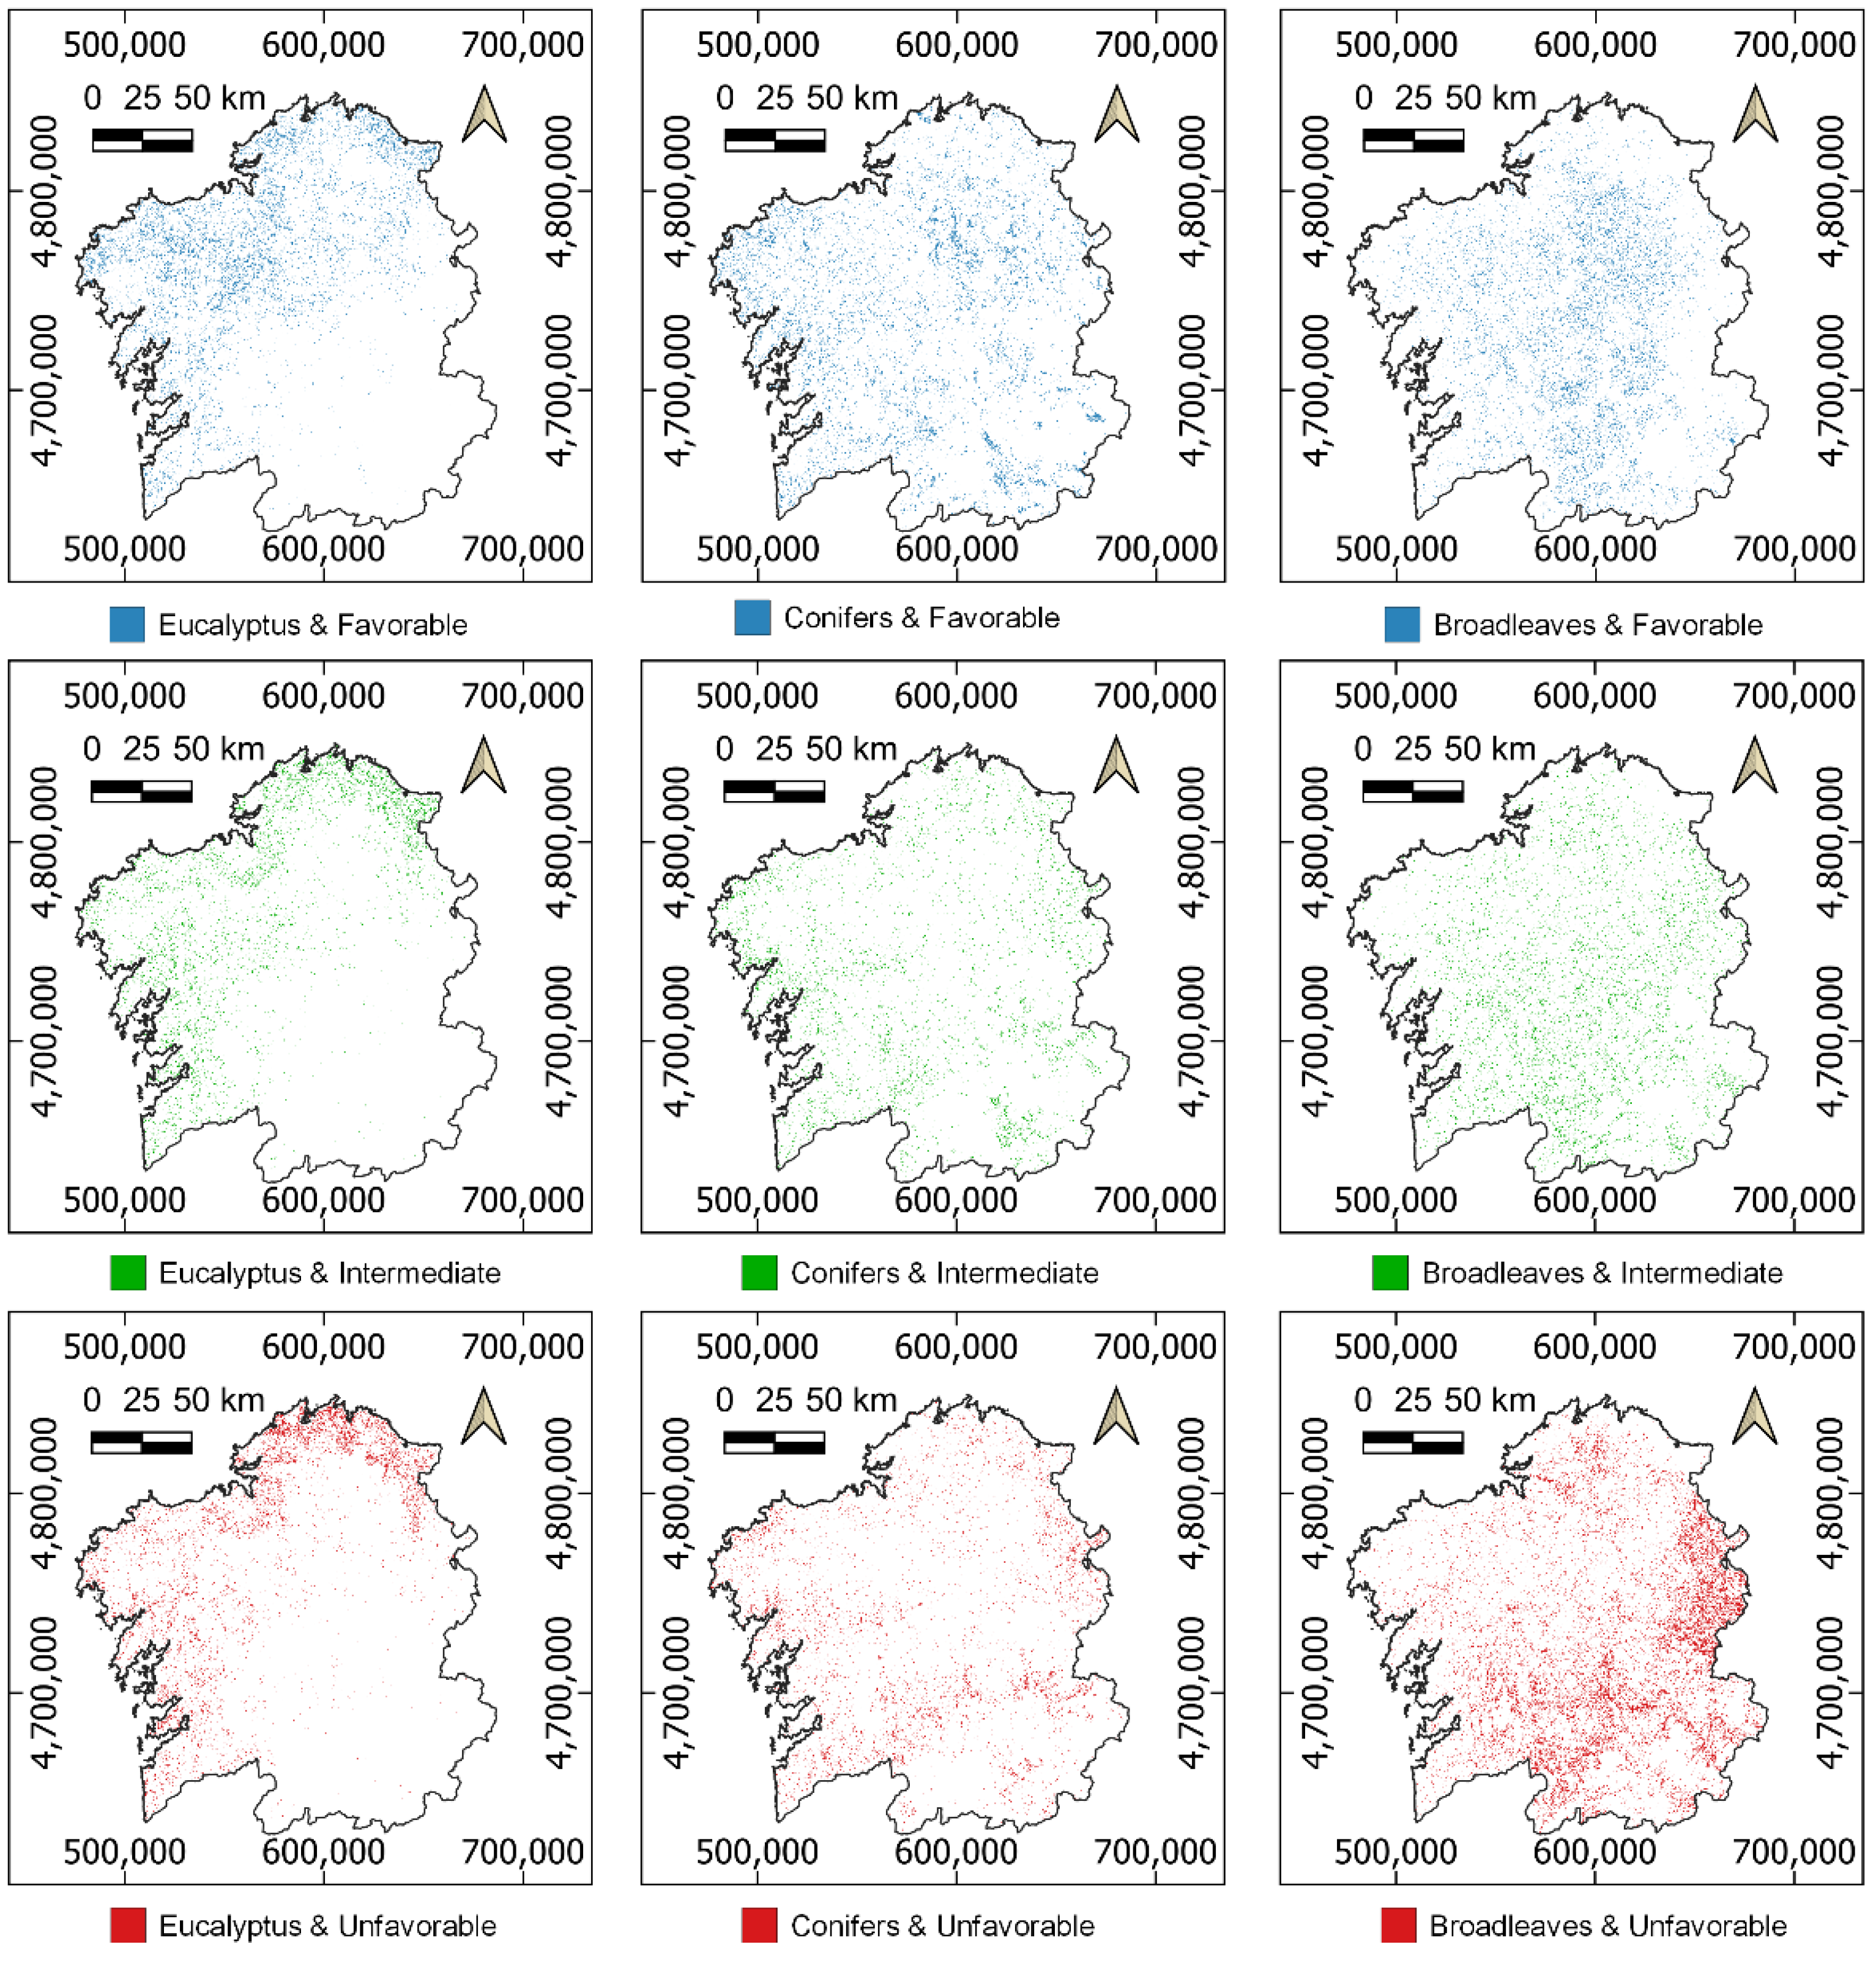
Once the forest-oriented land cover map was obtained it was analyzed alongside the overall FWS map. Only the Eucalyptus, conifer and broadleaf tree covers were considered. They were studied in both numerical and spatial terms. First, percentages were obtained to represent the extension of each tree cover class in the obtained restrictions maps: the legal restrictions map, the technical restrictions map and the FWS map. Subsequently, the spatial distribution of each tree cover was obtained according to its FWS.

5. Results

5.1. Territory Characterization

The legal feasibility, technical feasibility and global FWS maps are presented in Figure 5, Figure 6 and Figure 7. Figure 5, which presents the legal feasibility map, shows that most of Galicia is covered by pixels with 0 and 1 legal restrictions; these pixels represent 84% of the total study area (with 45% of the study area having no restrictions, and 39% having one restriction). Areas with several restrictions correspond to areas where natural heritage sites overlap with the areas surrounding rivers, buildings and/or cultural heritage sites (see detailed captures in Figure 5). The technical feasibility map is shown in Figure 6; it provides the distribution of the qualitative classes of technical feasibility for the whole region. The favorable class represents 19% of the total area, the intermediate class 36%, the unfavorable class 19% and the highly unfavorable class 26%. Finally, Figure 7 shows the overall FWS map. It can be seen that most of Galicia corresponds to the favorable class, which comprises 46% of the total study area. The unfavorable class mainly corresponds to the mountainous areas on the eastern and southern edges of Galicia, the rugged coastal region in the north and the main river canyons in the region (the Miño and the Sil).

5.2. Characterization of Forest Resources

5.2.1. Land Cover Mapping

The methodology described produces a forest-oriented map for Galicia that satisfactorily represents the updated distribution of the main forest stands and the recently disturbed areas, as well as other land uses. The confusion matrix of the map is shown in Table 8. The OA is 83.3%. The tree covers (Eucalyptus, conifers and broadleaves) present high accuracies: the UAs and PAs for the three classes range between 74.2% and 91.9%. The harvesting class has high accuracy values as well: above 85%. The distribution of the tree covers according to the map produced is shown in Figure 8. According to the figure, Eucalyptus stands are distributed mainly along the coastal areas while the rest of the classes are present across the whole region.

5.2.2. Forest Characterization in Terms of FWS

Table 9, Table 10, Table 11 and Table 12 show the quantitative results of the analysis of the forest resources in terms of their FWS. Table 9 shows the distribution of the categories of the legal restrictions for the three tree classes. According to these results, the forest resources, irrespective of tree class, are mostly distributed in areas without any or with just one legal restriction. Broadleaves is the tree class with the greatest presence in areas with several legal restrictions.
Table 10 and Table 11 show the distribution of the technical restriction categories for the tree classes. Table 10 shows the results for each restriction parameter. It reveals that areas that are favorable or intermediate in terms of FWS considering the restrictions “slope” and “distance to roads” prevail in the three tree classes: the sum of the percentages is over 50% for slope and over 90% for distance to roads. However, according to the “size” restriction, in the Eucalyptus and broadleaf classes, the unfavorable class prevails: nearly 50% of the total Eucalyptus area and 57% of the broadleaf area correspond to small stand properties which are deemed unfavorable for wood supply. Table 11 shows the results for the technical feasibility categories. The favorable and intermediate classes together comprise only 50% for conifers. For the Eucalyptus and broadleaf classes, the highly unfavorable class houses the greatest percent of trees, reaching 45% in broadleaves.
Table 12 shows the distribution of the overall FWS categories for the three tree classes, considering both legal and technical constraints. The most frequent FWS category for confers and Eucalyptus is favorable: in both cases it is above 40%. In contrast, most broadleaves are in unfavorable areas (49%).
The geospatial distribution of the tree covers according to the FWS categories is shown in Figure 9. The map reveals that favorable and unfavorable areas seem to be distributed throughout the study area and that there are no clear regions with a dominance of any one FWS category. Nevertheless, differences appear when tree classes are analyzed separately. For example, for Eucalyptus in the northern inland part of Galicia, the favorable class prevails, while for the northern coastal region, the unfavorable category prevails. For conifers, it seems that the feasibility classes are distributed throughout the region. Finally, regarding broadleaves, the unfavorable class clearly prevails in the mountainous areas along the eastern boundary of Galicia.

6. Discussion

This study describes a methodology to characterize forest resources according to their FWS considering specific regional needs and restrictions. The approach follows the current trend of the scientific community, which focuses on analyzing the availability of forest resources for wood supply from multiple perspectives. For instance, Fischer et al. [10] focused on legal restrictions while Alberdi et al. [11] and Vauhkonen et al. [14] focused on monitoring FAWS according to economic, environmental and social factors. These kinds of studies provide useful information about which resources are available for harvesting and which are not. However, this study marks an advancement in that it incorporates all the constraints that affect in any way the wood supply for monitoring the FWS. This approach is of special relevance since, as Vauhkonen et al. [14] indicate, wood supply projections can vary significantly depending on whether constraints that partially affect the wood supply are considered or not. As a result of the constraint analysis, compilation and aggregation, different categories of FWS are provided for the main forest resources, as well as a map with their geolocation. The resulting map represents an important aid for stakeholders in identifying priority areas for wood acquisition and the subsequent decision making.
An interesting map-focused approach was recently developed by Pucher et al. [27]. They developed a map of Europe’s potential wood supply, differentiating between different harvesting systems. This map could be used as a proxy for wood supply feasibility. The comparison of their map with the one developed in this study reveals analogous results. For instance, the coastal area in the northeast of Galicia is mainly classified as unfavorable in this study; analogously, the map developed by Pucher et al. [27] indicates that in this area the harvesting systems to be applied should be winch-assisted harvesters and winch-assisted forwarders, systems that are appropriate in steep areas where conventional forwarder operations are not technically feasible [64]. It should be highlighted that the maps produced in this study have a higher spatial resolution than the map produced by Pucher et al. [27]: 10 m versus 500 m. This increased resolution is essential for ensuring the implementation of the maps for forest management in a region dominated by small-holding tenure, and for allowing for appropriate decision-making at both the local and stand scales.
The methodology designed represents another interesting advantage in relation to other previous ones: the quantitative and qualitative results can be updated continuously. In contrast, the studies of Alberdi et al. [11] and Vauhkonen et al. [14], which are based on the existing NFI inventories, can only be updated when new editions of the NFI are released. Other studies such as the ones by Pucher et al. [27] and Verkerk et al. [13], which are based on Copernicus High Resolution Layers [65] and Corine Land Cover products [65], also depend on the updating of these products. Furthermore, although Copernicus High Resolution Layers are more frequently updated than the NFI, they only differentiate between broadleaf and coniferous forests [65,66], which can be insufficient in certain regions. This study reports the FWS corresponding to the main tree classes that are present in the study area. This is important since different types of trees are associated with different types of wood products [67] and distinguishing between them can be essential for explaining variations in wood production [13]. Finally, the incorporation in the final map of disturbances on an annual basis is essential when predicting forest availability for wood supply in a region like Galicia that is continuously subjected to disturbances, and has a large proportion of fast-growth species such as Eucalyptus spp.
The categorization of the forest resources in Galicia according to their FWS show that broadleaves is the tree class with the largest area in the unfavorable category. This may be due to the fact that they commonly grow in mountainous areas and in areas with restrictions such as environmentally protected areas and riparian zones. In relation to the other tree classes, Eucalyptus and conifers, the results reveal that the favorable category prevails. These are the main productive classes, according to regional forestry administration reports, that indicate that more than 95% of the annual harvested volume of timber in Galicia corresponds to Pinus spp. and Eucalyptus spp. [68]. In particular, roughly 60% of the total volume of wood harvested in Galicia each year is wood from Eucalyptus spp. However, the area that is classified as unfavorable for Eucalyptus spp. reaches 32%. Considering the difficulties that the mobilization of wood in unfavorable areas might entail, designing policies aimed at forest cover substitution in these areas might be considered.
Once the FWS is obtained for the whole region, further studies about wood supply can be accomplished. For this end, information of the forests stands like volume, tree density or management system will be needed. Nowadays these variables are not currently updated in the study area; the only source dates from 2011 (Spanish NFI [33]) but it has not been generated in a geospatially explicit format. The Galician government has recently launched a project, together with Galician forest universities, to update the forest inventory information in this region [69]. This project will provide detailed information on wood volumes and stand characteristics, among other outputs. Once the results are provided, combined analysis of updated inventory variables with the FWS maps will allow to generate wood supply reports in the study area.
The feasibility maps for the entirety of the study area represent an essential tool for designing land management actions and forest policies such as the design of regional afforestation and reforestation plans and the definition of the future role of the forests (either protective or productive). At a regional level, this could play a crucial role in the current tendency towards developing policies aimed at reducing the impact of climate change [70]. Additionally, the maps can help improve land-use planning in an area subject to land abandonment and hence to forest expansion processes, as is the case in Galicia [39] and in many other regions in Europe [71].

7. Conclusions

This study presents a methodology for producing a map of the FWS adapted to the specific needs of a region. The high resolution at which it is produced makes it suitable for an area dominated by forest smallholdings and allows for decision making even on local scales. Additionally, the methodology produced allows for the wood supply availability to be continuously updated, meaning that forest disturbances are incorporated on an annual basis. Observation of the maps obtained reveals that a relatively large share of the productive tree species is found in areas that are unfavorable for wood supply.
The methodology additionally allows for the mapping of the FWS of the whole region, not only for the area currently covered by forest. This could be useful in the landscape planning of a region involved in a land abandonment process. Hence, the obtained maps could be an essential tool for forest planning. Using these maps would help in the move towards more sustainable forest management and aid in increasing the competitiveness of the Galician forest value chain while at the same time ensuring the protective functions of forests. Future works could explore Galician landscape planning according to the FWS.

Author Contributions

Conceptualization, J.P. and J.A.; methodology, A.R.-D., L.A., J.P. and J.A.; data curation, A.R.-D. and L.A.; formal analysis, A.R.-D. and L.A.; investigation, A.R.-D. and L.A.; software, A.R.-D. and L.A.; supervision, A.R.-D. and L.A.; validation, A.R.-D. and L.A.; visualization, A.R.-D. and L.A.; writing—original draft, A.R.-D. and L.A.; funding acquisition, J.P. and J.A.; project administration, J.P. and J.A.; resources, J.P. and J.A.; writing—review & editing, J.P. and J.A. All authors have read and agreed to the published version of the manuscript.

Funding

This research was funded by the Administration of Rural Areas of the Government of Galicia under Grant 2020CONVINVENTARIOFORESTALR002; the Spanish Ministry of Sciences, Innovation and Universities under the grant FPU19/02054; EP-INTERREG VA España Portugal (POCTEP) under grant FIREPOCTEP; Spanish Ministry of Sciences, Innovation and Universities under Grant PID2019-111581RB-I00. Funding for open access charge: Universidade de Vigo/CISUG.

Data Availability Statement

The data are not publicly available due to privacy restrictions of the project.

Conflicts of Interest

The authors declare no conflict of interest.

References

  1. European Commission. New EU Forest Strategy for 2030. Communication from the Commission to the European Parliament, the Council, the European Economic and Social Committee and the Committee of the Regions, COM 2021, 572 Final. Available online: https://eur-lex.europa.eu/legal-content/EN/TXT/?uri=CELEX%3A52021DC0572 (accessed on 17 March 2023).
  2. Leskinen, P.; Cardellini, G.; González-García, S.; Hurmekoski, E.; Sathre, R.; Seppälä, J.; Smyth, C.; Stern, T.; Verkerk, P.J. Substitution Effects of Wood-Based Products in Climate Change Mitigation. 2018. Available online: https://efi.int/sites/default/files/files/publication-bank/2018/efi_fstp_7_2018.pdf (accessed on 17 March 2023).
  3. Verkerk, P.J.; Costanza, R.; Hetemäki, L.; Kubiszewski, I.; Leskinen, P.; Nabuurs, G.J.; Potočnik, J.; Palahí, M. Climate-Smart Forestry: The missing link. For. Policy Econ. 2020, 115, 102164. [Google Scholar] [CrossRef]
  4. Rissman, J.; Bataille, C.; Masanet, E.; Aden, N.; Morrow, W.R.; Zhou, N.; Elliott, N.; Dell, R.; Heeren, N.; Huckestein, B.; et al. Technologies and policies to decarbonize global industry: Review and assessment of mitigation drivers through 2070. Appl. Energy 2020, 266, 114848. [Google Scholar] [CrossRef]
  5. FAO. Better data, better decisions. In Towards Impactful Forest Monitoring; Forestry Working Paper; FAO: Rome, Italy, 2020; p. 16. [Google Scholar] [CrossRef]
  6. FOREST EUROPE. State of Europe’s Forests. 2020. Available online: https://foresteurope.org/wp-content/uploads/2016/08/SoEF_2020.pdf (accessed on 17 March 2023).
  7. Tomppo, E.; Schadauer, K.; McRoberts, R.E.; Gschwantner, T.; Gabler, K.; Ståhl, G. Introduction. In National Forest Inventories: Pathways for Common Reporting; Tomppo, E., Gschwantner, T., Lawrence, M., McRoberts, R.E., Eds.; Springer: Dordrecht, The Netherlands, 2010; pp. 1–18. [Google Scholar]
  8. Chirici, G.; McRoberts, R.E.; Winter, S.; Bertini, R.; Brändli, U.; Asensio, I.A.; Bastrup-Birk, A.; Rondeux, J.; Barsoum, N.; Marchetti, M. National Forest Inventory Contributions to Forest Biodiversity Monitoring. For. Sci. 2012, 58, 257–268. [Google Scholar] [CrossRef]
  9. Alberdi, I.; Michalak, R.; Fischer, C.; Gasparini, P.; Brändli, U.B.; Tomter, S.M.; Kuliesis, A.; Snorrason, A.; Redmond, J.; Hernández, L.; et al. Towards harmonized assessment of European forest availability for wood supply in Europe. For. Policy Econ. 2016, 70, 20–29. [Google Scholar] [CrossRef]
  10. Fischer, C.; Gasparini, P.; Nylander, M.; Redmond, J.; Hernandez, L.; Brändli, U.; Pastor, A.; Rizzo, M.; Alberdi, I. Joining Criteria for Harmonizing European Forest Available for Wood Supply Estimates. Case Studies from National Forest Inventories. Forests 2016, 7, 104. [Google Scholar] [CrossRef]
  11. Alberdi, I.; Bender, S.; Riedel, T.; Avitable, V.; Boriaud, O.; Bosela, M.; Camia, A.; Cañellas, I.; Castro Rego, F.; Fischer, C.; et al. Assessing forest availability for wood supply in Europe. For. Policy Econ. 2020, 111, 102032. [Google Scholar] [CrossRef]
  12. Lind, T.; Trubins, R.; Lier, M.; Packalen, T. Harmonization of Definitions for Sustainable Biomass Supply in Terms of Sustainability Constraints in Relation to Experiences and Guidelines from International Processes and Projects e.g., Forest Europe, UNECE SFM, EU projects BEE and S2BIOM, as Well as Form the European Bioeconomy Observatory (BISO)—Guidelines for Harmonization of Biomass Supply Analyses. Deliverable 5.1 of the European Union’s Horizon 2020 Research and Innovation Programme Project DIABOLO—Distributed, Integrated and Harmonised Forest Information for Bioeconomy Outlooks; Technical Report No. 633464; European Commission: Brussels, Belgium, 2016; p. 31. Available online: https://ec.europa.eu/research/participants/documents/downloadPublic?documentIds=080166e5a6c4746e&appId=PPGMS (accessed on 17 March 2023).
  13. Verkerk, P.J.; Anttila, P.; Eggers, J.; Lindner, M.; Asikainen, A. The realisable potential supply of woody biomass from forests in the European Union. For. Ecol. Manag. 2011, 261, 2007–2015. [Google Scholar] [CrossRef]
  14. Vauhkonen, J.; Berger, A.; Gschwantner, T.; Schadauer, K.; Lejeune, P.; Perin, J.; Pitchugin, M.; Adolt, R.; Zeman, M.; Johannsen, V.K.; et al. Harmonised projections of future forest resources in Europe. Ann. For. Sci. 2019, 76, 79. [Google Scholar] [CrossRef]
  15. Berg, S.; Fischbach, J.; Brüchert, F.; Poissonnet, M.; Pizzirani, S.; Varet, A.; Sauter, U.H. Towards assessing the sustainability of European logging operations. Eur. J. For. Res. 2012, 131, 81–94. [Google Scholar] [CrossRef]
  16. Soman, H.; Kizha, A.R.; Roth, B.E. Impacts of silvicultural prescriptions and implementation of best management practices on timber harvesting costs. Int. J. For. Eng. 2019, 30, 14–25. [Google Scholar] [CrossRef]
  17. Lundbäck, M.; Häggström, C.; Nordfjell, T. Worldwide trends in methods for harvesting and extracting industrial roundwood. Int. J. For. Eng. 2021, 32, 202–215. [Google Scholar] [CrossRef]
  18. Louis, L.T.; Kizha, A.R.; Daigneault, A.; Han, H.; Weiskittel, A. Factors Affecting Operational Cost and Productivity of Ground-Based Timber Harvesting Machines: A Meta-analysis. Curr. For. Rep. 2022, 8, 38–54. [Google Scholar] [CrossRef]
  19. Proto, A.R.; Macrì, G.; Visser, R.; Harrill, H.; Russo, D.; Zimbalatti, G. A Case Study on the Productivity of Forwarder Extraction in Small-Scale Southern Italian Forests. Small-Scale For. 2018, 17, 71–87. [Google Scholar] [CrossRef]
  20. Gagliardi, K.; Ackerman, S.; Ackerman, P. Multi-product forwarder-based timber extraction: Time consumption and productivity analysis of two forwarder models over multiple products and extraction distances. Croat. J. For. Eng. 2020, 41, 1–12. [Google Scholar] [CrossRef]
  21. Poje, A.; Pezdevšek Malovrh, Š.; Krč, J. Factors Affecting Harvesting Intensity in Small-Scale Private Forests in Slovenia. Small-Scale For. 2016, 15, 73–91. [Google Scholar] [CrossRef]
  22. Redmond, J. Ireland. In National Forest Inventories: Assessment of Wood Availability and Use; Vidal, C., Alberdi, I.A., Hernández Mateo, L., Redmond, J.J., Eds.; Springer International Publishing: Cham, Switzerland, 2016; pp. 467–484. [Google Scholar]
  23. Alberdi, I.; Hernández, L.; Condés, S.; Vallejo, R.; Cañellas, I. Spain. In National Forest Inventories: Assessment of Wood Availability and Use; Vidal, C., Alberdi, I.A., Hernández Mateo, L., Redmond, J.J., Eds.; Springer International Publishing: Cham, Switzerland, 2016; pp. 749–767. [Google Scholar]
  24. Gasparini, P.; Papitto, G. The Italian Forest Inventory in Brief. In Italian National Forest Inventory—Methods and Results of the Third Survey: Inventario Nazionale delle Foreste e dei Serbatoi Forestali di Carbonio—Metodi e Risultati della Terza Indagine; Gasparini, P., Di Cosmo, L., Floris, A., De Laurentis, D., Eds.; Springer International Publishing: Cham, Switzerland, 2022; pp. 1–15. [Google Scholar]
  25. Makisara, K.; Katila, M.; Perasaari, J. The Multi-Source National Forest Inventory of Finland—Methods and Results 2015. Natural Resources and Bioeconomy Studies 8/2019. Natural Resources Institute Finland. Available online: http://urn.fi/URN:ISBN:978-952-326-711-4 (accessed on 17 March 2023).
  26. Verkerk, P.J.; Levers, C.; Kuemmerle, T.; Lindner, M.; Valbuena, R.; Verburg, P.H.; Zudin, S. Mapping wood production in European forests. For. Ecol. Manag. 2015, 357, 228–238. [Google Scholar] [CrossRef]
  27. Pucher, C.; Erber, G.; Hasenauer, H. Europe’s Potential Wood Supply by Harvesting System. Forests 2023, 14, 398. [Google Scholar] [CrossRef]
  28. Seidl, R.; Schelhaas, M.; Rammer, W.; Verkerk, P.J. Increasing forest disturbances in Europe and their impact on carbon storage. Nat. Clim. Change 2014, 4, 806–810. [Google Scholar] [CrossRef]
  29. Seidl, R.; Thom, D.; Kautz, M.; Martin-Benito, D.; Peltoniemi, M.; Vacchiano, G.; Wild, J.; Ascoli, D.; Petr, M.; Honkaniemi, J.; et al. Forest disturbances under climate change. Nat. Clim. Change 2017, 7, 395–402. [Google Scholar] [CrossRef]
  30. Senf, C.; Seidl, R. Storm and fire disturbances in Europe: Distribution and trends. Glob. Change Biol. 2021, 27, 3605–3619. [Google Scholar] [CrossRef]
  31. Levers, C.; Verkerk, P.J.; Müller, D.; Verburg, P.H.; Butsic, V.; Leitão, P.J.; Lindner, M.; Kuemmerle, T. Drivers of forest harvesting intensity patterns in Europe. For. Ecol. Manag. 2014, 315, 160–172. [Google Scholar] [CrossRef]
  32. MAPA. Anuario de Estadística. 2021. Available online: https://www.mapa.gob.es/es/estadistica/temas/publicaciones/anuario-de-estadistica/2021/default.aspx (accessed on 17 March 2023).
  33. MMAMM. Cuarto Inventario Forestal Nacional. Galicia. Available online: https://www.miteco.gob.es/es/biodiversidad/temas/inventarios-nacionales/galicia_tcm30-531786.pdf (accessed on 17 March 2023).
  34. IGE. Contas Económicas de Galicia. Revisión Estatística 2019. Available online: https://www.ige.gal/estatico/html/gl/OperacionsEstruturais/PDF/Resumo_resultados_Contas_Anuais.pdf (accessed on 17 March 2023).
  35. Xunta de Galicia. 1ª Revisión do Plan Forestal de Galicia. Available online: https://mediorural.xunta.gal/sites/default/files/temas/forestal/plan-forestal/20211112-Plan-Forestal-Galicia-2021-2040.pdf (accessed on 17 March 2023).
  36. Gobierno de España; Ministerio de Hacienda y Función Pública. Dirección General del Catastro. Available online: http://www.catastro.minhap.gob.es/webinspire/index.html (accessed on 21 September 2020).
  37. MITECO. Avance Informativo de Incendios Forestales. Available online: https://www.miteco.gob.es/es/biodiversidad/temas/incendios-forestales/estadisticas-avances.aspx (accessed on 17 March 2023).
  38. MITECO. Anuarios de Estadística Forestal. Available online: https://www.miteco.gob.es/es/biodiversidad/estadisticas/forestal_anuarios_todos.aspx (accessed on 17 March 2023).
  39. Corbelle-Rico, E.; Sánchez-Fernández, P.; López-Iglesias, E.; Lago-Peñas, S.; Da-Rocha, J. Putting land to work: An evaluation of the economic effects of recultivating abandoned farmland. Land Use Policy 2022, 112, 105808. [Google Scholar] [CrossRef]
  40. IGN. Modelo Digital del Terreno—MDT05. Centro de Descargas del CNIG. Available online: https://centrodedescargas.cnig.es/CentroDescargas/busquedaSerie.do?codSerie=MDT05 (accessed on 21 September 2020).
  41. DOG. DECRETO 73/2020, do 24 de Abril, Polo que se Regulan os Aproveitamentos Madeireiros e Leñosos, de Cortiza, de Pastos, Micolóxicos e de Resinas en Montes ou Terreos Forestais de Xestión Privada na Comunidade Autónoma de Galicia. Diario Oficial de Galicia, 97, 20 de Maio de. 2020. Available online: https://www.xunta.gal/dog/Publicados/2020/20200520/AnuncioG0426-080520-0001_gl.html (accessed on 17 March 2023).
  42. BOE. Ley 22/1988, de 28 de julio, de Costas. Boletín Oficial del Estado, 181, de 29 de Julio de 1988. Available online: https://boe.es/buscar/act.php?id=BOE-A-1988-18762 (accessed on 17 March 2023).
  43. Xunta de Galicia. Rede Galega de Espazos Protexidos. Available online: https://cmatv.xunta.gal/seccion-tema/c/CMAOT_Conservacion?content=Direccion_Xeral_Conservacion_Natureza/Espazos_protexidos/seccion.html&sub=Rede_galega/ (accessed on 17 March 2023).
  44. MITECO. Espacios Naturales Protegidos. Available online: https://www.miteco.gob.es/es/biodiversidad/servicios/banco-datos-naturaleza/informacion-disponible/enp_descargas.html (accessed on 16 October 2023).
  45. INE. Distribución de Unidades Poblacionales por Comunidades Autónomas y Provincias. Available online: https://www.ine.es/nomen_files/DistribucionUnidPoblacionales.xls (accessed on 17 March 2023).
  46. BOE. Ley 3/2007, de 9 de Abril, de Prevención y Defensa Contra los Incendios Forestales de Galicia. Boletín Oficial del Estado, 119, de 18 de mayo de 2007. Available online: https://www.boe.es/buscar/act.php?id=BOE-A-2007-10022 (accessed on 17 March 2023).
  47. BOE. Ley 37/2015, de 29 de Septiembre, de Carreteras. Boletín Oficial del Estado, 234, de 30 de Septiembre de 2015. Available online: https://www.boe.es/buscar/act.php?id=BOE-A-2015-10439 (accessed on 17 March 2023).
  48. Xunta de Galicia. Base Topográfica de Galicia 2020—Información Xeográfica de Galicia. Available online: http://mapas.xunta.gal/base-topografica-2020 (accessed on 20 September 2020).
  49. Xunta de Galicia. Aproveitamentos Forestais. Available online: https://mapas.xunta.gal/visores/aproveitamentos/ (accessed on 20 September 2020).
  50. Xunta de Galicia. Zonas de Especial Protección dos Valores Naturais. Available online: https://www.sergas.gal/Saude-publica/GIS-Rede-espazos-protexidos?idioma=es (accessed on 20 September 2020).
  51. IGN. Modelo Digital de Pendientes—MDP05. Centro de Descargas del CNIG. Available online: https://centrodedescargas.cnig.es/CentroDescargas/busquedaSerie.do?codSerie=MDP05 (accessed on 21 September 2020).
  52. ESA. ESA Standard Document—Sentinel-2 User Handbook. 2015. Available online: https://sentinels.copernicus.eu/web/sentinel/user-guides/document-library/-/asset_publisher/xlslt4309D5h/content/sentinel-2-user-handbook (accessed on 20 December 2022).
  53. ESA. Copernicus and European Commission. Copernicus Open Access Hub. Available online: https://scihub.copernicus.eu/dhus/#/home (accessed on 20 December 2022).
  54. IGN. Ortofoto PNOA Máxima Actualidad. Available online: http://centrodedescargas.cnig.es/CentroDescargas/catalogo.do?Serie=FPNOA (accessed on 17 March 2023).
  55. MTMAU. Plan Nacional de Ortofotografía Aérea (PNOA). Available online: https://pnoa.ign.es/web/portal/pnoa-imagen/presentacion (accessed on 17 March 2023).
  56. Conrad, O.; Bechtel, B.; Bock, M.; Dietrich, H.; Fischer, E.; Gerlitz, L.; Wehberg, J.; Wichmann, V.; Böhner, J. System for automated geoscientific analyses (SAGA) v. 2.1. 4. Geosci. Model Dev. 2015, 8, 1991–2007. [Google Scholar] [CrossRef]
  57. QGIS Development Team. QGIS geographic information system (Version 3.22.7 Białowieża). QGIS Association. Available online: https://www.qgis.org (accessed on 17 March 2023).
  58. ESRI. Understanding Euclidean distance analysis—ArcMap|Documentation. Available online: https://desktop.arcgis.com/en/arcmap/latest/tools/spatial-analyst-toolbox/understanding-euclidean-distance-analysis.htm# (accessed on 17 March 2023).
  59. Zimbalatti, G.; Proto, A.R. Productivity of forwarders in south Italy. In Proceedings of the 44th FORMEC Symposium, Padova, Italy, 11–14 July 2010; Available online: https://www.formec.org/images/proceedings/2010/Ab108.pdf (accessed on 17 March 2023).
  60. Alonso, L.; Picos, J.; Armesto, J. Forest Land Cover Mapping at a Regional Scale Using Multi-Temporal Sentinel-2 Imagery and RF Models. Remote Sens. 2021, 13, 2237. [Google Scholar] [CrossRef]
  61. Lewiński, S.; Nowakowski, A.; Malinowski, R.; Rybicki, M.; Kukawska, E.; Krupiński, M. Aggregation of Sentinel-2 Time Series Classifications as a Solution for Multitemporal Analysis. In Proceedings Volume 10427, Image and Signal Processing for Remote Sensing XXIII; SPIE Remote Sensing: Warsaw, Poland, 2017. [Google Scholar]
  62. Alonso, L.; Picos, J.; Armesto, J. Automatic forest change detection through a bi-annual time series of satellite imagery: Toward production of an integrated land cover map. Int. J. Appl. Earth Obs. Geoinf. 2023, 118, 103289. [Google Scholar] [CrossRef]
  63. Tarpley, J.; Schneider, S.R.; Money, R. Global vegetation indices from the NOAA-7 meteorological satellite. J. Clim. 1984, 23, 491–494. [Google Scholar] [CrossRef]
  64. Holzfeind, T.; Stampfer, K.; Holzleitner, F. Productivity, setup time and costs of a winch-assisted forwarder. J. For. Res. 2018, 23, 196–203. [Google Scholar] [CrossRef]
  65. Copernicus. Forest Type 2018. Available online: https://land.copernicus.eu/pan-european/high-resolution-layers/forests/forest-type-1/status-maps/forest-type-2018 (accessed on 17 March 2023).
  66. Copernicus. Corine Land Cover 2018. Available online: https://land.copernicus.eu/pan-european/corine-land-cover/clc2018 (accessed on 17 March 2023).
  67. DOG. RDEN de 9 de Febrero de 2021 por la que se Modifica el Anexo I de la Orden de 19 de Mayo de 2014 por la que se Establecen los Modelos Silvícolas o de Gestión Forestal Orientativos y Referentes de Buenas Prácticas Forestales para los Distritos Forestales de Galicia. Diario Oficial de Galicia, 39, 26 de Febrero de 2021. Available online: https://www.xunta.gal/dog/Publicados/2021/20210226/AnuncioG0426-110221-0005_es.html (accessed on 17 March 2023).
  68. Xunta de Galicia. Observatorio Forestal. Available online: https://ovmediorural.xunta.gal/es/consultas-publicas/observatorio-forestal (accessed on 17 March 2023).
  69. Xunta de Galicia. Inventario Forestal Continuo de Galicia. Available online: https://invega.xunta.gal/invega/ (accessed on 13 October 2023).
  70. Verkerk, H.; Delacote, P.; Hurmekoski, E.; Kunttu, J.; Matthews, R.; Mäkipää, R.; Mosley, F.; Perugini, L.; Reyer, C.; Roe, S. Forest-based climate change mitigation and adaptation in Europe. In Science to Policy; European Forest Institute: Joensuu, Finland, 2022; Volume 14. [Google Scholar] [CrossRef]
  71. Lasanta, T.; Arnáez, J.; Pascual, N.; Ruiz-Flaño, P.; Errea, M.P.; Lana-Renault, N. Space–time process and drivers of land abandonment in Europe. Catena 2017, 149, 810–823. [Google Scholar] [CrossRef]
Figure 1. Study area.
Forests 14 02124 g001
Figure 2. Land drivers. (A) Cultural heritage, (B) rivers, (C) natural protected areas, (D) roads, (E) buildings. A detailed view of the map are provided on B.1, D.1 and E.1.
Forests 14 02124 g002
Figure 4. Methodology used to obtain the ultimate forest-oriented land cover map. The orange circle marks a drop in the NDVI due to a change in forest cover.
Forests 14 02124 g004
Figure 5. Map of legal FWS categories.
Forests 14 02124 g005
Figure 6. Map of technical FWS categories.
Forests 14 02124 g006
Figure 7. Map of overall FWS categories: Galicia and detailed examples.
Forests 14 02124 g007
Figure 8. Distribution of tree covers in Galicia according to the Sentinel-2 map produced in this study.
Forests 14 02124 g008
Figure 9. Geospatial distribution of the FWS categories for the three tree covers considered.
Forests 14 02124 g009
Table 1. Geospatial data sources used. OA: openly available to the public for visualization and download under an open-access regime, VIS: available for public visualization, Request: not available to the public.
NameDescriptionFormatAvailabilityAccess Link
BTG20Topographical database of Galicia, including information regarding the distribution of road networks, hydrography, topography and buildings, among other parameters. It has a scale of 1:10,000.vectorOA[48]
GDB20Geodatabase that includes most of the areas of Galicia affected by a certain legislation conditioning forest management. vectorVIS[49]
ZEPVNMap of natural protected areas in Galicia. Perimeter of the protected areas.vectorOA[50]
SLOPESlope map in degrees with a 5 m resolution.rasterOA[51]
CADASTRALCadastral parcels. Perimeter of the cadastral parcels.vectorOA[36]
WILDFIRESGalician Wildfire database. Perimeter of annual wildfires.vectorRequest
Table 2. Restrictions for forest wood supply.
Restriction TypeRestrictionInformation Source
LegalCultural heritageGDB20
RiversGDB20
Natural protected areasZEPVN
Coastal areasGDB20
Proximity to buildingsBTG20
RoadsGDB20 and BTG20
TechnicalSlopeSLOPE
Distance to roadsBTG20
Parcel sizeCADASTRAL
Table 3. Categorization of the technical restrictions into qualitative feasibility classes.
ClassSlope Interval (%)Distance Interval (m)Size (ha)
Favorable[0, 15)[0, 100)>5
Intermediate[15, 30)[100, 500][0.5, 5]
Unfavorable[30, 45)>500[0, 0.5)
Highly unfavorable≥45
Table 4. Decision table to combine the area and distance to road technical factors.
Distance to Roads Class
Favorable (F)Intermediate (I)Unfavorable (U)
Size classFavorable (F)FFI
Intermediate (I)FIU
Unfavorable (U)IUU
Table 5. Decision table to obtain the ultimate technical feasibility categories.
Slope (%)
Favorable (F)Intermediate (I)Unfavorable (U)Highly Unfavorable (HU)
Size-Distance rasterFavorable (F)FIUHU
Intermediate (I)IUHUHU
Unfavorable (U)HU HUHUHU
Table 6. Decision table to obtain the overall FWS categories resulting from the combination of the legal and the technical feasibility categories.
Number of Legal Restrictions
0123456
Technical classesFavorable (F)FFIUUUU
Intermediate (I)FFIUUUU
Unfavorable (U)IIUUUUU
Highly unfavorable (HU)UUUUUUU
Table 7. Legend description of the forest cover map.
ClassDescription
Eucalyptus spp.Land covered by Eucalyptus spp.
ConifersLand covered by conifers
BroadleavesLand covered by broadleaves other than Eucalyptus spp.
HarvestingsAreas harvested between 2020 and 2022
ShrubsLand covered by non-tree, woody vegetation
Crops and pasturesLand covered by non-woody vegetation
Bare soilLand covered by rocks or non-anthropogenic, non-vegetated areas.
Anthropogenic areasBuildings or built-up areas or areas modified by humans, such as mines
WaterBodies of water
WildfiresWildfires occurring between 2020 and 2022
Table 8. The confusion matrix obtained for the final classification. EUC: Eucalyptus spp., CON: conifers, BRO: broadleaves, HAR: harvesting, CRO: crops and pastures, SHR: shrubs, BAR: bare soil, ANT: anthropogenic areas, WAT: water, UA: user accuracy, PA: producer accuracy, OA: overall accuracy, Ref: reference, Cla: classified.
Ref/ClaEUCCONBROHARCROSHRBARANTWATTotalUA (%)
EUC4605516433020057080.7
CON6142313175405657074.2
BRO88524431913057091.9
HAR18351071926348248300228084.5
CRO21165459452416257080.5
SHR1014515508189057089.1
BAR111101461348132257061.1
ANT021114454486857085.3
WAT0000002356557099.1
Total56053968319525398034976845836840OA (%)
PA (%)82.178.576.798.785.263.370.071.196.9OA (%)83.3
F1-Score0.810.760.840.910.830.740.650.780.98
Table 9. Percent distribution of the legal FWS categories for each tree cover class.
Number of Legal RestrictionsEucalyptusConifersBroadleavesTree Covers
063%57%38%50%
131%34%44%37%
25%8%16%10%
31%1%3%2%
40%0%0%0%
50%0%0%0%
60%0%0%0%
Total100%100%100%100%
Table 10. Percent distribution of the technical restriction categories for each tree cover class. EUC: Eucalyptus, CON: conifers, BRO: broadleaves.
SlopeDistance to RoadsSize
Feasibility ClassEUCCONBROEUCCONBROEUCCONBRO
Favorable36%36%36%67%67%58%16%40%16%
Intermediate36%34%28%33%32%40%37%26%28%
Unfavorable20%19%18%0%1%1%47%34%57%
Highly unfavorable8%11%19%
Total100%100%100%100%100%100%100%100%100%
Table 11. Percent distribution of the technical FWS categories for each tree cover class.
Feasibility ClassEucalyptusConifersBroadleavesTree Covers
Favorable14%18%9%13%
Intermediate30%34%26%29%
Unfavorable25%23%20%22%
Highly unfavorable31%25%45%36%
Total100%100%100%100%
Table 12. Percent distribution of the FWS categories for each tree cover class.
Feasibility ClassEucalyptusConifersBroadleavesTree Covers
Favorable42%48%30%38%
Intermediate25%24%21%23%
Unfavorable32%28%49%39%
Total100%100%100%100%
Disclaimer/Publisher’s Note: The statements, opinions and data contained in all publications are solely those of the individual author(s) and contributor(s) and not of MDPI and/or the editor(s). MDPI and/or the editor(s) disclaim responsibility for any injury to people or property resulting from any ideas, methods, instructions or products referred to in the content.

