Article

Effects of Habitat Filtering on Tree Growth and Mortality across Life Stages in an Old-Growth Temperate Forest

1
Center for Ecological Research, Northeast Forestry University, Harbin 150040, China
2
Key Laboratory of Sustainable Forest Ecosystem Management, Ministry of Education, Harbin 150040, China
3
Northeast Asia Biodiversity Research Center, Northeast Forestry University, Harbin 150040, China
*
Author to whom correspondence should be addressed.
Forests 2022, 13(6), 923; https://doi.org/10.3390/f13060923
Submission received: 23 April 2022 / Revised: 10 June 2022 / Accepted: 11 June 2022 / Published: 13 June 2022
(This article belongs to the Special Issue Long-Term Monitoring of Forest Biodiversity and Dynamics in China)

Abstract

:
A demographic (growth and mortality) trade-off plays a central role in the assembly and dynamics of ecological communities and contributes to tree species’ coexistence. On the basis of field investigation data from the 2010 and 2015 censuses, we evaluated the degrees to which the relative growth rate (RGR) and mortality rate (MR) of saplings and large trees were related to habitat filtering for temperate tree species from a 9 ha forest dynamics plot. The results showed that the relationship between RGR and MR was stronger in saplings than that in large trees. In saplings, the total P (TP) and organic C (OC) of the soil had a significantly positive correlation with RGR. In large trees, volumetric water content had a significantly negative correlation with RGR. In saplings, the bulk density and available P had a significantly positive correlation with MR. In large trees, MR showed a significantly negative correlation with aspect and a significantly positive correlation with TP and OC. Principal component analysis showed that species–habitat association status significantly affected the demographic parameters. A linear regression analysis revealed that the process of habitat filtering contributed to the ontogenetic variation that controlled RGR and MR as the community transitioned from saplings to large trees. Moreover, water availability for large trees played a key role in this process in an old-growth temperate forest.

1. Introduction

A demographic (growth and mortality) trade-off plays a central role in the assembly and dynamics of ecological communities [1,2]. Without a proper understanding of the determinants of tree growth and mortality, our understanding of forest dynamics is limited. The growth and mortality rates of trees are affected by many factors, which include topography [3], water availability [4], and soil nutrients [5]. However, interspecific variation in demographic performance and intrinsic growth capacities regulate tree growth and mortality [6]. In addition, environmental factors play a key role. Recent studies have sought to explicitly link the growth rates to the mortality rates of trees [2]. Birth and death are mediated by growth, which is usually negatively related to mortality and positively related to reproduction [7,8,9]. In other words, the transformation relationship between growth and mortality rates is dependent on the availability of resources. Trees grow rapidly when resource availability is high (favourable conditions), whereas trees die when resource availability is low (unfavourable conditions).
An increasing number of studies have illustrated that growth and mortality rates change with interspecific variation and tree size [10]. Studies on habitat associations at different life stages have shown that significant habitat associations may be present during one life stage of a species and may not be present during other life stages of the same species [11,12,13]. For example, there are stronger relationships between growth and environmental factors for larger subsets of individuals because of “habitat filtering” [11]. In a given habitat, only species that can adapt to the habitat are included, and the ecological environment determines which species in an area can enter and continue to survive in this environment. The differences within heterogeneous environments that contribute to tree growth and development include the ability to acquire resources, disperse, and tolerate stress. In fact, heterogeneous environments that can result in differential water and nutrient availability are common in nature [14], and the growth and mortality rates of trees are correlated with soil properties along topographic gradients [15,16]. Topography is one of the most vital environmental gradients that provides biodiversity to ecological communities [17], as it can control the light, temperature, and moisture distribution to influence tree growth and mortality [18]. Soil is considered to be the material basis for plant survival and growth; spatial heterogeneity of soil nutrients has an important influence on ecological communities [19]. Additionally, topography often drives the spatial variation of soil moisture at the local scale, with slope changes controlling species richness and composition [20,21]. Plants, soil, and topography at different scales are closely linked, and tree growth and mortality are considered to be easily measurable.
The mixed broadleaved Korean pine (Pinus koraiensis) forest is not only the zonal climax vegetation in the mountainous regions of northeast China but also a typical representative of a temperate coniferous and broadleaved mixed forest. In this study, we took advantage of the data to explore the relationship between the growth and mortality rates of ecological communities and environmental factors in a mixed broadleaved Korean pine forest dynamic plot in China to reveal the dominant environmental factors contributing to tree growth and mortality and to predict the developmental trend of ecological communities. Specifically, we asked the following research questions:
  • How does the relationship between the growth rate and the mortality rate of trees change at different life stages?
  • Which environmental factors affect the growth and mortality rates of temperate tree species in northeast China?
  • Is there evidence of habitat filtering from the sapling stage through the large tree stage? If there is, how do the trends of growth and mortality of the temperate trees change along environmental gradients?
Previous studies have documented the effects of habitat heterogeneity and spatial patterns on trees across multiple life stages [22,23]. We hypothesised that all environmental factors had the potential to influence tree growth and mortality in the temperate forest and that the relationship between environmental factors and large trees would have significant correlations to confirm habitat filtering.

2. Materials and methods

2.1. Study Site and Data Collection

This study was conducted in an old-growth temperate forest, which was a 9 ha forest dynamic plot (FDP) in the Liangshui National Reserve (47°10′50″ N, 128°57′20″ E) in northeastern China. The topography of the plot is highly complex. The altitude of the rolling mountainous terrain ranges from 280–707 m. The mean annual temperature and precipitation are −0.3 °C and 676 mm, respectively. The mean relative humidity and mean annual surface soil temperature are 78% and 1.2 °C, respectively. The dominant soil is dark brown soil according to the Chinese soil classification system. The forest is mainly composed of Pinus koraiensis, Abies nephrolepis, Tilia amurensis, Fraxinus mandshurica, Ulmus laciniata, Ulmus japonica, Betula costata, and Acer mono.
The 9 ha (300 × 300 m) dynamic plot of typical mixed broadleaved Korean pine forest was established in 2005. All woody stems with a diameter at breast height (DBH) ≥ 1 cm were measured, tagged, mapped, and identified as species belonging to 20 families, 34 genera, and 48 species. The plot was again investigated in the 2010 and 2015 censuses. In this paper, we used the data from the 2010 and 2015 censuses. We divided individuals into two life stages on the basis of the DBH, which were saplings (1 cm ≤ DBH < 10 cm) and large trees (DBH ≥ 10 cm) [24]. Relative growth rates (RGRs, cm cm−1 year−1) equalled [ln (DBHt)-ln (DBH0)]/T, where DBH0 and DBHt represent DBH in the 2010 census and the 2015 census, respectively. Mortality rates (MR, year−1) equalled [ln (Nt) − ln (N0)]/T, where Nt and N0 represent the number of trees in 2010 and the number of survivors in 2015, respectively [25]. T represents time, which was 5 years. Calculations of RGR and MR were performed for species that had at least 20 and 10 individuals at the two life stages in the 2010 census [1], resulting in sample sizes of 20 and 17 species for saplings and large trees, respectively (Table 1).

2.2. Topographic Indices

For this study, the trees were grouped into 5 × 5 m subquadrants. Topographic indices of habitat were measured, including the elevation (m), slope (o), aspect (o), and convexity (m) in the FDP. Elevation was measured as the mean of the elevation values at its four corners. Slope was defined as the mean angular deviation from the horizontal of each of the four triangular planes formed by connecting three of its corners. Aspect was defined as the direction in which a slope faces. Convexity was defined as the elevation of the focal subquadrant minus the mean elevation of the eight subquadrants around each focal subquadrant, and the elevation of the centre point minus the mean of its four corners for the edge subquadrants [26].

2.3. Soil-Based Indices

We collected three soil samples with a soil corer from a depth of 0–10 cm on the basis of the 20 m grid of points. Every alternate grid point, which was paired with two additional sample points, was selected at 2, 5, or 8 m in a random compass direction (N, NE, E, SE, S, SW, W, or NW) [27]. Eight soil-based indices (bulk density, g cm−3; total N, mg g−1; available N, mg g−1; total P, mg g−1; available P, mg g−1; organic C, g kg−1; soil pH; and volumetric water content, cm3 cm−3) were measured to describe the soil environment in the FDP. Soil values for each subquadrant were calculated using kriging methods. Topographical and soil-based indices corresponded to each live and dead tree within each 5 × 5 m subquadrant, with means calculated for the saplings and large trees of each species.

2.4. Data Analysis

Before data analysis, all variables were logarithmically transformed and checked for normality when required. Linear regression was used to assess the relationships between RGR and MR (Table 1). We assessed the relationships between environmental factors, RGR, and MR at different life stages using Pearson’s correlation. Principal component analyses (PCAs) were run to ordinate twelve variables of topographic and soil-based indices to represent environmental factors. The first three axes from each of these PCAs were used to analyse the RGR and MR of tree species from their corresponding environmental factors. We used the linear regression to analyse the RGR and MR of tree species and the first three axes of scores of these PCAs to prove that there was habitat filtering from sapling to large tree stages. Habitat filtering was evidenced if the RGR or MR of small trees was not related to topographic and soil factors but that of the large trees was. Subsequently, we used the relationships between the results of the linear regression and coefficients of PCA to predict the trend of the temperate tree growth and mortality rates along environmental gradients. The PCAs were performed in Origin Pro 2015; all other analyses were performed with SPSS 19.0.

3. Results

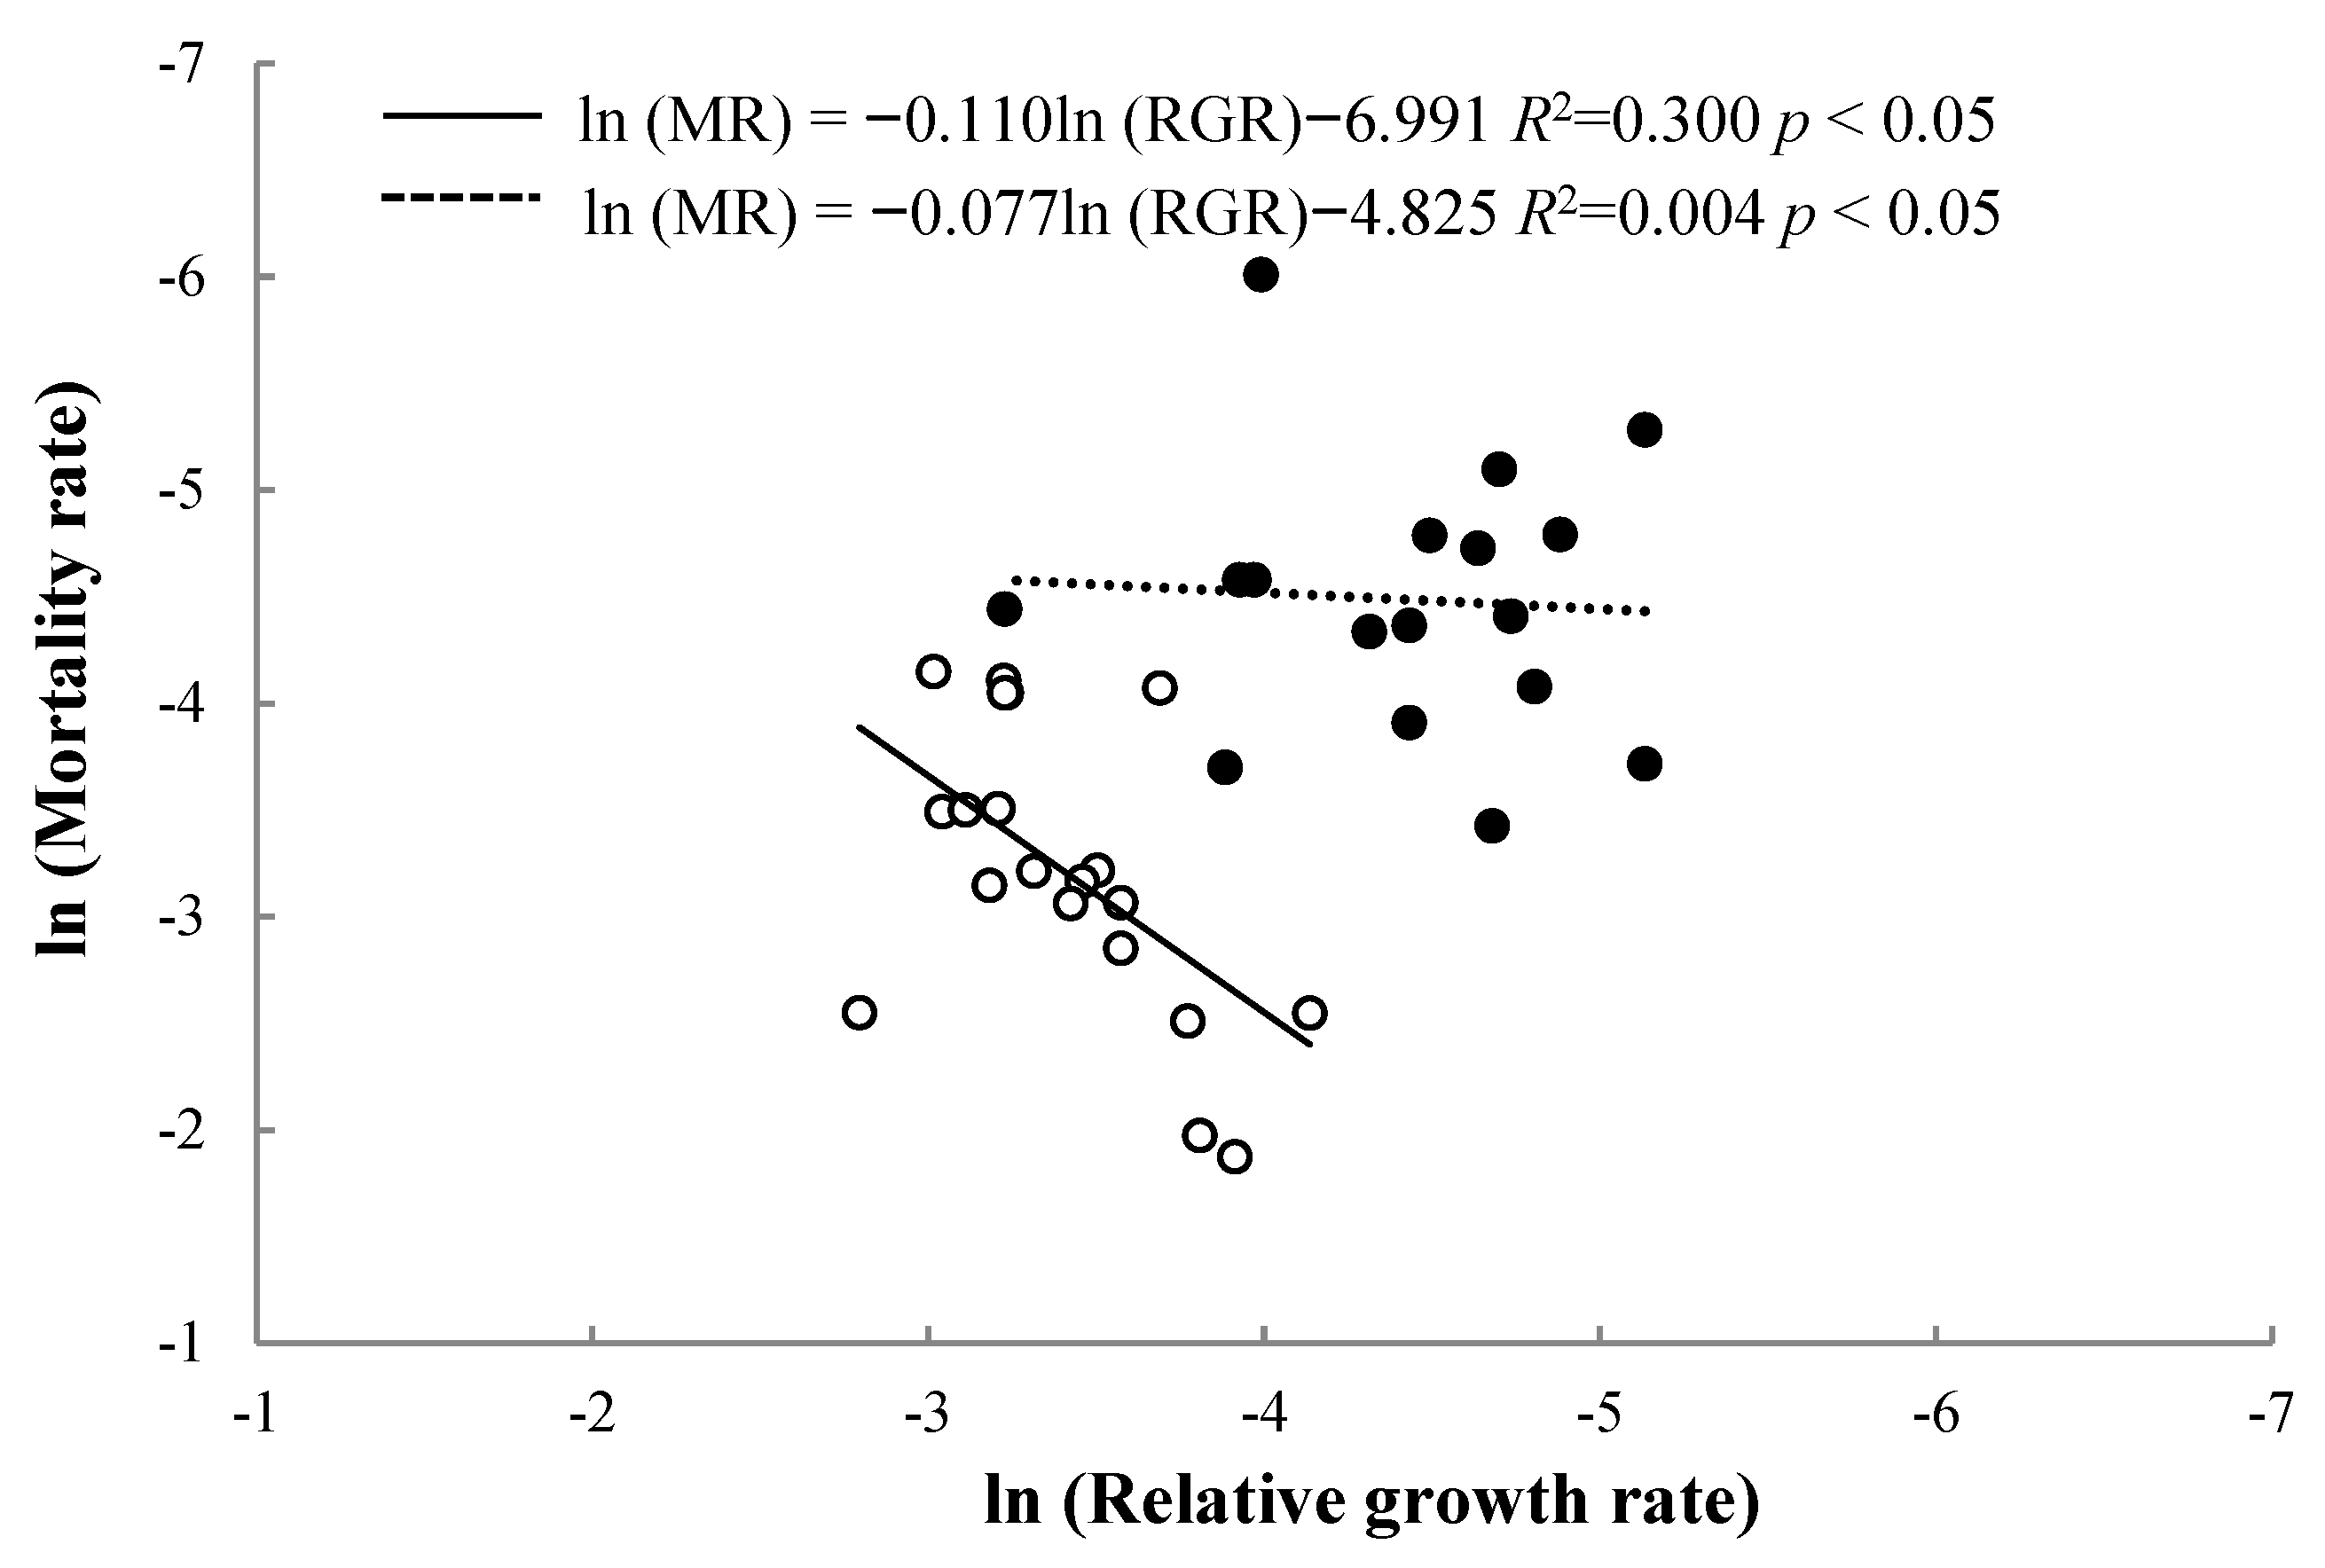
3.1. Relationships between RGR and MR at Different Life Stages

MR had a significant negative relationship with RGR for both saplings and large trees. The slope of the relationship between RGR and MR for saplings differed from that of large trees. For saplings, the absolute value of the slope (0.110) was larger than that in large trees (0.077) (Figure 1).

3.2. Relationships between Environmental Factors and RGR

The environmental factor–RGR relationships of saplings differed from those of large trees. In saplings, TP and OC had a significantly positive correlation with RGR. In large trees, VWC had a significantly negative correlation with RGR (Table 2).

3.3. Relationships between Environmental Factors and MR

The environmental factor–MR relationships of saplings also differed from those of large trees. In saplings, BD and AP had a significantly positive correlation with MR. In large trees, MR showed a significantly negative correlation with Asp and a significantly positive correlation with TP and OC (Table 2).

3.4. Results of Topographical and Soil-Based Factors

All the principal components were selected for the first three axes (PC1, PC2, and PC3) because the eigenvalues were greater than one (Table 3). For PCA, axis 1 (PC1) of Sap-RGR was related to increasing OC and AP; axis 2 (PC2) was related to increasing TN and AN; and axis 3 (PC3) was related to increasing Ele and TP. This analysis showed that the highest values were related to increasing OC. In Sap-RGR, Asp (Sin (Asp) and Cos (Asp)) were strongly negatively correlated with Con and Slo. PC1 of Sap-MR was related to declining BD and AP; PC2 was related to increasing TN and AN; and PC3 was related to declining OC and increasing Ele. This analysis showed that the highest values were related to increasing TN. In Sap-MR, OC and VWC showed a strong positive correlation, whereas OC was strongly negatively correlated with Slo. PC1 of Lar-RGR was related to increasing OC and AN; PC2 was related to increasing TP and VWC; and PC3 was related to increasing AP and declining VWC. This analysis showed that the highest values were related to increasing TN. In Lar-RGR, OC and Slo showed a strong positive correlation. PC1 of Lar-MR was related to declining Slo and increasing AP; PC2 was related to increasing TN and AN; and PC3 was related to increasing VWC and declining Slo. This analysis showed that the highest values were related to increasing TN. In Lar-MR, OC was strongly negatively correlated with Slo (Table 3 and Table 4, Figure 2).

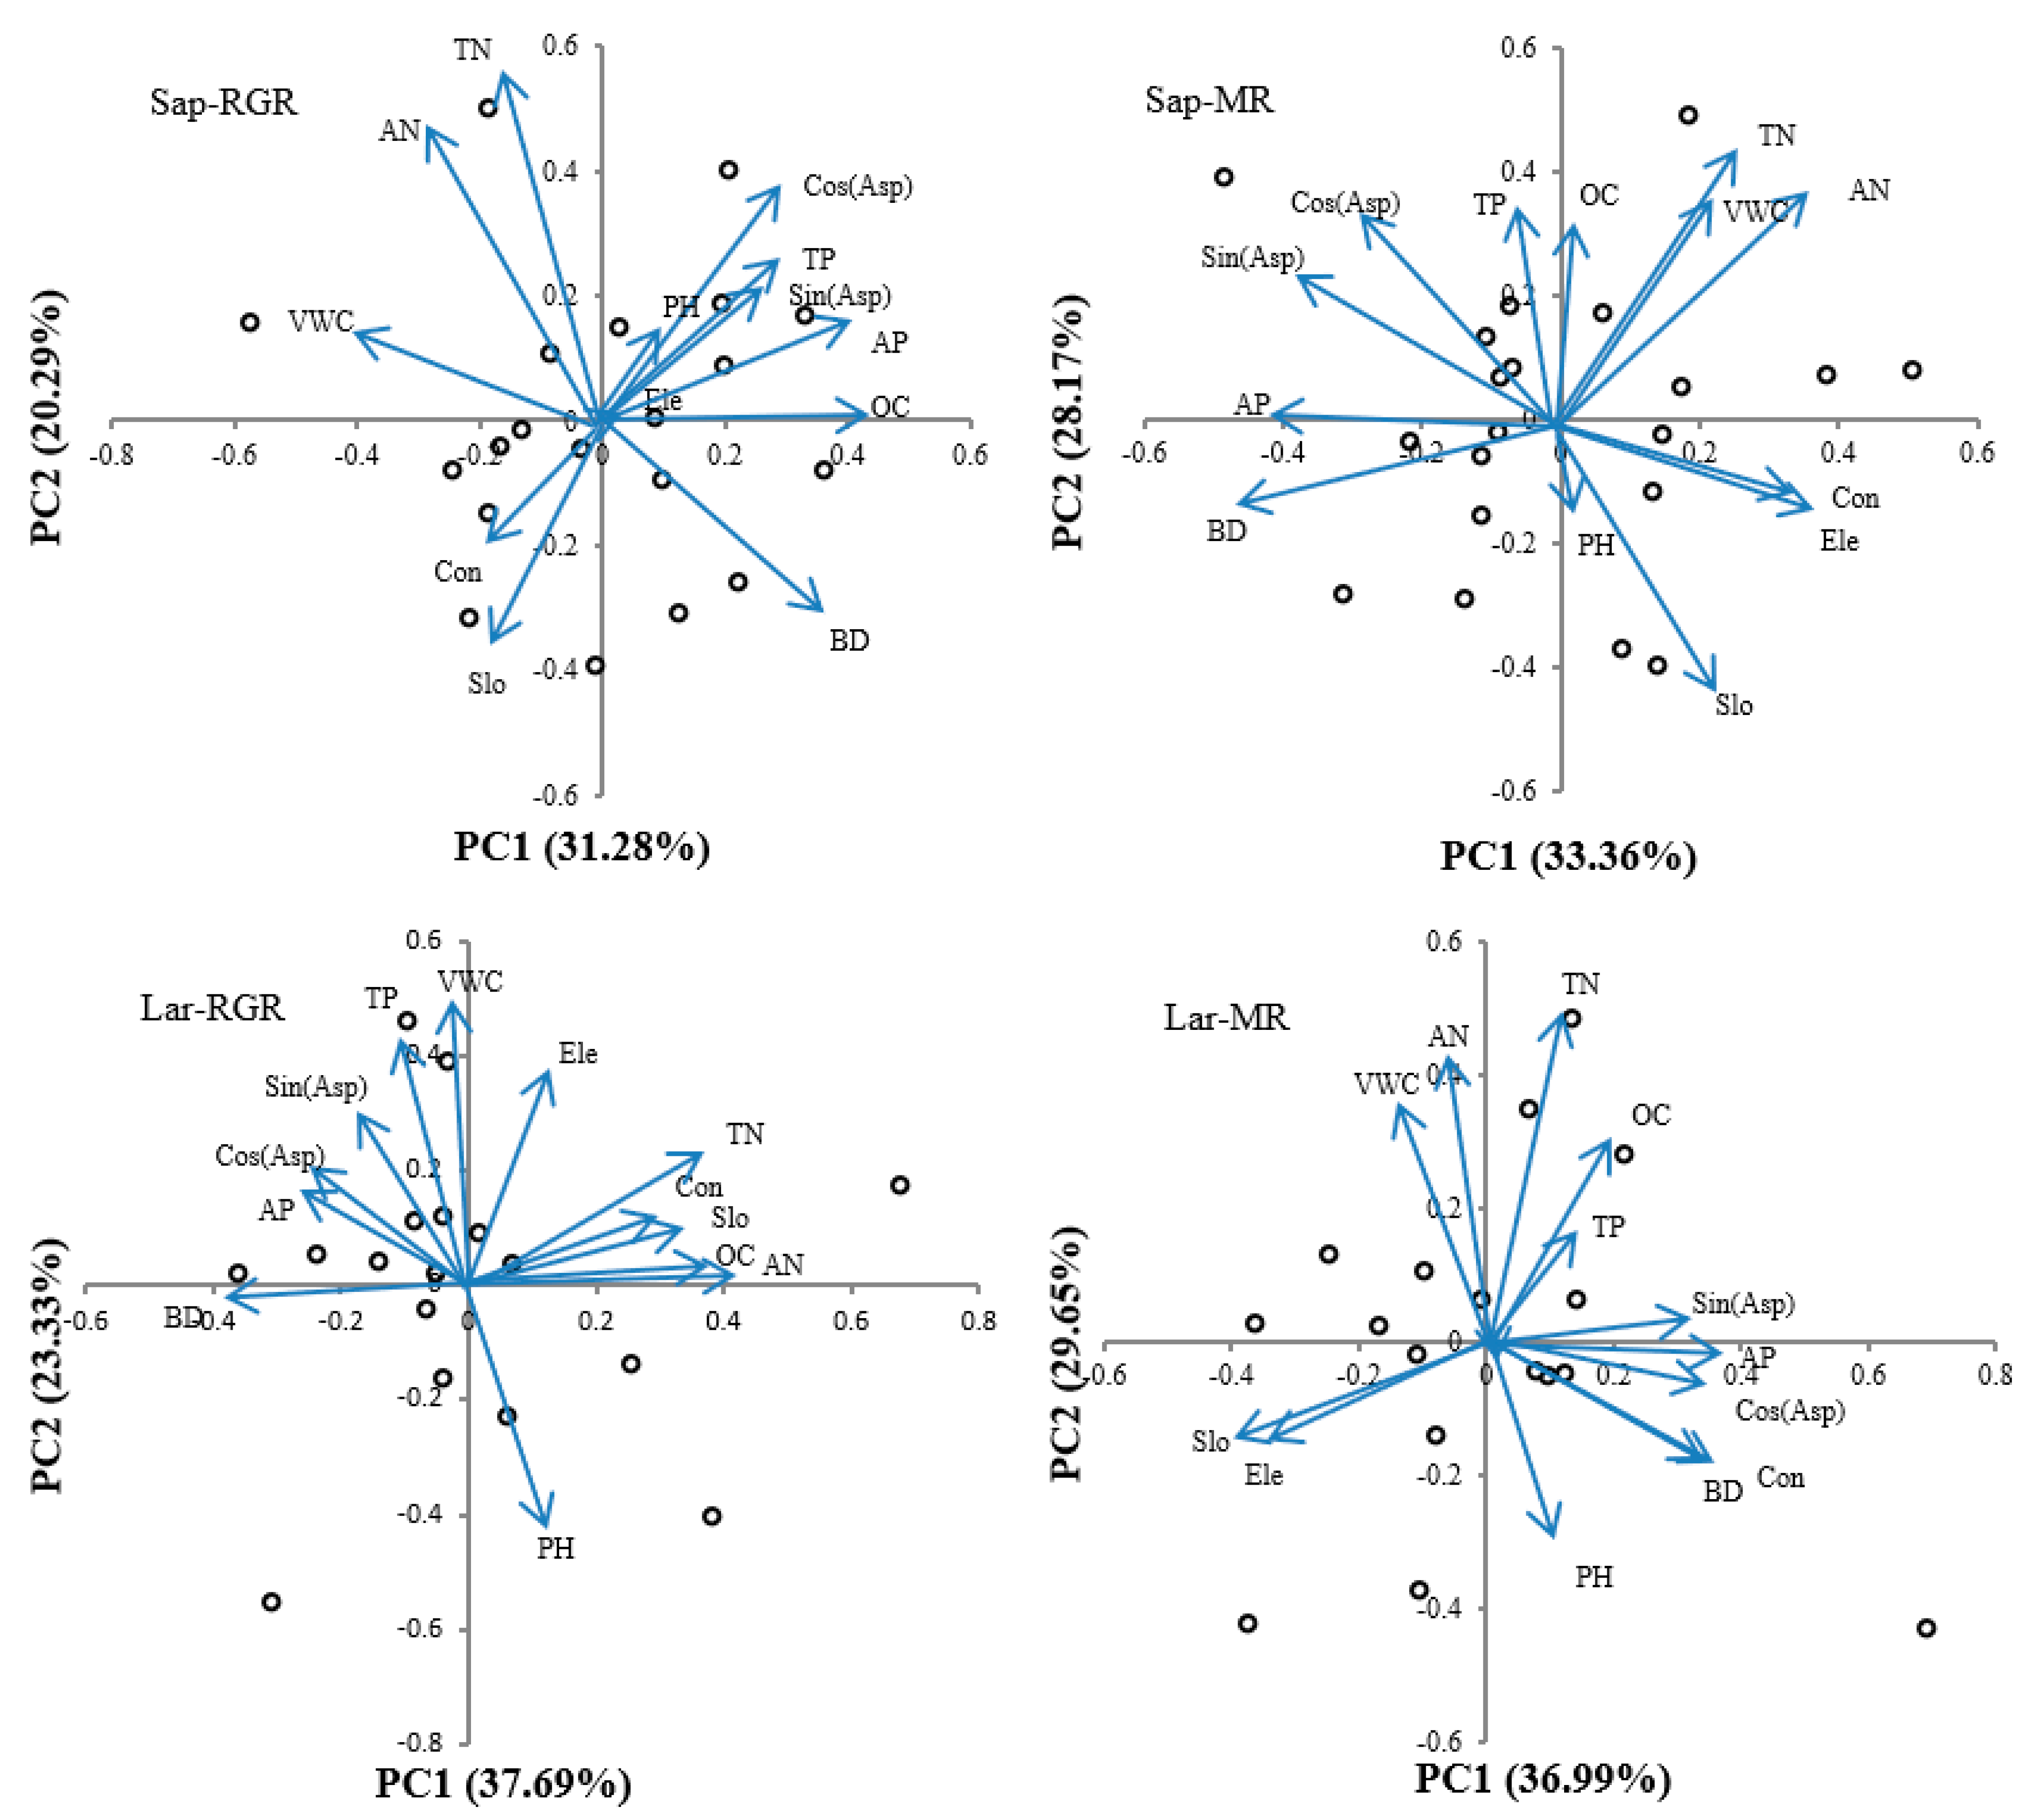
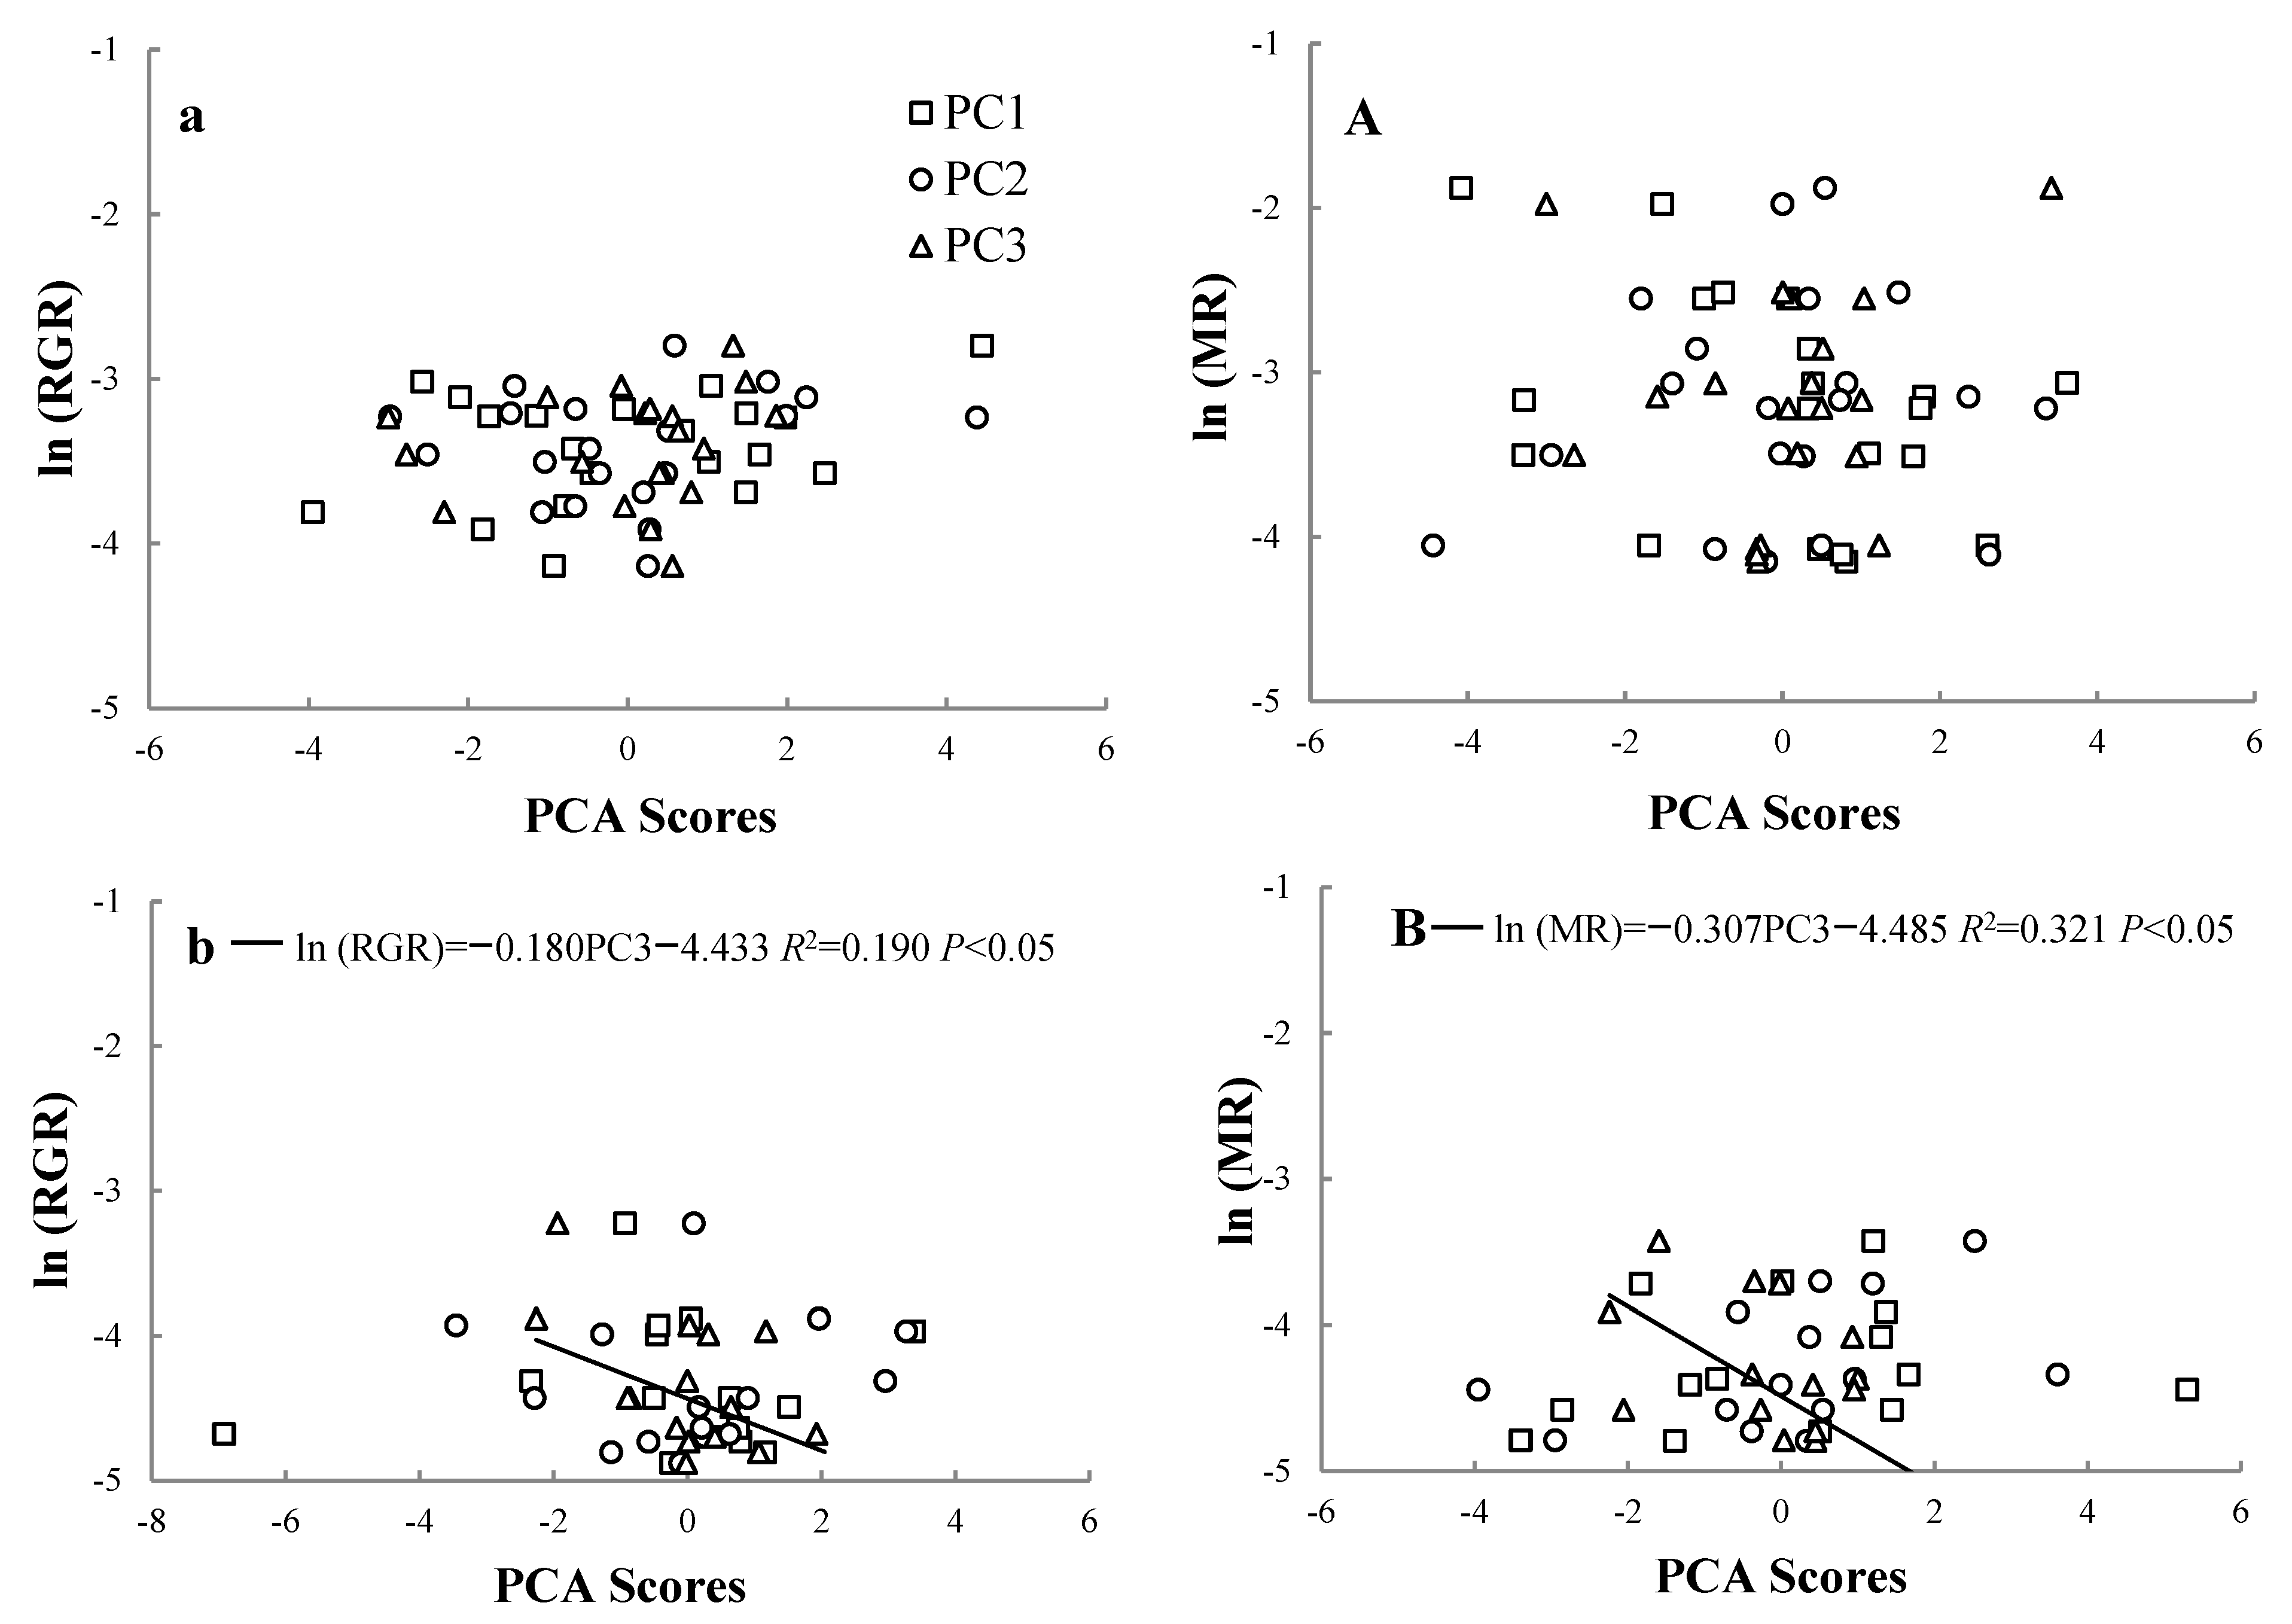
3.5. Effect of Environmental Factors on RGR and MR on Trees at Different Life Stages

The scores of principal component analysis axis 3 (PC3) were negatively correlated with the RGR and MR at the large tree life stage (p < 0.05). The scores of the first two axes of the principal component analysis (PC1 and PC2) were not correlated with the RGR or the MR of large trees. The scores of all principal component axes were not correlated with the RGR or the MR of saplings (Figure 3). RGR was related to declining AP and increasing VWC at the large tree life stage. MR was related to increasing Slo and declining VWC at the large tree life stage (Table 4 and Figure 3).

4. Discussion

The relationship of tree size between growth rates and mortality rates is perhaps the best-established life-history variation among forest tree species [28,29,30]. We showed that the strength of the relationships between RGR and MR depends strongly on the life stages of the trees evaluated. The relationships between RGR and MR are stronger for saplings than for large trees. Saplings have faster growth and mortality among individuals compared with large trees. This result is similar to the effect of density dependence for sapling-to-large tree transitions [22]. Although trees in both life stages were affected by this effect, the effect was more pronounced in the early stages, which showed higher growth rates and mortality in the old-growth temperate forest.
Light limits photosynthetic carbon gain, which is essential for plant growth and mortality [31]. The degree of spatial distribution in light availability decreases from the top to the bottom of the canopy [32]. Large trees gain more light in the subcanopy and canopy than the saplings in the understory. Furthermore, the competitive power of large trees is generally stronger than that of saplings, which, as a species, have lower establishment or survival in the neighbourhood of adults [11,12]. In other words, the growth status of the large trees is more stable than that of saplings in the forest. Thus, the growth–mortality trade-off is weaker for large trees than for saplings, which have faster individual growth and higher mortality rates.
We evaluated the importance of environmental factors on tree growth and mortality and tried to identify which environmental factors are related to the growth and mortality rates of temperate tree species at different life stages. Using single-variable correlation analysis, our results showed that the sapling RGR was enhanced with TP and OC; the sapling MR was enhanced with BD and AP; the large tree RGR was weakened with VWC; and the large tree MR was weakened with Asp and enhanced with TP and OC. These results are consistent with reports that trees can show different responses to elemental availability at different stages [33]. The phosphorus in plants is a synergistic element [34]. Phosphorus plays a special role in energy metabolism, is a component of many coenzymes, and is directly involved in oxidative phosphorylation and photosynthetic phosphorylation. The phosphorus in plants is mainly absorbed from soil nutrients. Thus, enhanced supplies of TP have the potential to promote growth in saplings because of increased light availability. Interestingly, the MR of large trees showed similar responses to the RGR of saplings regarding elemental availability, possibly because the production of fine roots was higher in poor soils than in fertile soils [35]. The lifespan of large trees can be shortened in high-TP soils [36]. Sin (Asp) and cos (Asp) were used to represent north–south and east–west, respectively [37]. The results showed that the sunnier the slope was, the higher the RGR of the saplings was. Con and Slo were negatively correlated with the RGR of saplings (Figure 2, Sap-RGR). The results of this study were similar to those of a study by Shen et al. in a subtropical forest [38]. The negative correlation between the convexity and slope and the RGR of saplings is likely associated with greater moisture and nutrient accumulation in local lows. High convexity and slope may indicate a hilltop, and the low RGR of saplings is probably associated with the greater run-off of water at high convexity and slope [39]. By contrast, the high RGR of large trees was associated with high convexity and slope. This may be caused by the strong competitiveness and wind resistance of the large trees. The negative correlation between OC and Slo of Sap-MR was stronger than that of Lar-MR because of the larger angle between OC and Slo; this indicates that the variation in the MR in saplings in habitats with high soil organic carbon was significantly higher than that in large trees. In Sap-MR, OC and Slo showed a strong negative correlation, whereas in Lar-RGR, OC and Slo showed a strong positive correlation. This was consistent with Dina’s findings that the species–habitat association status significantly affected demographic parameters [40].
Environmental factors in the old-growth temperate forest were mainly related to variations in the OC and TN. The increase and variation of nitrogen and carbon in the soil may be a consequence of the accumulation of litter and humus, which may further promote the absorption of net soil nitrogen and carbon. The change in chlorophyll content is related to the adaptability of plants to light, but on the other hand, it is also affected by soil mineral elements, especially nitrogen [41]. PCA showed the highest values related to increasing TN in the RGR of large trees (Table 2 and Table 4). The nitrogen content of plant leaves was closely related to the soil nitrogen content under growing conditions. The transformation and cycling of nitrogen in a forest ecosystem is the most important and active process [42]. Nitrogen deficiency can lead to lower photosynthetic rates and slower plant growth. Therefore, increasing nitrogen content contributes to tree growth and development.
In temperate forests, habitat filtering plays a dominant role in community construction [43]. One vital result of this work was that, as shown by using linear regression, environmental factors were related to the RGR and MR of large trees but not saplings, although the variance contribution of the PC3 axis was the smallest among the first three principal components. The findings illustrate that habitat filtering occurs from the sapling stage to the large tree stage, and saplings are somewhat buffered from the local site conditions in terms of growth and mortality. This result is similar to the findings that large trees in a subtropical forest showed greater associations between growth and mortality and environmental conditions because habitat filtering is an important process shaping ecological communities [44]. This process refers to the non-random germination and survival of individuals with respect to variation in environmental conditions and results in communities of large trees that are more specialised than saplings in habitat characteristics. Our results showed that VWC had a significant effect on both the RGR and MR of large trees. VWC reflects the volume fraction of water in the total soil volume per unit, meaning that moisture restriction is critical to the growth and mortality of large trees. In large trees, the high RGR at a high VWC is probably driven by maintaining high rates of transpiration for long periods during the day [45], whereas the high MR at a low VWC is likely associated with a greater run-off of water [39]. Moreover, the high MR at a high Slo also proves this idea. Thus, differences in how the trees are located in these conditions contribute to ontogenetic variation in the environmental factors that control the RGR and MR in the old-growth temperate forest.

5. Conclusions

We reported the following results in the Liangshui FDP. (1) There was a stronger trade-off between RGR and MR for saplings than for large trees. (2) In saplings, TP and OC were significantly positively correlated with RGR, and BD and AP were significantly positively correlated with MR. In large trees, VWC had a significantly negative relationship with RGR, Asp had a significantly negative relationship with MR, and TP and OC had significantly positive relationships with MR. The species–habitat association status significantly affected demographic parameters. (3) Habitat filtering occurred from sapling to large tree stages, which was an important process to shape ecological communities. TN played a major role in the environment of the typical mixed broadleaved Korean pine forest, and the nitrogen cycle was an important process in the ecosystem. Moreover, VWC controlled the RGR and MR of large trees in this process in the old-growth temperate forest. These findings also set the stage for future studies that will address how the sapling community is filtered into a large-tree community that reflects local habitat requirements, and promote species coexistence in temperate forests.

Author Contributions

Conceptualization, D.H. and G.J.; Funding acquisition, G.J.; Writing—reviewing & editing, D.H. and G.J.; Field investigation, Experimental and data analysis, D.H. All authors have read and agreed to the published version of the manuscript.

Funding

This study was financially supported by the Fundamental Research Funds for the Central Universities (2572022DS13).

Data Availability Statement

Not applicable.

Conflicts of Interest

No potential conflict of interest was reported by the authors.

References

  1. Poorter, L.; Wright, S.J.; Paz, H.; Ackerly, D.D.; Condit, R.; Ibarra-Manriquez, G.; Harms, K.E.; Licona, J.C.; Martinez-Ramos, M.; Mazer, S.J.; et al. Are functional traits good predictors of demographic rates? Evidence from five Neotropical forests. Ecology 2008, 89, 1908–1920. [Google Scholar] [CrossRef] [PubMed]
  2. Wright, S.J.; Kitajima, K.; Kraft, N.J.B. Functional traits and the growth-mortality trade-off in tropical trees. Ecology 2010, 91, 3664–3674. [Google Scholar] [CrossRef] [PubMed]
  3. Han, A.R.; Lee, S.K.; Suh, G.U.; Park, Y.; Park, P.S. Wind and topography influence the crown growth of Picea jezoensis in a subalpine forest on Mt. Deogyu, Korea. Agric. For. Meteorol. 2012, 166, 207–214. [Google Scholar] [CrossRef]
  4. Condit, R.; Hubbell, S.P.; Foster, R.B. Mortality rates of 205 neotropical tree and shrub species and the impact of a severe drought. Ecol. Monogr. 1995, 65, 419–439. [Google Scholar] [CrossRef]
  5. Martinez-Garza, C.; Campo, J.; Ricker, M.; Tobon, W. Effect of initial soil properties on six-year growth of 15 tree species in tropical restoration plantings. Ecol. Evol. 2016, 6, 8686–8694. [Google Scholar] [CrossRef] [PubMed]
  6. Sterck, F.; Markesteijn, L.; Schieving, F.; Poorter, L. Functional traits determine trade-offs and niches in a tropical forest community. Proc. Natl. Acad. Sci. USA 2011, 108, 20627–20632. [Google Scholar] [CrossRef] [Green Version]
  7. Nakashizuka, T. Species coexistence in temperate, mixed deciduous forests. Trends Ecol. Evol. 2001, 16, 205–210. [Google Scholar] [CrossRef]
  8. Wychoff, P.H.; Clark, J.S. The relationship between growth and mortality for seven cooccurring tree species in the southern Appalachian Mountains. J. Ecol. 2002, 90, 604–615. [Google Scholar] [CrossRef] [Green Version]
  9. Perez-Ramos, I.M.; Ourcival, J.M.; Limousin, J.M. Mast seeding under increasing drought: Results from a long-term data set and from a rainfall exclusion experiment. Ecology 2010, 91, 3057–3068. [Google Scholar] [CrossRef] [Green Version]
  10. Iida, Y.; Kohyama, T.S.; Swenson, N.G.; Su, S.H.; Chen, C.T.; Chiang, J.M.; Sun, I.F. Linking functional traits and demographic rates in a subtropical tree community: The importance of size dependency. J. Ecol. 2014, 102, 641–650. [Google Scholar] [CrossRef]
  11. Webb, C.O.; Peart, D.R. Habitat associations of trees and seedlings in a Bornean rain forest. J. Ecol. 2000, 88, 464–478. [Google Scholar] [CrossRef]
  12. Comita, L.; Condit, S.R.; Hubbell, S.P. Developmental changes in habitat associations of tropical trees. J. Ecol. 2007, 95, 482–492. [Google Scholar] [CrossRef]
  13. Ji, M.; Jin, G.; Liu, Z. Effects of ontogenetic stage and leaf age on leaf functional traits and the relationships between traits in Pinus koraiensis. J. For. Res. 2021, 32, 13–25. [Google Scholar] [CrossRef]
  14. Bellingham, P.J.; Tanner, E.V.J. The influence of topography on tree growth, mortality, and recruitment in a tropical montane forest. Biotropica 2000, 32, 378–384. [Google Scholar] [CrossRef]
  15. Ehrenfeld, J.G.; Ravit, B.; Elgersma, K. Feedback in the plant-soil system. Annu. Rev. Environ. Resour. 2005, 30, 75–115. [Google Scholar] [CrossRef] [Green Version]
  16. Toledo, J.J.; Magnusson, W.E.; Castilho, C.V.; Nascimento, H.E.M. Tree mode of death in Central Amazonia: Effects of soil and topography on tree mortality associated with storm disturbances. For. Ecol. Manag. 2012, 263, 253–261. [Google Scholar] [CrossRef] [Green Version]
  17. Zhang, M.; Xiong, G.M.; Chen, Z.G.; Fan, D.Y.; Xie, Z.Q. The topography heterogeneity of Fagus engleriana-Cyclobalanopsis oxyodon community in Shennongjia region. Acta Ecol. Sin. 2004, 24, 2686–2692. [Google Scholar]
  18. Bader, M.Y.; Ruijten, J.J.A. A topography-based model of forest cover at the alpine tree line in the tropical Andes. J. Biogeogr. 2008, 35, 711–723. [Google Scholar] [CrossRef]
  19. Zare, S.; Jafari, M.; Tavili, A.; Abbasi, H.; Rostampour, M. Relationship between environmental factors and plant distribution in arid and semiarid area (case study: Shahriyar Rangelands, Iran) American-Eurasian. J. Agric. Environ. Sci. 2001, 10, 97–105. [Google Scholar]
  20. Harms, K.E.; Condit, R.; Hubbell, S.P.; Foster, R.B. Habitat associations of trees and shrubs in a 50-ha neotropical forest plot. J. Ecol. 2001, 89, 947–959. [Google Scholar] [CrossRef]
  21. Costa, F.R.C.; Magnusson, W.E.; Luizao, R.C. Mesoscale distribution patterns of Amazonian understorey herbs in relation to topography, soil and watersheds. J. Ecol. 2005, 93, 863–878. [Google Scholar] [CrossRef]
  22. Piao, T.F.; Comita, L.S.; Jin, G.Z.; Kim, J.H. Density dependence across multiple life stages in a temperate old-growth forest of northeast China. Oecologia 2013, 172, 207–217. [Google Scholar] [CrossRef] [PubMed] [Green Version]
  23. Liu, Y.Y.; Li, F.R.; Jin, G.Z. Spatial patterns and associations of four species in an old-growth temperate forest. J. Plant Interact. 2014, 9, 745–753. [Google Scholar] [CrossRef]
  24. Martin, A.R.; Thomas, S.C.; Zhao, Y. Size-dependent changes in wood chemical traits: A comparison of neotropical saplings and large trees. AoB Plants 2013, 5, plt039. [Google Scholar] [CrossRef]
  25. Condit, R.; Ashton, P.S.; Manokaran, N.; Lafrankie, J.V.; Hubbell, S.P.; Foster, R.B. Dynamics of the forest communities at Pasoh and Barro Colorado: Comparing two 50-ha plots. Philos. Trans. R. Soc. B Biol. Sci. 1999, 354, 1739–1748. [Google Scholar] [CrossRef] [PubMed] [Green Version]
  26. Legendre, P.; Mi, X.C.; Ren, H.B.; Ma, K.P.; Yu, M.J.; Sun, I.F.; He, F.L. Partitioning beta diversity in a subtropical broad-leaved forest of China. Ecology 2009, 90, 663–674. [Google Scholar] [CrossRef] [Green Version]
  27. Lin, G.J.; Stralberg, D.; Gong, G.Q.; Huang, Z.L.; Ye, W.H.; Wu, L.F. Separating the effects of environment and space on tree species distribution: From population to community. PLoS ONE 2013, 8, e56171. [Google Scholar] [CrossRef] [Green Version]
  28. Pacala, S.W.; Canham, C.D.; Saponara, J.; Silander, J.A.; Kobe, R.K.; Ribbens, E. Forest models defined by field measurements: Estimation, error analysis and dynamics. Ecol. Monogr. 1996, 66, 1–43. [Google Scholar] [CrossRef]
  29. Wright, S.J.; Mullerlandau, H.C.; Condit, R.; Hubbell, S.P. Gap dependent recruitment, realized vital rates, and size distributions of tropical trees. Ecology 2003, 84, 3174–3185. [Google Scholar] [CrossRef]
  30. Kitajima, K.; Poorter, L. Functional basis for resource niche partitioning by tropical trees. Trop. For. Community Ecol. 2008, 10, 160–181. [Google Scholar]
  31. Kim, C.; Apel, K. Arabidopsis light-dependent NADPH: Protochlorophyllide oxidoreductase A (PORA) is essential for normal plant growth and development: An addendum. Plant Mol. Biol. 2012, 78, 237–240. [Google Scholar] [CrossRef] [PubMed]
  32. Zhi, X.Y.; Han, Y.C.; Mao, S.C.; Wang, G.P.; Feng, L.; Yang, B.F.; Fan, Z.Y.; Du, W.; Lu, J.H.; Li, Y.B. Light spatial distribution in the canopy and crop development in cotton. PLoS ONE 2014, 9, e113409. [Google Scholar] [CrossRef] [PubMed]
  33. Reis, M.A.; Alves, L.C.; Freitas, M.C.; Os, B.V.; Wolterbeek, H.T. Lichens (Parmelia sulcata) time response model to environmental elemental availability. Sci. Total Environ. 1999, 232, 105–115. [Google Scholar] [CrossRef]
  34. Wright, I.J.; Reich, P.B.; Cornelissen, J.H.; Falster, D.S.; Garnier, E.; Hikosaka, K.; Lamont, B.B.; Lee, W.; Oleksyn, J.; Osada, N.; et al. Assessing the generality of global leaf trait relationships. New Phytol. 2005, 166, 485–496. [Google Scholar] [CrossRef]
  35. Espeleta, J.F.; Clark, D.A. Multi-scale variation in fine-root biomass in a tropical rain forest: A seven-year study. Ecol. Monogr. 2007, 77, 377–404. [Google Scholar] [CrossRef] [Green Version]
  36. Makhalanyane, T.P.; Valverde, A.; Velázquez, D.; Gunnigle, E.; Gorthem, M.W.V.; Quesada, A.; Cowan, D.A. Ecology and biogeochemistry of cyanobacteria in soils, permafrost, aquatic and cryptic polar habitats. Biodivers. Conserv. 2015, 24, 819–840. [Google Scholar] [CrossRef]
  37. Jones, M.M.; Tuomisto, H.; Borcard, D.; Legendre, P.; Clark, D.B.; Olivas, P.C. Explaining variation in tropical plant community composition: Influence of environmental and spatial data quality. Oecologia 2008, 155, 593–604. [Google Scholar] [CrossRef]
  38. Shen, Y.; Santiago, L.S.; Shen, H.; Ma, L.; Lian, J.; Cao, H.; Lu, H.; Ye, W. Determinants of change in subtropical tree diameter growth with ontogenetic stage. Oecologia 2014, 175, 1315–1324. [Google Scholar] [CrossRef] [Green Version]
  39. Garciaoliva, F.; Maass, J.M.; Galicia, L. Rainstorm analysis and rainfall erosivity of a seasonal tropical region with a strong cyclonic influence on the Pacific Coast of mexico. J. Appl. Meteorol. 1995, 34, 2491–2498. [Google Scholar] [CrossRef] [Green Version]
  40. Dina, O.; Jin, G. Species-habitat association affects demographic variation across different life stages in an old-growth temperate forest. Perspect. Pant Ecol. Evol. Syst. 2019, 40, 125482. [Google Scholar]
  41. Verhoeven, A.S.; Demmigadams, B.; Iii, W.W.A. Enhanced employment of the xanthophyll cycle and thermal energy dissipation in spinach exposed to high light and N stress. Plant Physiol. 1997, 113, 817–824. [Google Scholar] [CrossRef] [Green Version]
  42. Gundersen, P.; Emmett, B.A.; Kjønaas, O.J.; Koopmans, C.J.; Tietema, A. Impact of nitrogen deposition on nitrogen cycling in forests: A synthesis of NITREX data. For. Ecol. Manag. 1998, 101, 37–55. [Google Scholar] [CrossRef]
  43. Myers, J.A.; Chase, J.M.; Jimenez, I.; Jorgensen, P.M.; Araujo-Murakami, A.; Paniagua-Zambrana, N.; Seidel, R. Beta-diversity in temperate and tropical forests reflects dissimilar mechanisms of community assembly. Ecol. Lett. 2013, 16, 151–157. [Google Scholar] [CrossRef] [PubMed]
  44. Keddy, P.A. Assembly and response rules: Two goals for predictive community ecology. J. Veg. Sci. 1992, 3, 157–164. [Google Scholar] [CrossRef] [Green Version]
  45. Goldstein, G.; Andrade, J.L.; Meinzer, F.C.; Holbrook, N.M.; Cavelier, J.; Jackson, P.; Celis, A. Stem water storage and diurnal patterns of water use in tropical forest canopy trees. Plant Cell Environ. 1998, 21, 397–406. [Google Scholar] [CrossRef]
Figure 1. Linear regression relating RGR and MR for saplings (1 cm ≤ DBH < 10 cm) and large trees (DBH ≥ 10 cm) in the 9 ha dynamic plot of typical mixed broadleaved Korean pine forest. Hollow circles indicate saplings, whereas solid circles indicate large trees.
Forests 13 00923 g001
Figure 2. PCAs for topographical and soil characteristics of RGR and MR in saplings and large trees.
Forests 13 00923 g002
Figure 3. Linear regression of RGR and MR shown as PCA scores at different life stages. The straight line indicates that the PCA scores are significantly correlated with RGR and MR. The letter (a,A) represents saplings (1 cm ≤ DBH < 10 cm). The letter (b,B) represents large trees (DBH ≥ 10 cm).
Forests 13 00923 g003
Table 1. RGR (cm cm−1 year−1) and MR (year−1) for saplings (1 cm ≤ DBH < 10 cm) and large trees (DBH ≥ 10 cm) in the 9 ha dynamic plot of typical mixed broadleaved Korean pine forest.
Tree SpeciesSaplingsTree SpeciesLarge Trees
RGRMRRGRMR
Abies nephrdepis0.0490.015Abies nephrdepis0.0080.012
Acer pictum subsp. mono0.0250.017Acer pictum subsp. mono0.0070.008
Acer tegmentosum0.0470.030Acer tegmentosum0.0200.024
Acer ukurunduense0.0400.029Acer ukurunduense0.0130.013
Aralia elata0.0610.078Betula costata0.0110.012
Betula costata0.0160.078Fraxinus mandschurica0.0180.002
Fraxinus mandschurica0.0230.081Phellodendron amurensis0.0190.010
Maackia amurensis0.0440.030Picea jezoensis0.0050.024
Phellodendron amurensis0.0220.138Picea koraiensis0.0080.016
Picea jezoensis0.0390.017Pinus koraiensis0.0050.005
Picea koraiensis0.0390.016Populus davidiara0.0110.020
Pinus koraiensis0.0410.042Populus ussuriensis0.0390.011
Populus ussuriensis0.0200.153Prunus padus0.0090.032
Prunus padus0.0300.040Sorbus pohuashanens0.0180.010
Quercus mongolica0.0390.017Tilia amurensis0.0090.006
Sorbus pohuashanens0.0320.046Tilia mandshurica0.0110.008
Tilia amurensis0.0280.046Ulmus laciniata0.0090.008
Tilia mandshurica0.0360.040
Ulmus japonica0.0310.042
Ulmus laciniata0.0280.057
Table 2. Pearson correlation coefficients for relationships between RGR and MR and topographical and soil-based factors for saplings and large trees in a 9 ha mixed broadleaved Korean pine forest dynamic plot in China.
ModelSaplingsLarge Trees
ln (RGR)ln (MR)ln (RGR)ln (MR)
Ele0.518−0.277−0.320−0.264
Slo0.274−0.187−0.2500.121
Sin (Asp)−0.2960.1460.613−0.414
Cos (Asp)−0.2760.0760.481−0.485 *
Con0.088−0.2420.0780.039
BD0.1250.469 *−0.012−0.031
TN0.053−0.312−0.1950.269
AN0.008−0.330.0940.107
TP0.347 *−0.0380.1830.409 *
AP0.1260.436 *−0.2080.138
OC0.325 *0.078−0.3240.517 *
pH0.0240.209−0.274−0.169
VWC−0.2780.049−0.548 *−0.155
Topographical and soil-based factors included are elevation (Ele), slope (Slo), aspect (Asp), convexity (Con), bulk density (BD), total N (TN), available N (AN), total P (TP), available P (AP), organic C (OC), soil pH (pH), and volumetric water content (VWC). * p < 0.05.
Table 3. Eigenvalues of topographical and soil-based factors and their contributions in the typical mixed broadleaved Korean pine forest.
ModelPrincipal ComponentEigenvalueVariance Contribution (%)
Sap-RGRPC14.06631.28
PC22.63720.29
PC32.21117.01
Sap-MRPC14.33733.36
PC23.66228.17
PC32.06515.88
Lar-RGRPC14.90037.69
PC23.03323.33
PC31.92614.82
Lar-MRPC14.80836.99
PC23.85529.65
PC31.80813.91
Sap represents saplings (1 cm ≤ DBH < 10 cm). Lar represents large trees (DBH ≥ 10 cm).
Table 4. Result of coefficients of principal component analysis for topographical and soil characteristics of RGR and MR in saplings and large trees.
ModelSaplingsLarge trees
RGRMRRGRMR
PC1PC2PC3PC1PC2PC3PC1PC2PC3PC1PC2PC3
Ele0.0230.0100.5750.341−0.1190.4450.1210.3670.176−0.349−0.1480.315
Slo−0.177−0.3130.3950.222−0.398−0.2930.3520.1070.271−0.386−0.146−0.348
Sin (Asp)0.2540.189−0.335−0.3480.2310.295−0.1790.302−0.0390.3160.0330.048
Cos (Asp)0.2760.346−0.258−0.2610.3210.260−0.2440.206−0.0490.331−0.0650.054
Con−0.184−0.170−0.0640.316−0.1130.3420.2960.1140.3470.367−0.191−0.089
BD0.357−0.3060.066−0.425−0.113−0.182−0.376−0.0240.2550.337−0.172−0.281
TN−0.1560.5410.2050.2390.419−0.1580.3700.2090.1890.1090.4970.030
AN−0.2790.4580.0940.3410.356−0.0350.4100.009−0.135−0.0700.4340.023
TP0.2940.2440.422−0.0520.333−0.073−0.1040.4290.2700.1390.167−0.162
AP0.3950.1500.075−0.3730.0010.264−0.2600.1580.3580.371−0.0170.066
OC0.3970.0060.2880.0250.313−0.4300.3720.032−0.2020.1910.307−0.025
PH0.1010.129−0.0160.026−0.1270.2710.126−0.4240.0360.095−0.2940.017
VWC−0.3880.1440.0790.2130.3400.221−0.0210.489−0.386−0.1510.3630.361
Topographical and soil-based factors included are the same as in Table 1. Saplings (1 cm ≤ DBH < 10 cm); large trees (DBH ≥ 10 cm).
Publisher’s Note: MDPI stays neutral with regard to jurisdictional claims in published maps and institutional affiliations.

