Article

Transient Flooding and Soil Covering Interfere with Decomposition Dynamics of Populus euphratica Leaf Litter: Changes of Mass Loss and Stoichiometry of C, N, P, and K

1
State Key Laboratory of Desert and Oasis Ecology, Xinjiang Institute of Ecology and Geography, Chinese Academy of Sciences, Urumqi 830011, China
2
Akesu National Station of Observation and Research for Oasis Agro-Ecosystem, Akesu 843017, China
3
School of Geography and Planning, Ningxia University, Yinchuan 750021, China
4
Institute of Resources and Ecology, Yili Normal University, Yining 835000, China
*
Author to whom correspondence should be addressed.
Forests 2022, 13(3), 476; https://doi.org/10.3390/f13030476
Submission received: 24 January 2022 / Revised: 13 March 2022 / Accepted: 16 March 2022 / Published: 18 March 2022
(This article belongs to the Special Issue Carbon and Nutrient Cycling in Forests under Climate Change)

Abstract

:
Litter decomposition plays a critical role in carbon and nutrient cycling in terrestrial and aquatic ecosystems. However, the effects transient flooding and soil covering have on leaf litter decomposition remain unclear. The changes of litter mass loss and stoichiometric ratio of C:N (the ratio of carbon to nitrogen), C:K (the ratio of carbon to potassium), C:P (the ratio of carbon to phosphorus), N:P (the ratio of nitrogen to phosphorus), and N:K (the ratio of nitrogen to potassium) of fresh Populus euphratica (P. euphratica) leaves in surface, transient flooding, and soil covering treatments were studied using litterbags in a desert riparian forest in a field decomposition experiment for a period of 640 d. The results showed that there was a significant influence of disturbance type and incubation time on litter mass loss rate and stoichiometric ratios of C:N, C:K, C:P, N:P, and N:K of fresh P. euphratica leaves, but no significant influence of the interaction between disturbance type and incubation time on leaf litter mass loss. In three treatments, five sequential phases of leaf litter mass loss rate and different temporal change patterns of stoichiometric ratio were identified within 640 d. Transient flooding was shown to affect P. euphratica leaf litter mass loss phases compared to that in no-disturbance conditions, and especially promote leaf litter mass loss within 0–173 d of incubation time. It was also demonstrated that transient flooding and soil covering can influence leaf litter decomposition, which led to the leaf litter mass loss rate and the stoichiometric ratios of C:N, C:K, C:P, N:P, and N:K exhibiting varied patterns and phases in different treatments during decay.

1. Introduction

Litter comprises a top layer in soil profiles, and serves as the energy and nutrient source of microbial metabolism [1]. Litter decay, as a mechanism of nutrient release, is a key ecological process resulting from the interaction of abiotic and biotic drivers in the functioning of both managed and natural ecosystems [2,3]. It also constitutes a complex process with conspicuously different release rates of various nutrients, and plays a critical role in carbon and nutrient cycling in terrestrial and aquatic ecosystems [4,5,6] and its significance increases in degenerated sites [7]. The decomposition process and decay rates are affected by temperature and moisture, as well as substrate quality and decomposer community attributes, and the habitat conditions significantly influence litter decay during decomposition [8]. Different plant litters possess distinct physical and chemical properties, and different organisms are involved in breaking down the materials [9,10]. Leaf litter, a part of plant litter, can account for 22–81% of a plant’s annual litter production, and leaf litter has received considerable attention regarding its decomposition in tropical and subtropical forests [11], but less attention in desert riparian forests located in extremely arid zones. On a global scale, the importance of litter decomposition is amplified by climate change because of its important role in ecosystem element cycling and its enormous impact on carbon fluxes. At local scales, the process of decomposition is very important as its rate affects the functionality of ecosystems [12]. Therefore, it is necessary to elucidate leaf litter mass change patterns during decomposition processes in desert riparian forests in extremely arid zones.
Nutrient cycling in forest ecosystems is mainly regulated by the rates of falling and decay of litter [13]. The process and pace of litter decomposition greatly impact how plants and microbes utilize C, N, P, and other nutrients. The stoichiometry of C, N, and P is useful for elucidation of nutrient use efficiency and relative nutrient limitation in forest ecosystems [14]. A variety of abiotic and biotic factors, including climate and leaf habitat, have been shown to influence leaf litter C, N, and P stoichiometric ratios over broad geographical scales [15,16,17,18]. However, whether these factors are also important determinants of leaf litter C, N, and P stoichiometry during leaf litter decomposition at species scale has not yet been determined. A comprehensive knowledge of stoichiometric ratios of litter C, N, and P is crucial for understanding plant nutrient utilization strategies, plant–soil feedback on nutrient cycling, and estimating litter nutrient storage in ecosystems, leaf litter decomposability, and other coupled ecological processes under a changing environment [19,20].
The desert riparian forest is an important vegetation type for inland river valleys in arid zones, forming a natural ecological barrier to protect oases’ development, stabilizing river course, maintaining the ecological balance of river basins, and facilitating the formation of fecund forest soil [21,22]. In natural ecosystems, disturbances frequently come from regime shifts such as fire or flooding cycles. Riparian zones in floodplains are occasionally or periodically disturbed by flood events. This disturbance, of which the timing, frequency, intensity, and duration are determined by a flow regime, greatly influences reproduction, survival, growth, community structure, and even patterns of riparian vegetation [23,24]. P. euphratica Oliv., as a predominant species in desert riparian forest ecosystems, is found in the arid and semi-arid deserts of Mid-Asia [25]. China possesses the largest range and number of P. euphratica, which comprises 61% of the global P. euphratica forest [26]. Moreover, the natural P. euphratica forest in the Tarim River Basin, Xinjiang, accounts for 54% of the global and 89% of China’s P. euphratica area [21]. In the lower reaches of the main channel of the Tarim River, the regeneration and conservation of desert riparian P. euphratica forest are primarily affected by disturbances of river flooding and groundwater level rise along the main channel of the Tarim River [21]. In the lower reaches along the main channel of the Tarim River, the P. euphratica forest could be regularly disturbed by flooding prior to 1970. From 1970–2000, however, it could not be disturbed by flooding because the lower reaches along the main channel of the Tarim River dried up beginning in the 1970s. After 2000, flooding disturbances may occur during water delivery to the lower reaches along the Tarim River. The water delivery was an integrated plan involving water delivery to the lower reaches along the river to prevent continued deterioration of desert riparian forest along the main channel of the Tarim River [27]. The duration and frequency of the flooding are variable, the duration ranging from an instant to several days and the frequency ranging from one or more times, depending on the amount of water and period of water delivery in the lower reaches along the main channel of the Tarim River. Since 2000, water delivery has been carried out one or two times a year from March to April or August to November annually depending on the amount of water in the source flow, and transient flooding from seconds to hours represents a more common disturbance for riparian forests during water delivery in the lower reaches along the main channel of the Tarim River. High soil moisture caused by flooding, which constitutes 10–30 d of inundation, is conducive to decomposer community composition, microbial activities via changes in other abiotic or biotic conditions [28], and promotes decomposition of organic matter [4] and water-soluble salt in leaves dissolved by flooding [29]. However, what effects will transient flooding have on leaf litter mass loss and leaf litter stoichiometry during decomposition?
Soil movement and translocation are common for low vegetation cover, and litter on the ground is frequently covered with soil or completely buried in the desert riparian forest. It is a common phenomenon that leaf litter becomes exposed to the ground or covered with soil in the lower reaches along the main channel of the Tarim River. The litter covered with soil is no longer directly exposed to light, which may affect litter decomposition due to the lack of photodegradation. Photodegradation, i.e., enhancement of decomposition rate caused by exposure to light, may play a key role in plant residue and soil organic matter decomposition [30,31]. Heat and glare photodegrades litter, and 33%–60% mass loss of plant litter is caused by light in the absence of microbes, particularly lignin [32]. However, there are different views on the effects of photodegradation on litters. No significant effect of solar UV-B photodegradation on dryland litter decomposition was found, and the solar radiation environment was poorly correlated with decomposition of surface litter over a 2-y period in a semi-desert Arizona shrub savanna [33]. Photodegradation may have been important in the early stages of decomposition, but its effects were negated by soil cover of litter over the 1-y course of the study [34]. Significantly greater mass loss has been reported in buried litter than in surface litter in diverse ecosystems, especially in dry regions [35]. It is, therefore, unknown what effect soil covering has on leaf litter mass loss and leaf litter stoichiometry during decomposition.
Thus far, previous studies on P. euphratica have focused on population dynamics, distribution and composition of plant communities, as well as physiological and biochemical responses to abiotic factor stress [25,36,37]. However, relatively little attention has been paid to litter decomposition, especially to the effects of transient flooding and soil covering disturbances on leaf litters mass loss and leaf litter stoichiometry during decomposition at a local level, such as in sites characterized by a similar climate. It is not yet clear whether transient flooding and soil covering disturbances influence the mass loss and stoichiometry of P. euphratica leaf litter during the decomposition process. Knowledge about particular plant material decomposition rates on specific habitat conditions can help forest managers to properly modify management practices for successful forest conservation. Therefore, the effects of disturbances of transient flooding and soil covering on leaf litter decay, with a particular focus on evaluating the difference of probable dynamic characteristics of leaf litter mass loss and stoichiometry (C:N, C: K, C:P, N:P, and N:K) were studied. In this study, we pose two key questions: first, do transient flooding and soil covering affect leaf litter mass loss rate and stoichiometry? Second, does leaf litter mass loss and stoichiometry change with incubation time during decomposition under transient flooding and soil covering disturbances?

2. Materials and Methods
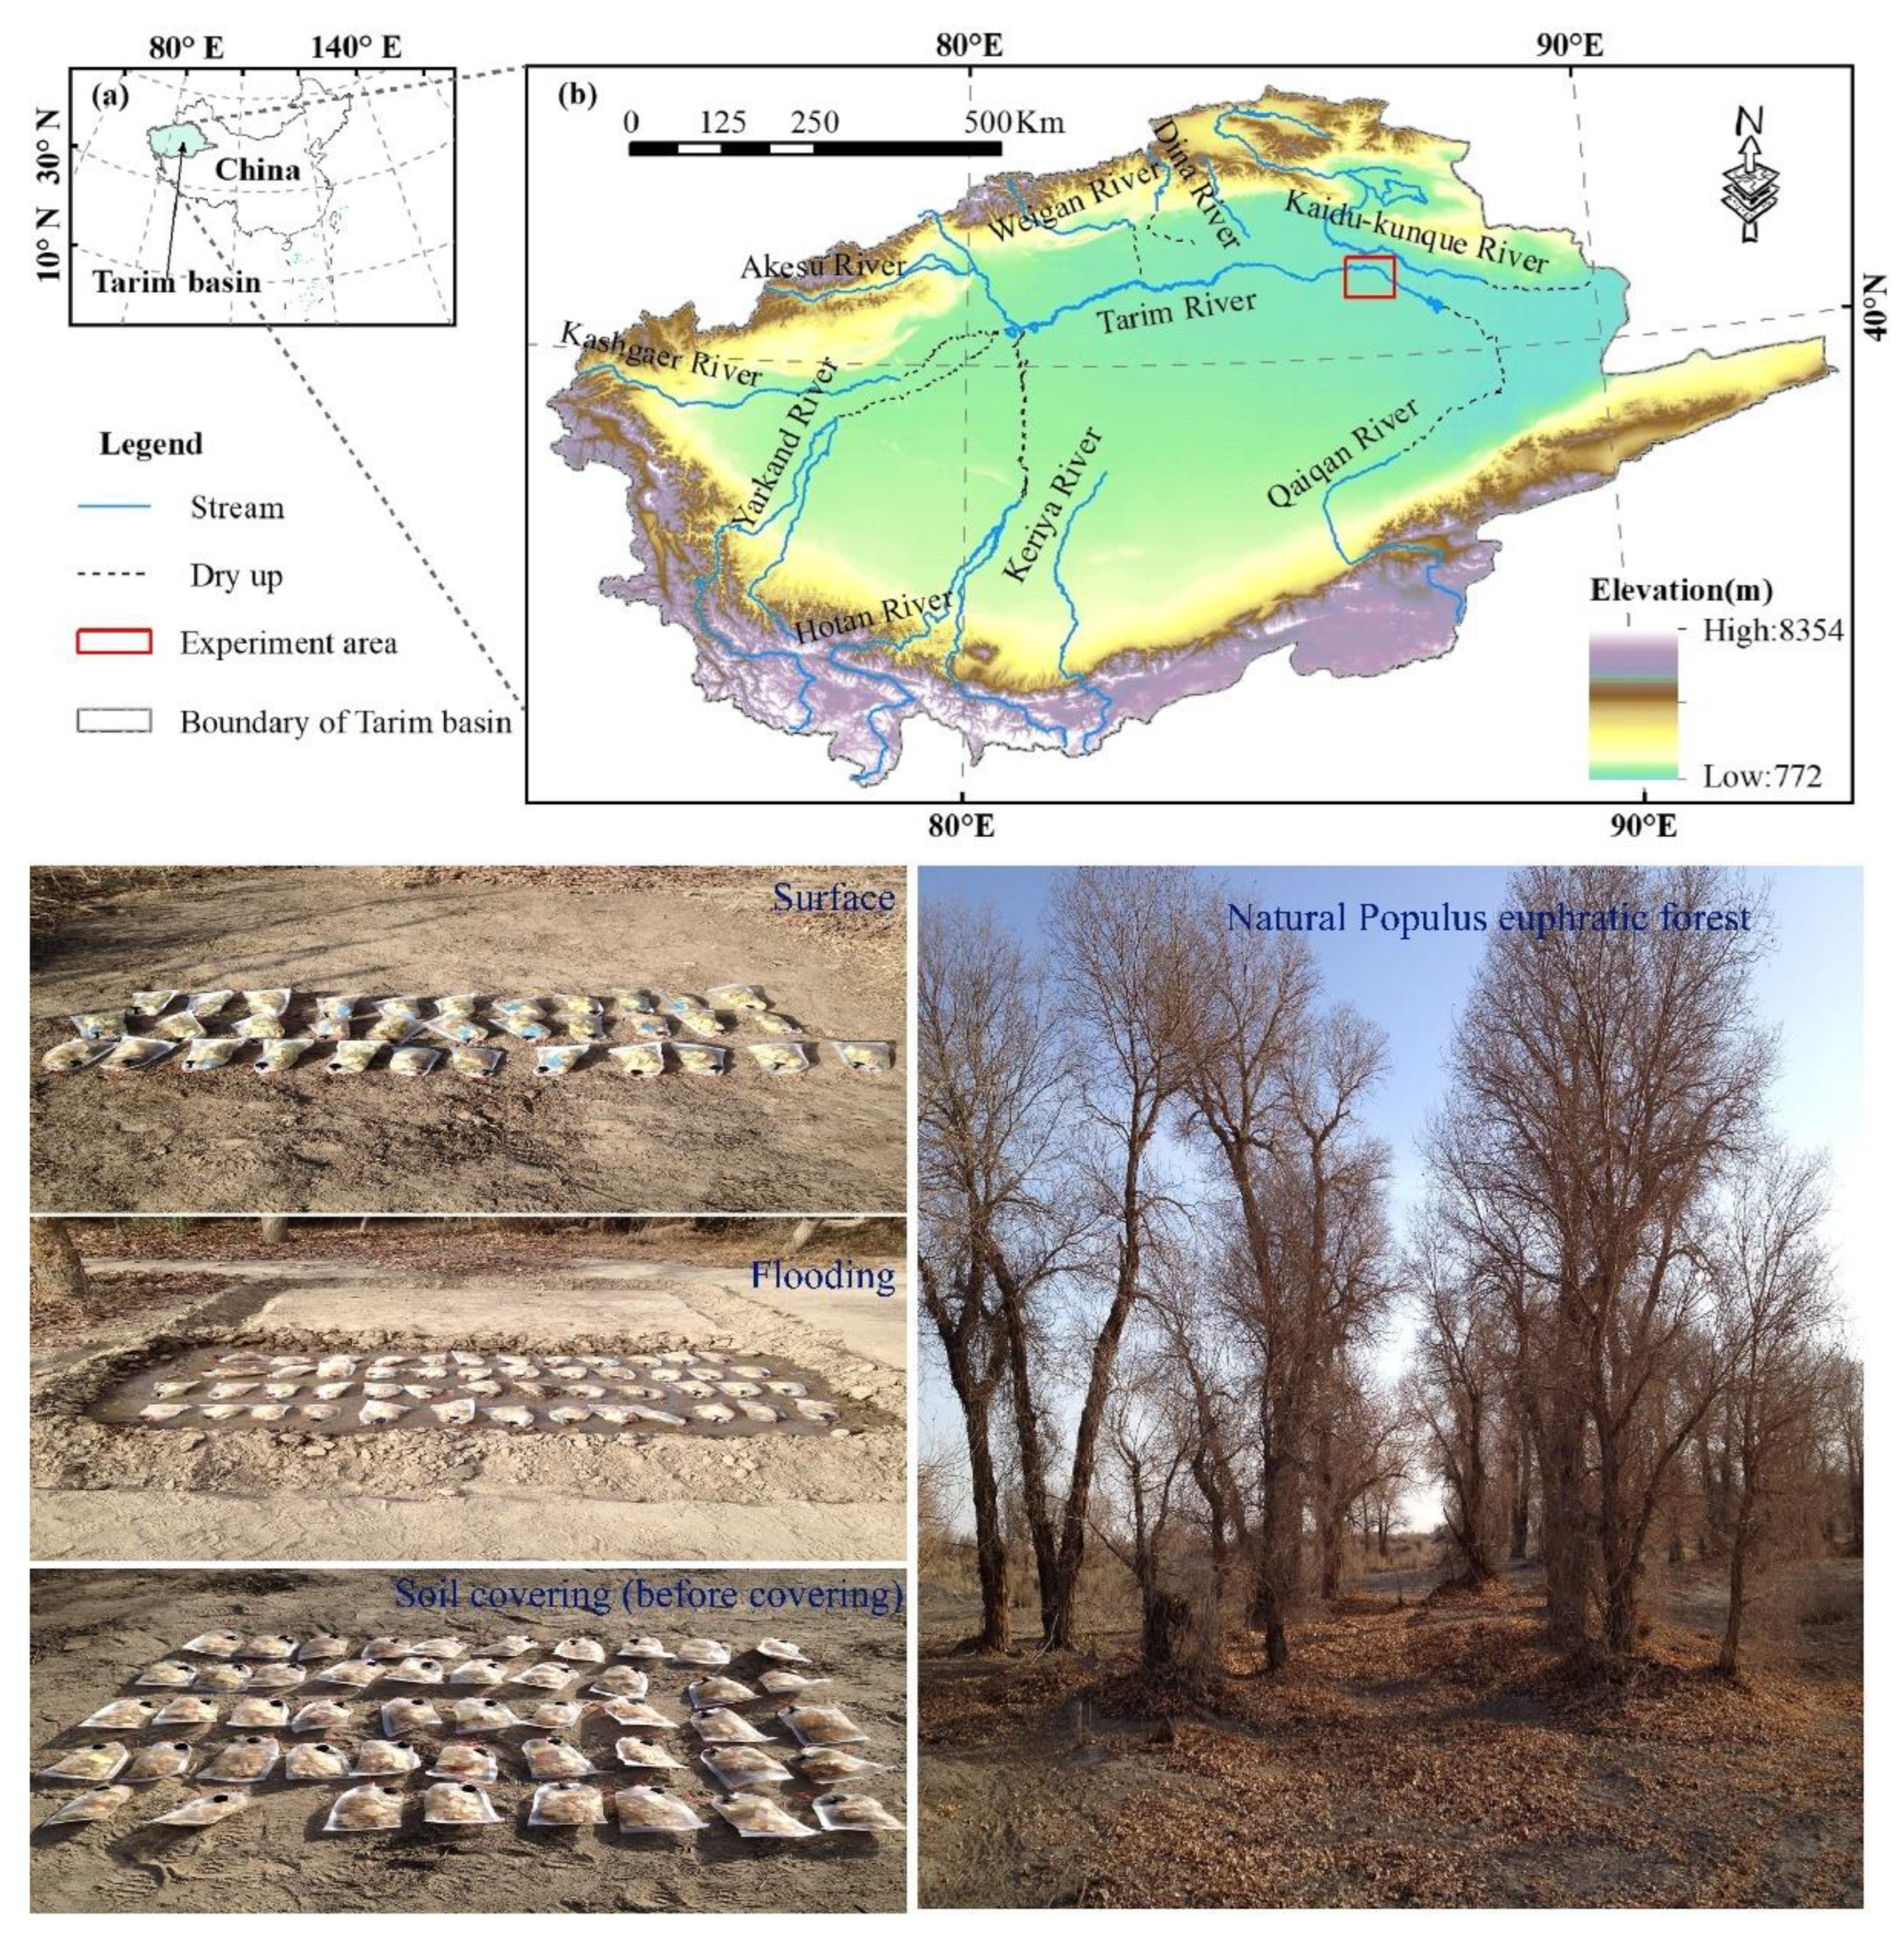
2.1. Research Site

Fieldwork was carried out in the lower reaches of the main channel of the Tarim River (Figure 1). For this region, dry environmental conditions are responsible for the fragility and instability of ecosystems in the area. Total annual solar radiation varies between 5692 and 6360 MJm−2. The average temperature for January is 10 °C, and for July is 26 °C. Annual precipitation averages less than 50 mm, but potential annual evaporation is estimated to be in the range of 2500 to 3000 mm [25]. The major plant species, including trees such as P. euphratica, shrubs of Tamarix spp., Lycium ruthenicum, and herbaceous plants consisting of Phragmites communis and so on, growing along riparian zones in the region cannot be supported by solely relying on natural precipitation, and is mainly fed by groundwater [25].

2.2. Sample Preparation and Decomposition Experiment

P. euphratica Oliv., as a predominant species in desert riparian forest, is a deciduous tree whose majority of leaves fall off within a short period in autumn, but few branches fall off every year. On 20 October 2015, freshly fallen leaves of P. euphratica were collected from the study stand in the lower reaches along the main channel of the Tarim River. After the removal of contaminating debris, the intact leaves were dried at 50 °C for 24 h to maintain original color and quality of the leaves [37], then whole leaves were subsequently stored at room temperature. Litterbags (dimensions of 25 × 15 cm) made of polyethylene nets (1-mm mesh size) were filled with 10.0 g of whole leaves. All litterbags were prepared in the laboratory and transported in individual plastic bags to the study site [38].
The leaf litter decomposition experiment was initiated on 11 November 2015, when it was already winter [38]. In order to assess the influences of transient flooding and soil covering on decomposition of litter, we incubated P. euphratica leaf litter in a field in the P. euphratica forest located in the lower reaches along the main channel of the Tarim River more than 1000 km away from Urumqi (Figure 1). We chose a site to serve as the incubation bed and cleared the standing plants and litters. The experiment had a random block design with 3 plots with a size 3 m × 2 m each for three decomposition treatments, and the plot was divided into three subplots. According to disturbance type, three litter decay treatments were established: (1) surface: litterbags placed on the ground (control); (2) flooding: litterbags fixed and immersed in water for 5 h on the ground; and (3) soil covering: litterbags covered with 3–5 cm soil (simulating a shallow soil-buried disturbance) during the experiment period [38]. In order to simulate a transient flooding disturbance, artificial irrigation was used for flooding treatment, which kept leaf litter immersed in water for about 5 h on the ground at the beginning of the incubation experiment. To ensure that there were a sufficient number of litterbags to collect during the experiment, 37–50 litterbags were placed on the flat surface area by utilizing metal pins to prevent shifting and to ensure proper contact between organic soil layers in each treatment. Litterbags of each treatment were randomly placed in the plot. In addition, the plots were at 20 m intervals to avoid large variations in soil properties. The in situ experiment lasted up to 640 d to test whether and how long a transient flooding disturbance would affect the leaves decomposition [38]. In order to capture the dynamic changes of leaf litter decomposition with incubation time, three replicates of litterbags were randomly collected from each treatment (one per subplot) at the same incubation time. The collecting time was random, and no litterbags were retrieved in winter because the litterbags were covered by snow or were frozen. Specifically, the collecting times were 173, 290, 380, 470, 560, and 640 d after post-installation, respectively. A total of 57 litterbags were sent to the laboratory (including three litterbags of 0-d incubation in the surface treatment) [38]. The residual leaf litter in each litterbag was carefully cleaned with a brush by hand to remove soil particles and other mess. In order to reduce drying time, the residual leaf litter was then oven-dried at 65 °C instead of at 50 °C until the mass stabilized. The dried residual leaf litter was weighed to determine dry mass [38].

2.3. Assessment of Mass Loss

Rate of leaf litter mass loss (R) and percent of original mass remaining (POM) were used to reflect leaf litter mass loss. The rate of leaf litter mass loss and the percent of original mass remaining were determined as follows:
R = [ ( X 0 X i ) / X 0 ] × 100
P O M = [ ( X i ) / X 0 ] × 100
where Xi is the dry mass of the leaf litter at a given time i of decomposition; and X0 is the initial dry mass of the leaf litter at time 0.
The increment of leaf litter mass loss over a period of time was determined as follows:
Δ R i j = R i R j
where ΔRij is the increment of leaf litter mass loss over a time period; Ri is the leaf litter mass loss at a i time of decomposition; and Rj is the leaf litter mass loss at a j time of decomposition.

2.4. Nutrient Chemical Analysis

Prior to installation, the leaf litter from the three litterbags was used to analyze initial nutrient concentration (initial C, N, P, and K content of leaf litter was 416.7 ± 1.43 g/kg, 1.97 ± 0.57 g/kg, 0.55 ±0.01 g/kg, and 5.59 ± 1.12 g/kg, respectively). For the retrieved leaf litter, the oven-dried residual leaf litter samples were ground and sieved through a 0.5-mm mesh and analyzed for total C, N, P, and K concentrations [39]. Total C and N concentrations were measured by a total organic carbon analyzer (Aurora 1030, OI, USA) and a semi-micro Kjeldahl method, respectively. To measure P concentration, 0.2 g litter sample was digested in a 10 mL triacid mixture (nitric, perchloric, and sulphuric acid; 5:1:1), and then cooled. The P concentrations in the digested solution were measured using the ammonium molybdate stannous chloride method. The concentration of K in the digested solution was tested with a flame atomic absorption spectrophotometer following HClO4-HNO3 digestion [39].

2.5. Data Analysis

The concentrations of C, N, P, and K for each retrieved leaf litter sample were used to determine stoichiometry (C:N, C:K, C:P, N:P, and N:K). The relationship between the increment of leaf litter mass loss (g), taken as dependent variable y, and mean daily air temperature (°C), taken as independent variable x, was fitted by curve estimation using SigmaPlot 12.0 (Systat inc., San Jose, CA, USA). The analysis of variance may be appropriate when the effect of various treatments on litter decomposition by examining differences among treatment means across all sampling dates [40]. The influence of disturbance types and incubation time on the leaf litter mass loss rate and stoichiometry was tested with two-way analysis of variance of General Linear Model in SPSS 13.0 for Windows (SPSS Inc., Chicago, IL, USA). If there was no significant interaction between the two factors, one-way analysis of variance (ANOVA) with LSD tests was used to test the influence of singular factors in independently from others. When the interaction effect of time and disturbance treatment was significant, one-way ANOVA was conducted for each index at each sampling time. Meanwhile, LSD method was used for multiple comparisons. Significant results were assumed for p < 0.05 (Figure 2, Figure 3 and Figure 4). These analyses were carried out using SPSS 13.0 for Windows (S.P.S.S. Inc., Chicago, IL, USA). Figures were generated by Sigmaplot 12.5 software (Systat Software, San Jose, CA, USA).

3. Results

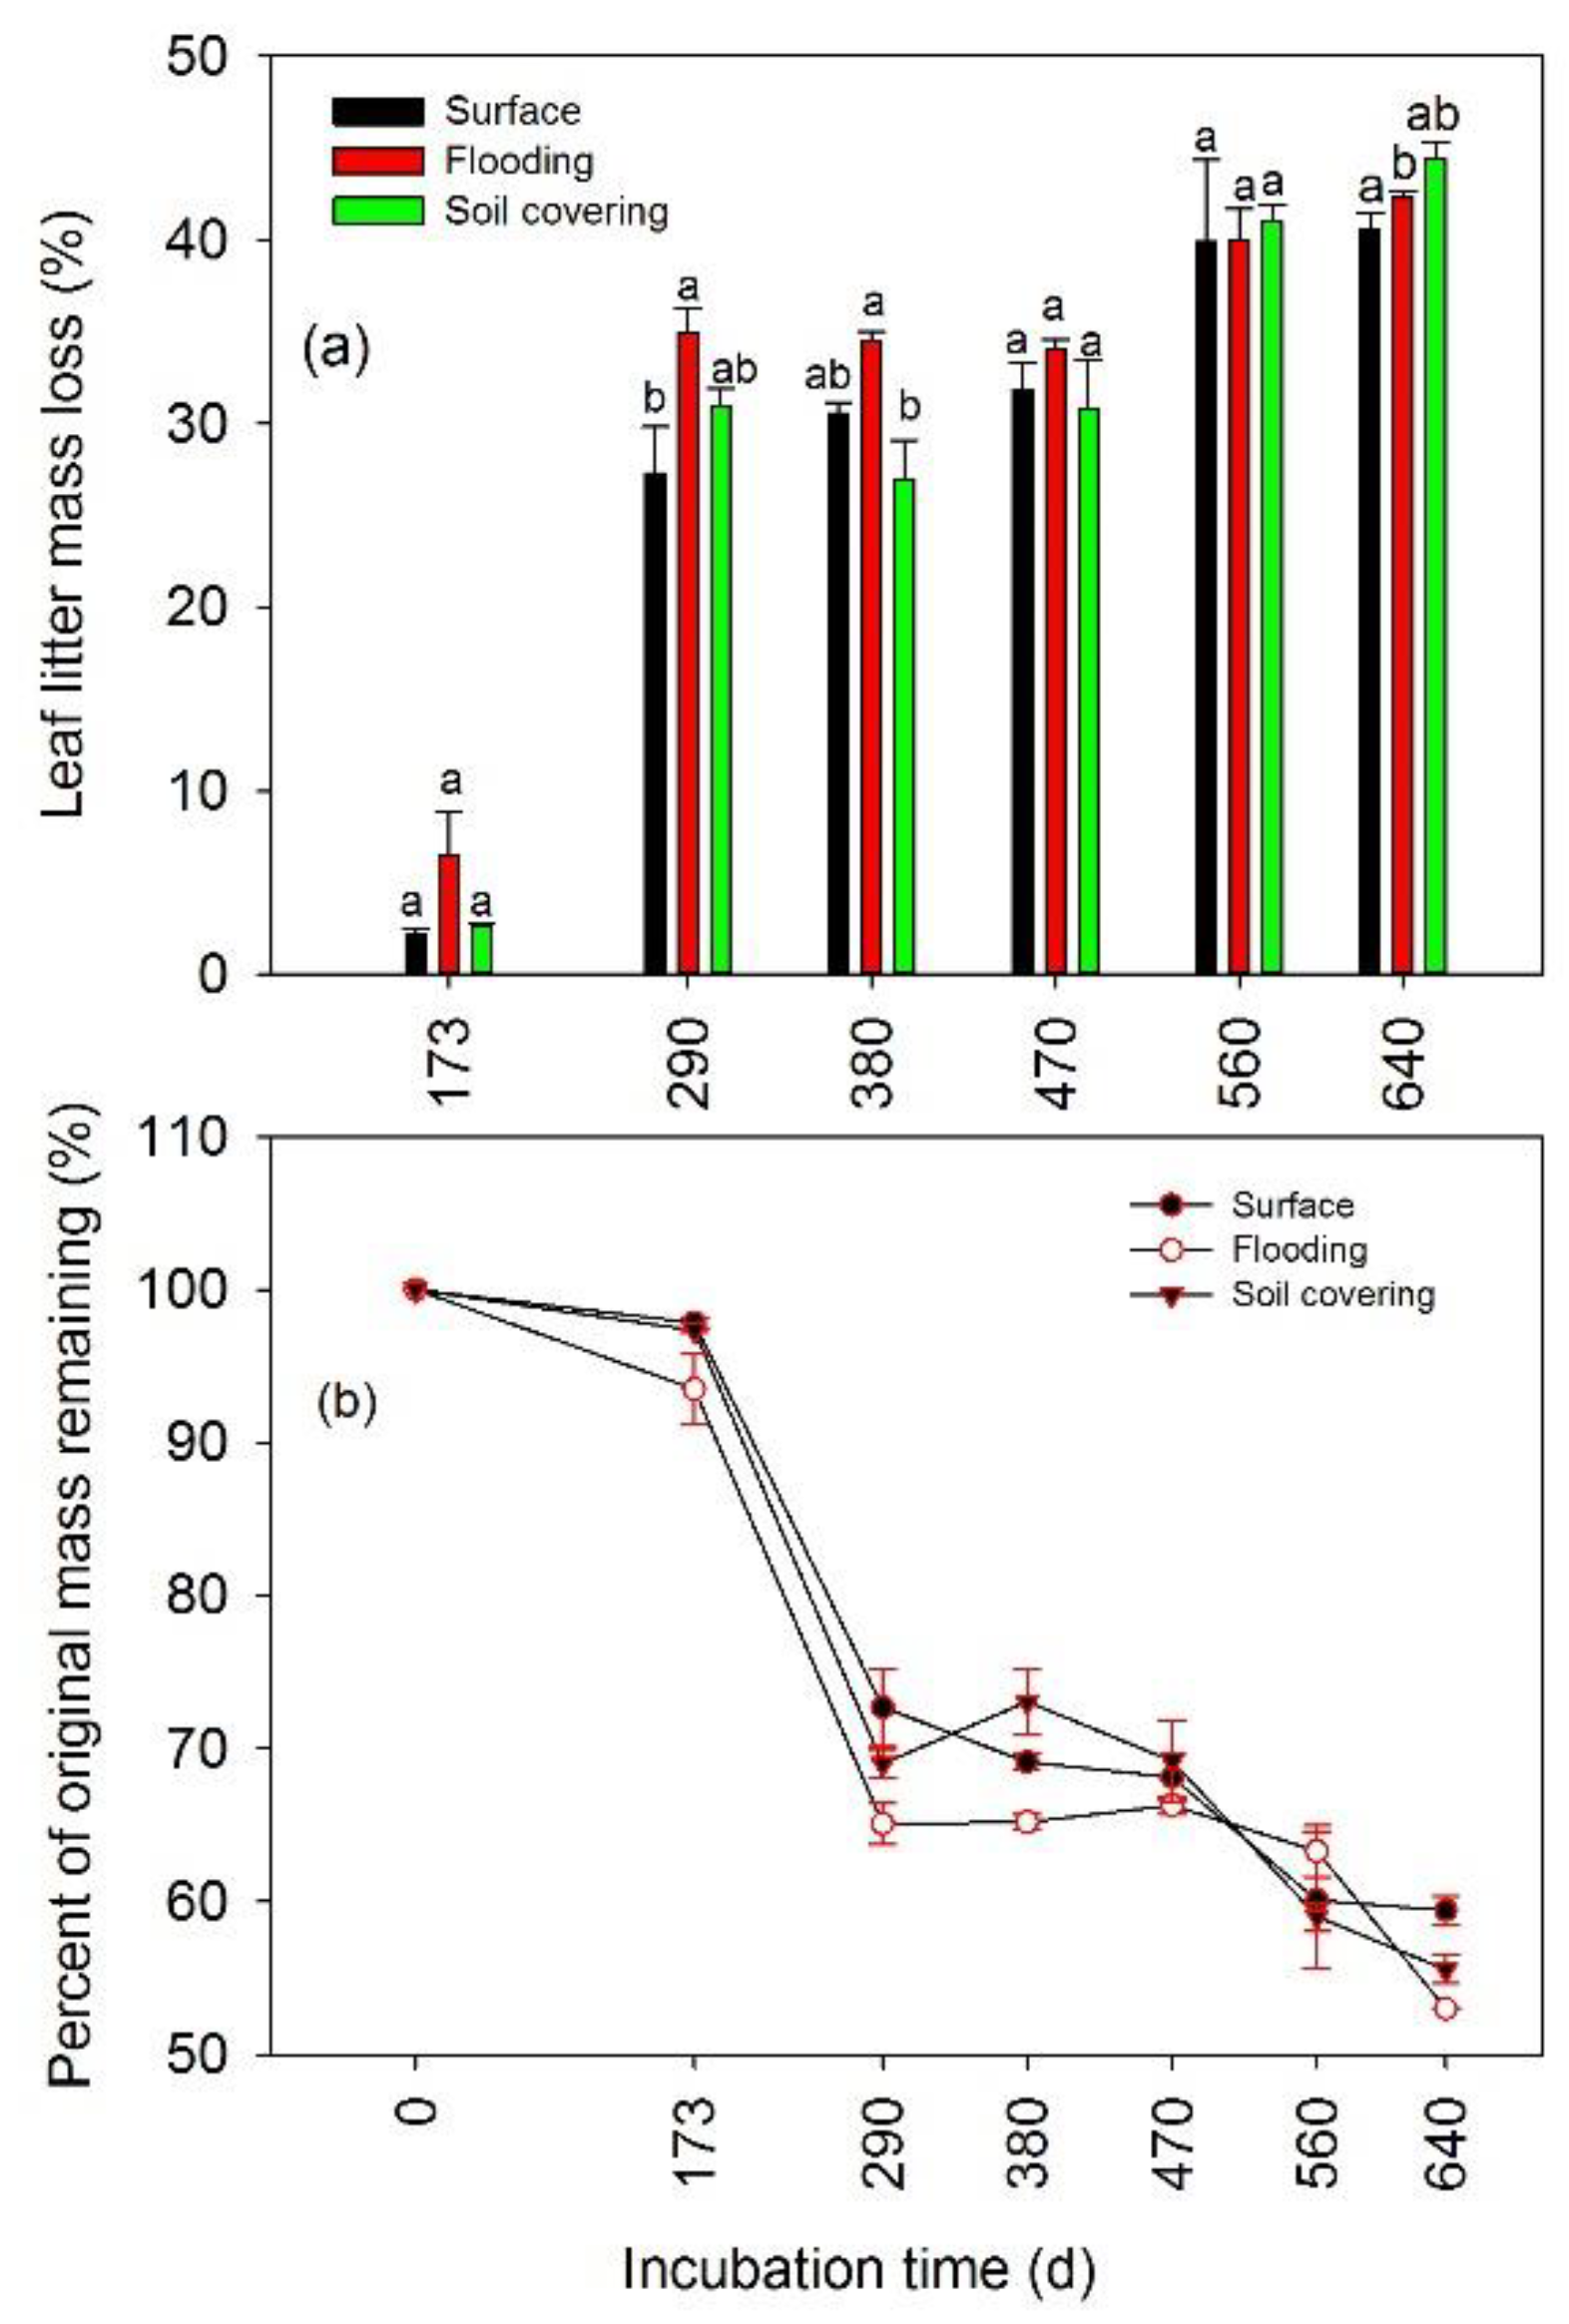
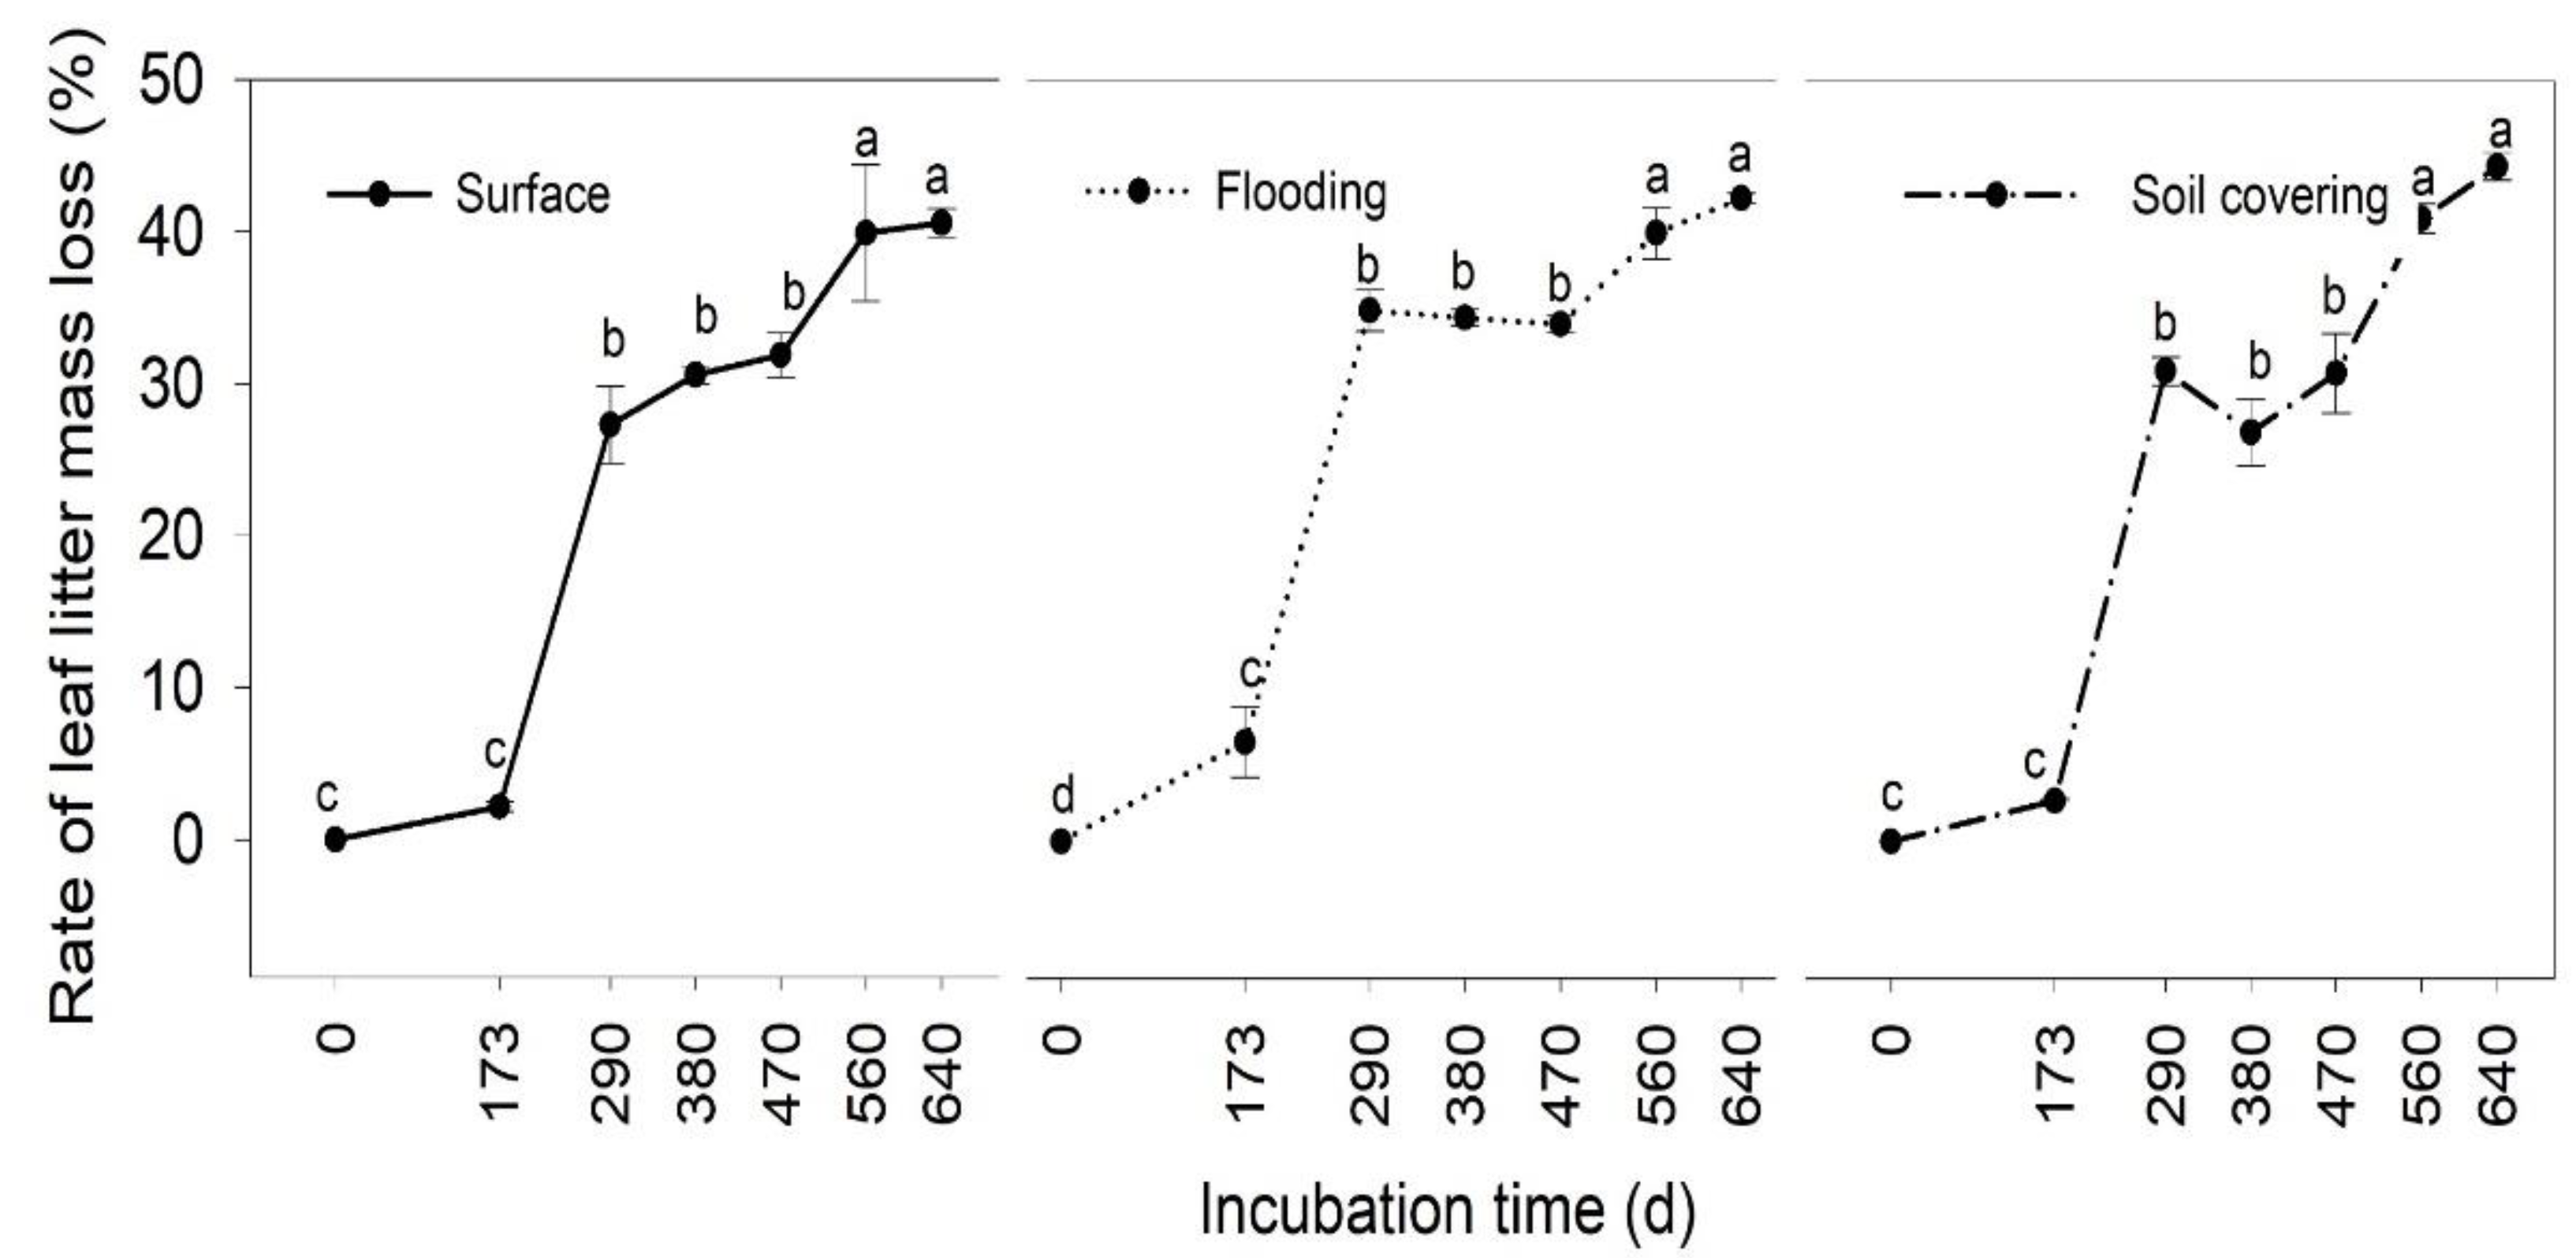
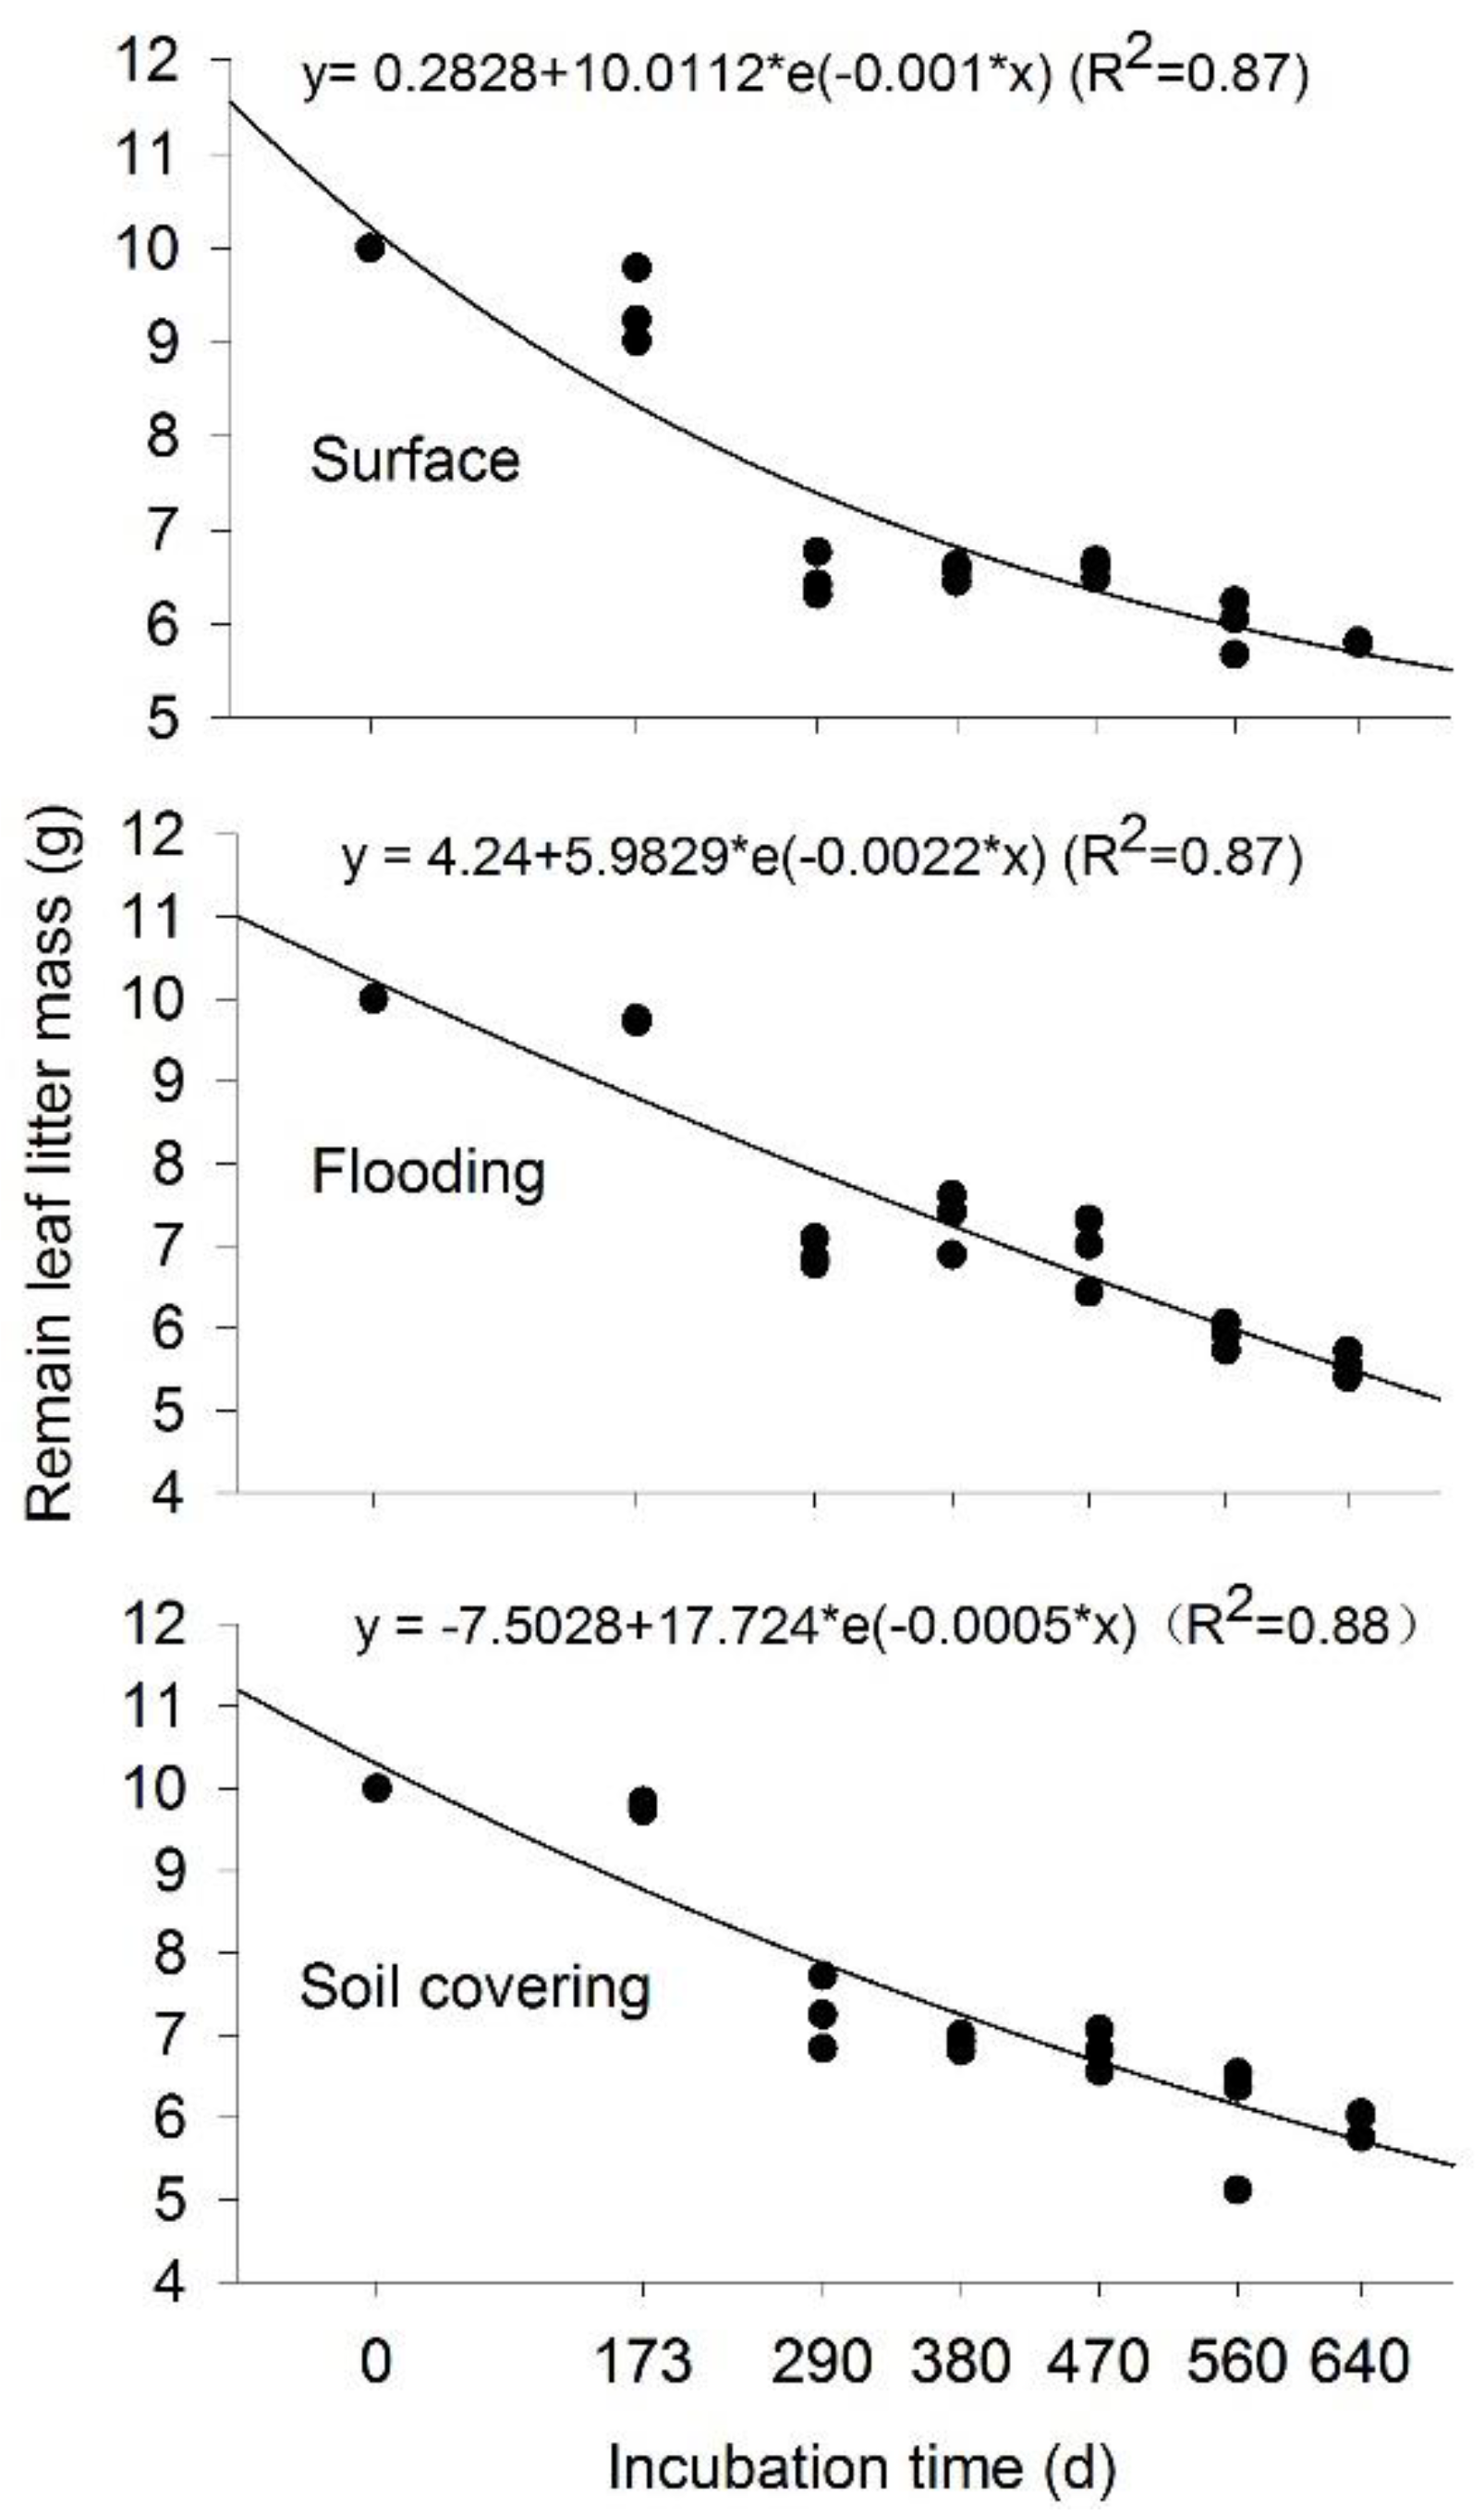
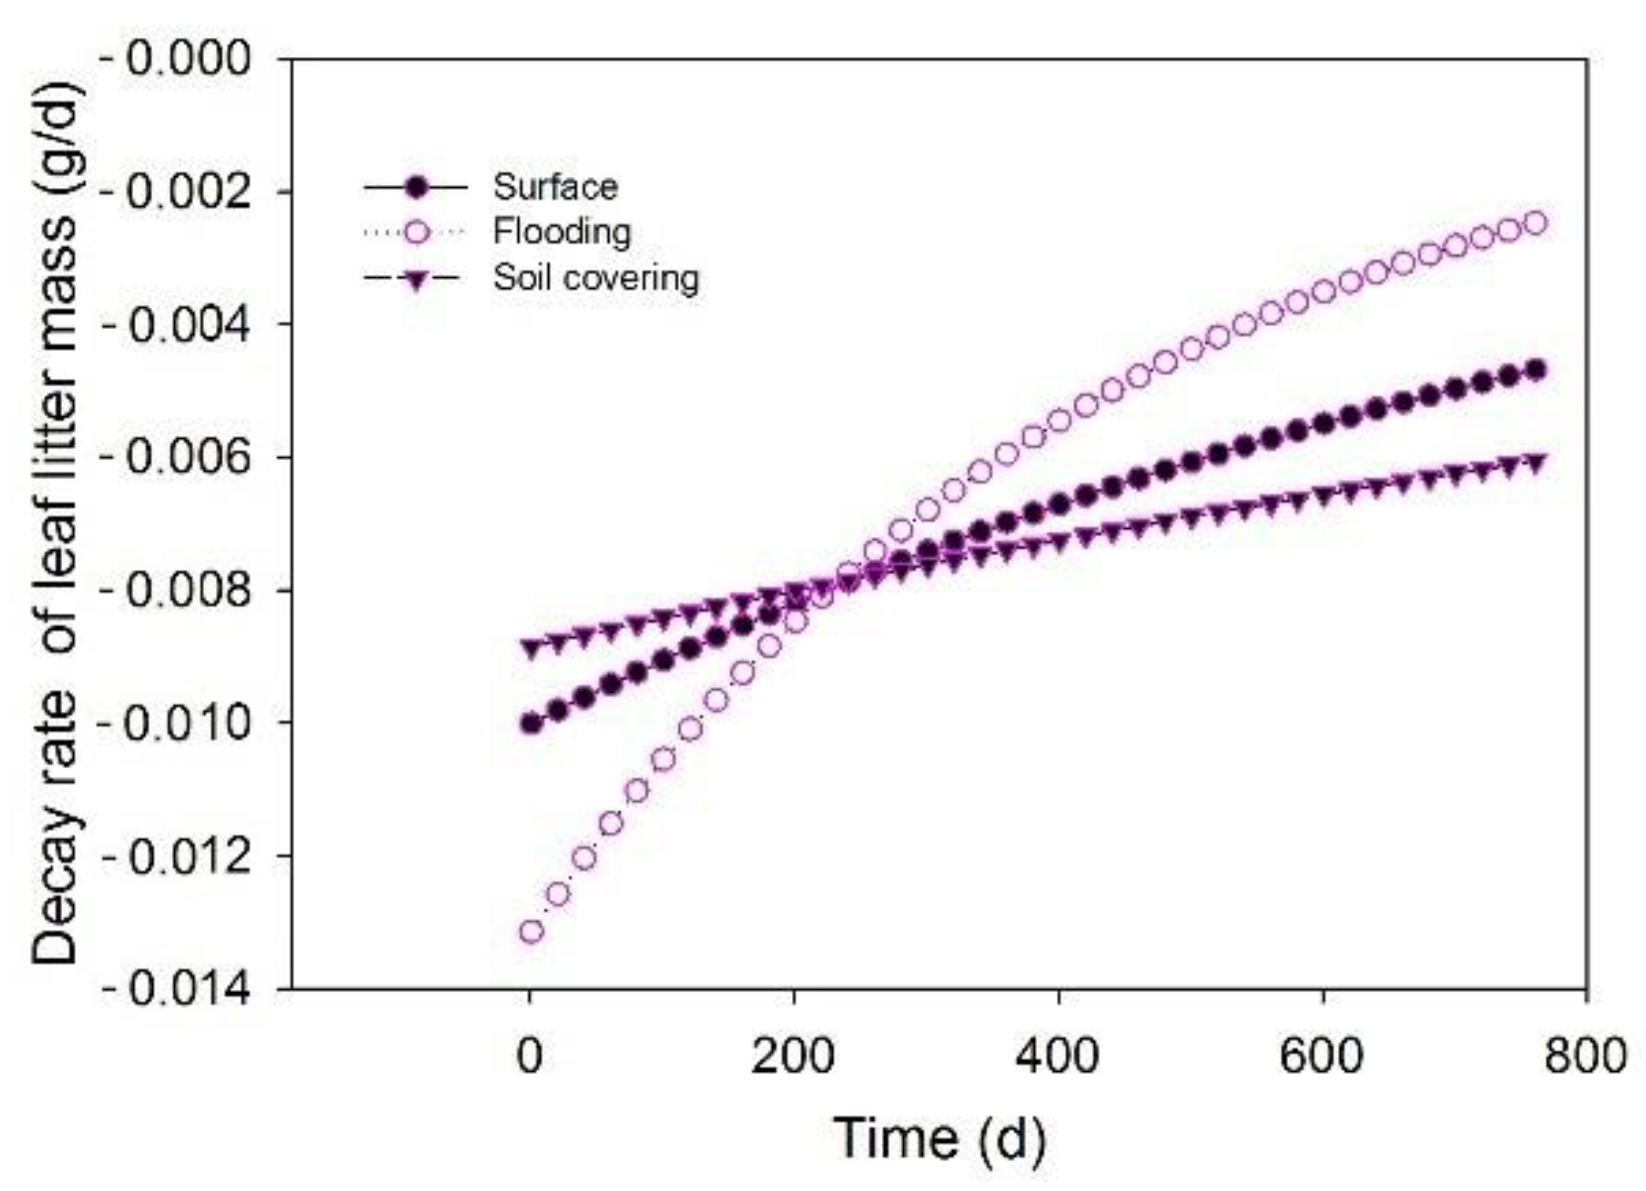
3.1. Temporal Changes of Leaf Litter Mass

Our study revealed diversified leaf litter mass loss among the different treatments. We found a statistically significant influence of disturbance type and incubation time on leaf litter mass loss, but no significant interaction between disturbance and incubation time on leaf litter mass loss was found (Table 1), indicating the interaction had little effect on leaf litter mass loss. Leaf litter mass loss showed different changes with incubation time in different treatments (Figure 2). Although the variation trends were similar, the quality of litter in different treatments exhibited a significant change in different periods.

3.2. Effects of Transient Flooding and Soil Covering on Leaf Litter Mass

In the three treatments, the responses of leaf litter mass to the disturbances appeared at different incubation times (Figure 5). At 173, 470 and 560 d, there was no obvious difference in the rate of leaf litter mass loss among the three treatments. At 290 and 640 d, however, a significant difference existed between the surface treatment and the flooding treatment (p < 0.05). At 380 d, there was a significant difference between the flooding and soil covering treatments. Except at 560 d, the percentage of original mass remaining of leaf litter in the flooding treatment was lowest among the three treatments over the course of the study. At 173, 290 and 640 d, the percentage of original mass remaining followed the order Surface > Soil covering > Flooding, whereas at 380 and 470 d the order was Soil covering > Surface > Flooding.
There was a similar exponential decay equation between the remaining mass of leaf litter (y) and incubation time (x) in the three treatments, but the equations contained different coefficients and constants in different treatments (Figure 6). Further, according to the equations, decay rate of leaf litter mass in the different treatments was obtained. In the three treatments, the decay rate of leaf litter mass was the highest within 0–290 d and the lowest after 290 d, while it was just the opposite in the soil covering treatment (Figure 7). Therefore, the disturbances may not affect the variation trend of leaf litter mass, but can affect decay rate of leaf litter mass during decomposition.

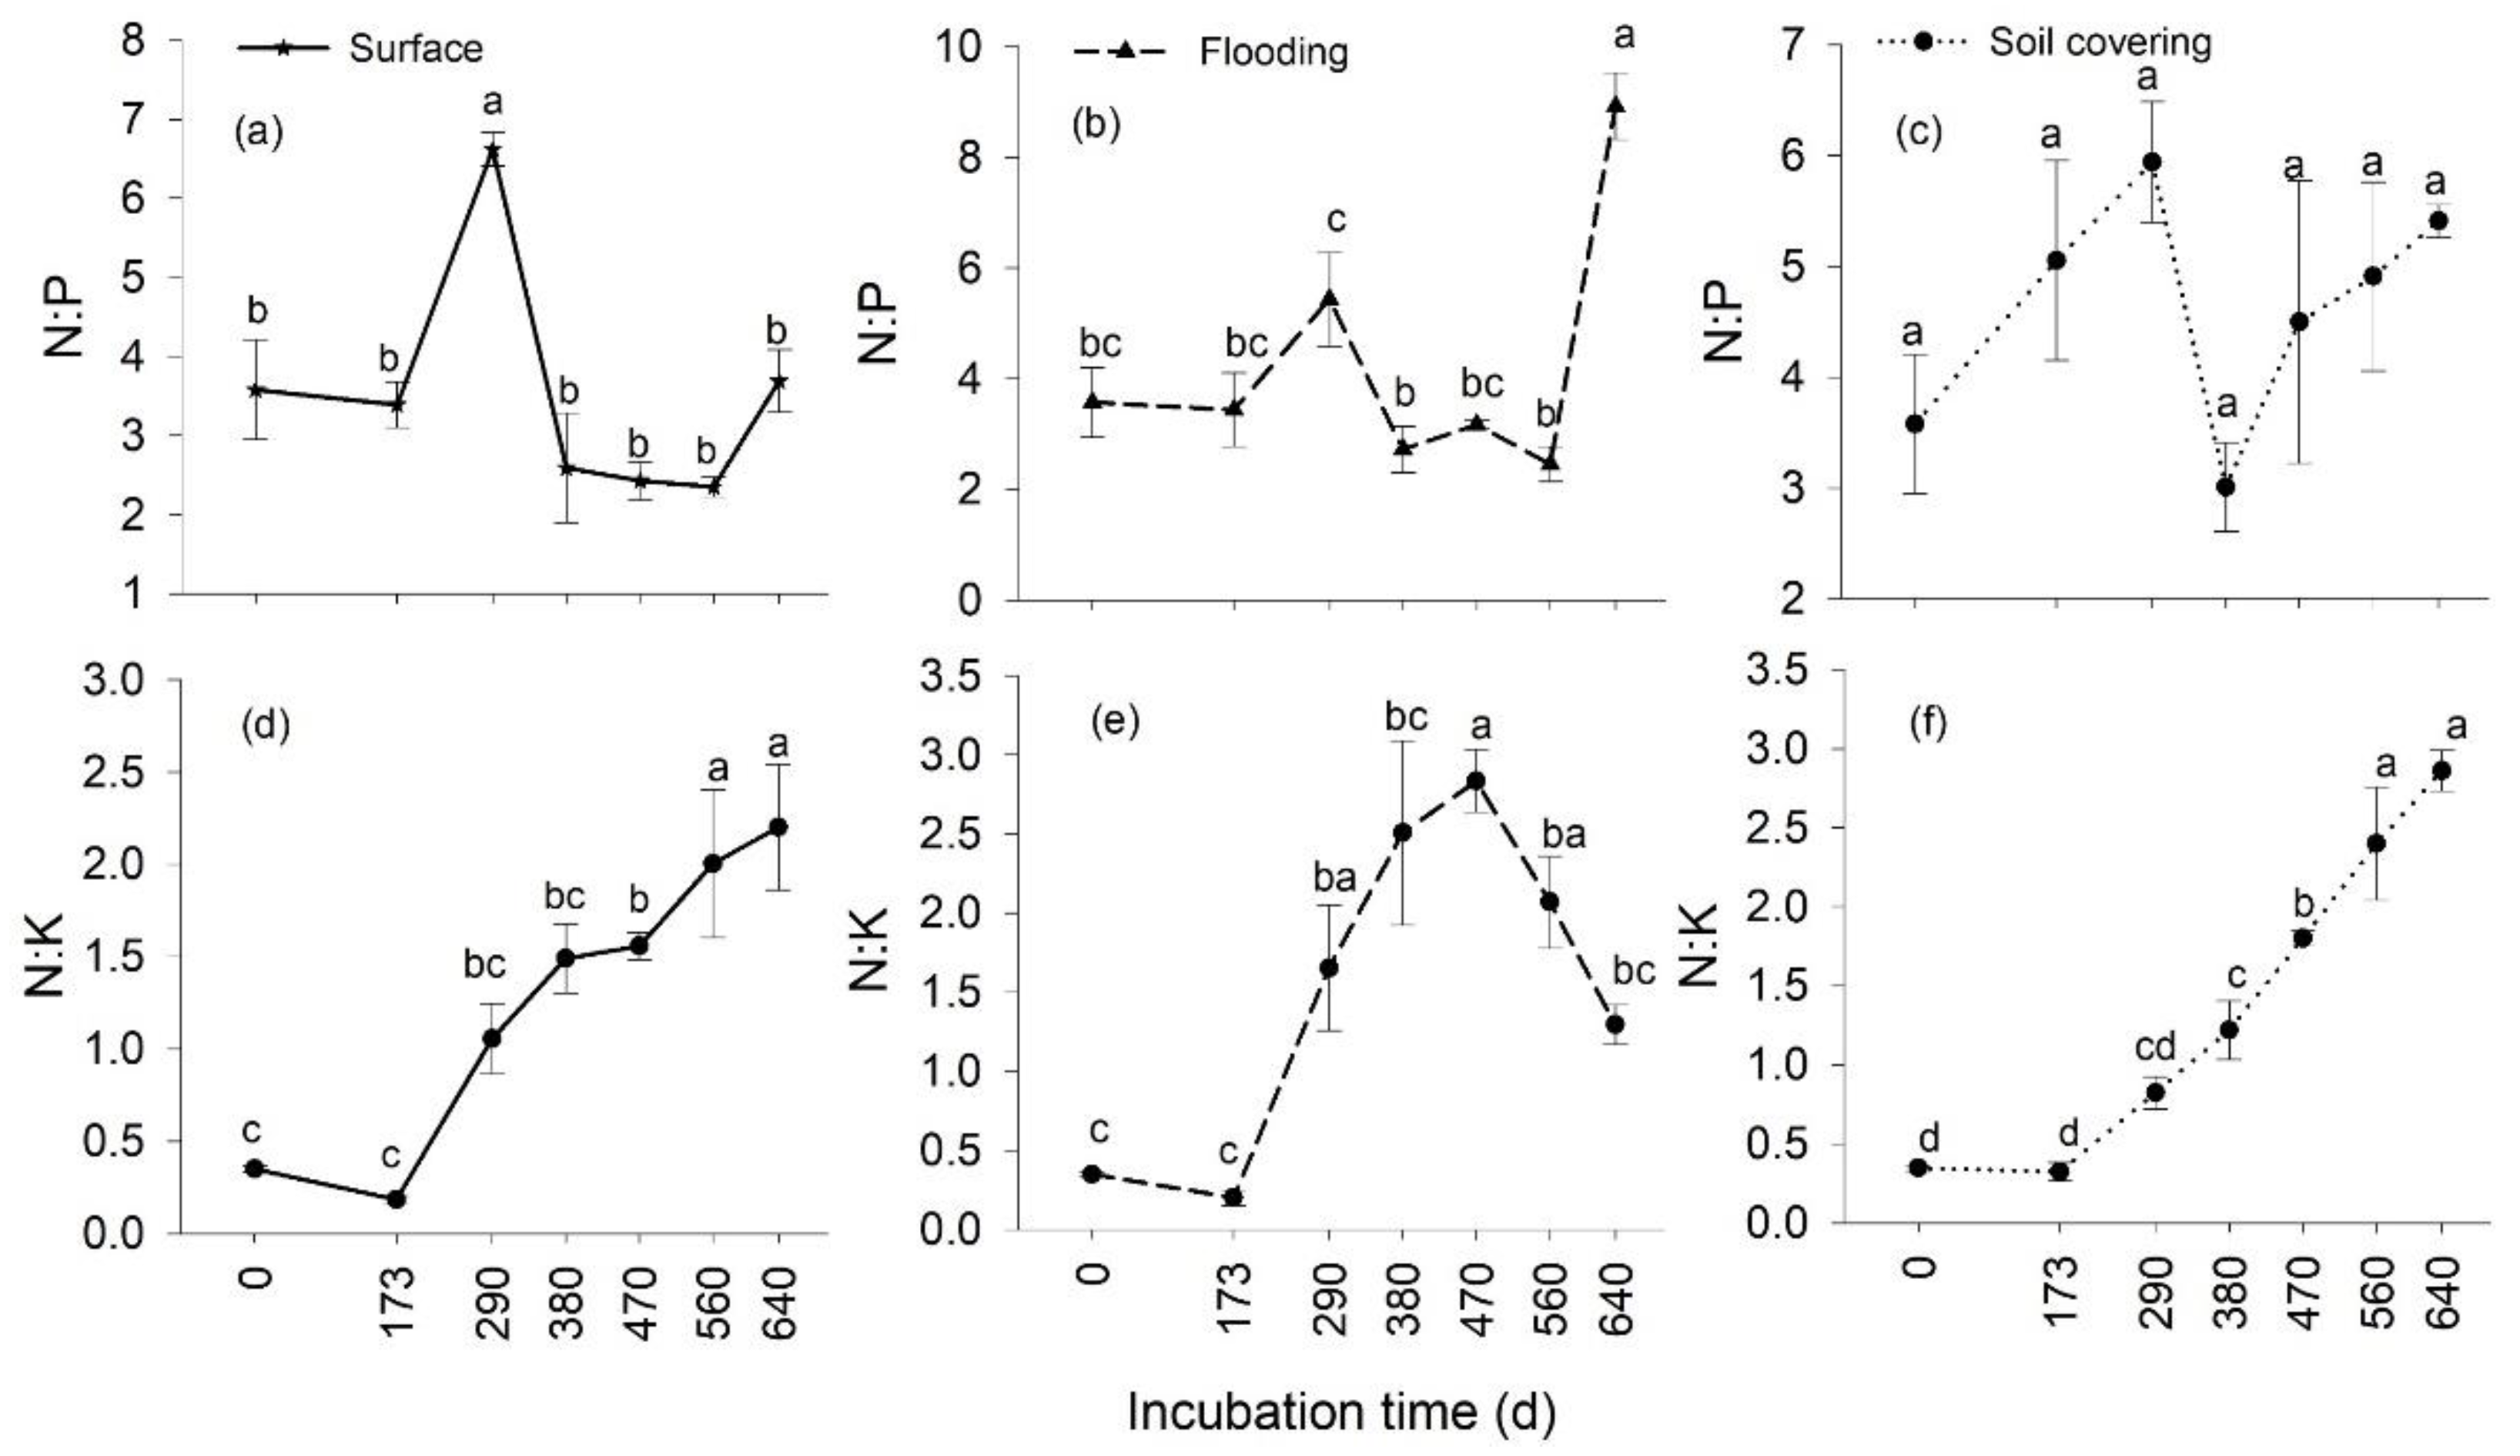
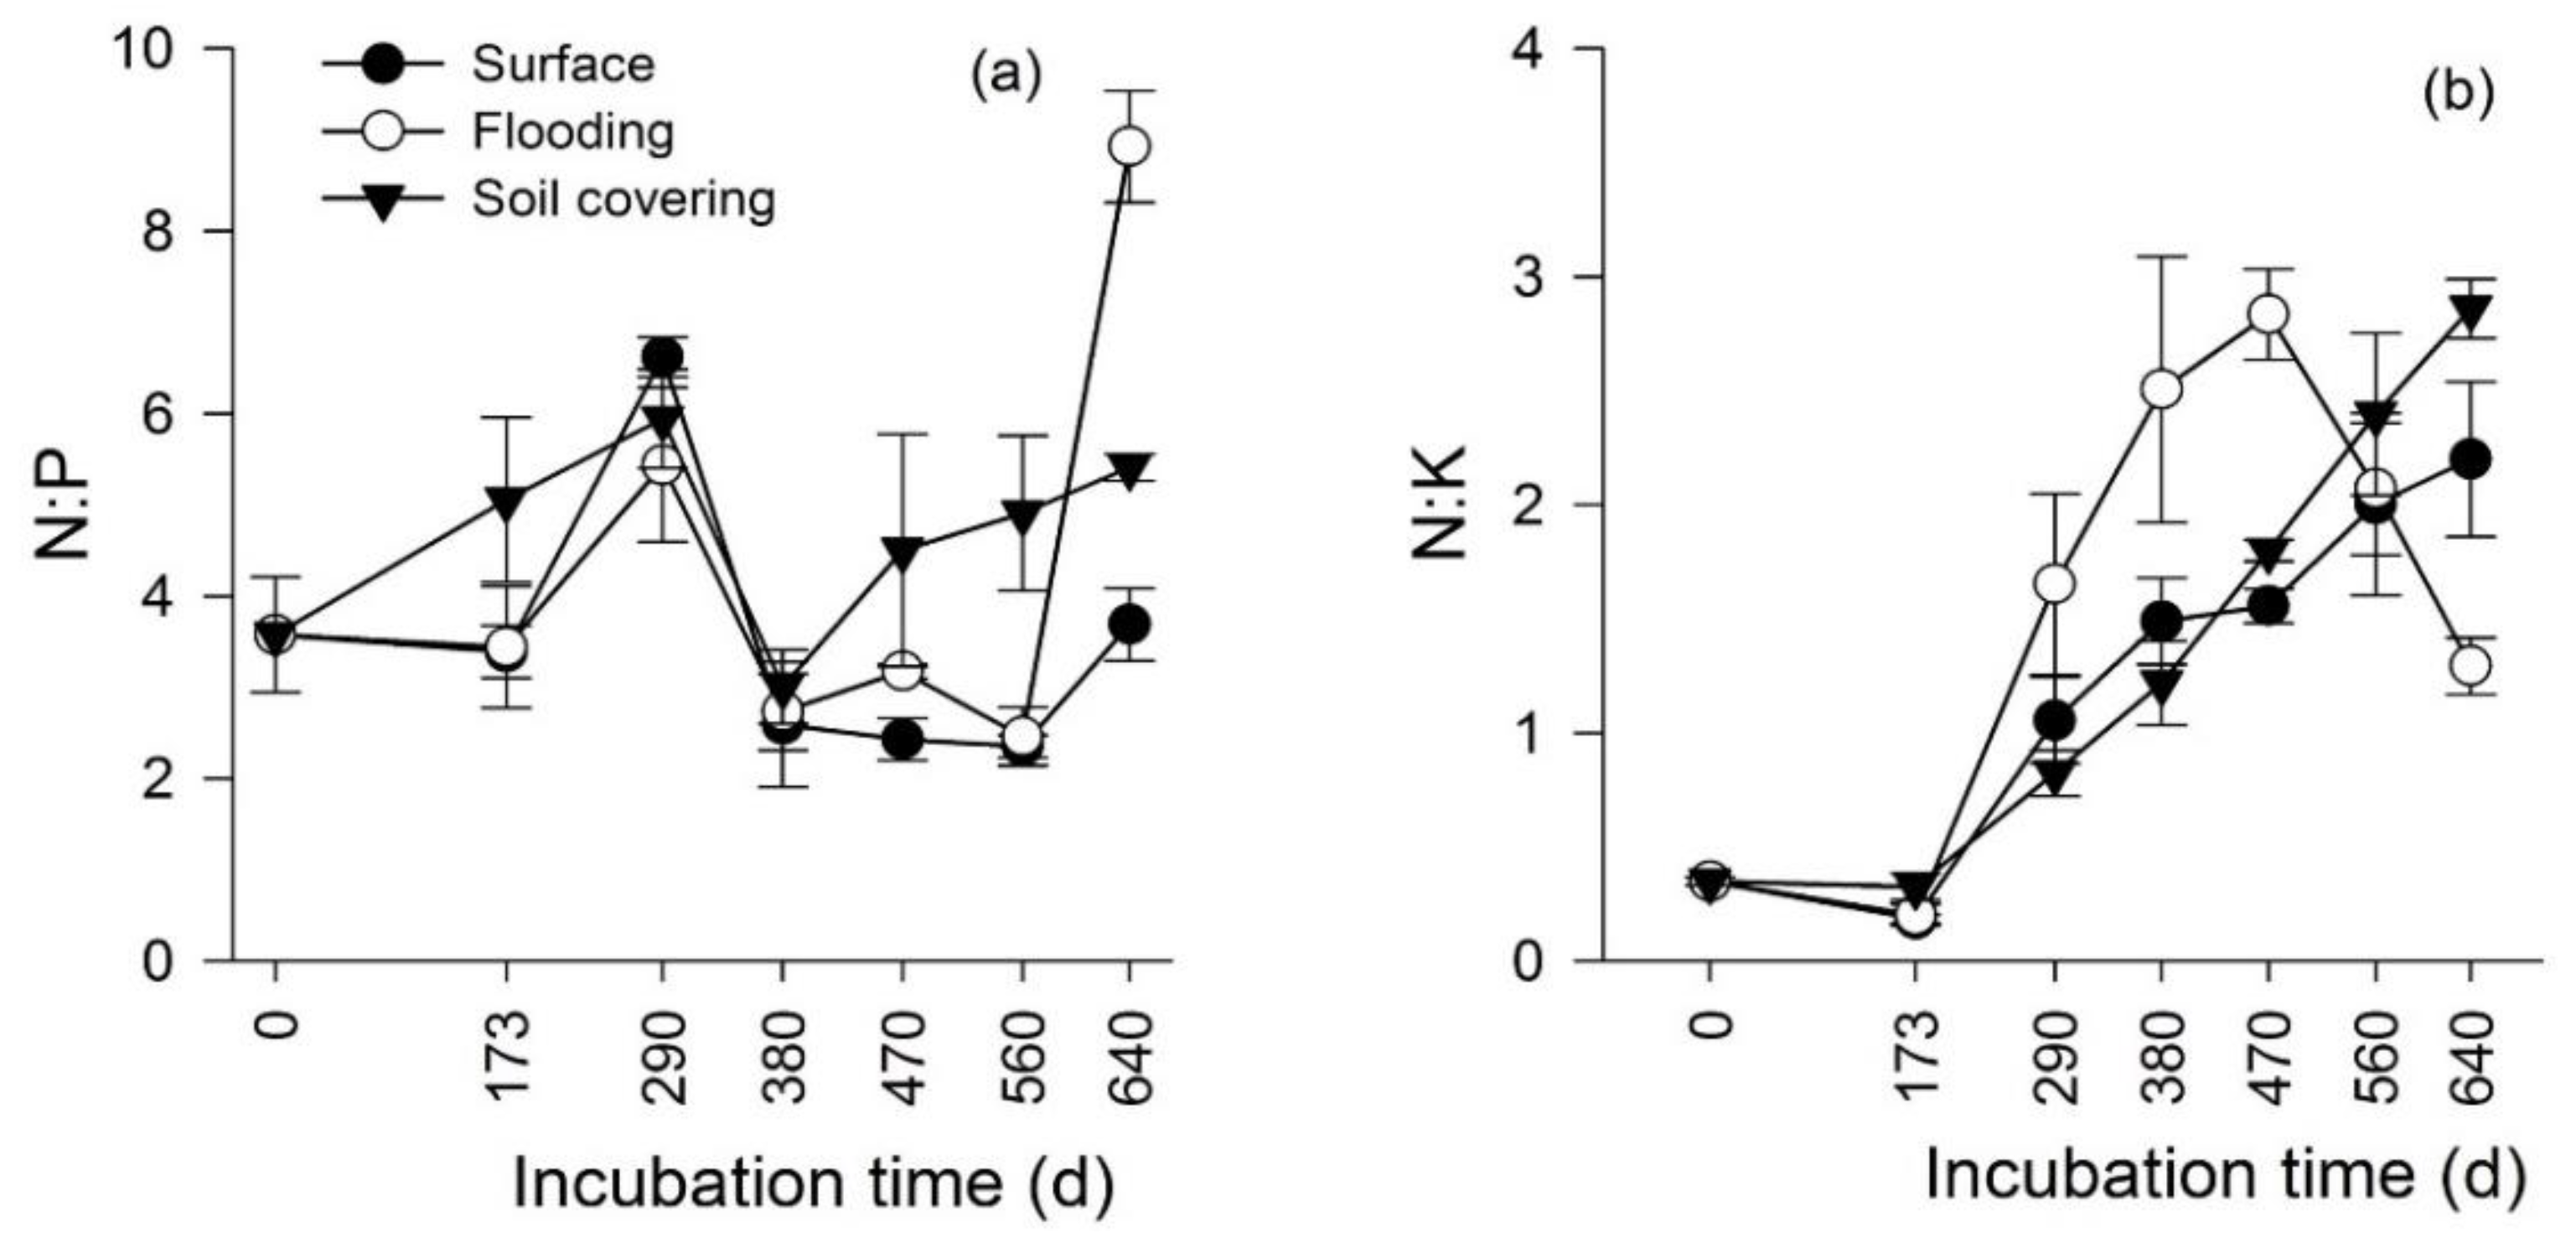
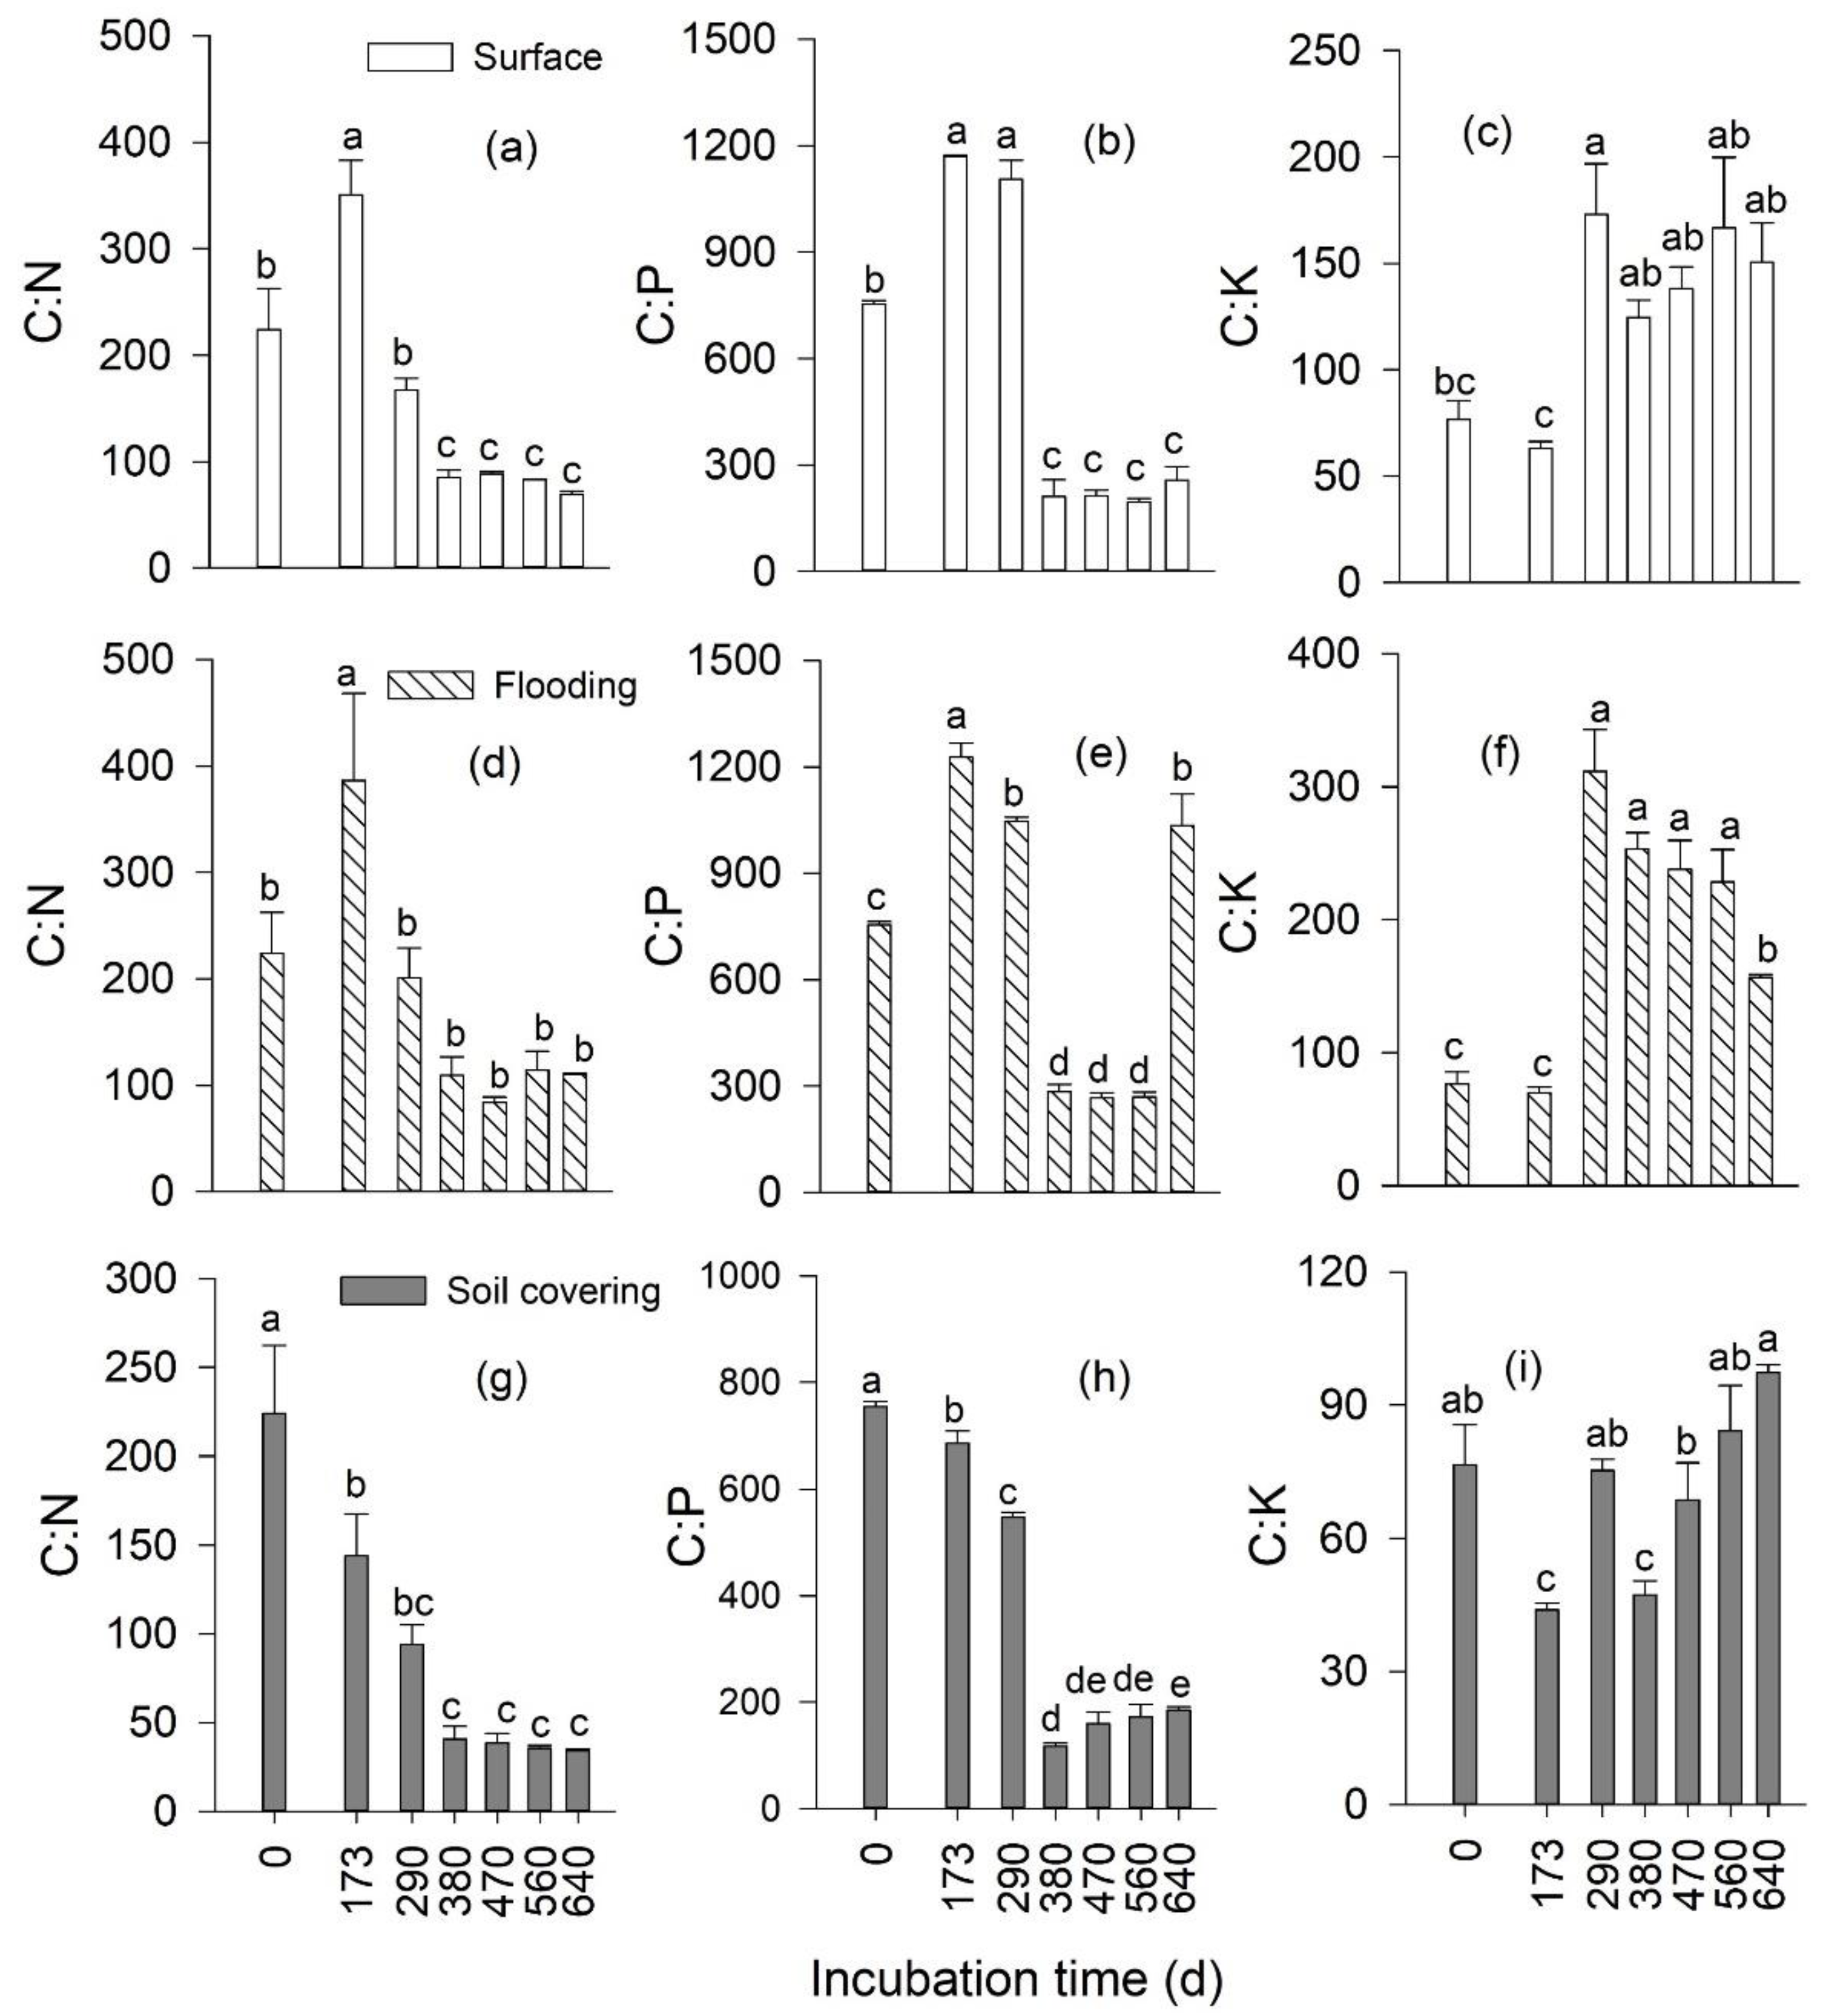
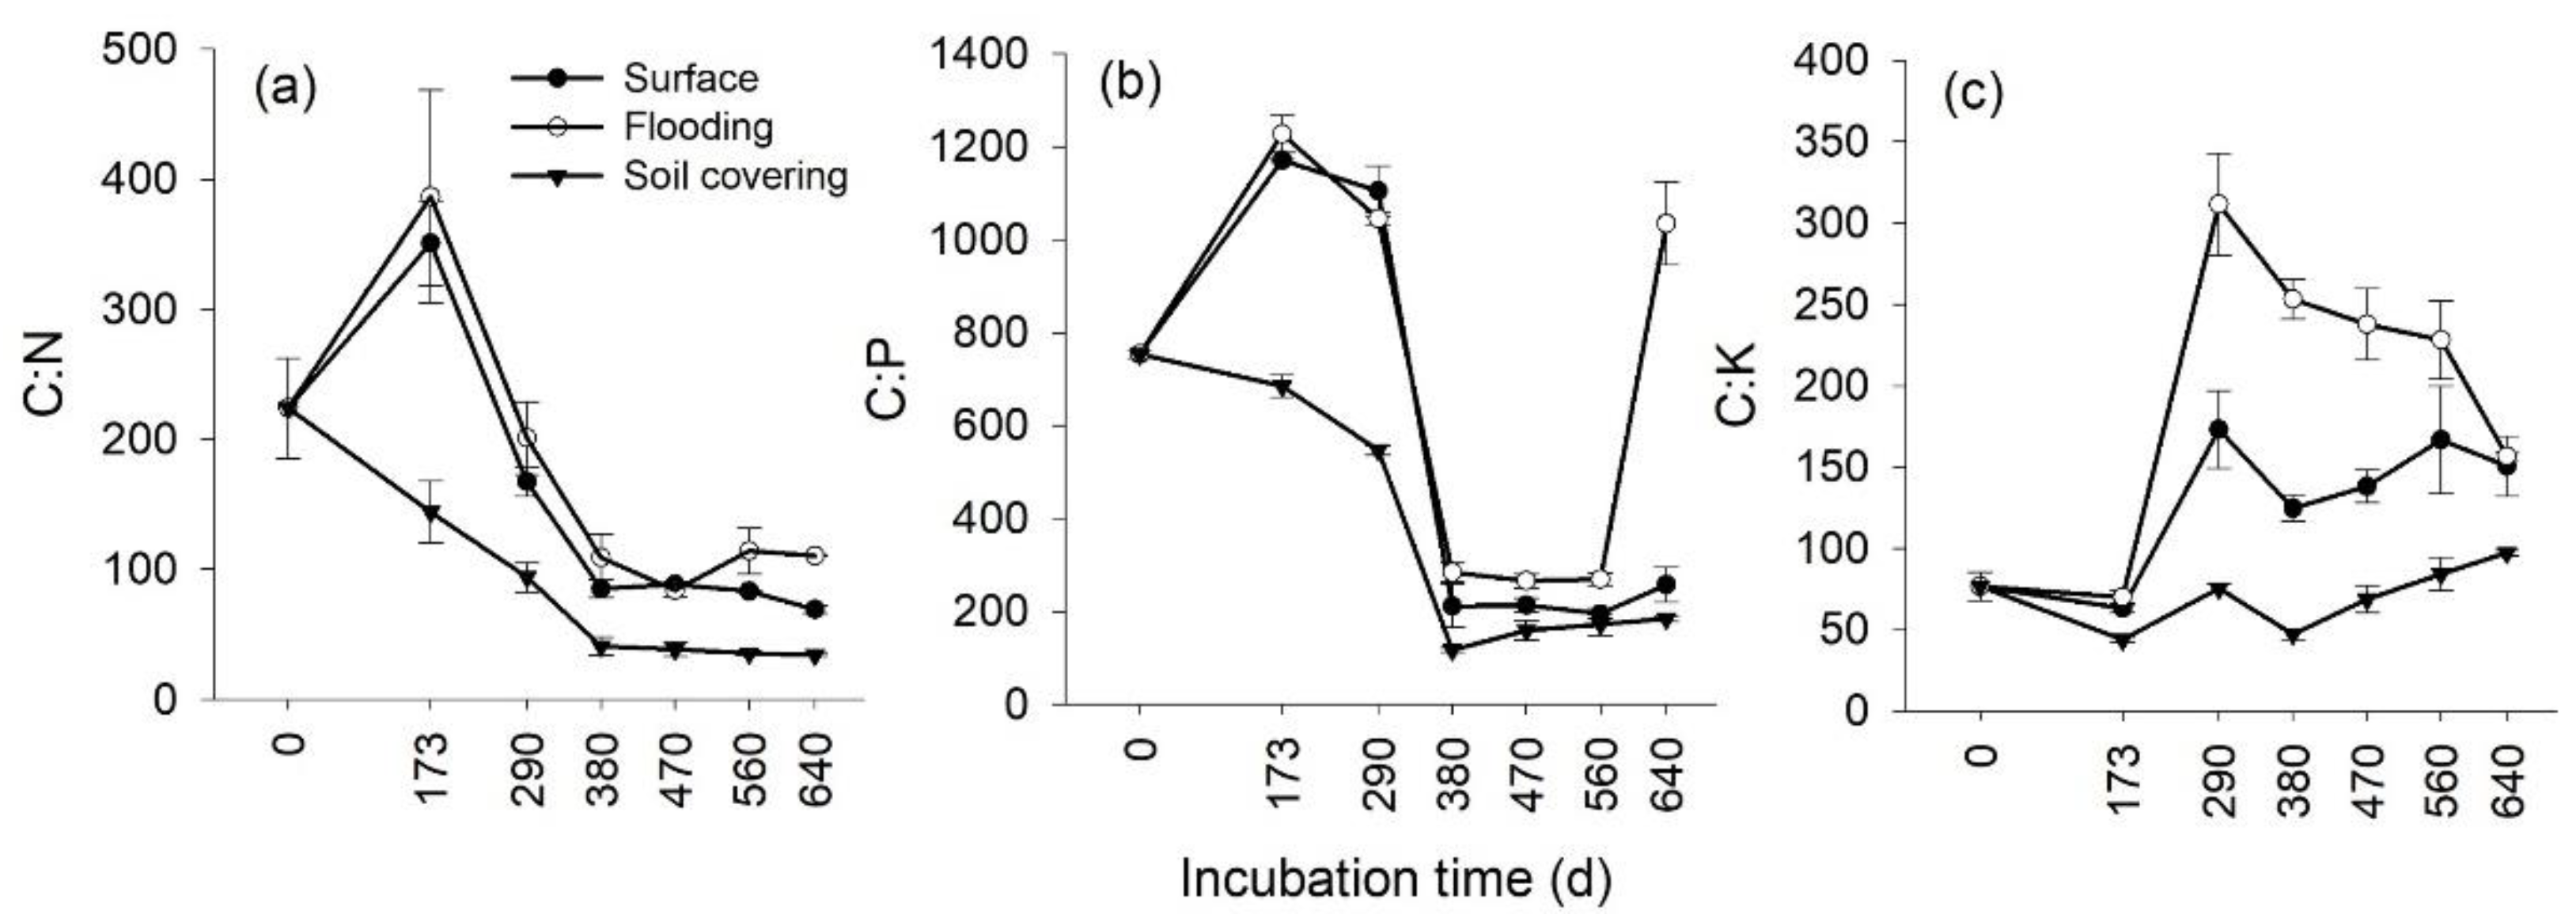
3.3. Temporal Changes in the Stoichiometry of Leaf Litter

Our study revealed diversified stoichiometry of leaf litter among the different treatment. We found statistically significant influences of disturbance type, incubation time and the interaction between two factors on stoichiometry of leaf litter (Table 2). The interaction had influence on the stoichiometry of leaf litter.
Transient flooding and soil covering affect temporal change patterns of leaf litter stoichiometry during decomposition. It showed different change trends in three treatments. The C:N change of leaf litter had various sequential phases with incubation time in different treatments within 640 d (Figure 3a,d,g). In the surface treatment (Figure 3a), the C:N increased obviously within 0–173 d (p < 0.05); secondly, it decreased obviously within 173–380 d (p < 0.05); and thirdly, it remained constant within 380–640 d. In the flooding treatment (Figure 3d), it increased significantly within 0–173 d (p < 0.05), then decreased obviously within 173–290 d (p < 0.05), and remained constant within 290–640 d. In the soil covering treatment (Figure 3g), it decreased significantly within 0–173 d (p < 0.05) and remained constant within 173–640 d, and it was lowest in the three treatments.
The C:P change of leaf litter exhibited various sequential phases with incubation time in different treatments within 640 d (Figure 3b,e,h). In the surface treatment (Figure 3b), it increased significantly within 0–173 d (p < 0.05), remained constant within 173–290 d, decreased significantly within 290–380 d (p < 0.05), and remained constant within 380–640 d. In the flooding treatment (Figure 3e), it increased significantly within 0–173 d (p < 0.05), significantly decreased within 173–380 d (p < 0.05), remained constant within 380–560 d, and increased significantly within 560–640 d (p < 0.05). In the soil covering treatment (Figure 3h), it decreased significantly within 0–380 d (p < 0.05) and remained constant within 380–640 d.
The C:K of leaf litter exhibited various sequential phases with incubation time in different treatments within 640 d (Figure 3c,f,i). In the surface treatment (Figure 3c) and flooding treatment (Figure 3f), similar change trends were found within 0–560 d, specifically it remained constant within 0–173 d, increased significantly within 173–290 d (p < 0.05), and remained constant within 290–560 d. Within 560–640 d, it decreased significantly in the flooding treatment, but not in the soil covering treatment. In the soil covering treatment (Figure 3i), the C:K of leaf litter was lowest in the three treatments, and five sequential phases were identified: it decreased significantly within 0–173 d (p < 0.05), increased significantly within 173–290 d (p < 0.05), decreased significantly within 290–380 d (p < 0.05), increased significantly within 380–470 d (p < 0.05), and remained constant within 470–640 d.
The N:P change of leaf litter had various sequential phases with incubation time in different treatments for the period of 640 d (Figure 4a–c). In the surface treatment and flooding treatment (Figure 4a,b), four sequential phases were found. In the surface treatment, it remained constant within 0–173 d, increased significantly within 173–290 d (p < 0.05), decreased significantly within 290–380 d (p < 0.05); and remained constant within 380–640 d. In the flooding treatment, it remained constant within 0–290 d, decreased significantly within 290–380 d (p < 0.05), remained constant within 380–560 d, and increased significantly within 560–640 d (p < 0.05). In the soil covering treatment (Figure 4c), it remained constant within 0–640 d.
The N:K change of leaf litter had various sequential phases with incubation time in different treatments for the period of 640 d (Figure 4d–f). In the three treatments, three sequential phases were found. Specifically, in the surface treatment (Figure 4d), it remained constant within 0–470 d, increased significantly within 470–560 d (p < 0.05), and remained constant within 560–640 d. In the flooding treatment (Figure 4e), it remained constant within 0–173 d, increased significantly within 173–470 d (p < 0.05), and remained constant within 470–640 d. In the soil covering treatment (Figure 4f), it remained constant within 0–380 d; increased significantly within 380–560 d (p < 0.05), and remained constant within 560–640 d.

3.4. Effects of Transient Flooding and Soil Covering on the Stoichiometry of Leaf Litter

The transient flooding and soil covering disturbances had different influences on the stoichiometry of leaf litter (Figure 8). The sequence of C:N of leaf litter in the three treatments was as follows: flooding > surface > soil covering during decomposition (Figure 8a). The C:P in the soil covering treatment was lower than that in the flooding and surface treatments, and was approximately similar in the flooding and surface treatments (Figure 8b). The sequence of C:K in the three treatments was as follows: flooding > surface > soil covering during decomposition (Figure 8c).
The N:P of leaf litter fluctuated similarly with increasing incubation time in the three treatments (Figure 9). Within 0–380 d, the change of N:P in the three treatments was similar. A difference of N:P change trend occurred within 380–560 d, and the N:P in the soil covering treatment was higher than that in the surface and flooding treatments within 0–560 d, and was highest in the flooding treatment at 640 d (Figure 9a). The N:K of leaf litter fluctuated similarly with increasing incubation time in the surface treatment and soil covering treatment. The N:K of leaf litter in the flooding treatment was higher than that in the surface and soil covering treatments within 173–470 d, but lower than that in the surface and soil covering treatments within 470–640 d (Figure 9b).

4. Discussion

4.1. Effecst of Transient Flooding and Soil Covering on Leaf Litter Mass Loss

In the current study, leaf litter mass loss in the three treatments exhibited two to five sequential phases which were different from a three-phase decay model [41] (Figure 2). This confirmed the first question that the transient flooding and soil covering disturbances have an influence on leaf litter decay during decomposition.
Temperature and moisture constitute the most important controls on litter mass loss [42,43]. In this study, the increment of leaf litter mass loss for a period of incubation time exhibited a change in trend similar to air temperature within 0–560 d, but the trend was reversed within 560–640 d in the three treatments (Figure 10). Further, there was also a similar exponential growth equation between the increment of leaf litter mass loss (y) and mean daily air temperature (Figure 11) within 0–560 d, and R2 of surface, flooding and soil covering treatments were 0.99, 0.92 and 0.85, respectively, indicating that the leaf litter mass change was correlated with air temperature. Moreover, there was no significant difference in leaf litter mass loss at 173 d among the three treatments (Figure 5), indicating that light radiation, flooding, and soil covering may have the same or no effect on decomposition of litter during the period from 0–173 d at low air temperatures (−10 °C < air temperature <10 °C) [38]. At 290 d, a significant difference was found between the surface treatment and the flooding treatment, which means that the transient flooding disturbance experienced by litter has a significant impact on decomposition of litter at high air temperatures (10 °C < air temperature <30 °C) [38]. Therefore, we inferred that temperature affects leaf litter decomposition within 0–560 d incubation time, and temperature has a weak or no effect on leaf litter decomposition after 560 d.
In extremely arid areas, the low and sparse vegetation cover of drylands can create an environment of high solar UV irradiation near ground for litter, and also facilitate soil transport by wind and water [44]. Moreover, the litter can be partially covered and eventually buried by soil. The contribution of photodegradation to over decomposition by direct and indirect effects significantly depended on litter position [45]. In this study, compared to the surface treatment and the flooding treatment, the soil covering treatment interrupted the photodegradation of leaf litter during decay. However, there was a significant difference in leaf litter mass loss rate among the trehree treatments at 290 d, 380 d and 640 d, but no significant difference among the three treatments at 173 d, 470 d and 560 d (Figure 5), indicating that the influence of soil covering disturbances on litters decomposition may exert a limited influence, or the effect of photodegradation on leaf litter decomposition may be slight or insignificant, depending on the length of incubation time.
Litter decay rate is a result of various factors, affecting this process at a specific place and time [46]. The age of the trees from which the litter originated, since tree age may affect leaf litter process, and the mass loss of the litter from young trees was always higher than litter from the mature trees [47]. In this study, P. euphratica leaf litter exhibited substantial mass loss within 173–290 d in the three treatments, but showed substantial mass loss within 0–90 d incubation for oak, willow, and alder litter [3]. The different incubation period of occurrence for substantial mass loss between these two researches may be due to the diverse environment and beginning times of the incubation experiment. In this study, the incubation experiment began in November, while it commenced in March in the other work [3]. In the current study, compared with the surface and soil covering treatments, the leaf litter mass loss rate showed a different change in the flooding treatment within 0–173 d, but showed a similar change within 173–290 d, 290–470, 470–560 and 560–640 d, respectively, in the three treatments (Figure 2). The different changes indicated that leaf litter mass loss was affected by the transient flooding disturbance during decay. Furthermore, the decomposition experiment was initiated on November 11, and it was inferred that both the increased phase and remained constant phase were in the summer of 2016 and 2017, respectively, which means that leaf litter decomposition stopped or was weak after 560 d, even under conditions of high air temperature (Figure 10).
The multiple drivers of decomposition include environment, regional and micro-site scales, litter quality and composition of the decomposer community. In extremely arid areas, the combination of high irradiance, high temperature, and low moisture inhibits microbial community activity. The direct and indirect effects of flooding depend on the length and severity of the flood, which affects soil microbial community composition and soil microbial biomass by affecting soil oxygen concentrations and nutrient availability [48,49,50]. In general, litter decay rate increases when the litter is immersed in water, which is due to increased dissolution and leaching of soluble components, as well as alterations in moisture levels and the composition and activity of decomposers [51]. The longer the flooding lasts, the higher the dissimilarities between pre- and post-flooding soil microbial communities becomes, especially moisture-dependent fungi [52]. In this study, P. euphratica leaf litter mass loss showed different trends during the whole study period, indicating the disturbance may be an important factor for litter decomposition under same stand, same regional environment and same quality of litter conditions. The disturbance may produce a domino effect over a long time through direct and indirect effects to affect the leaf litter decomposition process.
In extremely arid areas, litter and deadwood play crucial roles in forest ecosystems, providing refuge for organisms, preventing erosion, soil aggregate destruction, and microclimate fluctuations. However, a low decomposition rate of litter will lead to accumulation of undecomposed litter on the surface, and then the nutrients in this litter cannot be released into the soil in time. This will, in turn, influence absorption of nutrients for plants during plant growth, and thus affect the amount of litter. In the lower reaches along the main channel of the Tarim River, annual precipitation weakly influenced the decomposition of leaf litter as it is less than 50 mm, and there are fewer than 10 d with precipitation of 0.1–34.7 mm annually, and less than 0.1 mm on other days (Figure 12). Occasional or seasonal water level fluctuations in riparian ecosystems can cause the inundation and stranding of plant litters [53]. Flooding can affect litter mass loss, nutrient release, and the chemical transformation of the remaining organic matter in the litter residues. The long-term inundation of litters can improve cellulose and lignin component decomposition, while the effects of transient inundation are dependent on the timing of immersion and standing [4,29]. In harsh soil substrates, the initial phases of decomposition were delayed and stretched [7]. In this study, that transient flooding disturbance could promote leaf litter decomposition within 0–173 d (Figure 2), but after 640 d incubation, almost 60% mass still remained in the P. euphratica leaf litter. Therefore, if one or more overflow occurs in autumn, and especially overflow in spring of the following year, it may be of more benefit to the leaf litter decomposition for natural P. euphratica forests in the lower reaches along the main channel of the Tarim River.

4.2. Effects of Transient Flooding and Soil Covering on the Stoichiometry of Leaf Litter

Stoichiometric studies have provided new insights into terrestrial nutrient limitation, and the relationships between organism nutrient status and environmental variations at large spatial and temporal scales [17]. Leaf litter C, N, and P stoichiometric ratios can represent different levels of nutrient availability [54]. There was a large variation in C:N, C:P and N:P ratios in the original litters (29–83, 369–2122 and 5–26, respectively), and some variation in the retention or loss of N and P in the early decomposition stages. Litter converged on C:N, C:P and N:P quotients of 30, 450 and 16, when the remaining C fell below 30% [55]. The C:N, C:P, and N:P values of litter were 36.2, 702.6, and 19.2 in evergreen broad-leaved forest in the Ailao Mountains, respectively, and were 57.3, 1175.6, 20.3, and 44.8, 1132.5, and 25.0 in the global forest ecosystem and China’s forest ecosystem, respectively [56]. Most broad-leaved species in China have C:N and C:P of 30–50 and 380–580, respectively [13]. In this research, the initial C:N, C:P, and N:P of P. euphratica leaf litter was 211.52, 757.63, and 3.58, respectively. The initial C:N of P. euphratica leaf litter was higher than that of most broad-leaved species in China [13], which indicates that P. euphratica is possibly as limited for N as indicated by the initial C:N. The stoichiometry of P. euphratica leaf litter changed dynamically within 640 d incubation time in the three treatments, which confirmed the second hypothesis that leaf litter stoichiometry fluctuates with time, and will be affected by transient flooding and soil covering during decay.
Low C/N ratios in leaf litter may be beneficial to litter decomposition [57], and C and N availabilities were affected by soil moisture in soil [58]. In this study, there was different leaf litter mass loss even if they contained a same high initial C:N (211.4) in the three treatments, indicating that the C:N of leaf litter experienced disturbances may change during decomposition. Specifically, the C:N of leaf litter in the soil covering treatment was lowest in the three treatments within 640 d (Figure 6a), which indicates that the soil covering may accelerate the loss of C or increase the N concentration in leaf litter during decomposition. In particular, instead of increasing in the flooding and surface treatments, the C:N of leaf litter in the soil covering treatment decreased within 0–173 d, which means that transient flooding and soil covering exerted a different influence on the C and N in leaf litter within 0–173 d.
A different fluctuating change trend of leaf litter C:P was found in the three treatments within 0–640 d (Figure 6b), indicating that C and P may have a different change rate and direction within 640 d, irrespective of the occurrence of transient flooding disturbance. Furthermore, the C:P in the flooding treatment was highest in the three treatments at 640 d, which shows that transient flooding may accelerate the change rate of C and P or alter the change direction of C and P (i.e., increased C and decreased P, or vice versa) within 560–640 d. Compared with the flooding and surface treatments, the lowest leaf litter C:P in the soil covering treatment at 173 d indicates that the soil covering disturbance may slow down the change rate of C and P within 0–173 d. Therefore, transient flooding and soil covering disturbances may play diverse roles in different stages of leaf litter decomposition.
Compared to the surface treatment, various change phases of leaf litter C:K in the flooding and soil covering treatments indicate that C and K may exhibit a different change rate or change direction in leaf litter due to the disturbances (Figure 6c). The C:K in the flooding treatment was highest in the three treatments, indicating that the transient flooding disturbance may accelerate the K loss or slow the C loss, while the lowest leaf litter C:K in the soil covering treatment indicates that the soil covering disturbance may speed up the C loss or increase the K loss. Moreover, to the best of our knowledge, few assessments of leaf litter C:K for broad-leaved trees have been published.
Leaf litter N:P could reflect the relative restriction of N or P on tree growth [17]. In this research, the N:P fluctuated with incubation time, indicating that N and P had different change rates or change direction in the three treatments. Except in 173–290 d and 290–380 d, the N:P exhibited various change trends in the three treatments within 640 d, suggesting that the N and P change rates were affected by the disturbances of transient flooding and soil covering. The N:P of litter increased during decomposition through the process of humification [19], but the N:P fluctuated throughout the process of decomposition in the present study. The fluctuating N:P may be attributable to the N and P becoming mineralized via different pathways or at dissimilar rates. Regarding the N:K of leaf litter, various phases with incubation times in different treatments indicate that the transient flooding and soil covering disturbances exerted a different effect on the decomposition of N and K in the leaf litter. To the best of our knowledge, few investigations of leaf litter N:K for broad-leaved trees have been performed. Our study expands on site-specific investigations of leaf litter nutrient stoichiometric ratios, and provides more robust data on leaf litter stoichiometric ratios in broad-leaved forests.
In general, flooding has been considered a key element for the development and maintenance of riparian systems. Flooding results in rapid changes in soil conditions, and can cause the loss of existing biomass, reductions in soil nutrient availability, reduced mineralization and decomposition of dead organic material, limitation of soil gas diffusion, and inhibition of oxygen uptake in soil [49]. The flow regime of many rivers worldwide is significantly affected by management, damming and climate change [59], and flooding regime alterations may result in legacy effects on litter decomposition via several direct and indirect pathways [28]. The Polygonum pensylvanicum litter decomposition rate was the lowest in the strong or medium flooding conditions, and the highest under weak flooding conditions in playa wetlands [60]. In the lower reaches along the main channel of the Tarim River, most desert riparian P. euphratica forest has only been subject to disturbances by transient flooding after the year 2000. However, some P. euphratica forests that had grown near the river course can also suffer from prolonged flooding, and this prolonged flooding may have different influences on leaf litter decomposition. The effects of flooding pulse size and frequency on the desert riparian P. euphratica forest litter decomposition are currently unknown. Consequently, the influence of flooding disturbances on the leaf litter decomposition process requires further study.
Nutrient loss due to litter decomposition is a key process controlling the availability of nutrients in ecosystems. Changes in N and P and loss of C cause the C:N and C:P quotients of litters to converge over time until a critical value is reached, and the net loss of N or P of litter begins [53]. In this study, the stoichiometric ratio of C:N, C:K and C:P of leaf litter varied over time in the three treatments, indicating that the critical value of C:N and C:P quotients of leaf litters changed under different disturbances for the same leaf litter. The changed critical value of leaf litters is important to promote the cycle of these nutrients in P. euphratica forests in the lower reaches of the Tarim River. This study provided the stoichiometric characteristics of leaf litter and its dynamic change over 640 d incubation time under disturbances during decomposition, which can help in understanding leaf litter nutrient decomposition patterns and their potential responses to environment changes in desert riparian in arid areas.

5. Conclusions

Litter decay represents a complex process with conspicuously different release rates of various nutrients, and plays a critical role in carbon and nutrient cycling in terrestrial and aquatic ecosystems. P. euphratica Oliv., as a predominant species in desert riparian forest ecosystems, is found in the arid and semi-arid deserts of Mid-Asia. The objectives of this research were to identify responses of leaf litter mass and stoichiometry to disturbances. The change of leaf litter mass loss and stoichiometry (C:N, C:K, C:P, N:P, and N:K) of P. euphratica leaf litter under the disturbances of transient flooding and soil covering was studied for a period of 640 d in a field litterbag decay experiment located in a desert riparian forest. The leaf litter mass loss and stoichiometry exhibited various fluctuations with time and different responses to the disturbances of transient flooding and soil covering treatment. The results demonstrate that transient flooding and soil covering had a diverse influence on leaf litter mass loss and nutrient release/fixation in P. euphratica leaf litter over time during decomposition, and the influence correlated with incubation time. Therefore, we recommend enhancing flooding disturbance to natural P. euphratica forest to improve leaf litter decomposition in order to promote the release of nutrients from leaf litter into soil or to be used by microorganisms in arid region.

Author Contributions

Conceptualization, Y.Y.; Writing-original draft, Y.Y.; Writing—reviewing: H.Z. and Z.Y.; Methodology, W.W.; Investigation, C.Z. and D.C. All authors have read and agreed to the published version of the manuscript.

Funding

This research was funded by National Natural Science Foundation of China, Grant/Award Number: U1803101, the Science and Technology Planning Project of Xinjiang Production and Construction Corps, Grant number: 2020JS016, the Chinese Academy of Sciences ‘Light of West China’ Program, Grant Number: 2019-XBQNXZ-A-009, and the Special Project for the Construction of Innovation Environment (Talent and Base) in the Autonomous region in 2020 (Tianshan Cedar Plan),Grand number: 2020XS11.

Data Availability Statement

The data in this study can be obtained by contacting the author by email.

Acknowledgments

We are grateful to Jake Carpenter, who provided language assistance.

Conflicts of Interest

The authors declare no conflict of interest.

References

  1. Magin, A.H.; Aber, J.D. Dissolved organic carbon and nitrogen relationships in forest litter as affected by nitrogen deposition. Soil Biol. Biochem. 2000, 32, 603–613. [Google Scholar]
  2. Freschet, G.T.; Weedon, J.T.; Aerts, R.; Van Hal, J.R.; Cornelissen, J.H.C. Interspecific differences in wood decay rates: Insights from a new short-term method to study long-term wood decomposition. J. Ecol. 2012, 100, 161–170. [Google Scholar] [CrossRef]
  3. Angst, Š.; Harantová, L.; Baldrian, P.; Angst, G.; Cajthaml, T.; Straková; Blahut, J.; Veselá; Frouz, J. Tree species identity alters decomposition of understory litter and associated microbial communities: A case study. Biol. Fert. Soils 2019, 55, 525–538. [Google Scholar] [CrossRef] [Green Version]
  4. Hobbie, B.; Hoorens, H.; Kurokawa, N.; Péreze Harguindeguy, H.M.; Quested, L.S.; Santiago, D.A.; Wardle, I.J.; Wright, R.; Aerts, S.D.; Allison, P.; et al. Plant species traits are the predominant control on litter decomposition rates within biomes worldwide. Ecol. Lett. 2008, 11, 1065–1071. [Google Scholar]
  5. Petraglia, A.; Cacciatori, C.; Chelli, S.; Fenu, G.; Calderisi, G.; Gargano, D.; Abeli, T.; Orsenigo, S.; Carbognani, M. Litter decomposition: Effects of temperature driven by soil moisture and vegetation type. Plant Soil 2019, 435, 187–200. [Google Scholar] [CrossRef]
  6. Zhong, Y.Q.W.; Yan, W.M.; Wang, R.W.; Shangguan, Z.P. Differential responses of litter decomposition to nutrient addition and soil water availability with long-term vegetation recovery. Biol. Fertile Soils 2017, 53, 939–949. [Google Scholar] [CrossRef]
  7. Horodecki, P.; Jagodziński, A.M. Tree species effects on litter decomposition in pure stands on afforested post-mining sites. For. Ecolo. Manag. 2017, 406, 1–11. [Google Scholar] [CrossRef]
  8. Purahong, W.; Krüger, D.; Buscot, F.; Wubet, T. Correlations between the composition of modular fungal communities and litter decomposition-associated ecosystem functions. Fungal Ecol. 2016, 22, 106–114. [Google Scholar] [CrossRef]
  9. Zhang, T.A.; Luo, Y.Q.; Chen, H.Y.H.; Ruan, H.H. Responses of litter decomposition and nutrient release to N addition: A meta-analysis of terrestrial ecosystems. Appl. Soil Ecol. 2018, 128, 35–42. [Google Scholar] [CrossRef]
  10. Li, S.; Liu, W.Y.; Li, D.W.; Li, Z.X.; Song, L.; Chen, K.; Yun, F. Slower rates of litter decomposition of dominant epiphytes in the canopy than on the forest floor in a subtropical montane forest, southwest China. Soil Biol. Biochem. 2014, 70, 211–220. [Google Scholar] [CrossRef]
  11. Alhamd, L.; Arakaki, S.; Hagihara, A. Decomposition of leaf litter of four tree species in a subtropical evergreen broad-leaved forest, Okinawa Island, Japan. For. Ecol. Manag. 2004, 202, 1–11. [Google Scholar] [CrossRef]
  12. Hobbie, S.E.; Reich, P.B.; Oleksyn, J.; Ogdahl, M.; Żytkowiak, R.; Hale, C.; Karolewski, P. Tree species effects on decomposition and forest floor dynamics in a common garden. Ecology 2006, 87, 2288–2297. [Google Scholar] [CrossRef]
  13. Thomas, K.; Jijeesh, C.M.; Seethalakshmi, K.K. Litter production, decomposition and nutrient mineralization dynamics of Ochlandra setigera: A rare bamboo species of Nilgiri Biospher Reserve, India. J. For. Res. 2014, 25, 579–584. [Google Scholar] [CrossRef]
  14. Ge, J.L.; Xie, Z.Q. Leaf litter carbon, nitrogen, and phosphorus stoichiometric patterns as related to climatic factors and leaf habits across Chinese broad-leaved tree species. Plant Ecol. 2017, 218, 1063–1076. [Google Scholar] [CrossRef]
  15. Berg, B.; Liu, C.J.; Laskowski, R.; Davey, M. Relationships between nitrogen, acid-unhydrolyzable residue, and climate among tree foliar litters. Can. J. For. Res. 2013, 43, 103–107. [Google Scholar] [CrossRef]
  16. Erickson, H.E.; Helmer, E.; Brandeis, T.J.; Lugo, A.E. Controls on fallen leaf chemistry and forest floor element masses in native and novel forests across a tropical island. Ecosphere 2014, 5, 1–28. [Google Scholar] [CrossRef] [Green Version]
  17. Zechmeister-Boltenstern, S.; Keiblinger, K.M.; Mooshammer, M.; Peñuelas, J.; Richter, A.; Sardans, J.; Wanek, W. The application of ecological stoichiometry to plant-microbial-soil organic matter transformations. Ecol. Monogr. 2015, 85, 133–155. [Google Scholar] [CrossRef] [Green Version]
  18. Khan, K.S.; Joergensen, R.G. Stoichiometry of the soil microbial biomass in response to amendments with varying C/N/P/S ratios. Biol. Fertile Soils 2019, 55, 265–274. [Google Scholar] [CrossRef]
  19. Marklein, A.R.; Winbourne, J.B.; Enders, S.K.; Gonzalez, D.J.; Huysen, T.V.; Izquierdo, J.G.; Light, D.R.; Carolina, M.R.; Antonio, B.M. Leaf chemistry of woody species in the Brazilian cerrado and seasonal forest: Response to soil and taxonomy and effects on decomposition rates. Plant Ecol. 2016, 217, 1467–1479. [Google Scholar]
  20. Ren, C.J.; Chen, J.; Deng, J.; Zhao, F.Z.; Han, X.H.; Yang, G.H.; Tong, X.G.; Feng, Y.Z.; Shelton, S.; Ren, G.X. Response of microbial diversity to C:N:P stoichiometry in fine root and microbial biomass following afforestation. Biol. Fert. Soils 2017, 53, 457–468. [Google Scholar] [CrossRef]
  21. Ling, H.B.; Zhang, P.; Xu, H.L.; Zhao, X.F. How to regenerate and protect desert riparian Populus euphratica forest in arid areas. Sci. Rep. 2015, 5, 15418. [Google Scholar] [CrossRef] [PubMed] [Green Version]
  22. Rajput, V.D.; Tatiana, M.; Chen, Y.N.; Svetlana, S.; Victor, A.C.; Saglara, M. A review on salinity adaptation mechanism and characteristics of Populus euphratica, a boon for arid ecosystems. Acta Ecol. Sin. 2016, 36, 497–503. [Google Scholar] [CrossRef]
  23. Corenblit, D.; Steiger, J.; Gurnell, A.M.; Naiman, R.J. Plants intertwine fluvial landform dynamics with ecological succession and natural selection: A niche construction perspective for riparian systems. Glob. Ecol. Biogeogr. 2009, 18, 507–520. [Google Scholar] [CrossRef]
  24. Stromberg, J.C.; Tluczek, M.G.F.; Hazelton, A.F.; Hoori, A. A century of riparian forest expansion following extreme disturbance: Spatiotemporal change in Populus/Salix/Tamarix forests along the Upper San Pedro River, Arizona, USA. For. Ecol. Manag. 2010, 259, 1181–1189. [Google Scholar] [CrossRef]
  25. Yang, Y.H.; Chen, Y.N.; Li, W.H.; Zhu, C.G.; Waqas, M. Inoculation of Funneliformis mosseae to enhance desiccation tolerance of Populus euphratica seedling in Hyper-arid region. Int. J. Agric. Biol. 2017, 19, 983–991. [Google Scholar] [CrossRef]
  26. Wang, S.J. The Status, Conservation and Recovery of Global Resources of Populus euphratica. World For. Res. 1996, 6, 37–44. [Google Scholar]
  27. Chen, Y.J.; Li, W.H.; Liu, J.Z.; Yang, Y.H. Effects of water conveyance embankments on riparian forest communities at the middle reaches of the Tarim River. Ecohydrology 2013, 6, 937–948. [Google Scholar] [CrossRef]
  28. Langhans, S.D.; Tockner, K. The role of timing, duration, and frequency of inundation in controlling leaf litter decomposition in a river-floodplain ecosystem (Tagliamento, northeastern Italy). Oecologia 2006, 147, 501–509. [Google Scholar] [CrossRef]
  29. Li, C.D.; Li, X.Y.; Sun, H.J.; Li, L.; Lin, L.S. Decomposition characteristics of Karelinia caspia, Alhagi sparsifolia and Populus euphratica leaves in extremely arid areas. J. Desert Res. 2019, 39, 193–201. [Google Scholar]
  30. Almagro, M.; Martínez-López, J.; Maestre, F.T.; Rey, A. The contribution of photodegradation to litter decomposition in semiarid Mediterranean grasslands depends on its interaction with local humidity conditions, litter quality and position. Ecosystems 2017, 20, 527–542. [Google Scholar] [CrossRef]
  31. Johnson, D.; Campbell, C.D.; Lee, J.A.; Callaghan, T.V. Arctic microorganisms respond more to elevated UV-B radiation than CO2. Nature 2002, 416, 82–83. [Google Scholar] [CrossRef] [PubMed]
  32. Austin, A.T.; Vivanco, L. Plant litter decomposition in a semi-arid ecosystem controlled by photodegradation. Nature 2006, 442, 555–558. [Google Scholar] [CrossRef] [PubMed]
  33. Uselman, S.M.; Snyder, K.A.; Blank, R.R.; Jones, T.J. UVB exposure does not accelerate rates of litter decomposition in a semi-arid riparian ecosystem. Soil Biol. Biochem. 2011, 43, 1254–1265. [Google Scholar] [CrossRef]
  34. Barnes, P.W.; Throop, H.L.; Hewins, D.B.; Abbene, M.L.; Archer, S.R. Soil coverage reduces photodegradation and promotes the development of soil-microbial films on dryland leaf litter. Ecosystems 2012, 15, 311–321. [Google Scholar] [CrossRef]
  35. Han, L.; Xi, L.Q.; Wang, J.Q.; Wang, H.Z.; Yu, Z.R. Life history characteristics and spatial distribution of Populus pruinosa population at the upper reaches of Tarim River. Acta Ecol. Sin. 2013, 33, 6181–6190. [Google Scholar] [CrossRef]
  36. Liu, G.F.; Cornwell, W.K.; Pan, X.; Ye, D.; Liu, F.H.; Huang, Z.Y.; Dong, M.; Cornelissen, J.H.C. Decomposition of 51 semidesert species from wide-ranging phylogeny is faster in standing and sand-buried than in surface leaf litters: Implications for carbon and nutrient dynamics. Plant Soil 2015, 396, 175–187. [Google Scholar] [CrossRef]
  37. Xu, Y. Effects of different temperatures and different times on the drying quality of herbaceous plants. Bot. Res. 2016, 5, 125–131. [Google Scholar]
  38. Yang, Y.H.; Zhou, H.H.; Ye, Z.X.; Li, W.H.; Zhu, C.G.; Chen, Y.N. Effects of transient flooding on leaf litter decomposition: A case study of Populus euphratica leaf in an arid area. Int. J. Agric. Biol. 2019, 21, 1385–1392. [Google Scholar]
  39. Lu, R.K. Analytical Methods for Soil and Agrochemistry; Agricultural Science Technology Press: Beijing, China, 2000. [Google Scholar]
  40. Wieder, R.K.; Lang, G.E. A critique of the analytical methods used in examining decomposition data obtained from litter bags. Ecology 1982, 63, 1636–1642. [Google Scholar] [CrossRef] [Green Version]
  41. Berg, B. Litter decomposition and organic matter turnover in northern forest soils. For. Ecol. Manag. 2000, 133, 13–22. [Google Scholar] [CrossRef]
  42. Sun, Z.G.; Mou, X.J.; Liu, J.S. Effects of flooding regimes on the decomposition and nutrient dynamics of Calamagrostis angustifolia litter in the Sanjiang Plain of China. Environ. Earth Sci. 2012, 66, 2235–2246. [Google Scholar] [CrossRef] [Green Version]
  43. Cusack, D.F.; Chou, W.W.; Yang, W.; Harmon, M.E.; Silver, W.L. Controls on long-term root and leaf litter decomposition in neotropical forests. Glob. Ecol. Biogeogr. 2009, 15, 1339–1355. [Google Scholar] [CrossRef]
  44. Okin, G.S.; Parsons, A.J.; Wainwright, J.; Herrick, J.E.; Bestelmeyer, B.T.; Peters, D.C.; Fredrickson, E.L. Do changes in connectivity explain desertification? Bioscience 2009, 59, 237–244. [Google Scholar] [CrossRef]
  45. Yang, L.; Jennifer, Y.K. Effects of UV exposure and litter position on decomposition in a Californian grassland. Ecosystems 2014, 17, 158–168. [Google Scholar]
  46. Bocock, K.L.; Gilbert, O.J.W. The disappearance of leaf litter under different woodland conditions. Plant Soil 1957, 9, 179–185. [Google Scholar] [CrossRef]
  47. Trap, J.; Akpa-Vinceslas, M.; Margerie, P.; Boudsocq, S.; Richard, F.; Decaens, T.; Aubert, M. Slow decompostion of leaf litter from mature Fagussylvatica trees promotes offspring nitrogen acquisition by interacting with ectomycorrhizal fungi. J. Ecol. 2017, 105, 528–539. [Google Scholar] [CrossRef]
  48. Barnard, R.L.; Osborne, C.A.; Firestone, M.K. Changing precipitation pattern alters soil microbial community response to wet-up under a Mediterranean-type climate. ISME J. 2015, 9, 946–957. [Google Scholar] [CrossRef] [Green Version]
  49. Daniela, W.; Nico, E.; Simone, C. Plant species richness does not attenuate responses of soil microbial and nematode communities to a flood event. Soil Biol. Biochem. 2015, 89, 135–149. [Google Scholar]
  50. Judith Sarneel, J.M.; Ciska Veen, G.F. Legacy effects of altered flooding regimes on decomposition in a boreal floodplain. Plant Soil 2017, 421, 57–66. [Google Scholar] [CrossRef] [Green Version]
  51. Zheng, J.Q.; Wang, Y.Z.; Chen, C.R.; Jiang, Q.; Han, S.J.; Xu, Z.H. Effects of inundation and stranding on leaf decomposition and chemical transformation. Aquat. Sci. 2018, 80, 9. [Google Scholar] [CrossRef]
  52. Oliver, R.; Nadine, G.; Derek, P.; Martin, K.; Mortize, M.; Jens, B.; Dominik, B. Flooding duration affects the structure of terrestrial and aquatic microbial Eukaryotic communities. Microb. Ecol. 2018, 75, 875–887. [Google Scholar]
  53. Lewis, W.M.; Hamilton, S.K.; Rodrgiuez, M.A.M.; Sauders, J.F. Ecological determinism on the Orinoco floodplain. Bioscience 2000, 50, 681. [Google Scholar] [CrossRef] [Green Version]
  54. Lu, Z.Y.; Song, L.; Wang, X.; Li, Y.W.; Zhang, Y.P.; Sha, L.Q. Ecological stoichiometry characteristics of the litterfall-humus-soil continuum systems under different successional stages of the subtropical forest in SW China. Mt. Res. 2017, 35, 274–282, (In Chinese with English abstract). [Google Scholar]
  55. Moore, T.R.; Trofymow, J.A.; Prescott, C.E.; Fyles, J.; Titus, B.D.; CIDET Working Group. Patterns of carbon, nitrogen and phosphorus dynamics in decomposing foliar litter in Canadian forests. Ecosystems 2006, 9, 46–62. [Google Scholar] [CrossRef]
  56. Limpens, J.; Berendse, F. How litter quality affects mass loss and N loss from decomposing Sphagnum. Oikos 2003, 103, 537–547. [Google Scholar] [CrossRef]
  57. Hirabayashi, Y.; Mahendran, R.; Koirala, S.; Konoshima, L.; Yamazaki, D.; Watanabe, S.; Kim, H.; Kanae, S. Global flood risk under climate change. Nat. Clim. Chang. 2013, 3, 816–821. [Google Scholar] [CrossRef]
  58. Ladwig, L.M.; Sinsabaugh, R.L.; Collins, S.L.; Thomey, M.L. Soil enzyme responses to varying rainfall regimes in Chihuahuan desert soils. Ecosphere 2015, 6, 1–10. [Google Scholar] [CrossRef]
  59. Nilsson, C.; Reidy, C.A.; Dynesius, M.; Revenga, C. Fragmentation and flow regulation of the world’s large river systems. Science 2005, 30, 405–408. [Google Scholar] [CrossRef] [PubMed] [Green Version]
  60. Anderson, J.T.; Smith, L.M. The effects of flooding regimes on decomposition of Polygonum pensylvanicum in playa wetlands (Southern Great Plains, USA). Aquat. Bot. 2002, 74, 97–108. [Google Scholar] [CrossRef]
Figure 1. Sketches of the Tarim River and experiment treatments.
Forests 13 00476 g001
Figure 2. Changes of rate of leaf litter mass loss (a) and percent of original mass remaining (b) over incubation time. Within each graph, histograms with the same letter indicate that the value was not significantly different (p < 0.05). Surface: litterbags placed on the ground (no disturbance); flooding: litterbags fixed on the ground and immersed in water for 5 h; soil covering: litterbags covered with soil. Vertical bars indicate the standard error of the mean (n = 3).
Forests 13 00476 g002
Figure 3. Dynamic of leaf litter C, N, P, and K stoichiometry over incubation time in three treatments. Within each graph, histograms with the same letter indicate that the value was not significantly different (p < 0.05). Surface: litterbags placed on the ground; flooding: litterbags fixed on the ground and immersed in water for 5 h; soil covering: litterbags covered with soil. Vertical bars denote the standard error of the mean (n = 3); (ac): Surface treatment; (df): Flooding treatment; (gi): Soil covering treatment.
Forests 13 00476 g003
Figure 4. Dynamic variations of N:P ratio and N:K ratio with incubation time in three treatments. Within each graph, lines with the same letter indicate that the value was not significantly different (p < 0.05). Surface: litterbags placed on the ground (a,d); flooding: litterbags fixed on the ground and immersed in water for 5 h (b,e); soil covering: litterbags covered with soil (c,f). Vertical bars denote the standard error of the mean (n = 3).
Forests 13 00476 g004
Figure 5. Dynamic variations in rate of leaf litter mass loss and percentage of original mass remaining in three treatments during incubation. Difference letters denote significant differences among treatments at the same incubation time at p < 0.05. Surface: litterbags placed on the ground; flooding: litterbags fixed on the ground and immersed in water for 5 h; soil covering: litterbags covered with soil. Vertical bars denote the standard error of the mean (n = 3).
Forests 13 00476 g005
Figure 6. Exponential decay equation between the remaining mass of leaf litter (y) and incubation time (x) in the three treatments.
Forests 13 00476 g006
Figure 7. Decay rate of leaf litter obtained from the decay equation of leaf litter in the three treatments.
Forests 13 00476 g007
Figure 8. Dynamic variations of C:N (a), C:P (b), and C:K (c) ratio with incubation time in three treatments. Surface: litterbags placed on the ground; flooding: litterbags fixed on the ground and immersed in water for 5 h; soil covering: litterbags covered with soil. Vertical bars denote the standard error of the mean (n = 3).
Forests 13 00476 g008
Figure 9. Dynamic variation of N:P (a) and N:K (b) ratios with incubation time in three treatments. Surface: litterbags placed on the ground; flooding: litterbags fixed on the ground and immersed in water for 5 h; soil covering: litterbags covered with soil. Vertical bars denote the standard error of the mean (n = 3).
Forests 13 00476 g009
Figure 10. Increment of leaf litter mass loss and mean temperature within various incubation periods. Vertical bars denote standard deviation of mean daily temperature, the others vertical bars denote standard error of increment of leaf litter mass loss. Day 0–173: from 11 November 2015 to 29 April 2016; 173–290: from 29 April 2016 to 23 August 2016; 290–380: from 23 August 2016 to 23 November 2016; 380–470: from 23 November 2016 to 25 February 2017; 470–560: from 25 February 2017 to 25 May 2017; 560–640: from 25 May 2017 to 6 August 2017.
Forests 13 00476 g010
Figure 11. Relationship between increment of leaf litter mass loss and daily mean temperature within 0–560 d incubation. Vertical bars denote standard error.
Forests 13 00476 g011
Figure 12. Precipitation days in different years in study area.
Forests 13 00476 g012
Table 1. Effect of disturbance type (DT), incubation time (IT) and their interactions (DT × IT) on leaf litter mass loss (%) as a result of two-way analysis of variance. DF—freedom degree.
ParameterSourceDFSum of SquaresF RatioSig.
Leaf litter mass loss (%)DT2107.6515.886<0.0001
IT58591.536187.907<0.0001
DTxIT10140.0421.5310.168
Table 2. Effect of disturbance type (DT), incubation time (IT) and their interactions (DT × IT) on leaf litter stoichiometry as a result of two-way analysis of variance. DF—freedom degree.
ParameterSourceDFSum of SquaresF RatioSig.
C:NDT287,710.16821.1330.000
IT6433,920.53334.8490.000
DTxIT1262,589.6022.5140.014
C:PDT21,104,381.04276.3720.000
IT66,675,927.884556.8850.000
DTxIT121,400,480.98458.4120.000
C:KDT2151,570.791109.8380.000
IT6112,204.40927.1030.000
DTxIT1280,105.0349.6750.000
N:PDT213.6646.5590.003
IT6100.13616.0220.000
DTxIT1263.9575.1170.000
N:KDT22.0136.2010.004
IT639.76940.8340.000
DTxIT1210.1235.1970.000
In the surface and soil covering treatments, it remained constant in three phases, 0–173 d, 290–470 d, and 560–640 d, and increased significantly (p < 0.05) within 173–290 d and 470–560 d. In the flooding treatment, it increased significantly within 0–173 d, 173–290 d, and 470–560 d (p < 0.05), and remained constant within 290–470 d and 560–640 d, respectively.
Publisher’s Note: MDPI stays neutral with regard to jurisdictional claims in published maps and institutional affiliations.

