Abstract
Countries unaccustomed to wildfires are currently experiencing wildfire as a new climate-change reality. Understanding how fire ignition and propagation are correlated with temperature, orography, humidity, wind, and the mixture and age of individual plants must be considered when designing prevention strategies. While wildfire prevention focuses on fire ignition avoidance, firefighting success depends on early ignition detection, meaning that, in either case, ignition plays a major role. The current case study considered three Portuguese municipalities that annually observe frequent fire ignitions (Tomar, Ourém, and Ferreira do Zêzere) as the testing ground for the Modernized Dynamic Ignition Risk (MDIR) strategy, thus evaluating the efficiency of MDIR and the efficacy of the variables used. This methodology uses geographic information systems technology sustained by open-source satellite imagery, along with the Habitat Risk Assessment model from the InVEST software package, as drivers for the MDIR application. The MDIR approach grants frequent update capabilities and fully open-sourced high ignition risk area identification, producing monthly ignition risk maps. The advantage of using this method is the ease of adaptation to any current monitoring strategy, awarding further efficiency and efficacy in reducing ignitions. The approach delivered adequate results in estimating ignitions for the three Portuguese municipalities, achieving, for several months, prediction accuracy percentages of over 70%. For the studied area, MDIR clearly identifies areas of high ignition risk and delivers an average of 62% success in predicting ignitions, thus showing potential for analyzing the impact of policy implementation and monitoring through the strategy design.
1. Introduction
Certain biogeographic regions are historically prone to wildfires; the Mediterranean in Europe, Fynbos and Savannah in Africa, Malee in Australia, Matorral in Chile, and Chaparral in California, are among the most well-known biomes for common wildfire occurrence []. Corresponding ecosystems experience cyclic recurrence of wildfires, where ignition and spreading are driven by temperature, orography, humidity, wind, the mixture of plants, and the age of the individual plants [,]. The characteristic patchy habitats of such ecosystems exhibit a ratio of dead to live fuel, which varies from species to species, with ratios being much greater in higher succession stages as a result of flammable leaf litter deposition [,]. Despite ignition and spread tendencies, hot and dry climate ecosystems require fire: species have evolved to resist wildfires, and in some extreme cases, fire is a mandatory cue for species development [].
Nonetheless, circumstances are changing, and countries unaccustomed to wildfires are currently experiencing this new phenomenon. In Europe, countries such as Sweden, Germany, Poland, and Slovakia, among others, are experiencing increased burnt area, while wildfire hotspot countries, such as Portugal, Spain, Greece, Italy, and France have experienced unusually severe fires, claiming hundreds of lives and resulting in serious economic loss [,]. Many argue that this is an indicator of increasing wildfire activity, resulting in destructive megafires under the current climate change scenario [,].
Europe’s extensive urbanization and expansion trends are blurring the line between urban and rural areas, which under current climate change predictions, will increase fire risk connected with the urban-wildland interface [,]. Portugal follows the general European trend, with a turn in the opposite direction. The main culprits are the demographic shift from rural to urban areas, the changes in land use with evident abandonment, a fragmented land ownership that discourages investment in forest management, and poor fire planning strategies, resulting in the increased connectivity of unmanaged forested areas, consequently increasing wildfire severity [,].
Although the causes of most wildfires are proven to be accidental or criminally driven [,], wildfires can arise naturally from sources such as the spontaneous combustion of dry matter under high temperatures and wind conditions [], or most commonly, lightning strikes []. Ignitions, no matter what underlies their origin, are the first and most important factor in fire prevention [,].
Wildfire risk is mainly associated with the number of ignitions that potentially result in large fires, considering that risk is a factor of hazard by the number of elements at risk, ignitions add to hazard, even though most don’t result in large fires [,]. Ignition prevention associated with an adequate monitoring strategy represents a key element in fire risk reduction [,]. Several risk projection maps and techniques are based mostly on meteorological characteristics such as wind, humidity, and temperature; however, vegetation density and leaf litter, along with chlorophyll content and dryness, are factors of major importance, as has been thoroughly addressed in the literature [,,,,].
Wildfire mitigation analysis has evolved significantly since the turn of the century with the development of satellite imagery and remote sensing (RS) analysis, mostly combined with geographic information systems (GIS). GIS offer a panoply of software and applications, both commercial and open-source, widely used to detect and monitor the behavior of operational firefighting activities and facilitate burnt area mapping. These technologies are proven to confer further efficiency and precision when compared with traditional surveying methods, reducing risk, burnt area, and saving human lives [,].
While most high-quality satellite imagery is still fee-based, new free satellite technology, providing good resolution imagery through a wide range of cameras, is currently widely available. One of these satellites is the Sentinel-2, which offers a wide wavelength range, 10 m resolution imagery, and free access [,].
Fire occurrence, prediction, and propagation models are widely tested and compared in various research papers and literature reviews [,,], offering an indisputable myriad of solutions to fire problems, from statistical methods [,] to remote sensing [,] and machine learning [,]. Despite the many advances in scientific knowledge, such solutions are partly restricted to specialists and are not as readily accessible to the operational agents that play an important role in fire prevention and firefighting.
Adapting and mitigating wildfire risk requires a thorough understanding of all variables involved, both natural and anthropic, thus considering their intricate relationship. The development of suitable planning and fire management policy will only be possible by considering such variables along with the operational firefighting activities [].
The current study aims to create dynamic monthly risk maps, designed to optimize monitoring strategies as part of the integrated dynamic process involved in fire prevention. The main output is monthly updateable ignition risk maps, which in combination with the current meteorological-based techniques, will enhance firefighting, conferring a more efficient monitoring strategy and enabling its use by both researchers and field operational staff.
2. Materials and Methods
Following the trends within geographic information technology, aided by the plethora of free satellite imagery, the current study applied a combined methodology which used the Habitat Risk Assessment model, one of the InVEST (Integrated Valuation of Ecosystem Services and Tradeoffs) models. The InVEST Habitat and Species Risk Assessment (HRA) model allows the assessment of cumulative risks posed to habitats by human activities and habitat-specific consequences, delivering a final ecosystem risk map for each individual habitat resulting from the contribution of exposure and consequence to overall risk [].
Satellite imagery was obtained from the European Space Agency Sentinel-2 satellite, equipped with the MultiSpectral Instrument (MSI) sensor including 13 spectral bands with different resolutions covering the spectral regions of the visible (VIS), near infrared (NIR), and shortwave infrared (SWIR) ranges (https://sentinel.esa.int/web/sentinel/missions, accessed on 1 November 2020).
The fire ignition risk potential maps were created using the previously published Modernized Dynamic Ignition Risk (MDIR) strategy, which combines the InVEST HRA model engine and the variables of road network, historic ignitions, the Digital Terrain Model (DTM), visibility, the Normalized Difference Vegetation Index (NDVI), and population to produce risk maps. This study improves the previous strategy by including the dynamic variable of the Normalized Difference Water Index (S2-NDWI) []. The new MDIR approach uses as dynamic variables the Normalized Difference Vegetation Index (NDVI) and the Normalized Difference Water Index (S2-NDWI), which in combination with static variables, land occupation, slope, forest road network, historical fire ignitions, and visualization basins, enabled the new fire ignition prevention methodology.
All geographic variables within the habitat risk assessment model (HRA) were correlated with each other, with different weights assigned to each distinct land occupation habitat class, whereas the remaining variables were assigned as stressors contributing to fire risk. All weights were attributed based on the research noted in the bibliography [].
2.1. Study Area
The study area belongs to the biogeographical transitional region situated between the floodplains of the Tagus River and the mountain range of Montejunto-Estrela in central Portugal (Figure 1).
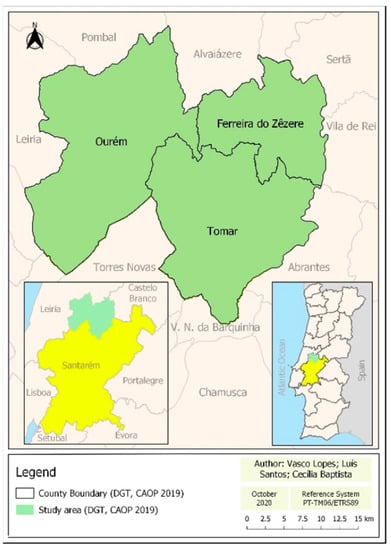
Figure 1.
The geographical location of the study region.
Administratively, the region comprises the municipalities of Tomar, Ourém, and Ferreira do Zêzere belonging to the Santarém district, Nomenclature of Territorial Units for Statistical Purposes (NUTS) level II and III; the municipalities are inserted in the Central region and in the sub-region of the Middle Tagus. Biogeographically, the municipalities under study are included in the Mediterranean bioclimate, exhibiting a pluvio-seasonal oceanic bio-climatic region [] with an average altitude ranging from 30 to 650 m ASL, mean annual precipitation of 660 mm, and a mean annual temperature of 14 °C. Temperature peaks and heatwave duration are major forest fire ignition drivers; data from http://portaldoclima.pt/en/ (accessed on 1 September 2020), indicates that on average, the yearly number of days with a temperature ≥35 °C is 12, where heatwave duration with temperatures ≥35 °C is 4 to 6 days. This region is severely affected by recurrent forest fires, where the main anthropic causes are associated with the misuse of fire, land abandonment, aging population, desertification, and the choice of forestry species (Eucalyptus globulus) influenced by economic yields.
The region, once prosperous with Pinus pinaster plantations, due to the last century’s forestry policy, and speckled with olive orchards and lowland agriculture, is currently transformed into a mosaic of Eucalyptus globulus plantations, with remnants of Pinus pinaster and shrubland dominated by Ulex spp., Erica spp., Pistacia sp., Myrtus sp., and Rubus spp. where agriculture once thrived, confirming the abandonment trend that is further observed as we move northeastward. According to the data of the Official Administrative Chart of Portugal (DGT-2019), the three municipalities cover an area of approximately 95,823 ha, divided as follows: Tomar (35,120 ha), Ourém (41,666 ha), and Ferreira do Zêzere (19,037 ha) [].
2.2. Methods
The applied methodology derives from the previously published Modernized Dynamic Ignition Risk (MDIR) model [] which correlates stressors, both static and dynamic, and resilience variables with land occupation type, returning potential rural fire ignition maps. The MDIR approach is driven by the InVEST Habitat Risk Assessment (HRA) model using the process described in Figure 2. The InVEST HRA was not primarily designed to evaluate fire ignitions; however, it utilizes a well-supported exposure-consequence framework that assesses spatial variation as a cumulative risk from multiple human activities across diverse conditions and land use patterns. The cumulative aspect of ignitions is addressed by various authors [,] who, in some cases, consider exposure-consequence [] as important indicators of ignition risk in habitats strongly influenced by human activities.
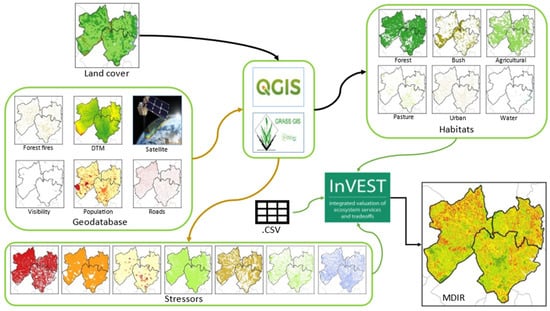
Figure 2.
Modernized Dynamic Ignition Risk (MDIR) conceptual methodology.
The condition of a habitat is a key model determinant; as anthropogenic stressors continue to diversify and intensify, so too does the need for quick, clear, and repeatable ways of assessing risks to habitats, both now and under future management scenarios. These factors award HRA the necessary characteristics to adequately estimate ignition risk and deliver updateable risk maps. Considering that, this model explores the consequences of human activities through the assessment of cumulative risk; the ignition risk probability can be assessed in such a cumulative manner that exposure to risk is positively correlated with the number of stressors affecting a particular area.
The conceptual model is built using land use and occupation data (COS2018) obtained from the Directorate General of the Territory of Portugal (http://mapas.dgterritorio.pt/DGT-ATOM-download/COS_Final/COS2018v1.0-NUT3/COS2018-V1-PT16I_Medio_Tejo.zip; accessed on 7 September 2020). Land use data is available with 9 classes of land occupation: artificialized territories, agriculture, pastures, agroforestry areas, forests, bush, uncovered bare soil or with little vegetation, wetlands, and surface water masses. The land use data was reclassified using the QGIS software to produce individual habitat maps, where some pairs of classes were joined, “artificialized territories” with “uncovered bare soil or with little vegetation,” “agroforestry areas” with “forests,” and “wetlands” with “surface water masses.” These classes were grouped due to land occupation similarities, which in case of fire ignition, does not significantly influence results [,].
The model also considers a set of slow variables: Digital Terrain Model (MDT), population density, roads network, and viewshed.
The Digital Terrain Model (MDT) from Porto University Faculty of Sciences, (https://www.fc.up.pt/pessoas/jagoncal/srtm/; accessed on 7 September 2020) was used to calculate the slope. The data was edited using the QGIS (2020) software slope function, followed by a reclassification into two classes, ≥10 and ≤10 degrees, where the layer from 0 to 10 degrees will be used as a stressor in the InVEST risk assessment model, since low slopes are considered ignition-prone areas according to the last 10-year records for this region. However, for fire spread, the authors refer to high slopes as favorable to fire spread [].
Population density (inhabitants per km2) was determined using the geographic and alphanumeric data from the 2011 census from the Portuguese National Statistics Institute (http://mapas.ine.pt/download/index2011.phtml, https://censos.ine.pt/xportal/xmain?xpid=CENSOS&xpgid=censos_lugar; accessed on 7 September 2020). QGIS software was used to delimitate the stressor layer of population density, which corresponds to areas below 250 inhabitants per km2, and thus awarded an increased risk of ignition, due to desertification and elderly population, with little or no possibilities to maintain forested or agricultural spaces [,,].
For the road network stressor, the municipal plans forest fire defense road network from the Portuguese Institute of Nature Conservation and Forests (https://fogos.icnf.pt/infoPMDFCI/PMDFCI_PUBLICOlist.asp; accessed on 7 September 2020), was analyzed using the QGIS buffer function of 20 m from the road network, which was selected as a high risk, considering that most ignitions start in the vicinity of roads and attributed to negligent or criminal acts [,].
The viewshed QGIS map entered as a stressor in the InVEST model were the shadow areas, or areas not visible by at least three lookout posts/towers, corresponding to an additional risk. Early ignition detection improves early intervention and therefore, firefighting success. The viewshed analysis was calculated by applying the QGIS software plugin, using the MDT available (https://www.fc.up.pt/pessoas/jagoncal/srtm/; accessed on 7 September 2020), and the National Network of Lookout Posts made available by the Nature and Environment Protection Service of the Republican National Guard (SEPNA/GNR).
Fire ignition history is considered a dynamic stressor in the model obtained from the Nature and Environment Protection Service of the Republican National Guard (SEPNA/GNR) which, in Portugal, holds the responsibility to investigate and determine the ignition cause and starting point of fires. The stressor is determined with the QGIS Hotspot function, being assigned a radius of 1000 m at each point; only fire ignitions that occurred from the first day of the calendar year to the date of the satellite images were used for the calculation of the MDIR, hence the dynamic classification. This variable derives from the ignition trend of proximity to a known occurrence, attributed to both natural and anthropic causes [].
The model also assumes another two dynamic variables, the Normalized Difference Vegetation Index (NDVI) and the Normalized Difference Water Index (S2-NDWI), evolving from the previously published MDIR model [] which considered only one dynamic variable, NDVI. Indexes were calculated using 75 Multi Spectral Instrument (MSI) sensor Sentinel-2 satellite images from the months of May, June, July, August, and September for the years 2016 to 2020 (https://scihub.copernicus.eu/dhus/#/home, accessed on 1 November 2020). Downloaded study region satellite images, level 2A, were atmospherically, radiometrically, and geometrically corrected for the period under analysis, without the presence of clouds. Selected data values up to 0.4 [] were considered for both indexes, taking into account the loss of chlorophyll and the absence of humidity as dynamic variables that influence the ignition of rural fires [,]. Sentinel-2 satellite imagery corresponding to bands 4 and 8, with 10 m resolution and band 12, with 20 m resolution, were analyzed using the QGIS Raster Calculator to produce chlorophyll NDVI (Equation (1)) and pre-fire vegetation humidity S2-NDWI (Equation (2)) maps (https://foodsecurity-tep.net/node/214 accessed on 1 November 2020).
Theorem 1.
Normalized difference vegetation index (NDVI), Sentinel-2 Band 4 (RED), red region (Red: 650–680 nm, 10 m resolution); Band 8 (NIR) near infrared (NIR: 785–899 nm, 10 m resolution).
Theorem 2.
Normalized Difference Water Index (S2-NDWI) formulae using Sentinel-2 Band 8 (NIR) near infrared (NIR: 785–899 nm, 10 m resolution) and Band 12 (SWIR 2) Shortwave infrared (SWIR: ~1610–~2190 nm, 20 m resolution).
Finally, the MDIR methodology involves the application of the Habitat Risk Assessment model (HRA) from InVEST (Integrated Valuation of Ecosystem Services and Tradeoffs) suite of models. The process involves grouping all produced data layers in a “host” folder, which will be subdivided into two other folders, one referring to the land occupation files representing the habitats, and the other where the different types of stressor maps are lodged; all files are used in vector format, which favors easy applicability and update. The main “host” folder will hold the vector files with the sub-regions of the study area, in vector format, and two CSV files, where the weights and characteristics of the relationship between habitats and stressors are assigned. Special attention should be given to the need for a direct match between the assigned names in the stressors data table and the stressor folder map, as they should match.
Tables were produced using Microsoft Excel and later saved as CSV files. The Habitat Stressor Info table (Appendix A, Figure A1) contains rows corresponding to the habitat’s characteristics and stressors, respectively, with four columns:
- NAME—The name, that should be unique for each entry, and must match exactly those that appear in the “exposure_consequence_criteria.csv” file, never exceeding 8 characters.
- PATH—Corresponds to the path of the vector file of the input data. They can be absolute file paths.
- TYPE—Defines whether it corresponds to a habitat or a stressor.
- BUFFER STRESSOR—The desired buffer distance (in meters) to be used to expand the influence of a given stressor. It should be left blank for habitats, but should not be left blank for stressors or factors.
The file (exposure_consequence_criteria.csv) corresponds to the Score of Exposure and Consequence criteria that must also be in the “host” input folder. This file contains information on the impact of each stressor on each type of land use/occupation (i.e., exposure (B) and consequence (A) scores) for the different types of land occupation and stressors under analysis. The classification should be awarded an odd scale, which for this study, the scale varied from 1 to 5, since the fire risk maps are standardized in 5 classes.
(A) The Consequence criteria consist of the risk observed in certain areas being exposed to a stressor, i.e., the Consequences are determined by the sensitivity of a type of land occupation to a specific stressor and by the natural resilience that occupation holds to resist and recover from disturbances in general.
By default, the model includes two specific measures of sensitivity (frequency of disturbance, change in classification) and four measures of natural resilience (average growth, rotation rate, connectivity rate, natural recovery time). Each of these measures is described as:
- Average growth: corresponds to the average growth rates of the various species that make up a type of soil occupation. According to the soil occupation variables considered, values between 1 and 5 were assigned, where the maximum value corresponds to the highest average growth rates and consequent resilience.
- Rotation rate: consists of changing the type of occupation, or the natural or anthropic soil characteristics of the various species that make up the class of soil occupation. Species that suffer a high turnover are less sensitive to fire-related stressors and therefore, are given a higher resilience value.
- Connectivity rate: corresponds to the level of connection between the types of land occupation with similar characteristics. In this way, greater connectivity implies greater resilience; therefore, they are given a greater weight.
- Natural recovery time: habitats consisting of species that reach maturity earlier show a faster recovery rate after a disturbance than those that take longer to reach maturity. Consequently, greater weight is attributed to soil occupations where the predominant species rapidly reach maturity.
- Frequency of disturbance: corresponds to the frequency at which the soil occupation type is disturbed by a stressor, i.e., whether the type of land occupation is disturbed or not, with the occurrence of an event. High rates of disturbance imply greater sensitivity, and therefore, they are given a higher weight.
- Change in classification: the change in structure corresponds to the percentage of structural density change in a type of soil occupation when exposed to a given stressor. Types of land occupation that lose a high percentage of area when exposed to a certain stressor are highly sensitive, while those that lose little area are less sensitive, and as such, the latter are assigned a lower weight.
(B) Exposure criteria consists of the increasing risk to which certain areas are exposed when accumulating certain characteristics. The characteristics, from a temporal and spatial nature, consider that aspects such as management, overlap, and neighborhood contribute cumulatively to the aggravation of the risk factor.
- Management effectiveness: management can limit the negative impacts of stressors on the type of land occupation, so effective management reduces the likelihood of stress when compared to areas of land occupation where there is no management. As with other criteria, higher numbers represent higher exposure and, as such, less management effectiveness.
- Intensity of overlap: exposure depends not only on the overlap of the type of land occupation and stressors in space and time, but also on the cumulative effect of stressors.
- Neighborhood: exposure tends to increase when the types of land occupation in the vicinity are very similar; the opposite situation decreases exposure.
For each type of land occupation, it is necessary to have a classification and the assignment of a Data Quality (DQ) and a Weight. For each criterion it is necessary to specify whether it corresponds to a Consequence or Exposure. These criteria are characterized as:
- Rating—This is a measure of the impact of a criterion on a given type of land occupation in relation to the general ecosystem. The classification is an integer between 1 and 5, assigned by taking the published bibliography into consideration. These numbers can be updated as better information becomes available. A rating score of 0 will tell the model to ignore these specific criteria.
- DQ—This column represents the quality of the score data provided in the Rating column. Here, the model gives the user the ability to reduce the weight of less reliable data sources or to define particularly well-studied criteria. A low DQ indicates the best data quality, while a high DQ indicates limited data quality. In this study, the criterion of an intermediate value (3) was used.
- Weight—The weight criterion gives the possibility to determine the most important criteria for the system, regardless of data quality. A low weight matches more important criteria, while a high weight indicates less important criteria.
- E/C—This column indicates whether the criteria given are being applied to exposure or the consequence of the chosen risk equation. By default, all criteria in the Sensitivity or Resilience categories will be assigned to Consequence (C) in risk equations, and all criteria in the Exposure category will be assigned to Exposure (E) in the risk equation.
The InVEST HRA model considered the Multiplicative Risk calculation (Equation (3)), which, for the current study, considered the Cumulative Risk (Equation (4)) to the Ecosystem from Multiple Stressors as an integrative index of risk across all habitats in a grid cell (The Natural Capital Project, 2021) (Appendix A, Figure A1).
Theorem 3.
Multiplicative Risk calculation where risk to habitat “j” caused by stressor “k” in cell “l” is calculated as the product of the exposure and consequence scores.
Theorem 4.
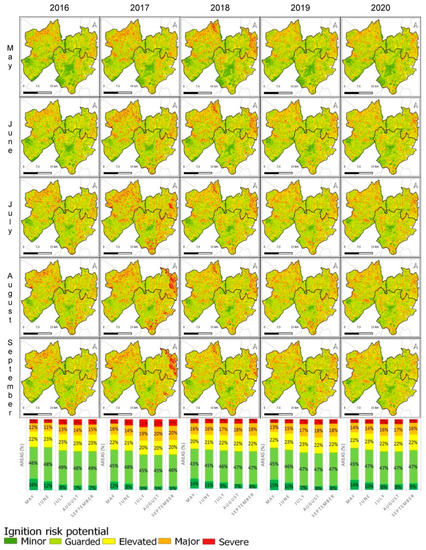
The cumulative risk for habitat “j” in cell “l” is the sum of all risk scores for each habitat. To assess the influence of multiple activities, the cumulative risk of all stressors was quantified for each habitat “l” as the sum of all risk scores for each combination of habitat and activity ”j” as ”R_jl”, and annual and monthly results are presented on Figure 3.

Figure 3.
Ignition potential risk maps from the four critical fire risk months for the 2016–2020 period, followed by an analytic percentage graph of yearly representative areas of five risk classes.
The data ranks and variable valuation in the HRA model were attributed according to literature review and local regional characteristics, expressed as sensitivity and natural resilience measures. All attributed ranks were also discussed thoroughly by a transdisciplinary team of experts holding in-depth knowledge of the regional characteristics. The literature supported the choice of variables and ranked values defined for MDIR, forest road network [,,,], slope [,,], population density [,,], visualization basins [], and fire history [,,] combined with NDVI [,,,] and S2-NDWI [,] indices.
Since results are delivered as model maps with spatial risk distribution, the variable validation will undergo a sequential individual variable removal to determine the contribution of variables and interactions of the strategy.
3. Results and Discussion
The results obtained for the study region shown as potential ignition risk maps using the InVEST HRA model within the Modernized Dynamic Ignition Risk strategy (MDIR) are illustrated on Figure 3. The model connected seven different stressors: forest road network, slope, population density, visualization basins, and fire history, combined with NDVI and S2-NDWI indices. The time interval used in the analysis process comprises the months of May to September for the years 2016 to 2020. The results consider five risk classes, minor, guarded, elevated, major, and severe.
The ignition potential mapping (Figure 3) reveals that the area percentages in each risk class do not change significantly from year to year when considering homologous periods; however, they vary geographically from month to month and year to year, most noticeable for the years 2017 and 2018, when major fire events occurred. This may be attributed to the continuous ecological succession of recently fire-affected habitats, land use change, or natural succession processes. The stressors that contribute to the total gross areas class oscillations are mainly represented through the geographical dispersion of dynamic variables, namely, the NDVI and S2-NDWI together with the cumulative fire ignitions in each year, since weather conditions modify the response of vegetation to ignition probability. The vegetation index is sensitive to vegetation and water content, which is complementary with NDVI, where high values of S2-NDWI exhibit a high water content of the vegetation [,].
One of the observed trends in Figure 3 is the monthly decrease in lower risk class percentages associated with the increase in temperature and reduction of humidity, represented in the model by NDVI and S2-NDWI, and also correlating with regional weather conditions that cumulatively increase the higher risk categories. Another interesting fact is the percentage value of lower risk classes in the initial month of the critical season (May) whose values are associated with the reduction level in the very critical months of August and September, representing the difference between a harsher and calmer fire ignition season, which in turn is correlated with plant water content. Therefore, the amount of water in plants in the beginning of the season will dictate whether or not the year will exhibit recurrent ignitions and possibly larger fires, like those observed in 2017, a critical year for forest fires across the Portuguese territory [,].
Although the number of fire ignitions plays an active role in the MDIR model, it may also contribute to the success of model analysis, enhancing the ability to predict high ignition risk areas, particularly for areas exhibiting considerable anthropic modifications. Figure 4 exhibits the number of monthly ignitions for the years 2016–2020, 1025 in total, emphasizing the high number of ignitions in the month of July, as well as the exceptional year of 2017, in which the month of June observed a high incidence of 87 ignitions for this region, hence the importance of early season conditions.
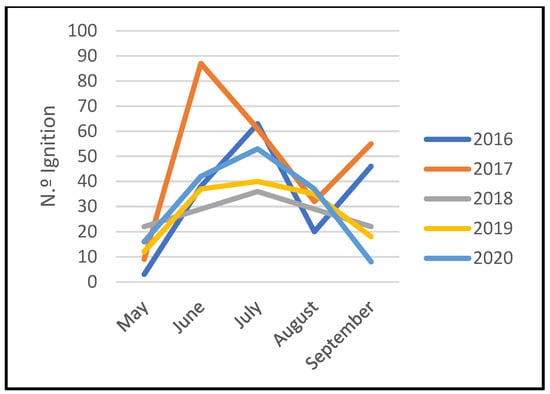
Figure 4.
The number of monthly critical season ignitions for the years 2016–2020.
Considering the evolution of ignitions throughout the critical period of the five-year timeline (Figure 4), in general, the month of May exhibits the lowest number, with ignitions peaking during the month of July and decreasing during the month of August, concluding with a year-dependent variation in September. This trend may be interpreted as a result of plant water content and associated chlorophyll values; the sustainability during the critical period dictates a dryness threshold variability earlier or later within the critical season [].
The variation during the month of September after 2017 may be attributed to a policy change in the Portuguese Civil Protection system, in which prior approval, by formal request through communication with the authorities, was required for slash-and-burn, and other forestry and agricultural practices; otherwise, the offense was punishable by law; hence, the reduction in ignitions is observed.
All in all, the 1025 ignitions observed between 2016 and 2020 are most common in forest habitats, making up 51% of the total; the ignitions occurring on agricultural habitats make up 35%, followed by the urban, bush, and pasture habitats exhibiting 9%, 3%, and 2% of the total, respectively (Figure 5).
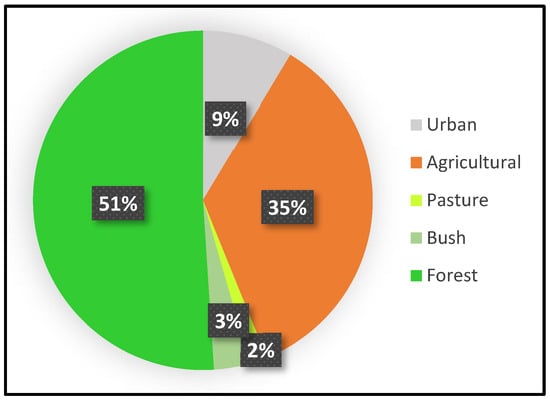
Figure 5.
The percentage of ignitions per land use class.
The model’s quality was analyzed using the number of ignitions that occurred since the last monthly satellite imagery update of NDVI and S2-NDWI. Pursuing this objective, the number of ignitions since the production of the initial MDIR until the new MDIR was calculated (monthly) and the percentage of ignitions that fell in each of the five risk classes was determined as a validation test (Figure 6).
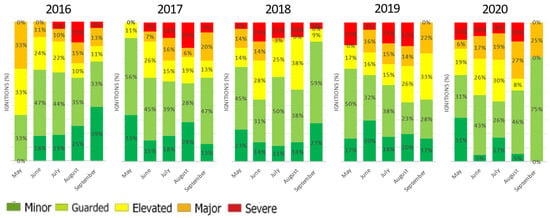
Figure 6.
The monthly ignitions since the last MDIR model for the five risk classes during each year of the five-year study.
The monthly ignitions for the five-year analysis period regarding the MDIR model award a higher percentage of ignitions in the lower risk classes due to the high occurrence of these classes in the study area. Despite the lower representativity of the high-risk class areas, the number of ignitions follows a monthly trend, where a higher number of ignitions is observed in the months of June, July, and August, in accordance with the data in the literature [,].
The MDIR delivers a larger area of lower-risk classes, when compared to higher-risk classes (Figure 3); therefore, the representativity of ignitions is rather misleading regarding the number of ignitions occurring in the higher-risk classes. The relative representativeness of ignitions per area class was calculated using Equation (5), delivering a proportional percentage of occurrence per area class (Figure 7).
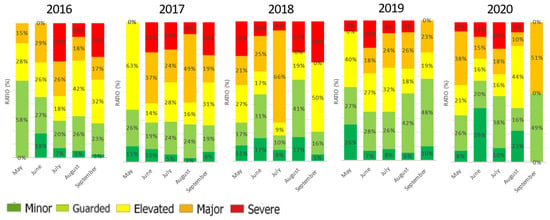
Figure 7.
The rational representative percentage of ignitions per associated representative area.
Theorem 5.
The representative percentage of ignitions per associated representative area (P%) equals the relative area of each risk class (rA) divided by the relative number of ignitions in each class (rNi), divided by the total area of classes (At), and multiplied by 100.
Using the class representative percentage (Equation (5)) allows a clearer interpretation of the success of the MDIR model (Figure 7), where the higher-risk classes “elevated,” “major,” and “severe” show a noticeable increase during the months of June, July, and August, with over 50% of the ignitions occurring within these classes. The months of May and September, prone to weather variability, and concurring with the agricultural and forestry practices of slash-and-burn, may deliver a bias to the efficiency of the model.
Focusing on the representative area ignitions (Figure 7), the average model success, considering the higher-risk classes “elevated,” “major,” and “severe,” is of 63%, 70%, 65%, 54%, and 55% for the years 2016, 2017, 2018, 2019, and 2020, respectively. The monthly success variability of each year can be attributed to weather conditions reflected in the model by the NDVI and S2-NDWI; the years evidencing most variability are 2019 and 2020, where additional policy measures may have played a relevant role. The total analysis of average success for the five-year period is 62%, which, if considered the preventive surveillance objective, should confer a significant reduction in the number of ignitions through early detection attributed to proximity monitoring [].
The importance of the chosen variables was also analyzed by removing each individual variable/stressor from the MDIR model. The model’s results for each individual run are presented in Appendix B, Figure A2. The averaged 2016–2020 comparative evaluation of variance from the final model’s higher-risk classes “elevated,” “major,” and “severe” is expressed in Figure 8.
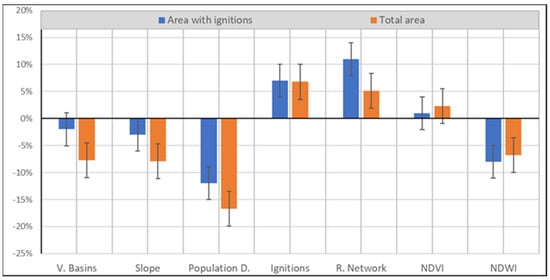
Figure 8.
The area variance of the individual variable removal when compared with the MDIR model.
The variables “v. basins,” “slope,” “population d.,” and “NDWI,” when individually removed from the model, will reduce both the total area and the area with ignitions when compared with the model with the complete set of variables. “V. basins” and “slope” behave in a similar contributive way, where the total area input will be larger than that of the area with ignitions. Population density exhibits a larger contribution than the remaining variables, revealing the fragmented characteristics of the landscape with small, disperse, and numerous urban areas. The NDWI is the only variable where the area with ignitions increases more than the total area and whose contribution towards the model is rather positive. The contribution of NDWI towards the model’s success derives from the fact that water content varies considerably throughout the season for this particular region where plants are well adapted to drought. The NDVI chlorophyll content alone may be misleading, whereas the cumulative characteristics of the model and the overlap of NDVI and NDWI will better assess the risk, hence the increase in the area with ignitions.
The considerable increase in the area with ignitions observed with the removal of “road networks,” when compared with the modest increase in the total area, emphasizes the specificity of this variable in accounting for social ignition causes. Removing the “ignitions” proximity area from the model displays a balanced increase in both the total area and the area with ignitions, once again bringing to evidence the representativeness of this variable. Curiously, when removing “ignitions,” all remaining variables behave in a similar unbalanced manner, either increasing or decreasing both the total area and the area with ignitions, once again revealing the disruptive influence of the social impact.
All the variables display a correlational trend between the total area and the area with ignitions, where area variance, as expected, influences the number of ignitions overlap. The geographic area representativeness of each variable certainly affects the model, a fact observed when “ignitions”, “r. network,” and “NDVI” variables are individually removed, increasing both the total and ignition areas, meaning that their presence will restrict the higher-risk areas, as expected from the model. The remaining variables, when individually removed, will decrease both areas, apparently indicating that their inclusion is not as favorable to the model, since their presence will increase the areas, most likely due to the higher geographic area representativeness, awarding areas with less representativity extra weight. Towards the current model’s ambition of pinpointing specific high ignition risk areas for monitoring purposes, ultimately reducing these ignitions, results indicate that specific restricted geographic monitoring/intervention areas are of major importance, hence the representativeness towards model’s success.
4. Conclusions
The integrated analysis of spatial, slow, and dynamic variables, shaped by the QGIS software in combination with the InVEST HRA model, allowed the production of geographically specific MDIR risk maps, which favor the implementation of a facilitated monitoring effort and consequent reduction of monitoring costs. Considering the General Public License (GPL) of all software’s used in the production of MDIR, along with the detailed description of the process, means that this approach may be replicated by researchers worldwide. This may be of particular interest to developing countries with restricted or no access to licensed software and quality imagery [].
Sentinel-2 satellite imagery is a valuable, free monitoring tool, with acceptable resolution, for assessing the variation in chlorophyll and water contents. This asset allows a dynamic approach to risk maps, enabling near-real estimate analysis. While NDVI and S2-NDWI are correlated, S2-NDWI positively influences NDVI; the opposite is not mandatory, and hence, the importance of including both as model variables. Furthermore, S2-NDWI grants the necessary balance with other variables in the model that are mostly socially driven.
The MDIR approach grants the identification of high ignition-risk areas, and can easily be adapted to current monitoring strategies. The use of this methodology confers further efficiency and efficacy in reducing fire ignitions, thus granting early critical season evaluation for determining if a particular year presents a higher ignition risk. The approach delivered adequate results in estimating ignitions, achieving, in several month, accuracy percentages of over 70%. For the current case study, the MDIR model, within its domain of applicability, returns a satisfactory range of accuracy consistent with the intended monitoring application.
Understanding that many anthropic factors are difficult to estimate, MDIR produced quality maps identifying areas of high ignition risk, delivering a 62% rate of success in predicting ignitions. From another angle, the importance of possessing a free, easily applicable approach such as MDIR is the possibility to study the impact of new policy implementation or an increased monitoring effort when analyzing the model’s accuracy.
Despite the interesting results obtained for determining risk areas, the MDIR model would also benefit from the analysis of the ignition causes that gave rise to large fires in order to test other dimensions and capabilities of this model.
Author Contributions
Conceptualization, L.S., C.B. and V.L.; methodology, L.S. and V.L.; software, L.S. and V.L.; validation, L.S., V.L. and C.B.; formal analysis, L.S.; investigation, L.S.; resources, V.L.; data curation, V.L.; writing—original draft preparation, L.S.; writing—review and editing, L.S. and C.B.; supervision, L.S. All authors have read and agreed to the published version of the manuscript.
Funding
This research received no external funding.
Informed Consent Statement
Not applicable.
Data Availability Statement
All data used in the current study is under access via the public Internet and GEANT networks, with committed reliability and performance on https://sentinels.copernicus.eu/web/sentinel/home, accessed on 1 November 2020.
Acknowledgments
We would like to thank the Tomar Center for Nature Protection and the Republican National Guard for granting access to the fire ignition data and for the precious territorial and fire ignition-related knowledge shared.
Conflicts of Interest
The authors declare no conflict of interest.
Appendix A
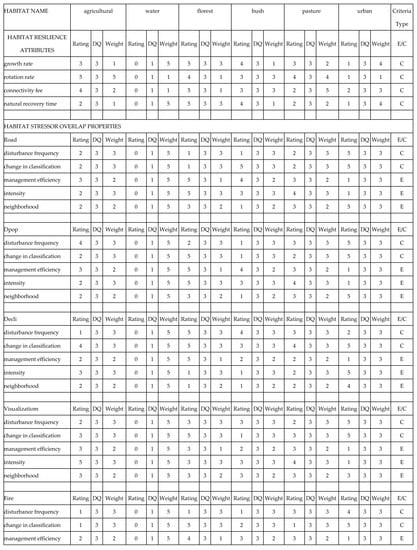
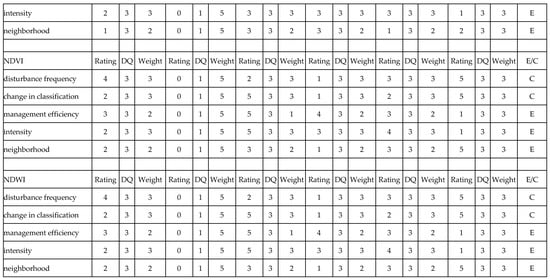
Figure A1.
The Habitat Stressor Info Table.
Appendix B
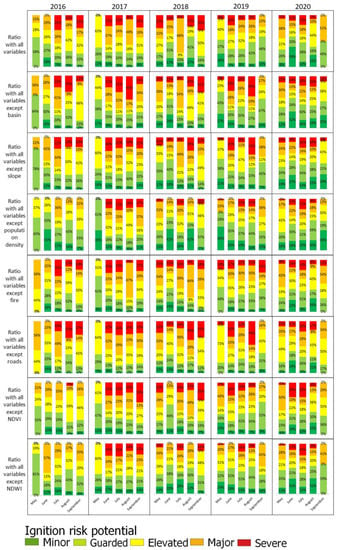
Figure A2.
The comparative model results of the analysis of the variables influencing the model.
References
- Couto, F.T.; Iakunin, M.; Salgado, R.; Pinto, P.; Viegas, T.; Pinty, J.P. Lightning modelling for the research of forest fire ignition in Portugal. Atmos. Res. 2020, 242, 104993. [Google Scholar] [CrossRef]
- Kountouris, Y. Human activity, daylight saving time and wildfire occurrence. Sci. Total Environ. 2020, 727, 138044. [Google Scholar] [CrossRef]
- Balch, J.K.; Bradley, B.A.; Abatzoglou, J.T.; Chelsea Nagy, R.; Fusco, E.J.; Mahood, A.L. Human-started wildfires expand the fire niche across the United States. Proc. Natl. Acad. Sci. USA 2017, 114, 2946–2951. [Google Scholar] [CrossRef] [Green Version]
- García-Llamas, P.; Suárez-Seoane, S.; Taboada, A.; Fernández-Manso, A.; Quintano, C.; Fernández-García, V.; Fernández-Guisuraga, J.M.; Marcos, E.; Calvo, L. Environmental drivers of fire severity in extreme fire events that affect Mediterranean pine forest ecosystems. For. Ecol. Manag. 2019, 433, 24–32. [Google Scholar] [CrossRef]
- Tessler, N.; Sapir, Y.; Wittenberg, L.; Greenbaum, N. Recovery of Mediterranean Vegetation after Recurrent Forest Fires: Insight from the 2010 Forest Fire on Mount Carmel, Israel. L. Degrad. Dev. 2016, 27, 1424–1431. [Google Scholar] [CrossRef]
- Oliveira, S.; Oehler, F.; San-Miguel-Ayanz, J.; Camia, A.; Pereira, J.M.C. Modeling spatial patterns of fire occurrence in Mediterranean Europe using Multiple Regression and Random Forest. For. Ecol. Manag. 2012, 275, 117–129. [Google Scholar] [CrossRef]
- Doerr, S.H.; Santín, C. Global trends in wildfire and its impacts: Perceptions versus realities in a changing world. Philos. Trans. R. Soc. B Biol. Sci. 2016, 371, 20150345. [Google Scholar] [CrossRef]
- Alló, M.; Loureiro, M.L. Assessing preferences for wildfire prevention policies in Spain. For. Policy Econ. 2020, 115, 102145. [Google Scholar] [CrossRef]
- Xu, W.; He, H.S.; Fraser, J.S.; Hawbaker, T.J.; Henne, P.D.; Duan, S.; Zhu, Z. Spatially explicit reconstruction of post-megafire forest recovery through landscape modeling. Environ. Model. Softw. 2020, 134, 104884. [Google Scholar] [CrossRef]
- Radeloff, V.C.; Helmers, D.P.; Anu Kramer, H.; Mockrin, M.H.; Alexandre, P.M.; Bar-Massada, A.; Butsic, V.; Hawbaker, T.J.; Martinuzzi, S.; Syphard, A.D.; et al. Rapid growth of the US wildland-urban interface raises wildfire risk. Proc. Natl. Acad. Sci. USA 2018, 115, 3314–3319. [Google Scholar] [CrossRef] [Green Version]
- Alcasena, F.J.; Salis, M.; Ager, A.A.; Castell, R.; Vega-García, C. Assessing wildland fire risk transmission to communities in northern spain. Forests 2017, 8, 30. [Google Scholar] [CrossRef] [Green Version]
- Górriz-Mifsud, E.; Burns, M.; Marini Govigli, V. Civil society engaged in wildfires: Mediterranean forest fire volunteer groupings. For. Policy Econ. 2019, 102, 119–129. [Google Scholar] [CrossRef]
- Parente, J.; Pereira, M.G. Structural fire risk: The case of Portugal. Sci. Total Environ. 2016, 573, 883–893. [Google Scholar] [CrossRef]
- Fernandes, P.M. Fire-smart management of forest landscapes in the Mediterranean basin under global change. Landsc. Urban Plan. 2013, 110, 175–182. [Google Scholar] [CrossRef] [Green Version]
- de Castro Galizia, L.F.; Rodrigues, M. Modeling the influence of eucalypt plantation on wildfire occurrence in the Brazilian savanna biome. Forests 2019, 10, 844. [Google Scholar] [CrossRef] [Green Version]
- Molina, J.R.; Lora, A.; Prades, C.; Rodríguez y Silva, F. Roadside vegetation planning and conservation: New approach to prevent and mitigate wildfires based on fire ignition potential. For. Ecol. Manag. 2019, 444, 163–173. [Google Scholar] [CrossRef]
- Quintano, C.; Fernández-Manso, A.; Stein, A.; Bijker, W. Estimation of area burned by forest fires in Mediterranean countries: A remote sensing data mining perspective. For. Ecol. Manag. 2011, 262, 1597–1607. [Google Scholar] [CrossRef]
- Taylor, S.W.; Woolford, D.G.; Dean, C.B.; Martell, D.L. Wildfire prediction to inform fire management: Statistical science challenges. Stat. Sci. 2013, 28, 586–615. [Google Scholar] [CrossRef] [Green Version]
- Jain, P.; Coogan, S.C.P.; Subramanian, S.G.; Crowley, M.; Taylor, S.; Flannigan, M.D. A review of machine learning applications in wildfire science and management. Environ. Rev. 2020, 28, 478–505. [Google Scholar] [CrossRef]
- Carmo, M.; Moreira, F.; Casimiro, P.; Vaz, P. Land use and topography influences on wildfire occurrence in northern Portugal. Landsc. Urban Plan. 2011, 100, 169–176. [Google Scholar] [CrossRef] [Green Version]
- Guo, F.; Su, Z.; Wang, G.; Sun, L.; Lin, F.; Liu, A. Wildfire ignition in the forests of southeast China: Identifying drivers and spatial distribution to predict wildfire likelihood. Appl. Geogr. 2016, 66, 12–21. [Google Scholar] [CrossRef]
- Catry, F.X.; Rego, F.C.; Bação, F.L.; Moreira, F. Modeling and mapping wildfire ignition risk in Portugal. Int. J. Wildl. Fire 2009, 18, 921–931. [Google Scholar] [CrossRef] [Green Version]
- Costafreda-Aumedes, S.; Comas, C.; Vega-Garcia, C. Human-caused fire occurrence modelling in perspective: A review. Int. J. Wildl. Fire 2017, 26, 983–998. [Google Scholar] [CrossRef]
- Vilà-Vilardell, L.; Keeton, W.S.; Thom, D.; Gyeltshen, C.; Tshering, K.; Gratzer, G. Climate change effects on wildfire hazards in the wildland-urban-interface—Blue pine forests of Bhutan. For. Ecol. Manag. 2020, 461, 117927. [Google Scholar] [CrossRef]
- D’Este, M.; Ganga, A.; Elia, M.; Lovreglio, R.; Giannico, V.; Spano, G.; Colangelo, G.; Lafortezza, R.; Sanesi, G. Modeling fire ignition probability and frequency using Hurdle models: A cross-regional study in Southern Europe. Ecol. Process. 2020, 9, 54. [Google Scholar] [CrossRef]
- Rodrigues, M.; Costafreda-Aumedes, S.; Comas, C.; Vega-García, C. Spatial stratification of wildfire drivers towards enhanced definition of large-fire regime zoning and fire seasons. Sci. Total Environ. 2019, 689, 634–644. [Google Scholar] [CrossRef]
- Chuvieco, E.; Congalton, R.G. Application of remote sensing and geographic information systems to forest fire hazard mapping. Remote Sens. Environ. 1989, 29, 147–159. [Google Scholar] [CrossRef]
- Jaiswal, R.K.; Mukherjee, S.; Raju, K.D.; Saxena, R. Forest fire risk zone mapping from satellite imagery and GIS. Int. J. Appl. Earth Obs. Geoinf. 2002, 4, 1–10. [Google Scholar] [CrossRef]
- Modugno, S.; Balzter, H.; Cole, B.; Borrelli, P. Mapping regional patterns of large forest fires in Wildland-Urban Interface areas in Europe. J. Environ. Manag. 2016, 172, 112–126. [Google Scholar] [CrossRef]
- Hernandez-Leal, P.A.; Arbelo, M.; Gonzalez-Calvo, A. Fire risk assessment using satellite data. Adv. Sp. Res. 2006, 37, 741–746. [Google Scholar] [CrossRef]
- Naderpour, M.; Rizeei, H.M.; Khakzad, N.; Pradhan, B. Forest fire induced Natech risk assessment: A survey of geospatial technologies. Reliab. Eng. Syst. Saf. 2019, 191, 106558. [Google Scholar] [CrossRef]
- Matin, M.A.; Chitale, V.S.; Murthy, M.S.R.; Uddin, K.; Bajracharya, B.; Pradhan, S. Understanding forest fire patterns and risk in Nepal using remote sensing, geographic information system and historical fire data. Int. J. Wildl. Fire 2017, 26, 276–286. [Google Scholar] [CrossRef] [Green Version]
- Phelps, N.; Woolford, D.G. Guidelines for effective evaluation and comparison of wildland fire occurrence prediction models. Int. J. Wildl. Fire 2021, 30, 225–240. [Google Scholar] [CrossRef]
- Moritz, M.A.; Batllori, E.; Bradstock, R.A.; Gill, A.M.; Handmer, J.; Hessburg, P.F.; Leonard, J.; McCaffrey, S.; Odion, D.C.; Schoennagel, T.; et al. Learning to coexist with wildfire. Nature 2014, 515, 58–66. [Google Scholar] [CrossRef] [PubMed]
- Gaglio, M.; Aschonitis, V.; Pieretti, L.; Santos, L.; Gissi, E.; Castaldelli, G.; Fano, E.A. Modelling past, present and future Ecosystem Services supply in a protected floodplain under land use and climate changes. Ecol. Modell. 2019, 403, 23–34. [Google Scholar] [CrossRef]
- Santos, L.; Lopes, V.; Baptista, C. Modernized Forest Fire Risk Assessment Model Based on the Case Study of three Portuguese Municipalities Frequently Affected by Forest Fires. Environ. Sci. Proc. 2020, 3, 30. [Google Scholar] [CrossRef]
- Nolè, L.; Pilogallo, A.; Saganeiti, L.; Bonifazi, A.; Santarsiero, V.; Santos, L.; Murgante, B. Land use change and habitat degradation: A case study from tomar (portugal). Smart Innov. Syst. Technol. 2021, 178 SIST, 1722–1731. [Google Scholar] [CrossRef]
- Rivas-Martínez, S.; Rivas-Sáenz, S.; Penas-Merino, A. Worldwide bioclimatic classification system. Glob. Geobot. 2011, 1, 1–638. [Google Scholar]
- Sari, F. Forest fire susceptibility mapping via multi-criteria decision analysis techniques for Mugla, Turkey: A comparative analysis of VIKOR and TOPSIS. For. Ecol. Manag. 2021, 480, 118644. [Google Scholar] [CrossRef]
- Çolak, E.; Sunar, F. Evaluation of forest fire risk in the Mediterranean Turkish forests: A case study of Menderes region, Izmir. Int. J. Disaster Risk Reduct. 2020, 45, 101479. [Google Scholar] [CrossRef]
- Oliveira, S.; Félix, F.; Nunes, A.; Lourenço, L.; Laneve, G.; Sebastián-López, A. Mapping wildfire vulnerability in Mediterranean Europe. Testing a stepwise approach for operational purposes. J. Environ. Manag. 2018, 206, 158–169. [Google Scholar] [CrossRef]
- Chergui, B.; Pleguezuelos, J.M.; Fahd, S.; Santos, X. Modelling functional response of reptiles to fire in two Mediterranean forest types. Sci. Total Environ. 2020, 732, 139205. [Google Scholar] [CrossRef]
- Navalho, I.; Alegria, C.; Quinta-Nova, L.; Fernandez, P. Integrated planning for landscape diversity enhancement, fire hazard mitigation and forest production regulation: A case study in central Portugal. Land Use Policy 2017, 61, 398–412. [Google Scholar] [CrossRef]
- Chergui, B.; Fahd, S.; Santos, X.; Pausas, J.G. Socioeconomic Factors Drive Fire-Regime Variability in the Mediterranean Basin. Ecosystems 2018, 21, 619–628. [Google Scholar] [CrossRef] [Green Version]
- Castillo Soto, M.E. The identification and assessment of areas at risk of forest fire using fuzzy methodology. Appl. Geogr. 2012, 35, 199–207. [Google Scholar] [CrossRef]
- Viegas, D.X.; Almeida, M.; Raposo, J.; Oliveira, R.; Viegas, C.X. Ignition of Mediterranean Fuel Beds by Several Types of Firebrands. Fire Technol. 2014, 50, 61–77. [Google Scholar] [CrossRef]
- Chrysafis, I.; Mallinis, G.; Tsakiri, M.; Patias, P. Evaluation of single-date and multi-seasonal spatial and spectral information of Sentinel-2 imagery to assess growing stock volume of a Mediterranean forest. Int. J. Appl. Earth Obs. Geoinf. 2019, 77, 1–14. [Google Scholar] [CrossRef]
- Fernández-Manso, A.; Fernández-Manso, O.; Quintano, C. SENTINEL-2A red-edge spectral indices suitability for discriminating burn severity. Int. J. Appl. Earth Obs. Geoinf. 2016, 50, 170–175. [Google Scholar] [CrossRef]
- Sevinc, V.; Kucuk, O.; Goltas, M. A Bayesian network model for prediction and analysis of possible forest fire causes. For. Ecol. Manag. 2020, 457, 117723. [Google Scholar] [CrossRef]
- Mohammadi, F.; Bavaghar, M.P.; Shabanian, N. Forest Fire Risk Zone Modeling Using Logistic Regression and GIS: An Iranian Case Study. Small-Scale For. 2014, 13, 117–125. [Google Scholar] [CrossRef]
- Bocken, N.M.P.; Geradts, T.H.J. Barriers and drivers to sustainable business model innovation: Organization design and dynamic capabilities. Long Range Plann. 2019, 53, 101950. [Google Scholar] [CrossRef]
- Tessler, N.; Wittenberg, L.; Greenbaum, N. Vegetation cover and species richness after recurrent forest fires in the Eastern Mediterranean ecosystem of Mount Carmel, Israel. Sci. Total Environ. 2016, 572, 1395–1402. [Google Scholar] [CrossRef] [PubMed]
- Peng, G.-X.; Li, J.; Chen, Y.-H.; Patah, N.A. A Forest Fire Risk Assessment Using ASTER Images in Peninsular Malaysia. J. China Univ. Min. Technol. 2007, 17, 232–237. [Google Scholar] [CrossRef]
- Michael, Y.; Helman, D.; Glickman, O.; Gabay, D.; Brenner, S.; Lensky, I.M. Forecasting fire risk with machine learning and dynamic information derived from satellite vegetation index time-series. Sci. Total Environ. 2021, 764, 142844. [Google Scholar] [CrossRef] [PubMed]
- Gao, B.C. NDWI—A normalized difference water index for remote sensing of vegetation liquid water from space. Remote Sens. Environ. 1996, 58, 257–266. [Google Scholar] [CrossRef]
- Gao, B.-C. Naval Research Laboratory, 4555 Overlook Ave. Remote Sens. Environ. 1996, 7212, 257–266. [Google Scholar] [CrossRef]
Publisher’s Note: MDPI stays neutral with regard to jurisdictional claims in published maps and institutional affiliations. |
© 2022 by the authors. Licensee MDPI, Basel, Switzerland. This article is an open access article distributed under the terms and conditions of the Creative Commons Attribution (CC BY) license (https://creativecommons.org/licenses/by/4.0/).