Article

Simulation of Spatial Service Range and Value of Carbon Sink Based on Intelligent Urban Ecosystem Management System and Net Present Value Models—An Example from the Qinling Mountains

1
College of Resources, Environment, History and Culture, Xianyang Normal University, Xianyang 712000, China
2
School of Geography and Tourism, Shaanxi Normal University, Xi’an 710126, China
3
Shaanxi Meteorological Observatory, Xi’an 710014, China
4
Equipment Management and UAV College, Air Force Engineering University, Xi’an 710051, China
*
Author to whom correspondence should be addressed.
Forests 2022, 13(3), 407; https://doi.org/10.3390/f13030407
Submission received: 21 January 2022 / Revised: 20 February 2022 / Accepted: 21 February 2022 / Published: 2 March 2022
(This article belongs to the Section Forest Ecology and Management)

Abstract

:
Under the current background of carbon neutrality, the quantification of carbon neutrality in Qinling Mountains, the calculation of the spatial service scope, and the estimation of economic value are of great significance for the improvement of carbon neutrality spatial planning and the carbon trading market. The Intelligent Urban Ecosystem Management System (IUEMS) was used to calculate the carbon sequestration of the Qinling Mountains. The carbon emission of Qinling Mountains was spatialized through model fitting, using the night light data and energy consumption data of various cities. The static carbon content of the Qinling Mountains was obtained. Combined with the common gas diffusion coefficient, under normal temperature and pressure, the service range of the Qinling Mountains’ carbon neutralization to the surrounding area was calculated. The spatial distribution of carbon sequestration in 2030 and 2050 was simulated using Patch generating Land Use Simulation (PLUS) model and Net Present Value (NPV) model. Under two discount rates, the model could calculate the carbon value in 2012, 2016, 2020, 2030, and 2050, respectively. The results proved that the value of carbon in the Qinling Mountains is gradually increasing. Since 2012, the service range of carbon neutralization in the Qinling Mountains was 175–262.63 km, and the service range has been gradually expanded. The discount rate is inversely proportional to the carbon value.

1. Introduction

“Double carbon action” is part of an international effort to combat climate change. The European Union is a pioneer of carbon neutrality and has pledged to achieve it by 2050 [1]. During the 14th Five-Year Plan period, China’s ecological civil construction entered a critical period in which carbon reduction was the key strategic direction, synergy and efficiency of pollution reduction and carbon reduction were promoted, the overall green transformation of economic and social development was promoted, and the improvement of ecological environment quality was realized, from quantitative to qualitative change [2]. According to the current situation of carbon emissions, how to achieve carbon neutrality is the main research issue of China’s carbon reduction strategy.
Carbon neutrality research abroad has focused on carbon-neutral technology improvements [3,4]. In 2008–2015 or so, the related research was relatively more common, such as the Nordic outlook for a future carbon-neutral energy technology approach [5], the use of renewable energy and development of carbon-neutral fuel research [6], and the carbon-neutral infrastructure strategy research literature [7]. Research in recent years, both at home and abroad, about carbon-neutral energy technology has seen great development, and many of the carbon-neutrality-related technologies have been widely used, including the use of low-temperature energy storage technology in refrigeration and power supply systems, the development of recycling, carbon-neutral bioplastics production method [8], carbon-neutral town technology selection [9], and so on. In addition, in recent years, there have been many studies on carbon-neutral transition in developing countries [10,11]. In general, many domestic and foreign studies on carbon neutrality focus on specific technology research and development and the macro-transformation development path, but there have been no more ideas or studies on carbon neutrality in ecological planning, and the ecological quantification of carbon neutrality needs to be vigorously developed. In this context, combining carbon neutrality with ecology, the calculation of its space service scope and value is helpful to promote the construction of an ecological civilization.
Carbon neutrality refers to anthropogenic carbon dioxide emissions (fossil fuel use and land use) that are absorbed by anthropogenic activities (wood stock, soil organic carbon, engineering sequestration, etc.) and natural processes (ocean absorption, carbon sequestration by erosion-deposition processes, carbon sequestration by alkaline soils, etc.) [12]. Thus, carbon emissions are anthropogenic emissions of carbon dioxide (fossil fuel use and land use), and carbon sink is the amount of carbon absorbed by human activities (wood stock, soil organic carbon, engineering sequestration, etc.) and natural processes (ocean absorption, carbon burial by erosion-deposition, carbon sequestration by alkaline soil, etc.). The forest ecosystem is the type of ecosystem with the highest proportion of carbon sink. The simulation of a forest ecosystem’s carbon sink and quantitative analysis of its carbon neutralization service range have important theoretical and practical significance in the process of carbon neutralization.
The Qinling Mountains is the largest forest ecosystem in central China, which plays an important role in neutralizing the carbon emissions of surrounding cities. At present, the methods of forest carbon storage estimation include satellite remote-sensing data estimation, the factor continuous function method, the growth equation and carbon storage biomass transformation and expansion factor method, the stock volume method, the decomposition method, the log-mean Divisia index (LMDI method), the sample plot inventory method, and the regression model method [13,14]. Traditional carbon storage measurement methods mainly include the micrometeorological method and sample plot survey method, including the biomass method, stock volume method, and biological inventory method [15]. In recent years, the commonly used carbon sequestration models have mainly included the CASA model [16,17], BIOMe-BGC model [18,19], INVEST model [20,21,22], and stand accumulation biomass model [23]. These models have been widely used in the quantification of carbon sequestration and in the study of ecosystem carbon sequestration services, for example, for spatial flow and pattern optimization of carbon sequestration services [24], as well as the tradeoff synergy between carbon sequestration services and other ecosystem services [25,26]. At present, there are many studies on carbon sink and carbon emission calculation, but there are few studies on the calculation of the range of forest carbon neutralization services.
Forests are one of the earth’s major carbon sinks, absorbing 20–40 tons of CO2 per hectare and releasing 15–30 tons of O2 per year on average [27]. A study by Dr. Simon and L. Nash of Leeds University concluded that forests absorb one-third of the world’s fossil fuel emissions [28]. Therefore, in addition to absorbing carbon in the local region, forests can also absorb carbon in a certain range of surrounding regions. Studying the spatial service scope of forest carbon sinks is conducive to the realization of carbon neutrality and spatial balance. At present, many scholars at home and abroad have adopted a variety of methods to simulate the global transmission mode of CO2. Relevant studies show that the global distribution characteristics obtained by Huang Aihua using the MJ98-CDTM model are a high concentration in the northern hemisphere and low concentration in the southern hemisphere, presenting hemispheric distribution characteristics. The global distribution of CO2 has obvious seasonal variation characteristics, with the highest concentration in spring and the lowest concentration in summer [29]. From the perspective of the chemical properties of CO2—which ideally, in the air, has a certain diffusion coefficient—and the transmission rate, the CO2 air transmission rate is usually twice that of O2, and under experimental conditions, the diffusion coefficient is 0.5698 [30]. However, the actual transmission characteristics are affected by factors such as pressure and temperature; therefore, when calculating the space of the forest carbon sink’s services range, the chemical characteristic parameters under ideal conditions are considered.
The economic value measurement of forest carbon sink refers to monetizing the fixed carbon storage of a forest. Different scholars have different research objects, influence factors, and measurement methods, and the carbon sink price obtained varies greatly, which has a great impact on the estimation of the economic value of forest carbon sink [31]. Through sorting out relevant literature, the current methods used by scholars to measure the economic value of forest carbon sink mainly include artificial fixed carbon dioxide method, carbon tax law [32], market price method [33], afforestation cost method [34], and so on, but it is difficult to use these methods to accurately predict the future carbon value based on market fluctuations. The net present value (NPV) model uses a cash discount rate, considering the accounting value is the market value, to be able to estimate the future long-term value. At the same time, this model also takes into consideration the planting afforestation, the opportunity cost of carbon, one-time costs, and annual maintenance and transaction costs [35]. Taken together, the net present value (NPV) model for accounting carbon value is more in line with the actual situation.
The carbon sequestration and oxygen release model in the IUEMS system was used to measure the carbon sink in the Qinling Mountains, and the carbon neutralization in the Qinling Mountains was obtained by simulating the carbon emissions in the region with night light data. Then, the spatial service range of the carbon sink in the Qinling Mountains was calculated by combining the diffusion coefficient of common gases and the CO2 density in the air. Meanwhile, the net present value (NPV) model is used to predict the value of carbon sequestration in 2030 and 2050. The research results are expected to provide a scientific basis for the dynamic change of carbon savings and carbon-neutral spatial planning, and to provide a decision-making basis for related management departments.

2. Materials and Methods

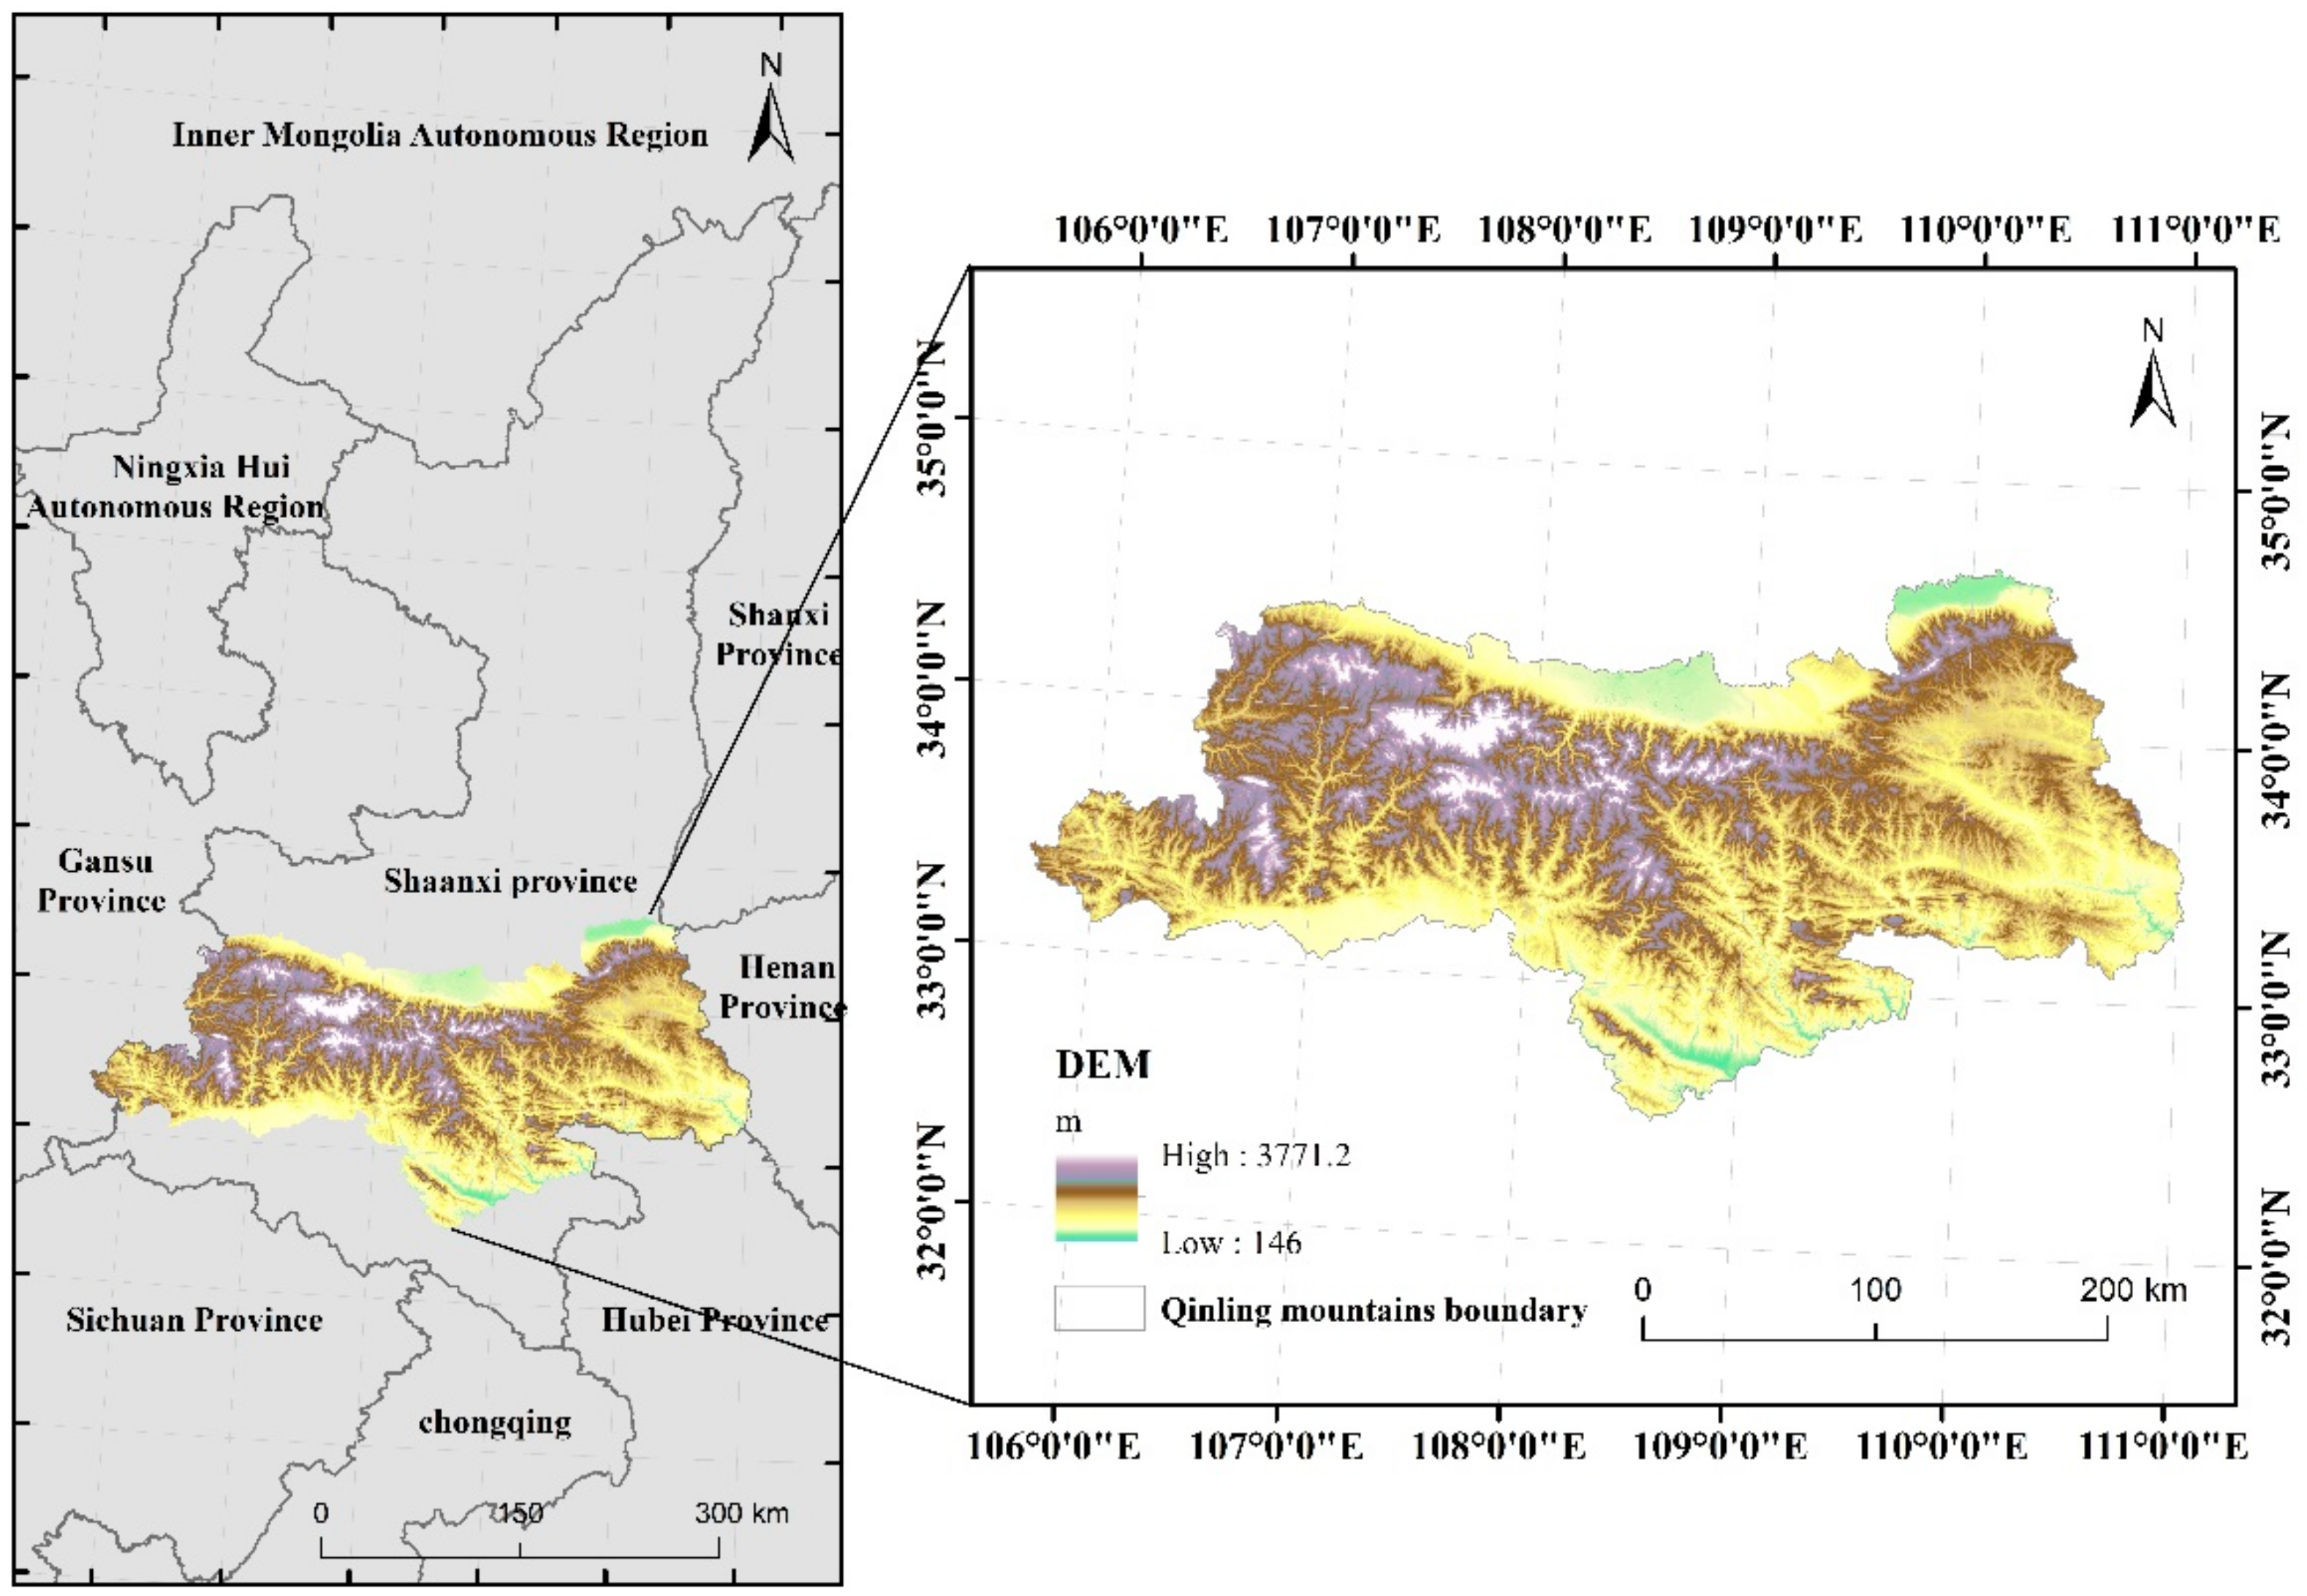
2.1. Overview of the Study Area

The scope of the Qinling Mountains in this paper refers to the hinterland of the Qinling Mountains in Shaanxi Province, China. It is bounded by Weihe River in the north, Hanjiang River in the south, and Shaanxi Province in the east and west (Figure 1), covering an area of 5197 km2. The Qinling Mountains are an important geographical boundary between North and South China. Their forest coverage has increased year by year. It is the birthplace of many important rivers, such as Jialing River and Luohe River, the water source of major cities in the Guanzhong area, and also an important ecological security barrier in China. The average annual temperature is 12–17 °C, the average annual precipitation is 600–1200 mm, the precipitation variability is large, and the seasonal distribution is uneven. In terms of geological structure, the Qinling Mountains are an uplifted block, with a large fault cliff at the north foot. The main ridge of the mountain is on the north side, the north slope is short and steep, and the south slope is long and gentle [36]. The Qinling mountains gradually rise from east to west. The ridge in Shaanxi is about 2000 m above sea level, the peak is 2000–3000 m, and the main peak of the Taibai Mountains is 3771.2 m. The north foot of the Qinling Mountains belongs to deciduous broad-leaved forest vegetation in a warm temperate zone (the east is relatively arid, and the vegetation changes to forest grassland). The Hilly Basin to the south of the Qinling Mountains is made up of subtropical evergreen broad-leaved forest vegetation, and there are also significant differences in agricultural production characteristics between the north and the south. There are many kinds of animals, plants, and mineral resources with high output.

2.2. Data Source

Data include: NPP data, land use data, NPP/VIIRS (Net Primary Productivity/Visible Infrared Imaging Radiometer) data, and energy consumption statistics of 10 cities in Shaanxi Province from 2000 to 2020. The NPP data from NASA’s LAADS [37] (http://ladsweb.nascom.nasa.gov/data/search.html, accessed on 3 January 2021), with a resolution of 500 m. Annual NPP is derived from the sum of all eight-day net photosynthesis (PSN) products (MOD17A2H) in a given year. The land use data comes from 30 m global land cover data released by the Ministry of Natural Resources of the Chinese government in 2020. NPP/VIIRS (Net Primary Productivity/Visible Infrared Imaging Radiometer) data, updated monthly since April 2012, are from the NOAA website NGDC data center (https://www.ngdc.noaa.gov/eog/download.html, accessed on 10 February 2021), and the spatial resolution is 500 m. Energy consumption statistics are from the Statistical Yearbook of Shaanxi Province.

2.3. Methods

2.3.1. IUEMS Model

The calculation method of carbon sink has become relatively mature. However, these carbon sequestration models often need to adjust a lot of relevant parameters, and the model accuracy is greatly affected by meteorological conditions. In this paper, the IUEMS carbon sequestration and oxygen release model was used to calculate the carbon sink in the Qinling Mountains. This model mainly adopted the net ecosystem productivity estimation method, which combined the conversion coefficient of dry matter to carbon and the conversion coefficient of NEP (net ecosystem productivity) and NPP (net primary productivity) in different provinces and cities. At the same time, the ratio of carbon dioxide to carbon molecular weight is also considered. This method is simple and convenient, and it has strong applicability to the calculation of forest ecosystem carbon sink.
The calculation method of carbon sequestration in the IUEMS model adopts the NPP method, the principle of which is that natural ecosystems absorb CO2 in the atmosphere during photosynthesis to synthesize organic matter, fix carbon in plants or soil, and release oxygen [38]. Based on this principle, the net ecosystem productivity estimation method is adopted for the carbon sequestration function, and the formula is as follows:
Q co 2 = M co 2 / M c   ×   N E P
where Qco2 is the amount of carbon sequestration of terrestrial ecosystem, unit: T · CO2/a; Mco2/Mc is the molecular weight ratio of CO2 to C, namely 44/12; and NEP is net ecosystem productivity, in t · C/a. According to the conversion coefficient of NEP and NPP in each province, NEP can be calculated according to NPP, as follows:
N E P = a × N P P × M c / M C H O
where NEP is net ecosystem productivity, unit: t · C/a; α is the conversion coefficient of NEP and NPP; and NPP is net primary productivity in t · C/a.

2.3.2. Calculation and Simulation of Carbon Emissions

In this paper, the correlation between nocturnal light data (NPP/VIIRS image) and energy consumption carbon emissions was established to simulate the carbon emissions in the Qinling Mountains [39]. Because there is no light saturation and overflow in the NPP/VIIRS data, but accidental noise is not eliminated and outliers exist, the method proposed by Zhao et al. [40] is adopted to remove outliers from NPP/VIIRS data. The calculation and simulation of energy consumption carbon emissions follows. Based on the statistical data of energy consumption of 10 cities in Shaanxi Province [41], the carbon emission is calculated, and the calculation formula is as follows:
CO 2 = 44 12 × i = 1 9 K i E i
where i represents the type of energy; Ki is the CO2 emission coefficient of energy i ((10,000 tons of carbon)/(10,000 tons of standard coal)); and Ei represents the consumption of energy i, calculated by standard coal (ten thousand tons). See [39] for carbon emission coefficients of various energy sources. Energy consumption is from the Statistical Yearbook of Shaanxi Province.
Correlations were established between corrected nighttime light data and carbon emissions as measured by energy consumption statistics. Based on the municipal boundary map of Shaanxi Province, the nighttime light data of 10 cities were divided into six regions, including maximum value, minimum value, range of range, mean value, standard deviation, and sum value. Linear regression fitting was carried out between the energy consumption statistics of each city and the nighttime light value. Through the experiment, it was found that the maximum value of nighttime light fitted the energy consumption statistics to the highest degree, and its fitting regression parameters are shown in Table 1. The energy consumption carbon emissions of Shaanxi province in 2012, 2016, and 2020 were calculated according to the highly fitting formula shown in Table 1.

2.3.3. Calculation of Carbon Sequestration Service Scope

At room temperature and pressure, how much of the surrounding carbon can it theoretically absorb and fix as a large carbon sink? In this paper, the service range of carbon sequestration in the Qinling Mountains is calculated by combining the gas diffusion coefficient and the density of CO2 in the air. The gas diffusion coefficient represents the physical quantity of the diffusion degree of a gas (or solid). Diffusion coefficient refers to when the concentration gradient is classified as one unit per unit time through unit area of the amount of gas. If the two parts of the gas are only 1 cm apart (or m), the density difference is 1 g/cm3 (or per m3). In 1 s, in a 1 cm2 squared (or m2) area of the gas, the gas diffusion coefficient can be measured (unit: cm2/s or m2/s). The service scope of carbon sequestration can be calculated according to the gas diffusion coefficient (r), carbon dioxide density ( ρ ), and carbon sequestration amount ( T c ). The calculation formula is as follows:
D i s   ( m ) = T c   ( kg / a ) r   ( m 2 / s ) × ρ   ( kg / m 3 )
According to the data, the diffusion coefficient of most gases at room temperature and pressure is 10−4–10−5 m2/s, and the density of CO2 in the air is 1.98 kg/m3. Therefore, calculated by the carbon fixation distance formula, when R = 10−4 m2/s, D i s = 0.162374 × T c ; When r = 10−5 m2/s, D i s = 1.62374 × T c . Based on this, combined with the amount of carbon sequestration, the spatial distribution value of carbon sequestration service range in the Qinling Mountains can be obtained.

2.3.4. PLUS Model

The PLUS model is a patch-generated land use change simulation model developed by HPSCIL@CUG Laboratory, whose development team is composed of members of the High-Performance Spatial Computing Intelligence Laboratory (HPSCIL), School of Geography and Information Engineering, China University of Geosciences (Wuhan) and the National GIS Engineering and Technology Research Center.
This model applies a new analysis strategy, which can better explore the inducements of various land use changes. It contains a new mechanism of multi-seed growth, which can better simulate the patch level change of multi-land use. The model is coupled with multi-objective optimization algorithms, and the simulation results can better support planning policies to achieve sustainable development. Combined with random seed generation and threshold-decreasing mechanism, the model can dynamically simulate the automatic generation of a patch in time and space under the constraint of development probability. For the mathematical principle of multi-type random seed generation, see references [42].

2.3.5. NPV (Net Present Value) Model

The commonly used calculation methods of carbon sequestration value in China (such as afforestation cost method and carbon tax law, etc.) involve parameters such as afforestation cost and carbon tax, which are greatly influenced by the market economy, and do not consider factors such as discount rate, so the calculation results are quite different. Net present value (NPV), as an indicator of profitability in international economic assessment projects (investments), has been applied to the evaluation of ecological projects such as air pollution control, soil fertility management, and greenhouse gas emission reduction [43,44], as well as the calculation of economic benefits related to ecosystem services. The NPV model incorporates discount rate into the estimation model, which makes the calculation result more practical.
N P V i j s = P V B i j P V C j s
where N P V i j s represents the current value of revenue, P V B i j represents the current value of carbon sequestration, and P V C j s represents the cost of each price scenario.
P V B i j = t = 0 T p i × q t j ( 1 + r ) t
where p i represents the price of carbon, q t j represents the annual carbon sequestration capacity, r represents the annual discount rate, and t represents the time cycle. The carbon price is based on the carbon price forecast in the China 2020 Carbon Price Survey Report [45], which is jointly carried out by the China Carbon Forum, ICF International Consulting Company, and Beijing Zhongchuang Carbon Investment Technology Co., Ltd. Through the survey, the report provides the expectations of stakeholders regarding China’s future carbon price. The average price in the national carbon market in 2020 is 49 CNY/ton, 93 CNY/ton in 2030, and 167 CNY/ton in 2050 [46]. In combination with the discount rate used to calculate the value of standing trees in Europe [47] and China’s national conditions, this paper adopts 3%, 5% and 7% discount rates as scenario parameters [48].
P V C j s = E C j + t = 0 T M C + P F E s 1 + r t
where P F E s represents the opportunity cost of carbon for planting and afforestation, E C j is one-time cost, and M C is the annual maintenance and transaction cost of carbon. For the validation of the model, we compared the simulation results with the carbon value results of actual years in this region in the relevant literature. If the values are similar, it indicates that the model has certain credibility.

3. Results

3.1. Temporal and Spatial Distribution of Carbon Sequestration in the Qinling Mountains

The spatial distribution maps of carbon density in the Qinling Mountains in 2012, 2016 and 2020 were obtained by inputting NPP data and LUCC data of corresponding years using IUEMS. As can be seen from Figure 2, the maximum carbon density in the Qinling Mountains increased year by year and reached 432.324 tons/ha in 2020.
The spatial distribution map of carbon sequestration in the Qinling Mountains was obtained through the conversion of carbon density data and pixel area. The carbon sequestration also showed an increasing trend year by year. The regions with higher carbon sequestration were distributed in the central and western regions of the Qinling Mountains, while the northern and southern regions had relatively less carbon sequestration. According to the graded statistics of carbon sequestration (Table 2), it can be seen that the area with carbon sequestration over 5000 tons will increase significantly in 2020, indicating that the area with high carbon sequestration in the Qinling Mountains is constantly expanding.
According to the carbon sequestration rate in Figure 2, the carbon sequestration rate in 2012–2016 was relatively high, but slowed down in 2016–2020, and was relatively low in the 20-year time scale from 2012–2020. On the whole, the carbon sequestration rate in most regions of the Qinling Mountains showed an increasing trend. The area with an increasing carbon sequestration rate from 2012 to 2016 accounted for 98.29%, and the area with an increasing carbon sequestration rate from 2012 to 2020 was 97.8%.

3.2. Spatial and Temporal Distribution of Carbon Emissions and Calculation of Carbon Neutral Spatial Service Range in Qinling Mountains

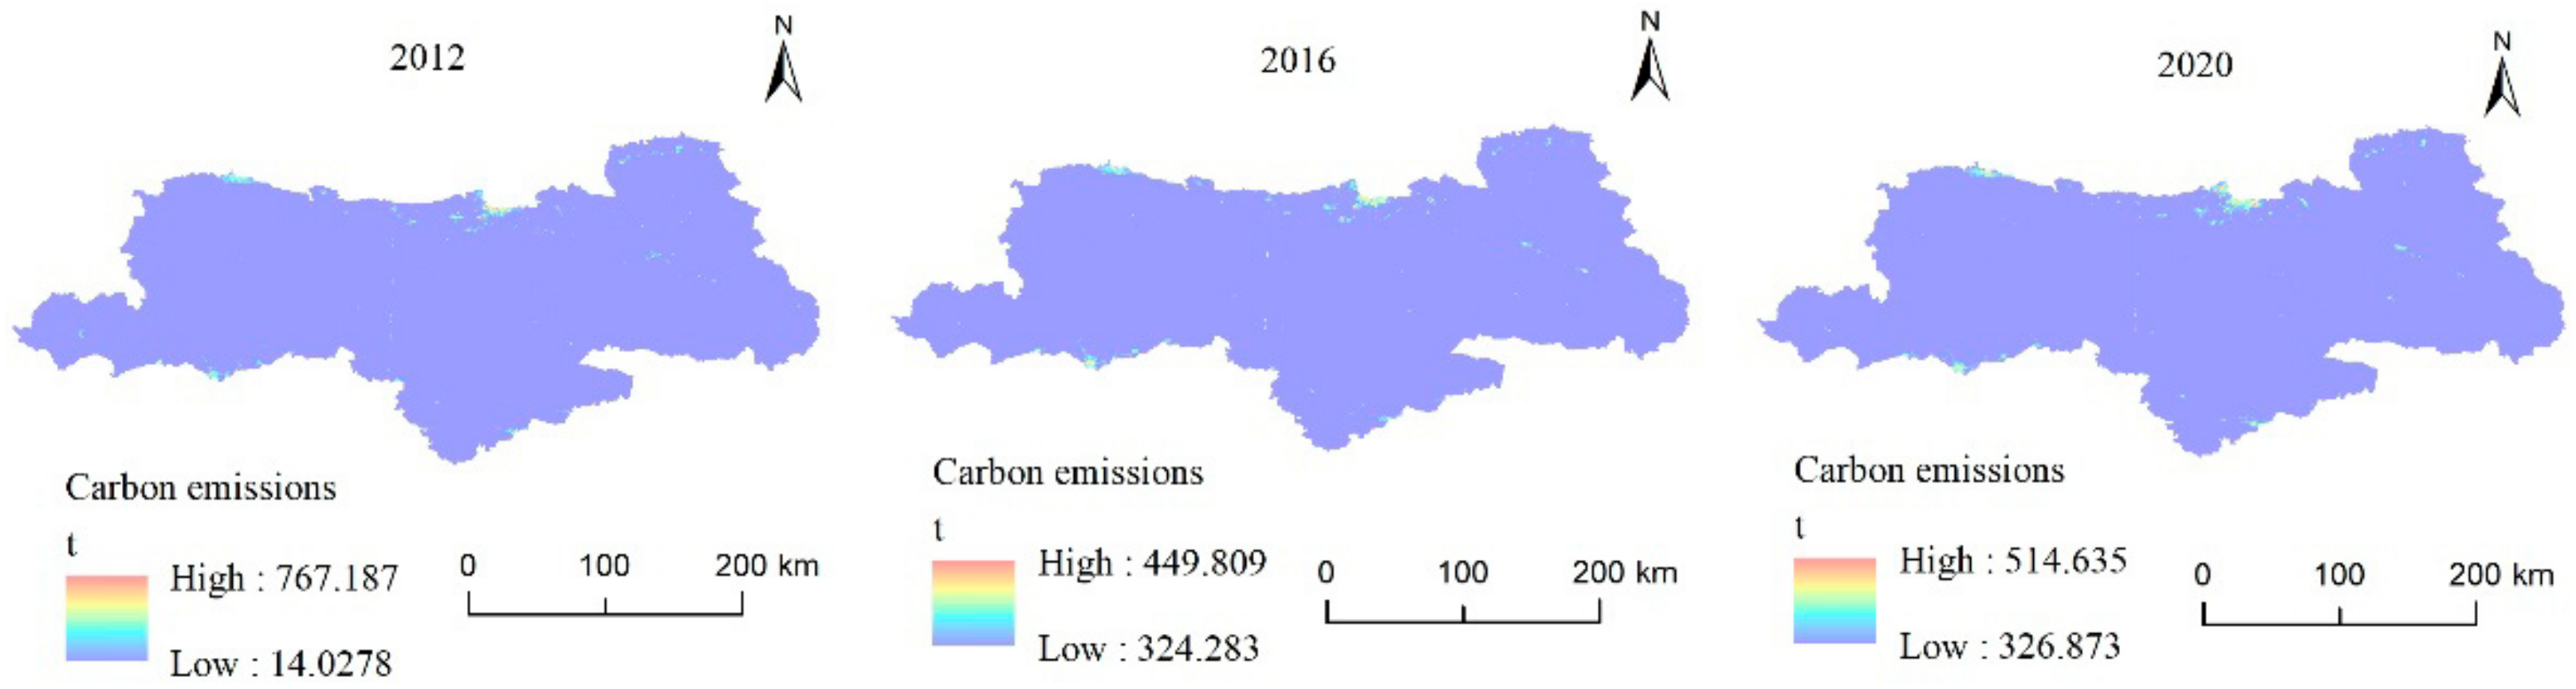
3.2.1. Spatial and Temporal Distribution of Carbon Emissions

By establishing a fitting model between night light data and energy consumption data (see Section 2.3.2), we obtained the spatial distribution maps of carbon emissions in the Qinling Mountains in 2012, 2016, and 2020 (Figure 3).
It can be seen from the figure that the carbon emissions in the Qinling Mountains are all positive, and the lowest annual value of carbon emissions of the three values is 14.0278 t. The low value of carbon emission showed an increasing trend year by year, and the low value increased greatly from 2012 to 2016, while the high value of carbon emission showed a change of decreasing first and then increasing from 2012 to 2020. In terms of space, the carbon emissions in the Qinling Mountains are all low, accounting for 90% of the total area in each year, and the areas with higher carbon emissions are mainly distributed in the urban agglomeration areas on the Northern Slope.

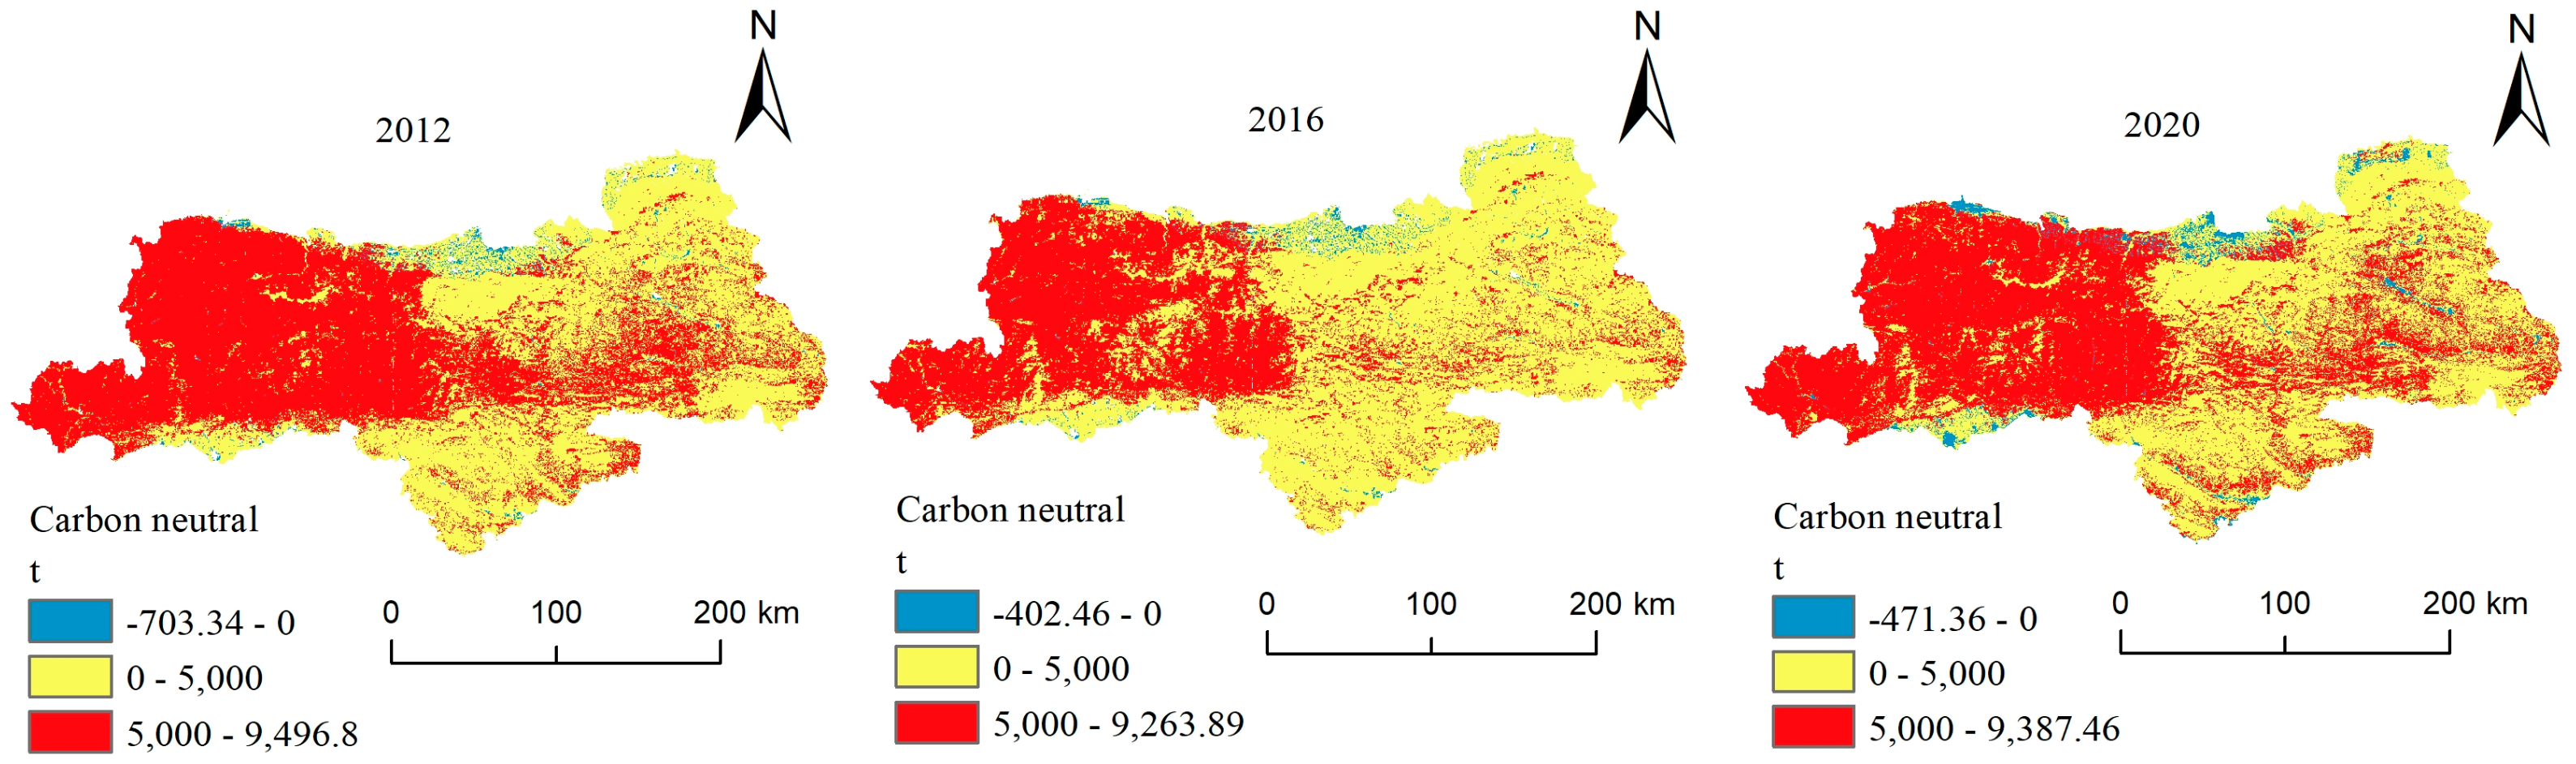
3.2.2. Calculation of Carbon Neutral Space Service Scope in Qinling Mountains

Based on the quantification of carbon sequestration and carbon emissions, the spatial distribution diagram of static carbon neutralization in the Qinling Mountains was obtained by subtracting carbon emissions from carbon sequestration and classified (Figure 4). It can be seen from the spatial and temporal distribution diagram of carbon neutralization in the Qinling Mountains that the areas with high carbon neutralization degree are mainly distributed in the central and western parts of the Qinling mountains. As can be seen from the grading diagram, the negative areas in carbon neutralization are mainly some urban areas on the northern slope, and the negative areas are very small. The area of the region with carbon neutralization less than 0 showed a gradually increasing trend. The proportion of the region with carbon neutralization between 0 and 5000 tons was 46.75%, 61.69% and 60.11%, respectively. The proportion of the region with carbon neutralization greater than 5000 tons was gradually decreasing, as shown in Table 3. It can be seen that the carbon sequestration in the Qinling Mountains is far greater than the carbon emissions, more than 96% of the regions are carbon neutral, and the area with more than 5000 tons of carbon decreases slightly. The increased area of carbon emissions is mainly caused by the urban expansion and development of the northern slope.
According to the formula of carbon sequestration service range, the spatial service range of carbon neutralization of each pixel in the Qinling Mountains was calculated (Figure 5). As can be seen from the figure, the region with the larger service range is distributed in the western Qinling Mountains. In terms of time, the maximum service range decreases first and then increases. Based on the hierarchical statistics of spatial service raster data of carbon sinks in the Qinling Mountains (Table 4), it can be seen that the area with service scope of more than 5000 m decreases first and then increases from 2012 to 2020. The regions with the service range of 0–5000 m account for 68.55%, 84.21%, and 75.98%, respectively. Therefore, on the pixel scale, the service range of carbon sink in the Qinling Mountains is mostly 0–5000 m, which increases first and then decreases. The region with the service range of 0 is mainly carbon source, which occupies a very small area. However, it also shows a trend of gradual expansion.
As a result, the Qinling Mountains can be seen as a large carbon sink, whose carbon sequestration service is to absorb a large amount of carbon released by the human activities around them. Through the calculation of static carbon neutralization in the Qinling Mountains, it is concluded that the carbon generated in the Qinling Mountains in 2016 can provide 120.77 × 10⁴ tons of carbon absorption after neutralizing the carbon emissions in this region, and it will be 134.63 × 10⁴ tons in 2020. On the whole, the amount of carbon absorbed by the Qinling Mountains is increasing year by year. Since the carbon sink of the Qinling Mountains is much larger than the carbon emissions in the region, the Qinling Mountains can be regarded as a large carbon sink. How much area can the Qinling mountains serve? The service range of Qinling mountains carbon sink was calculated according to the diffusion coefficient of gas and CO2 concentration in air at room temperature and pressure. According to the calculation results, the service scope in 2012 is 175 km around the Qinling Mountains; in 2016, 186 km around the Qinling Mountains; and in 2020, 200 km around the Qinling mountains, with its radiation scope reaching Ningxia, Gansu, Sichuan, Hubei, Chongqing, Henan, Shanxi, and other places. Looking at the time dynamic, its service scope expands year by year (Figure 6).

3.2.3. Future Carbon Neutrality Spatiotemporal Simulation and Its Spatial Service Scope

For the prediction of carbon neutralization in 2030 and 2050, the PLUS model is adopted. Through the plus model, the carbon neutralization in 2020 is simulated by using the carbon neutralization spatial distribution data in 2012 and 2016, and then the similarity between the simulation results and the actual carbon neutralization data in 2020 is compared. It is obtained that the kappa coefficient is 0.765, and its similarity is high, which is verified. Based on the verification, the carbon neutralization in 2030 and 2050 is simulated, and the prediction results are shown in Figure 7a.
According to the calculation, the carbon neutralization amount in 2030 is 149.07 × 10⁴ tons, and the carbon neutralization amount in 2050 is 161.74 × 10⁴ tons. According to the formula of carbon neutralization space service range, the service range of carbon sink in Qinling Mountains in 2030 and 2050 is 242.05 km and 262.63 km, respectively. From 2012 to 2050, the spatial service scope of total carbon sink in the Qinling Mountains gradually expands (Figure 7b). It can be seen that under the continuation of the current conservation measures, the total carbon sink in the Qinling mountains will gradually increase, its carbon sequestration service function will also gradually enhance, and its carbon sink benefit area will also gradually expand.

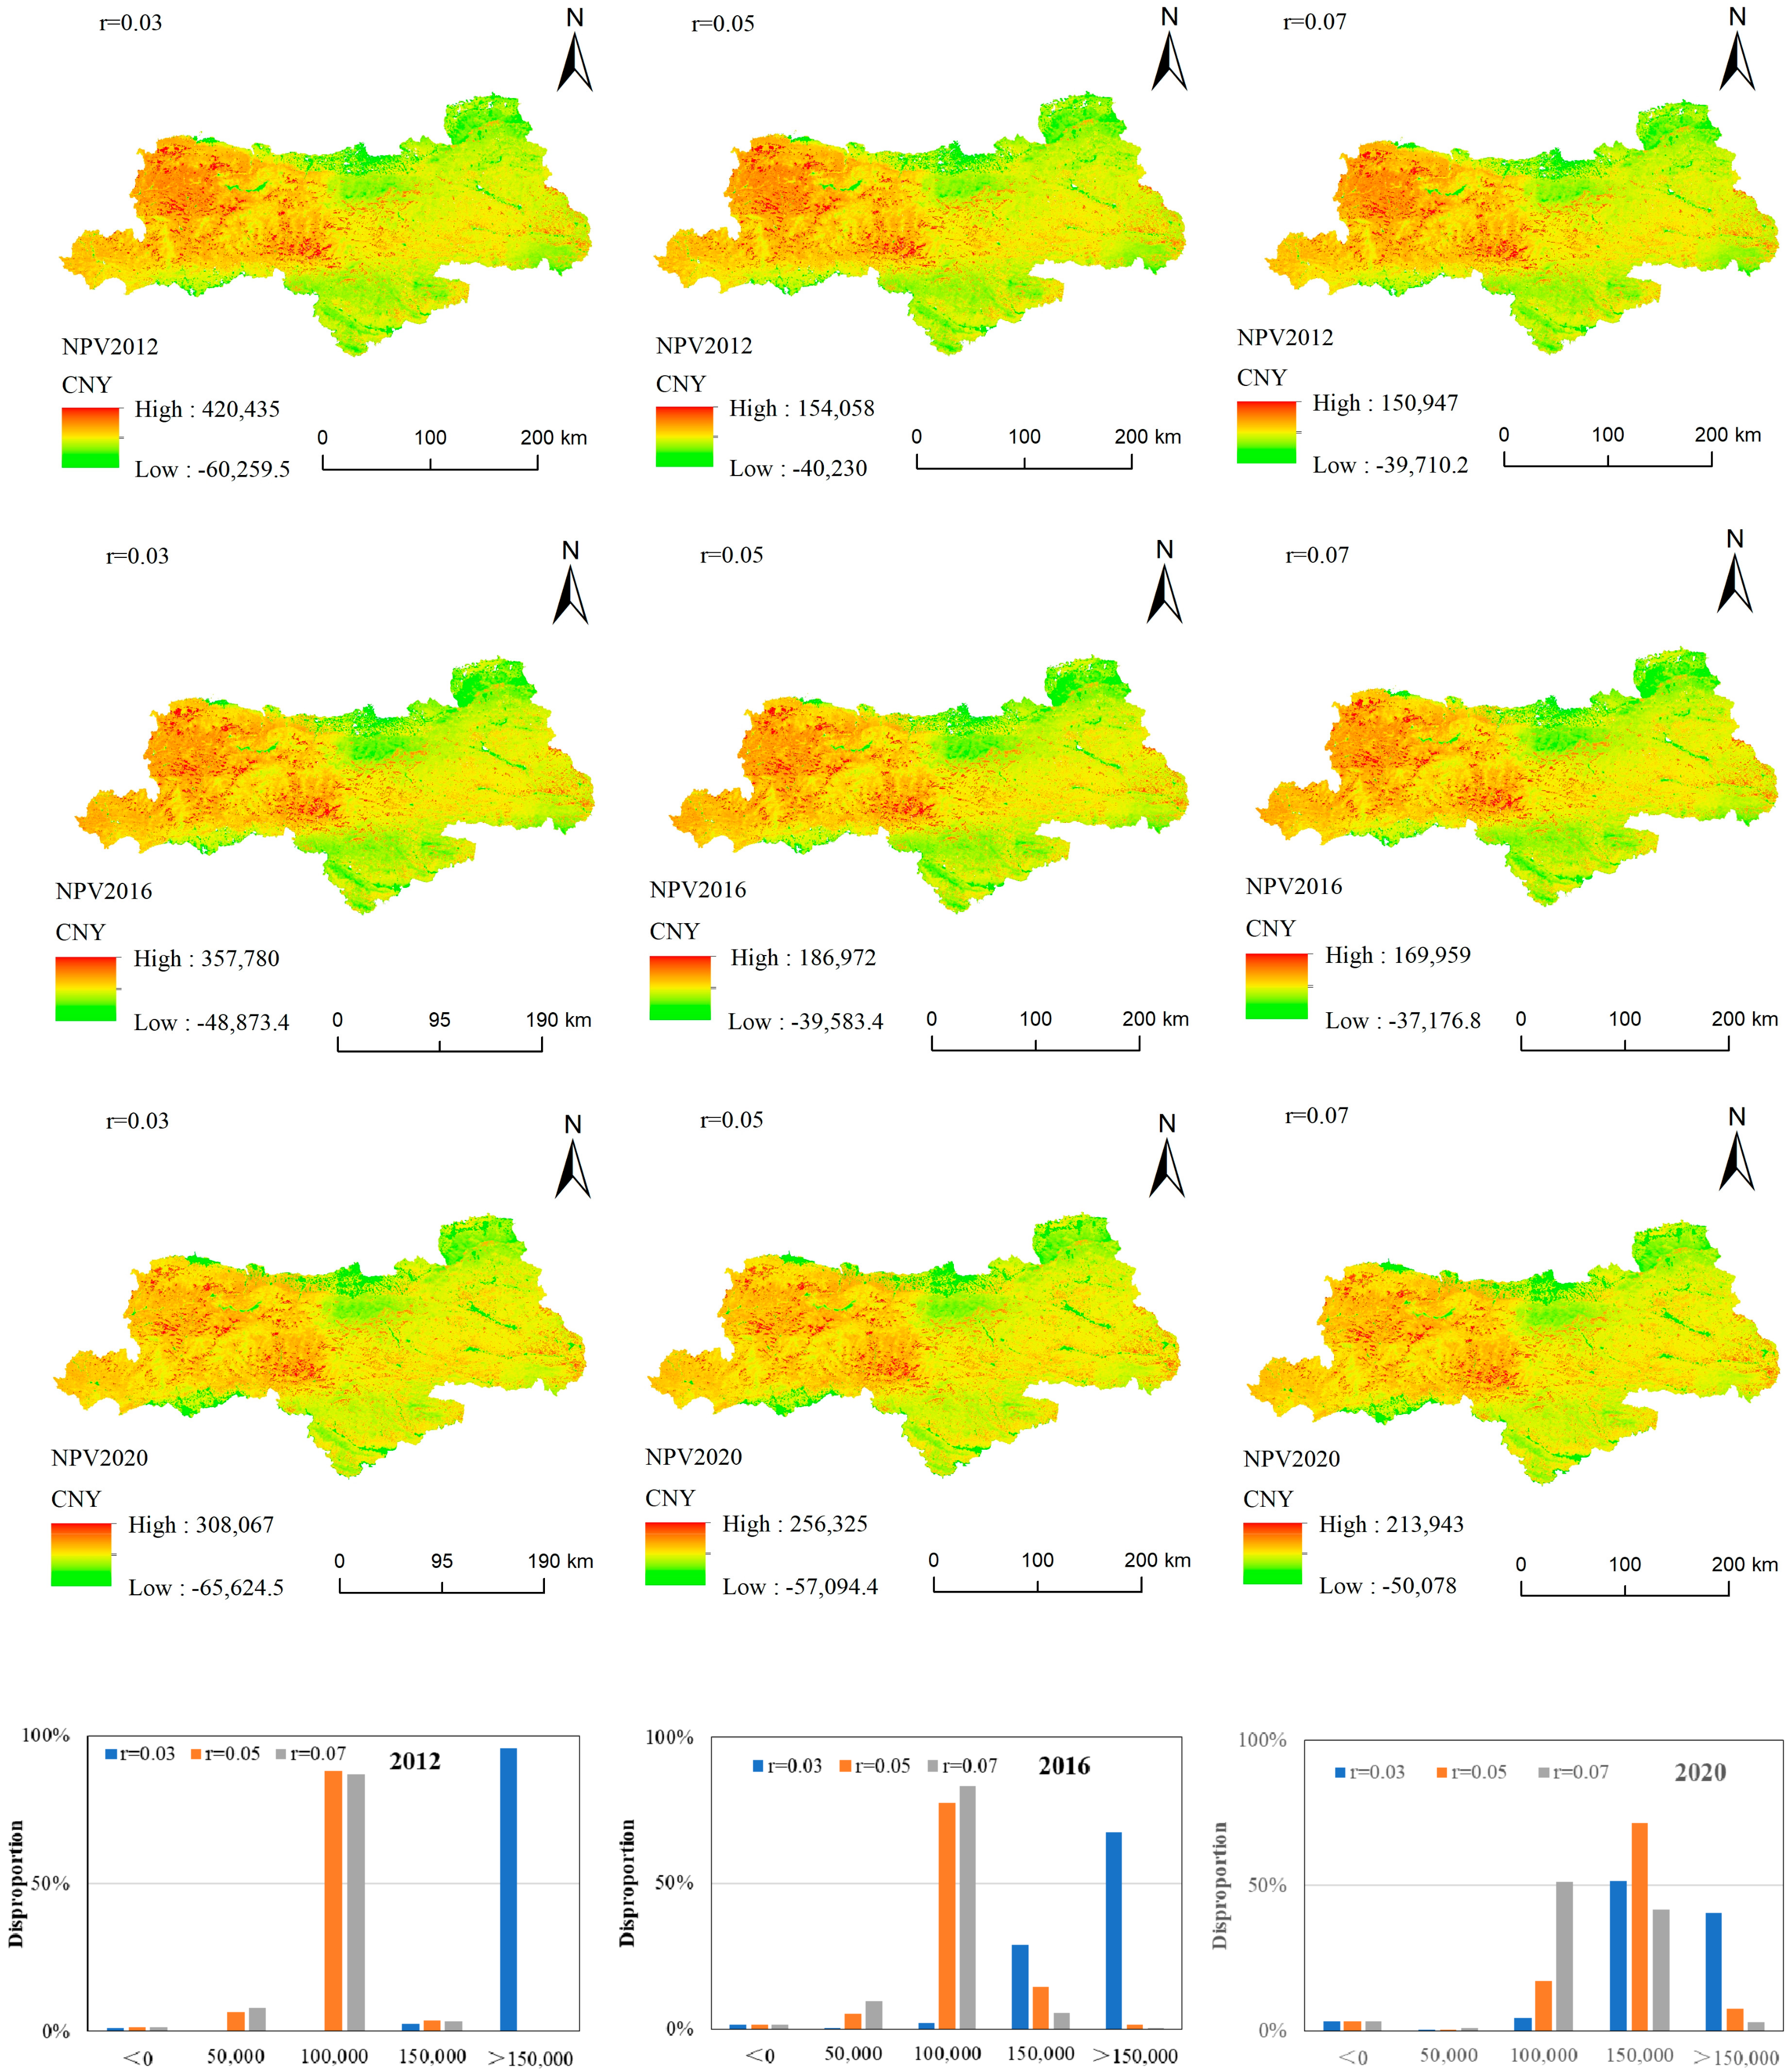
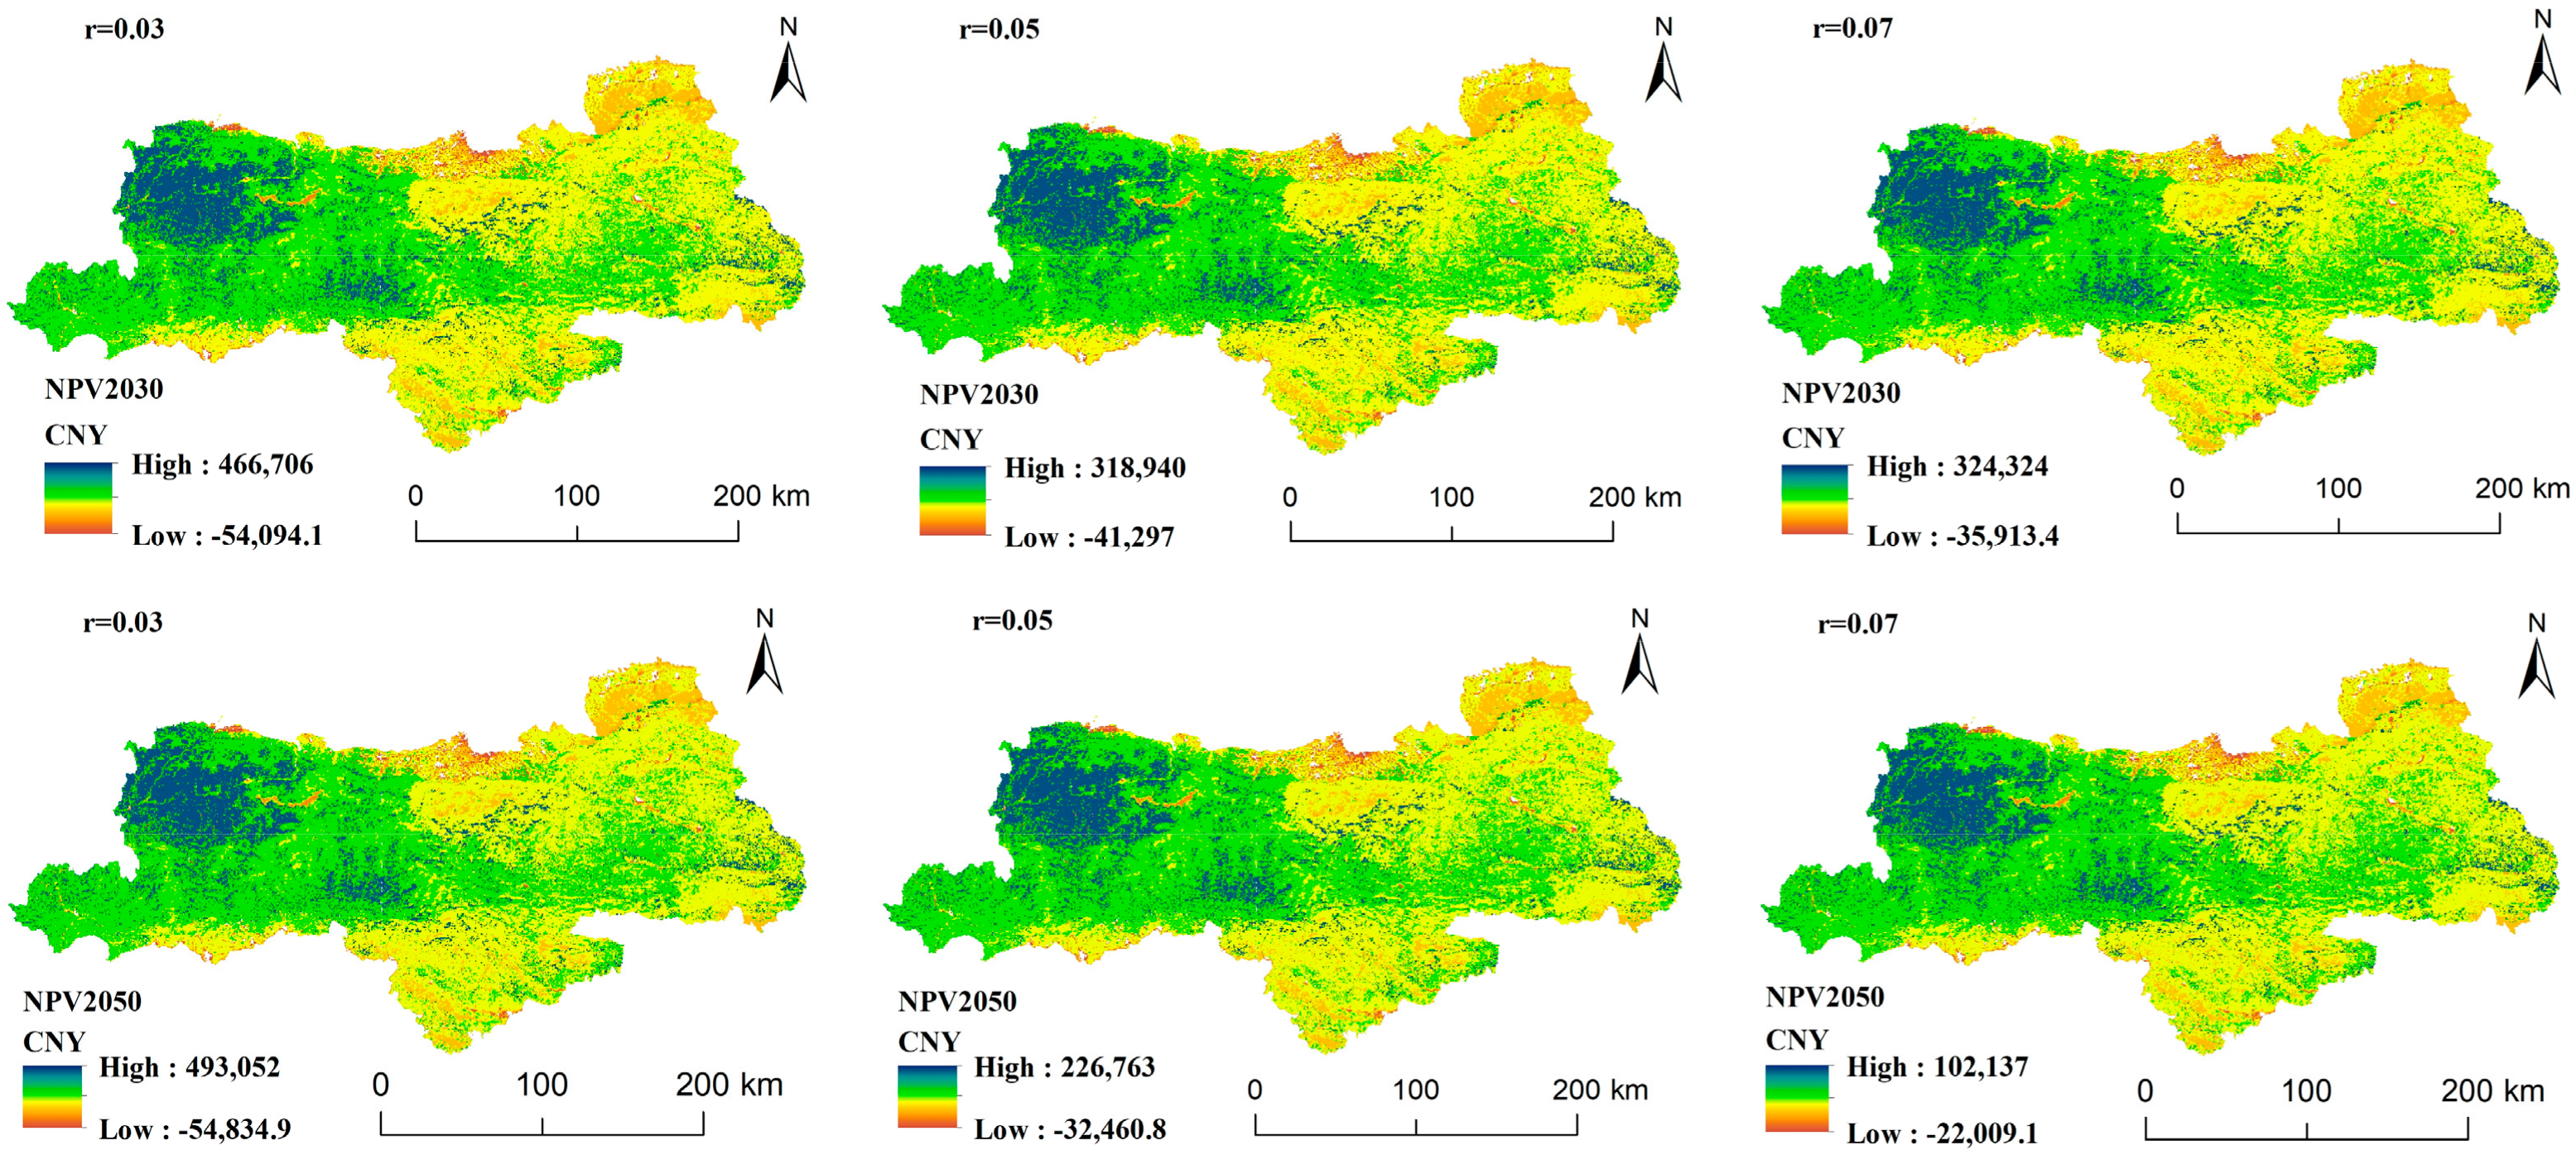
3.3. Spatial and Temporal Distribution of Carbon Sink Value Accounting

The NPV model was used to calculate the static carbon neutralization value of carbon sequestration in the Qinling Mountains. According to a literature search, the annual carbon sequestration economic value of forest ecosystem in Shaanxi province from 1999 to 2003 is 328.27 × 10⁸ CNY [49]. The carbon sequestration value calculated by using the NPV model in 2016 is 185.2 × 10⁸ CNY to 205.35 × 10⁸ CNY. The carbon sequestration value of the Qinling Mountains accounts for more than half of Shaanxi Province. It can be concluded that the NPV model is reliable for calculating the carbon value in the Qinling Mountains.
Firstly, the spatial distribution maps of carbon neutralization value under three discount scenarios in 2012, 2016, and 2020 were obtained through model calculation (Figure 8). As can be seen from the figure, when the discount rate was 0.05 and 0.07, the carbon sink value in 2012, 2016, and 2020 shows a trend of gradual increase. When the discount rate is 0.03, the carbon sink value shows a trend of gradual decrease. Spatially, the regions with high carbon value are mainly distributed in the central and western regions of the Qinling Mountains. Based on hierarchical statistics of spatial carbon sink value (Figure 8), it can be seen that in 2012 and 2016, when the discount rate was 0.03, most of the carbon sink value was above 15 × 104 CNY; when the discount rate was 0.05 and 0.07, most of the carbon sink value was concentrated at the level of 5 × 10⁴–10 × 104 CNY. In 2020, when the discount rate is 0.03, the carbon sink value is mainly concentrated at the level of 10–15 × 104 CNY and above 15 × 104 CNY. When the discount rate is 0.05, the carbon sink value is mainly concentrated at the level of 10–15 × 104 CNY. When the discount rate is 0.07, the carbon sink value is mostly concentrated at the level of 5–10 × 104 CNY and 10–15 × 104 CNY.
Figure 9 shows the spatial value distribution of carbon sink in 2030 and 2050. From the forecast results of 2030 and 2050, when the discount rate is 0.03, the carbon aggregate value in 2050 is smaller than that in 2030. When the discount rate is 0.05, the total carbon sink value in 2050 is greater than that in 2030. When the discount rate is 0.07, the total carbon sink value in 2050 is significantly lower than that in 2030. As the discount rate increases, the total value of carbon sinks decreases (Table 5).

4. Discussion

The consultation project of “China Carbon Neutrality Framework Roadmap Research” of the Chinese Academy of Sciences divides the process of realizing carbon neutrality into emission end, carbon sequestration end, and policy promotion [50]. Firstly, IUEMS and night light data were used to quantify the carbon sequestration and carbon emissions in the Qinling Mountains. Based on this, the spatial and temporal distribution of static carbon neutrality in the Qinling Mountains was obtained. Secondly, due to the Qinling Mountains minimal carbon emissions, it can be seen as a large carbon sink. Using the gas diffusion coefficient under the atmospheric pressure and CO2 density, and calculating carbon service space of the Qinling mountains range in theory, the method in the current carbon sequestration study has certain innovative features, and carbon neutral space planning problems are put forward. Finally, the future value of forest carbon sink is simulated and calculated based on the PLUS model and NPV model, which provides a scientific basis for carbon sequestration to serve as an ecological compensation policy mechanism. The carbon sequestration, spatial scope, and carbon value of the Qinling Mountains were analyzed scientifically, which also provided a new idea for carbon neutralization research.
This study calculated the amount of static carbon as being neutral in Qinling Mountains, due to the amount of Qinling Mountains carbon sink being far greater than carbon emissions. Therefore, this article proposed and calculated the space of the carbon sink service scope, which is of great significance to achieve the goal of carbon neutrality. The author thinks that carbon neutrality is not only the only issue to mark, and more attention should be paid to spatial equalization to avoid the problem of uneven spatial distribution of carbon neutrality. This study is based in the process of calculating the gas diffusion coefficient under the atmospheric pressure and CO2 density, but in practice, the diffusion coefficient is not constant. The diffusion and desorption temperature and pressure change in the process [51,52]. Therefore, in the future, the question of how parameters such as temperature and pressure are taken into account for different seasons and weather conditions with regard to the carbon neutral service scope is very important to achieve carbon neutrality quickly.
At present, most of the research related to carbon neutrality at home and abroad focus on new technologies and energy transition, for example, the improvement of cryogenic energy storage technology needed in the process of carbon neutralization in the refrigeration and power supply industry [53], the development of biofuel production technology in the European Union [54], the carbon-neutral transformation planning study of the power system in New York [55], the evaluation study of the carbon neutral potential of CO2 removal in Europe [56], the realization method study of a carbon neutral campus [57], and the carbon-neutral and livable health and urban transportation planning path [58]. Most research in China is also focused on carbon-neutral technologies and energy transition [59]. For example, the development and comprehensive application of mathematical simulations in a sewage treatment system under the trend of carbon neutrality [60]. A few recent studies have involved the combination of carbon neutrality with carbon ecological security and ecological compensation in China [61]. However, there are not many similar studies on the spatial-temporal service scope and spatial planning of carbon neutralization, so the author thinks that the quantitative research on carbon neutralization in this paper is relatively new at home and abroad. The calculation of the service scope of a carbon sink is a new research idea and method, which is worth discussing. Finally, the accounting and value of the carbon amount is also a main aspect of forest carbon sink research. The future development of carbon neutrality is closely related to the market economy. At the same time, it also logically explains the problem of carbon amount and carbon value.

5. Conclusions

The amount of carbon sequestration and carbon emissions in the Qinling Mountains were calculated by various means, and the scope of carbon sequestration service was calculated. In addition, the economic value of carbon neutrality is calculated and predicted. In the face of climate change, carbon neutrality is currently the best option for countries. For China to achieve the goal of carbon neutrality, the establishment and improvement of carbon market is the inevitable way in the future. Therefore, this study conducted quantitative research and discussion from two aspects of spatial planning and economic value of carbon neutrality, hoping to give some inspiration to relevant researchers and promote the improvement of relevant methods. Finding an accurate accounting method of carbon sequestration and carbon emissions is still the main problem to be solved at present, which is also the basis of carbon neutrality. IUEMS was used to calculate the carbon sequestration in the Qinling Mountains. Compared with other calculation methods, this system is more convenient and faster. By establishing the fitting relationship between night light data and energy statistics data, carbon emissions are simulated and spatialized. The method can be applied to the spatial simulation of carbon emissions at large and medium spatial scales. In summary, this study adopts a more advanced and convenient method to quantify the carbon sink and carbon emissions of a certain region.
The economic valuation of forest carbon sink is of great significance for promoting the establishment and improvement of a carbon trading market. Based on the calculation of static carbon neutralization in the Qinling Mountains, this study used the NPV model to predict the value of carbon sink in the future. This method converted the future value into the current economic value through the discount rate. This method is suitable for the long-term forecast of economic value. Its core issue is the determination of the discount rate. The determination of the discount rate needs to be done according to the laws of the market and combined with a lot of experience, and with national conditions. This study estimates the carbon sink of two kinds of discount rate scenarios and found that the discount rate changes and has a great effect on the carbon market value fluctuations, This method can better marketize the value of carbon, and the results can also predict and reference the trend of the market value of carbon in the future, so as to establish a normal and healthy carbon trading market, and further accelerate the pace of carbon neutrality by economic means.

Author Contributions

Conceptualization, J.L. and X.M.; methodology, X.M. and T.W.; software, X.M., T.W. and P.Z.; validation, X.M., K.Z. and T.W.; formal analysis, T.W. and K.Z.; investigation, T.W.; resources, T.W. and K.Z.; data curation, X.M.; writing—original draft preparation, X.M.; writing—review and editing, X.M.; visualization, X.M.; supervision, K.Z.; project administration, K.Z. and T.W.; funding acquisition, T.W. and P.Z. All authors have read and agreed to the published version of the manuscript.

Funding

This research was funded by the General Project of National Natural Science Foundation of China, grant number 42071285, 41771576; Natural Science Basic Research Project of Science and Technology Department of Shaanxi Province (Youth Project), grant number 2021JQ-818; and Shaanxi Key Industry Innovation Chain (Group) project, grant number 2020ZDLSF06-02.

Institutional Review Board Statement

This study was waived for ethical review and approval because it did not involve human or animal research.

Data Availability Statement

The data are not publicly available due to the data will be used in future studies.

Conflicts of Interest

The authors declare no conflict of interest.

References

  1. Zhou, J.; Su, H.J.; Wu, Q. China EU inter organization cooperative research project mix-up helps to achieve “carbon neutrality”. J. Biosci. Bioeng. 2021, 37, 1–11. [Google Scholar]
  2. Department of Industry and Information Technology of Yunnan Province, Department of Ecological Environment of Yunnan Province, Development Plan of Environmental Protection Industry in the 14th Five Year Plan of Yunnan Province. Available online: http://www.atcrr.org/show-20-8556-1.html (accessed on 1 July 2021).
  3. Muradov, N.Z.; Veziroglu, T.N. “Green” path from fossil-based to hydrogen economy: An overview of carbon-neutral technologies. Int. J. Hydrogen Energy 2008, 33, 6804–6839. [Google Scholar] [CrossRef]
  4. Butterman, H.C.; Castaldi, M.J. CO2 as a carbon neutral fuel source via enhanced biomass gasification. Environ. Sci. Technol. 2009, 43, 9030–9037. [Google Scholar] [CrossRef]
  5. Wrke, M.; Smith, B.; Remme, U. Nordic Energy Technology Perspectives: Pathways to a Carbon Neutral Energy Future; Smith, M., Ed.; OECD/IEA: Paris, France, 2013; Volume 4, pp. 255–297. [Google Scholar]
  6. Pearson, R.J.; Eisaman, M.D.; Turner, J.W.G.; Edwards, P.P.; Jiang, Z.; Kuznetsov, V.L.; Littau, K.A.; di Marco, L.; Taylor, S.R.G. Energy Storage via Carbon-Neutral Fuels Made From CO2, Water, and Renewable Energy. Proc. IEEE 2011, 100, 440–460. [Google Scholar] [CrossRef]
  7. Kennedy, C.; Bristow, D.; Derrible, S.; Mohareb, E.; Saneinejad, S.; Stupka, R.; Sugar, L.; Zizzo, R.; Mcintyra, B. Getting to Carbon Neutral: A Review of Best Practices in Infrastructure Strategy; Bose, R.K., Ed.; The International Bank for Reconstruction and Development: Washington, DC, USA, 2010; Volume 4, pp. 165–184. [Google Scholar]
  8. Syj, A.; Js, A.; Yu, J.; Lim, S.H.; Lee, J.Y.; Yoo, J.I.; Park, S.Y.; Na, J.; Park, S.J. A shortcut to carbon-neutral bioplastic production: Recent advances in microbial production of polyhydroxyalkanoates from C1 resources. Int. J. Biol. Macromol. 2021, 192, 978–998. [Google Scholar]
  9. Bartolini, A.; Salvi, D.; Pelagalli, L.; Caresana, F.; Comodi, G. Technological options towards a carbon neutral town in central Italy. In Proceedings of the E3S Web of Conference 2021, Ljubljana, Slovenia, 19 April 2021. [Google Scholar]
  10. Chen, X.; Liu, Y.; Wang, Q.; Lv, J.J.; Wen, J.Y.; Chen, X.; Kang, C.Q.; Cheng, S.J.; Michael, B.M. Pathway toward carbon-neutral electrical systems in China by mid-century with negative CO2 abatement costs informed by high-resolution modeling. Joule 2021, 10, 2715–2741. [Google Scholar] [CrossRef]
  11. Badole, S.; Roy, D.; Singh, L.K. Carbon Neutral Roadmap for Green India; New India Publisher Agency: New Delhi, India, 2021; Volume 3, pp. 191–222. [Google Scholar]
  12. Ding, Z.L.; Duan, X.N.; Ge, Q.S. Evaluation of international greenhouse gas emission reduction schemes and Discussion on China’s long-term emission rights. Sci. China Earth Sci. 2009, 39, 1659–1671. [Google Scholar]
  13. Guo, C.Z.; Wu, Y.Y.; Ni, J. Estimation of vegetation carbon storage in Tiantong National Forest Park. J. Appl. Ecol. 2014, 25, 3099–3109. [Google Scholar]
  14. Liu, Y.; Duan, M.; Zhao, Y.J. Study on decomposition of influencing factors of CO2 emission from China’s iron and steel industry based on LMDI method. Safe Environ. Eng. 2016, 23, 6–11. [Google Scholar]
  15. Fu, C.; Yu, G.R.; Fang, H.J. Impact of regional land use/Cover Change on land carbon budget in China. Program Geosci. 2012, 31, 88–96. [Google Scholar]
  16. Gatzsche, K.; Babel, W.; Falge, E.; Pyles, R.D.; Paw U, K.T.; Raabe, A.; Foken, T. Footprint-weighted tile approach for a spruce forest and a nearby patchy clearing using the ACASA model. Biogeosciences 2018, 15, 2945–2960. [Google Scholar] [CrossRef]
  17. Zhang, X.L.; Xiao, W.H.; Wang, Y.C. Temporal and spatial characteristics of NPP and climate driving mechanism in the Three Gorges Reservoir Area Based on the improved CASA model. J. Ecol. 2021, 41, 3488–3498. [Google Scholar]
  18. Hidy, D.; Barcza, Z.; Haszpra, L.; Churkin, G.; Pintére, K.; Nagyef, Z. Development of the Biome-BGC model for simulation of managed herbaceous ecosystems. Ecol. Model. 2015, 226, 99–119. [Google Scholar] [CrossRef]
  19. Jia, Y.C.; Chang, Y.; Ping, X.Y. Dynamic changes of forest carbon pool reserves in Huzhong National Nature Reserve under different intensity forest fire disturbance. J. Appl. Ecol. 2021, 32, 2325–2334. [Google Scholar]
  20. Lahiji, R.N.; Dinan, N.M.; Liaghati, H.; Ghaffarzadeh, H.; Vafaeinejad, A. Scenario-based estimation of catchment carbon storage: Linking multi-objective land allocation with InVEST model in a mixed agriculture-forest landscape. Front. Earth Sci. 2020, 14, 10. [Google Scholar] [CrossRef]
  21. Redhead, J.W.; May, L.; Oliver, T.H.; Perrine, H.; Richard, S.; James, M.B. National scale evaluation of the InVEST nutrient retention model in the United Kingdom. Sci. Total Environ. 2017, 610–611, 666–677. [Google Scholar] [CrossRef]
  22. Ke, X.L.; Tang, L.P. Impact of coupling urban expansion and cultivated land protection on terrestrial ecosystem carbon storage-Taking Hubei Province as an example. J. Econ. 2019, 39, 672–683. [Google Scholar]
  23. Li, W.; Huang, M.; Zhang, Y.D. Temporal and spatial dynamics of carbon storage and carbon sequestration rate in China’s national forest parks. J. Appl. Ecol. 2021, 32, 799–809. [Google Scholar]
  24. Li, T.; Li, J.; Wang, Y.Z. Spatial flow and pattern optimization of ecosystem carbon sequestration services in Guanzhong Tianshui Economic Zone. J. Agric. Sci. 2017, 50, 3953–3969. [Google Scholar]
  25. Chen, D.S.; Li, J.; Yang, X.N. Study on trade-off and optimization of ecosystem services in Weihe River Basin. J. Ecol. 2018, 38, 3260–3271. [Google Scholar]
  26. Li, J.; Li, H.Y.; Zhang, L. Balance and synergy of ecosystem services in Guanzhong Tianshui Economic Zone. J. Ecol. 2016, 36, 3053–3062. [Google Scholar]
  27. Lindsay, D. The Forest Sector: Part of the Solution to Climate Change. Pulp Pap-Can. 2015, 116, 10. [Google Scholar]
  28. Pan, Y.; Birdsey, R.A.; Fang, J.; Houghton, R.; Kauppi, P.E.; Kurz, W.A.; Phillips, O.L.; Shvidenko, A.; Lewis, S.L.; Canadell, J.G.; et al. A Large and Persistent Carbon Sink in the World’s Forests. Science 2011, 333, 988–993. [Google Scholar] [CrossRef]
  29. Natalija, M.; Igor, M.; Kreimir, M.; Damir, T.; Vlado, C.; Carlo, C.; Stanislav, F.B. Geochemical and isotopic characteristics of karstic springs in coastal mountains (Southern Croatia). J. Geochem. Explor. 2013, 132, 90–110. [Google Scholar]
  30. Sharafi, M.S.; Ghasemi, M.; Ahmadi, M.; Kazemi, A. An experimental approach for measuring carbon dioxide diffusion coefficient in water and oil under supercritical conditions. Chin. J. Chem. Eng. 2021, 34, 11. [Google Scholar] [CrossRef]
  31. Hirigoyen, A.; Acuna, M.; Rachid, C.C.; Franco, J.; Navarro, C.R. Use of Optimization Modeling to Assess the Effect of Timber and Carbon Pricing on Harvest Scheduling, Carbon Sequestration, and Net Present Value of Eucalyptus Plantations. Forests 2021, 12, 651. [Google Scholar] [CrossRef]
  32. Metcalf, G.E. Designing a Carbon Tax to Reduce, U.S. Greenhouse Gas Emissions. Rev. Environ. Econ. Policy 2009, 3, 14375–14410. [Google Scholar] [CrossRef]
  33. Dong, J.C.; Wei, D.; Ying, L. Forecasting Chinese Stock Market Prices using Baidu Search Index with a Learning-Based Data Collection Method. Int. J. Inf. Technol. Decis. Mak. 2019, 18, 68–79. [Google Scholar] [CrossRef]
  34. Anne, S.E.N.; Andrew, J.P.; Ralph, J.A. Mitigating climate change through afforestation: New cost estimates for the United States. Resour. Energy Econ. 2014, 36, 98–109. [Google Scholar]
  35. Nguyen, N.; Almarri, K.; Boussabaine, H. A risk-adjusted decoupled-net-present-value model to determine the optimal concession period of BOT projects. Built Environ. Proj. Asset Manag. 2020, 12, 59–68. [Google Scholar] [CrossRef]
  36. Guo, S.Z.; Bai, H.Y.; Meng, Q. Changes of landscape pattern in Qinling region from 1980 to 2015 and its response to human disturbance. J. Appl. Ecol. 2018, 29, 4080–4088. [Google Scholar]
  37. Liu, Y.Y.; Wang, Q.; Yang, Y. Temporal and spatial variation of vegetation carbon use efficiency (cue) in China from 2000 to 2013 and its relationship with meteorological factors. Res. Soil Water Conserv. 2019, 26, 278–288. [Google Scholar]
  38. Li, L.; Wang, X.Y.; Luo, L. Review of ecosystem service value evaluation methods. J. Ecol. 2018, 37, 1233–1245. [Google Scholar]
  39. Du, H.B.; Wei, W.; Zhang, X.Y. Temporal and spatial pattern evolution and influencing factors of carbon emission from energy consumption in the Yellow River Basin-Based on DMSP/OLS and NPP/viirs night light data. Geogr. Res. 2021, 40, 2051–2065. [Google Scholar]
  40. Zhao, J.C.; Ji, G.X.; Yue, Y.L. Spatio-temporal dynamics of urban residential CO2 emissions and their driving forces in China using the integrated two nighttime light datasets. Appl. Energy 2019, 235, 612–624. [Google Scholar] [CrossRef]
  41. Su, Y.X.; Chen, X.Z.; Ye, Y.Y. The characteristics and mechanisms of carbon emissions from energy consumption in China using DMSP/OLS night light imageries. Acta Geogr. Sin. 2013, 68, 1513–1526. [Google Scholar]
  42. Wu, X.X.; Liu, X.P.; Liang, X. Delimitation of urban growth boundary in the Pearl River Delta using FLUS-UGB multi-scenario simulation. J. Nat. Resour. 2018, 20, 532–542. [Google Scholar]
  43. Ickiewicz, I. Ecological and economic aspects of modernizing district heating systems in north-eastern Poland. Ecol. Chem. Eng. S 2011, 18, 429–443. [Google Scholar]
  44. Afshari, A.; Nikolopoulou, C.; Martin, M. Life-cycle analysis of building retrofits at the urban scale: A case study in United Arab Emirates. Sustainability 2014, 6, 453–473. [Google Scholar] [CrossRef]
  45. Han, L.Q. EU carbon tariff policy and its impact. Mod. Int. Relat. 2021, 5, 51–59. [Google Scholar]
  46. National Energy Information Platform. 2020 China Carbon Price Survey Report: Survey Report: The National Carbon Market is Expected to Mature in Five Years. Available online: https://baijiahao.baidu.com/s?id=1686225175184969784&wfr=spider&for=pc (accessed on 16 December 2020).
  47. Zaborski, K.; Bana, J.; Kouch, A. Determining the value of standing timber for harvest planning optimization. For. Res. Pap. 2020, 81, 65–74. [Google Scholar] [CrossRef]
  48. Li, T.; Li, J.; Yang, H. Estimation of soil carbon sequestration value based on remote sensing and carbon cycle process model-Taking Guanzhong Tianshui Economic Zone as an example. Arid Land Geogr. 2016, 39, 451–459. [Google Scholar]
  49. Ma, C.X.; Liu, J.J.; Kang, B.W.; Sun, S.H.; Ren, J.H. Evaluation of carbon sequestration and oxygen release service of forest ecosystem in Shaanxi Province from 1999 to 2003. Acta Ecol. Sin. 2010, 30, 1412–1422. [Google Scholar]
  50. Lv, D.R.; Ding, Z.L. Carbon budget certification and related issues in response to climate change. Proc. Natl. Acad. Sci. China 2012, 27, 395–402. [Google Scholar]
  51. Atwater, J.E.; Akse, J.R.; Dehart, J. Process for Analyzing CO2 in Air and in Water. U.S. Patent 5910448, 6 August 1999. [Google Scholar]
  52. Zhang, Z.; Wei, C.H.; Liu, S.Y. Numerical simulation study on the influence of coal particle size on gas diffusion process. Miner. Resour. Dev. 2021, 41, 85–92. [Google Scholar]
  53. Fortes, P.; Simoes, S.G.; Amorim, F.; Siggini, G.; Sessa, V.; Saint-Drenan, Y.M.; Carvalho, S.; Mujtaba, B.; Diogo, P.; Assoumou, E. How sensitive is a carbon-neutral power sector to climate change? The interplay between hydro, solar and wind for Portugal. Energy 2022, 22, 239. [Google Scholar] [CrossRef]
  54. Kuittinen, S.; Hietaharju, J.; Kupiainen, L. Bioethanol production from short rotation S. schwerinii E. Wolf is carbon neutral with utilization of waste-based organic fertilizer and process carbon dioxide capture. J. Clean. Prod. 2021, 293, 126088. [Google Scholar] [CrossRef]
  55. Berger, M.; Radu, D.; Detienne, G. Remote Renewable Hubs For Carbon-Neutral Synthetic Fuel Production. Front. Energy Res. 2021, 9, 200. [Google Scholar] [CrossRef]
  56. Rosa, L.; Sanchez, D.L.; Mazzotti, M. Assessment of carbon dioxide removal potential via BECCS in a carbon-neutral Europe. Energy Environ. Sci. 2021, 14, 222–238. [Google Scholar] [CrossRef]
  57. Tonietto, R.; O’Brien, L.; Haitsma, C.V. Toward a carbon neutral campus: A scalable approach to estimate carbon storage and biosequestration, an example from University of Michigan. Int. J. Sustain. High. Educ. 2021, 22, 598–610. [Google Scholar] [CrossRef]
  58. Nieuwenhuijsen, M.J. Urban and transport planning pathways to carbon neutral, liveable and healthy cities; A review of the current evidence. Environ. Int. 2020, 140, 105661. [Google Scholar] [CrossRef]
  59. Dan, Z. Carbon peak and carbon neutrality promote the development of geothermal power industry. Sino-Glob. Energy 2022, 27, 59. [Google Scholar]
  60. Chen, Z.C.; Qiang, H.; Ran, C.; Luo, H.R.; Luo, N.; Song, Z.X.; Cheng, H. Development and comprehensive application of mathematical simulation in wastewater treatment system under carbon neutralization trend. J. Environ. Sci. 2022, 12, 1–23. [Google Scholar]
  61. Wu, L.J.; Tian, Q.B. Carbon ecological security and ecological compensation in China under carbon neutralization goal. Geogra Res. 2022, 41, 149–166. [Google Scholar]
Figure 1. Overview of the study area.
Forests 13 00407 g001
Figure 2. Spatial distribution of carbon density, carbon sequestration, and carbon sequestration rate in Qinling Mountains.
Forests 13 00407 g002
Figure 3. Temporal and spatial distribution of carbon emission in Qinling Mountains.
Forests 13 00407 g003
Figure 4. Temporal and spatial variation of carbon sink in Qinling Mountains.
Forests 13 00407 g004
Figure 5. Spatial and temporal distribution of carbon neutralization service range at pixel scale in Qinling Mountains.
Forests 13 00407 g005
Figure 6. Diffusion range of carbon neutralization space services in the Qinling Mountains.
Forests 13 00407 g006
Figure 7. Simulation of carbon neutrality spatial distribution (a) and its spatial service scope in 2030 and 2050 for the Qinling Mountains (b).
Forests 13 00407 g007
Figure 8. Spatial distribution of carbon sink value and grading proportion in Qinling Mountains in 2012, 2016, and 2020.
Forests 13 00407 g008
Figure 9. Spatial distribution of carbon sink value in Qinling Mountains in 2030 and 2050.
Forests 13 00407 g009
Table 1. Carbon emission simulation regression parameters.
YearFitting FormulaR2
2012Y = 0.430 7x + 6.7430.8568
2016Y = 2.0526x − 665.60.943
2020Y = 1.501 9x − 490.930.8516
Table 2. Classification statistics of carbon sequestration.
Carbon Density (t/ha)201220162020
0–1502.24%2.93%3.74%
150–30093.55%93.14%91.67%
>3004.21%9.93%4.59%
Carbon Sequestration (t)201220162020
0–20001.58%1.58%3.23%
2000–500045.8%48.11%28.31%
>500052.62%50.31%68.46%
Rate of Carbon Sequestration (t/ha/a)2012–20162016–20202012–2020
<01.71%17.3%2.2%
0–1597.9882.41%97.79%
>150.31%0.29%0.01%
Table 3. Classification statistics of carbon neutral.
Carbon Neutral (tons)201220162020
<01.37%1.38%3.11%
0–500046.75%61.69%60.11%
≥500051.88%36.93%36.78%
Table 4. Qinling Mountains carbon neutral service scope grade division pixel ratio.
Carbon Neutral Service Range201220162020
01.10%1.38%3.10%
0–500068.55%84.21%75.98%
≥500030.35%14.41%20.92%
Table 5. Carbon sink value of Qinling Mountains under different discount rates in 2030 and 2050.
r = 0.03r = 0.05r = 0.07
2030689.05 × 108 CNY469.94 × 108 CNY483.82 × 108 CNY
2050762.56 × 108 CNY493.21 × 108 CNY148.65 × 108 CNY
Publisher’s Note: MDPI stays neutral with regard to jurisdictional claims in published maps and institutional affiliations.

