
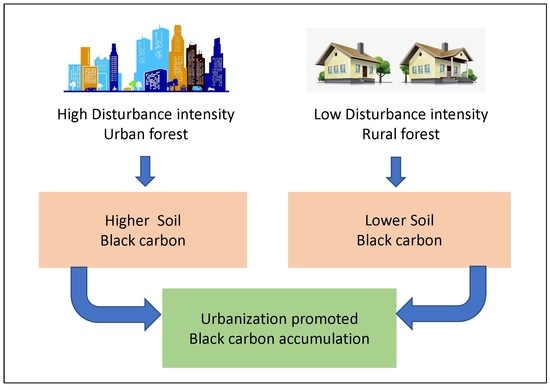
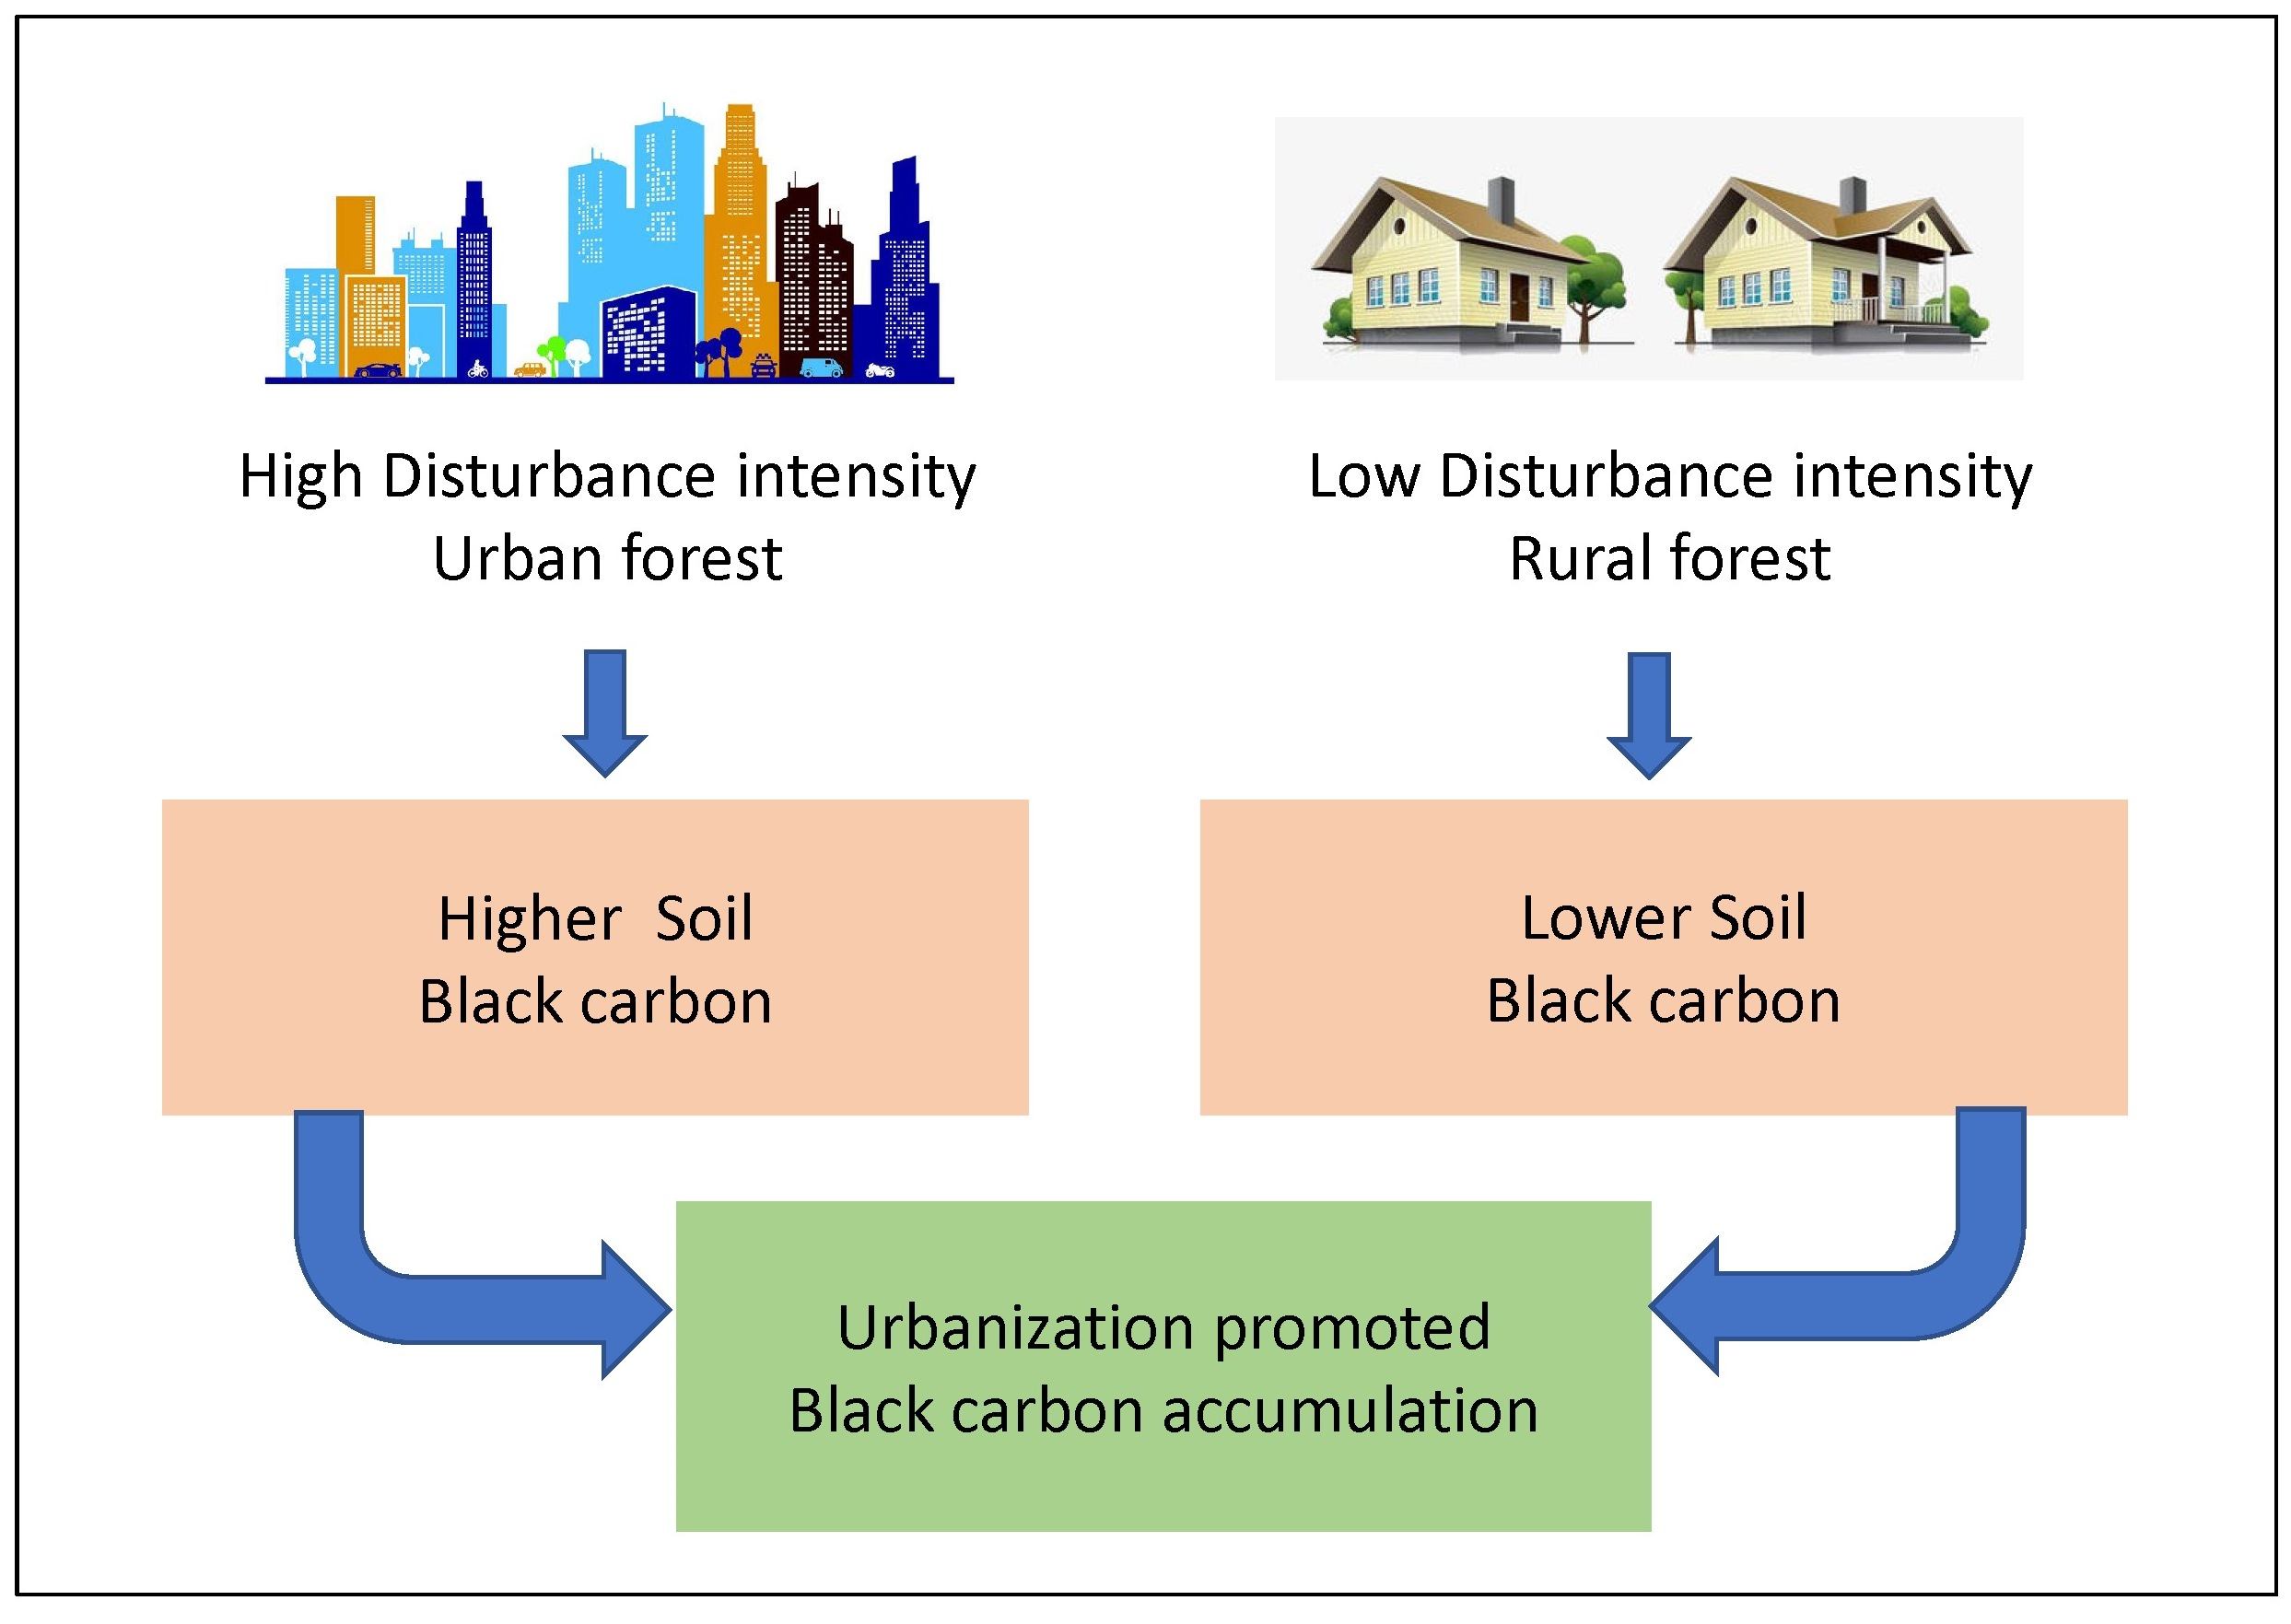
Effects of Urbanization Intensity on the Distribution of Black Carbon in Urban Surface Soil in South China


Abstract
:
1. Introduction
2. Materials and Methods
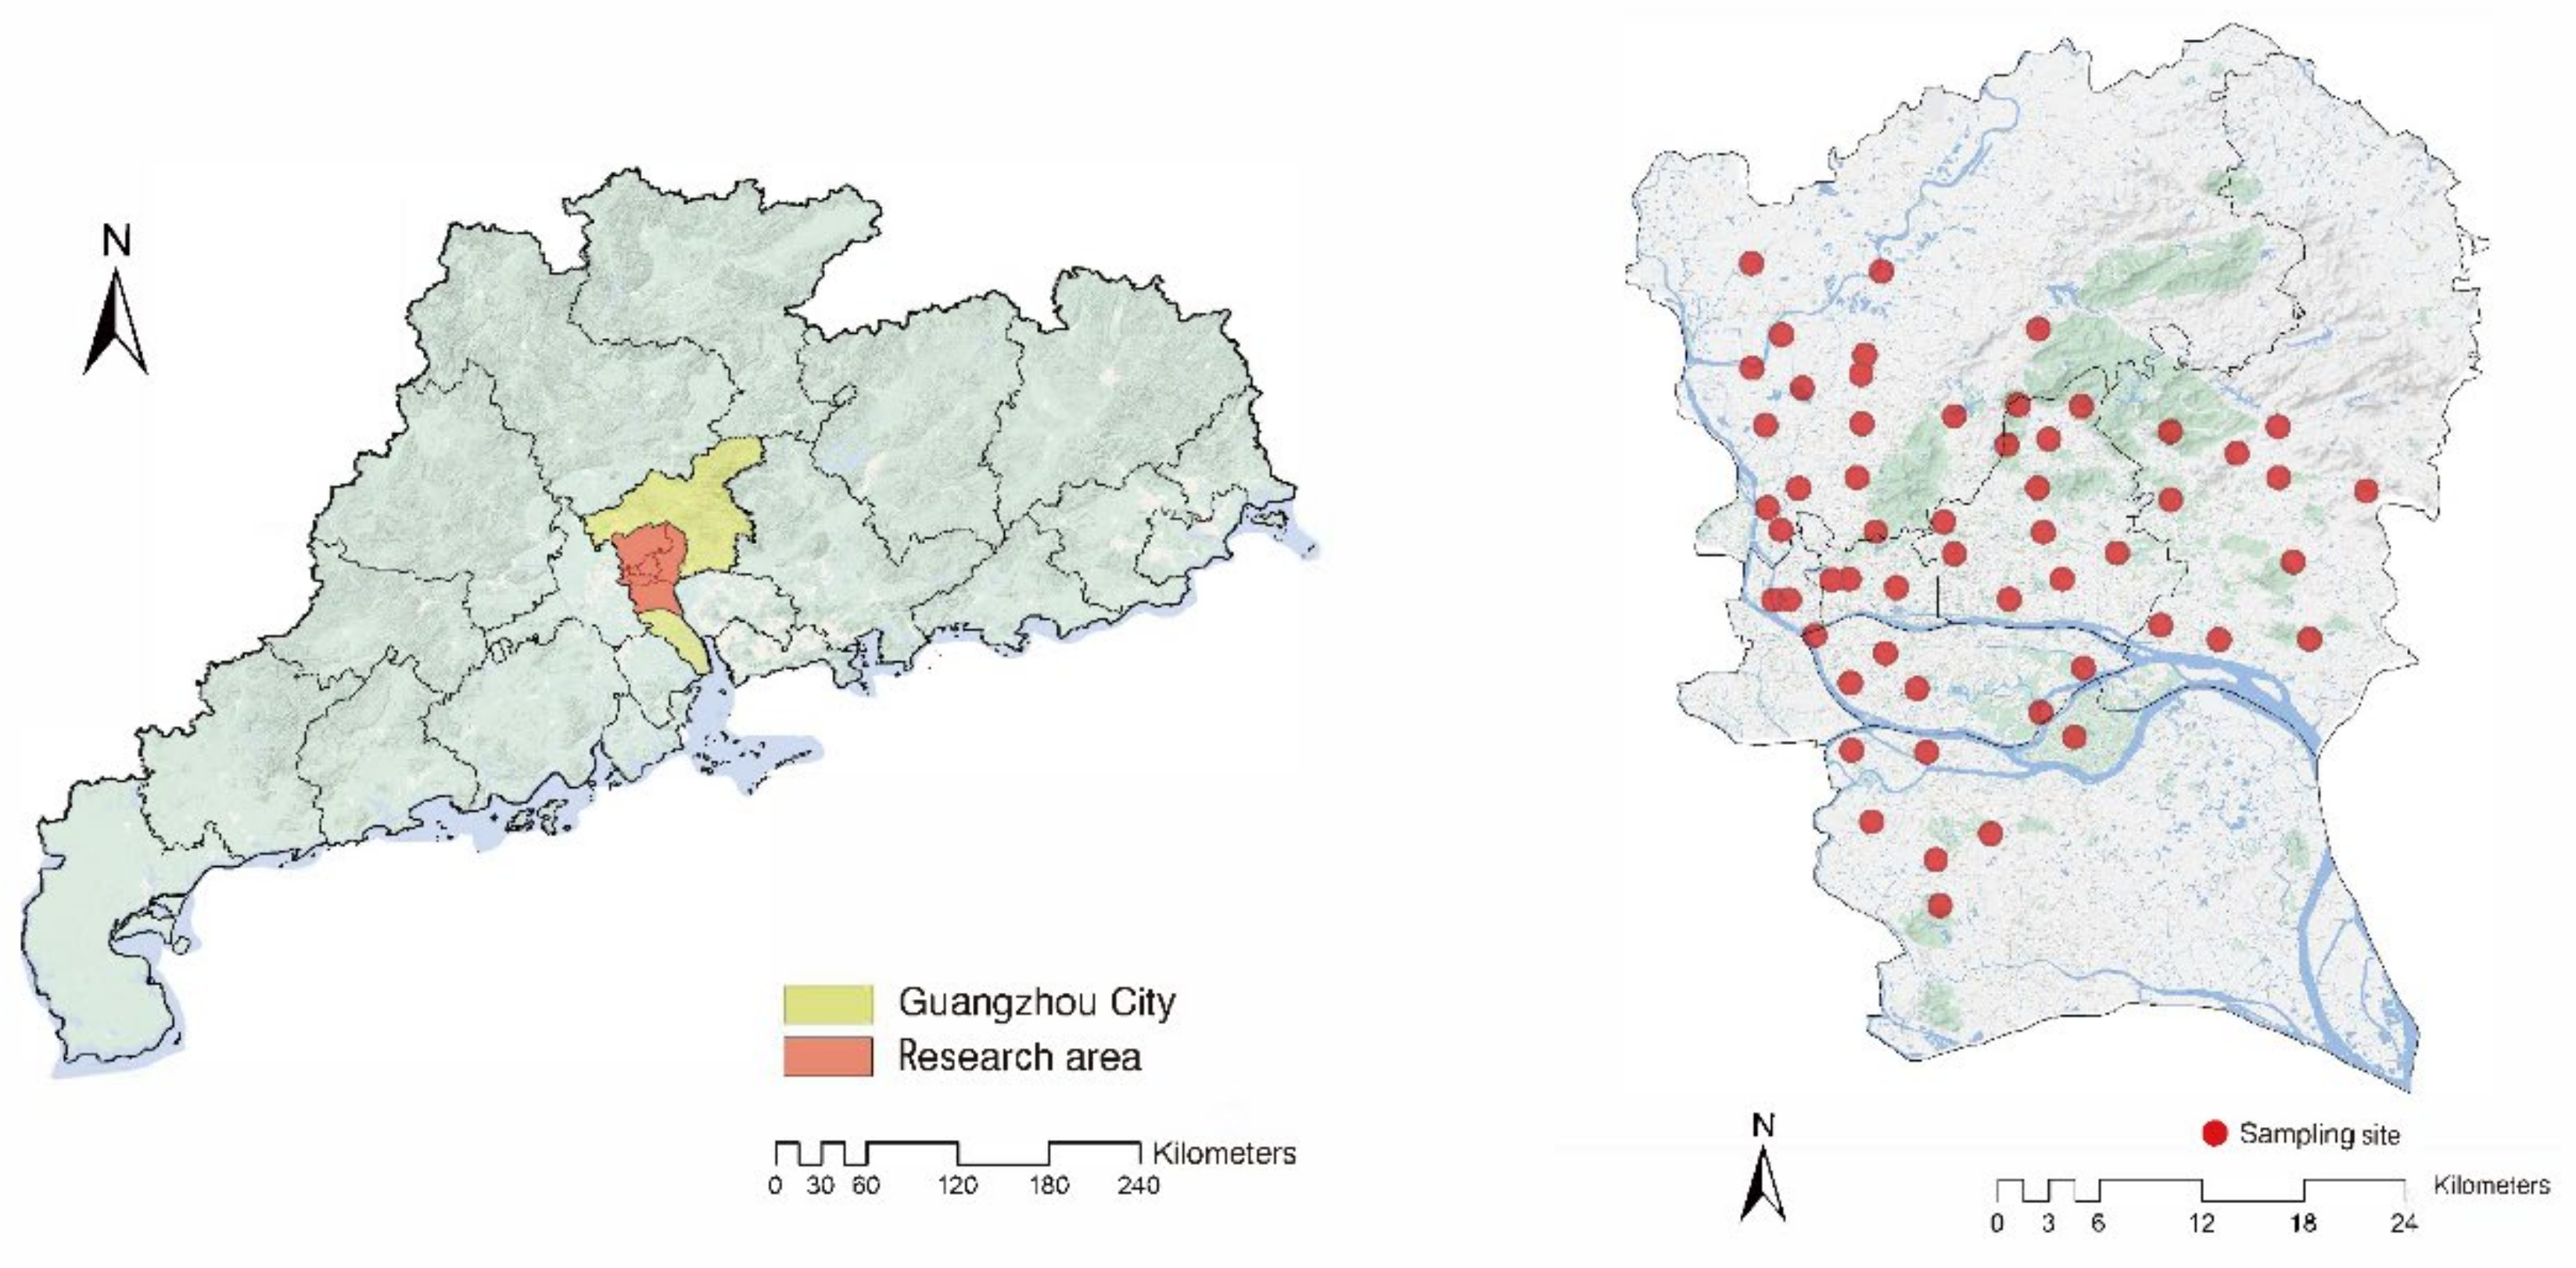
2.1. Research Area and Soil Sampling
2.2. Laboratory Analysis
2.3. Calculations and Statistical Analysis
3. Results
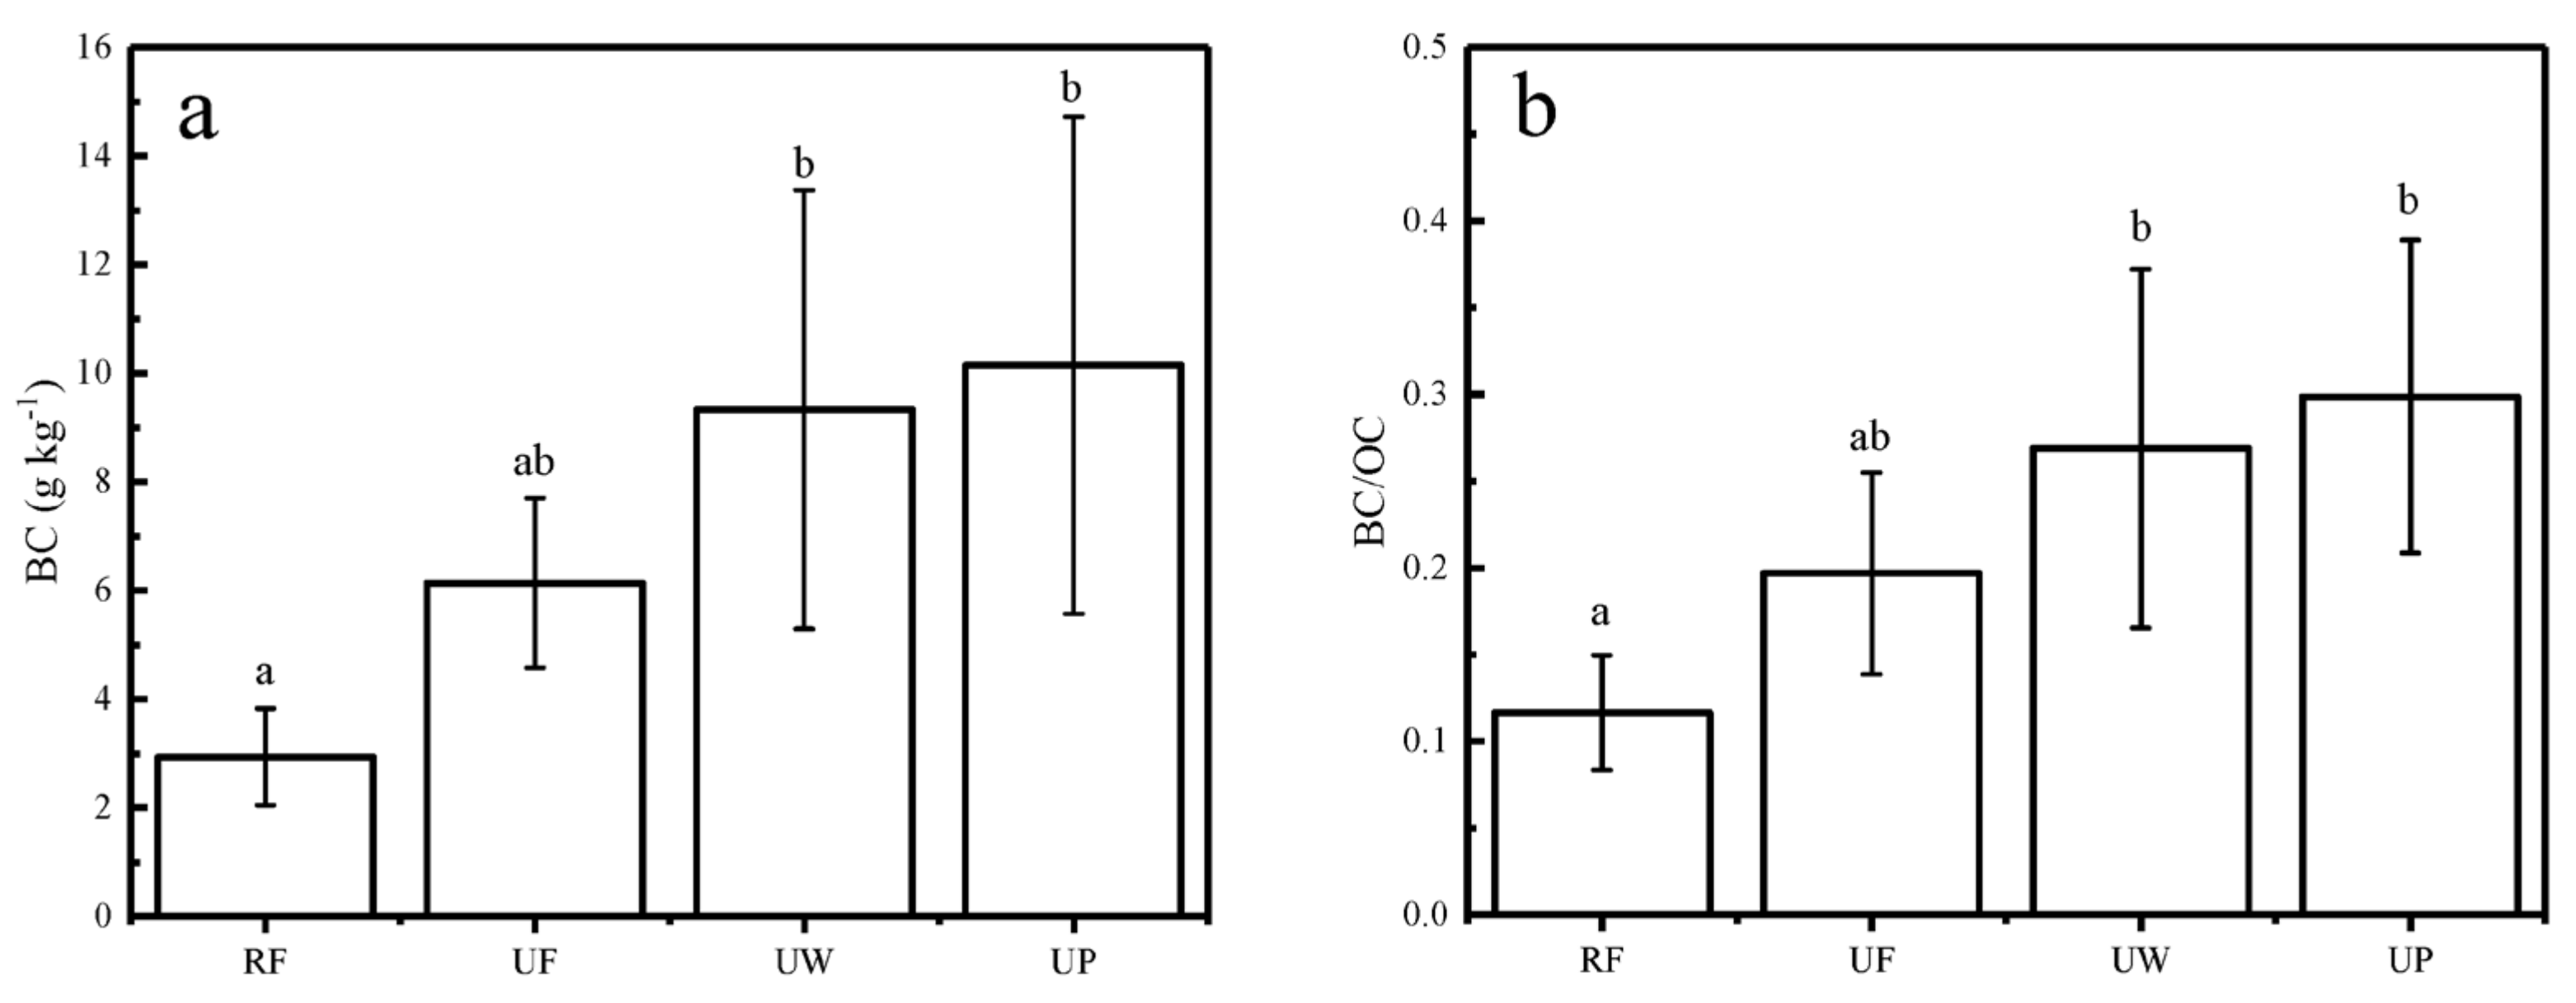
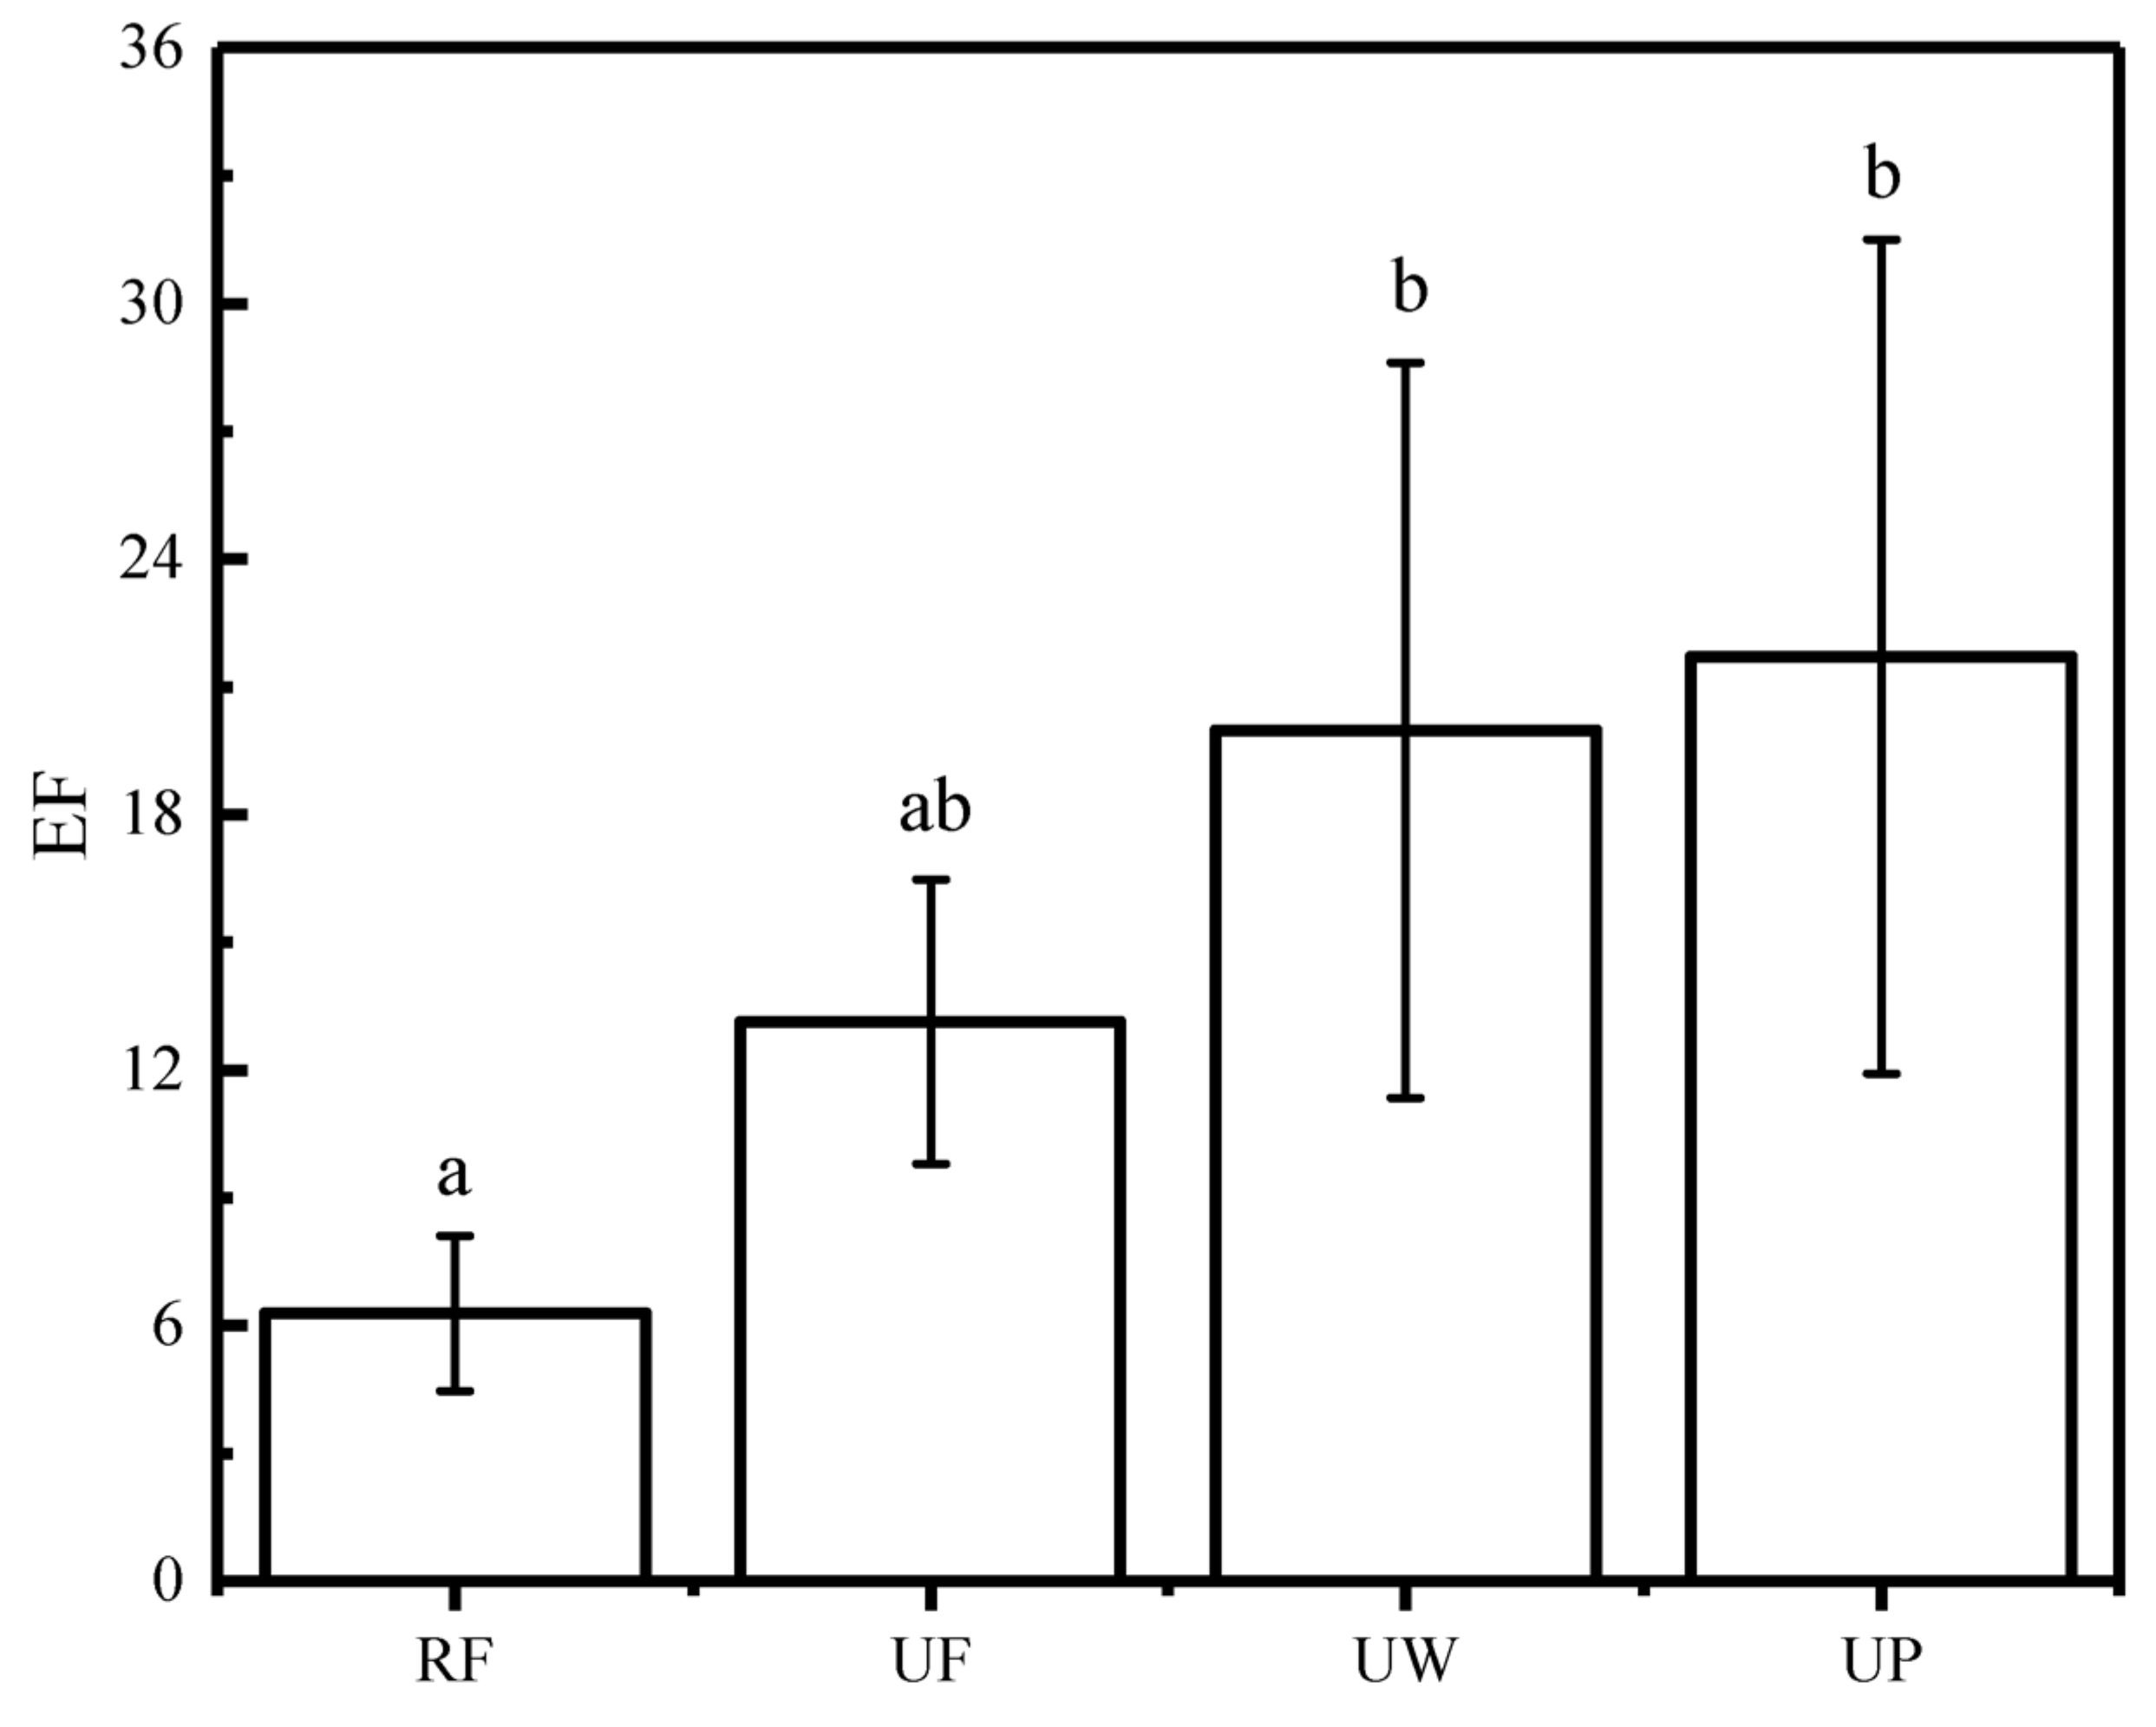
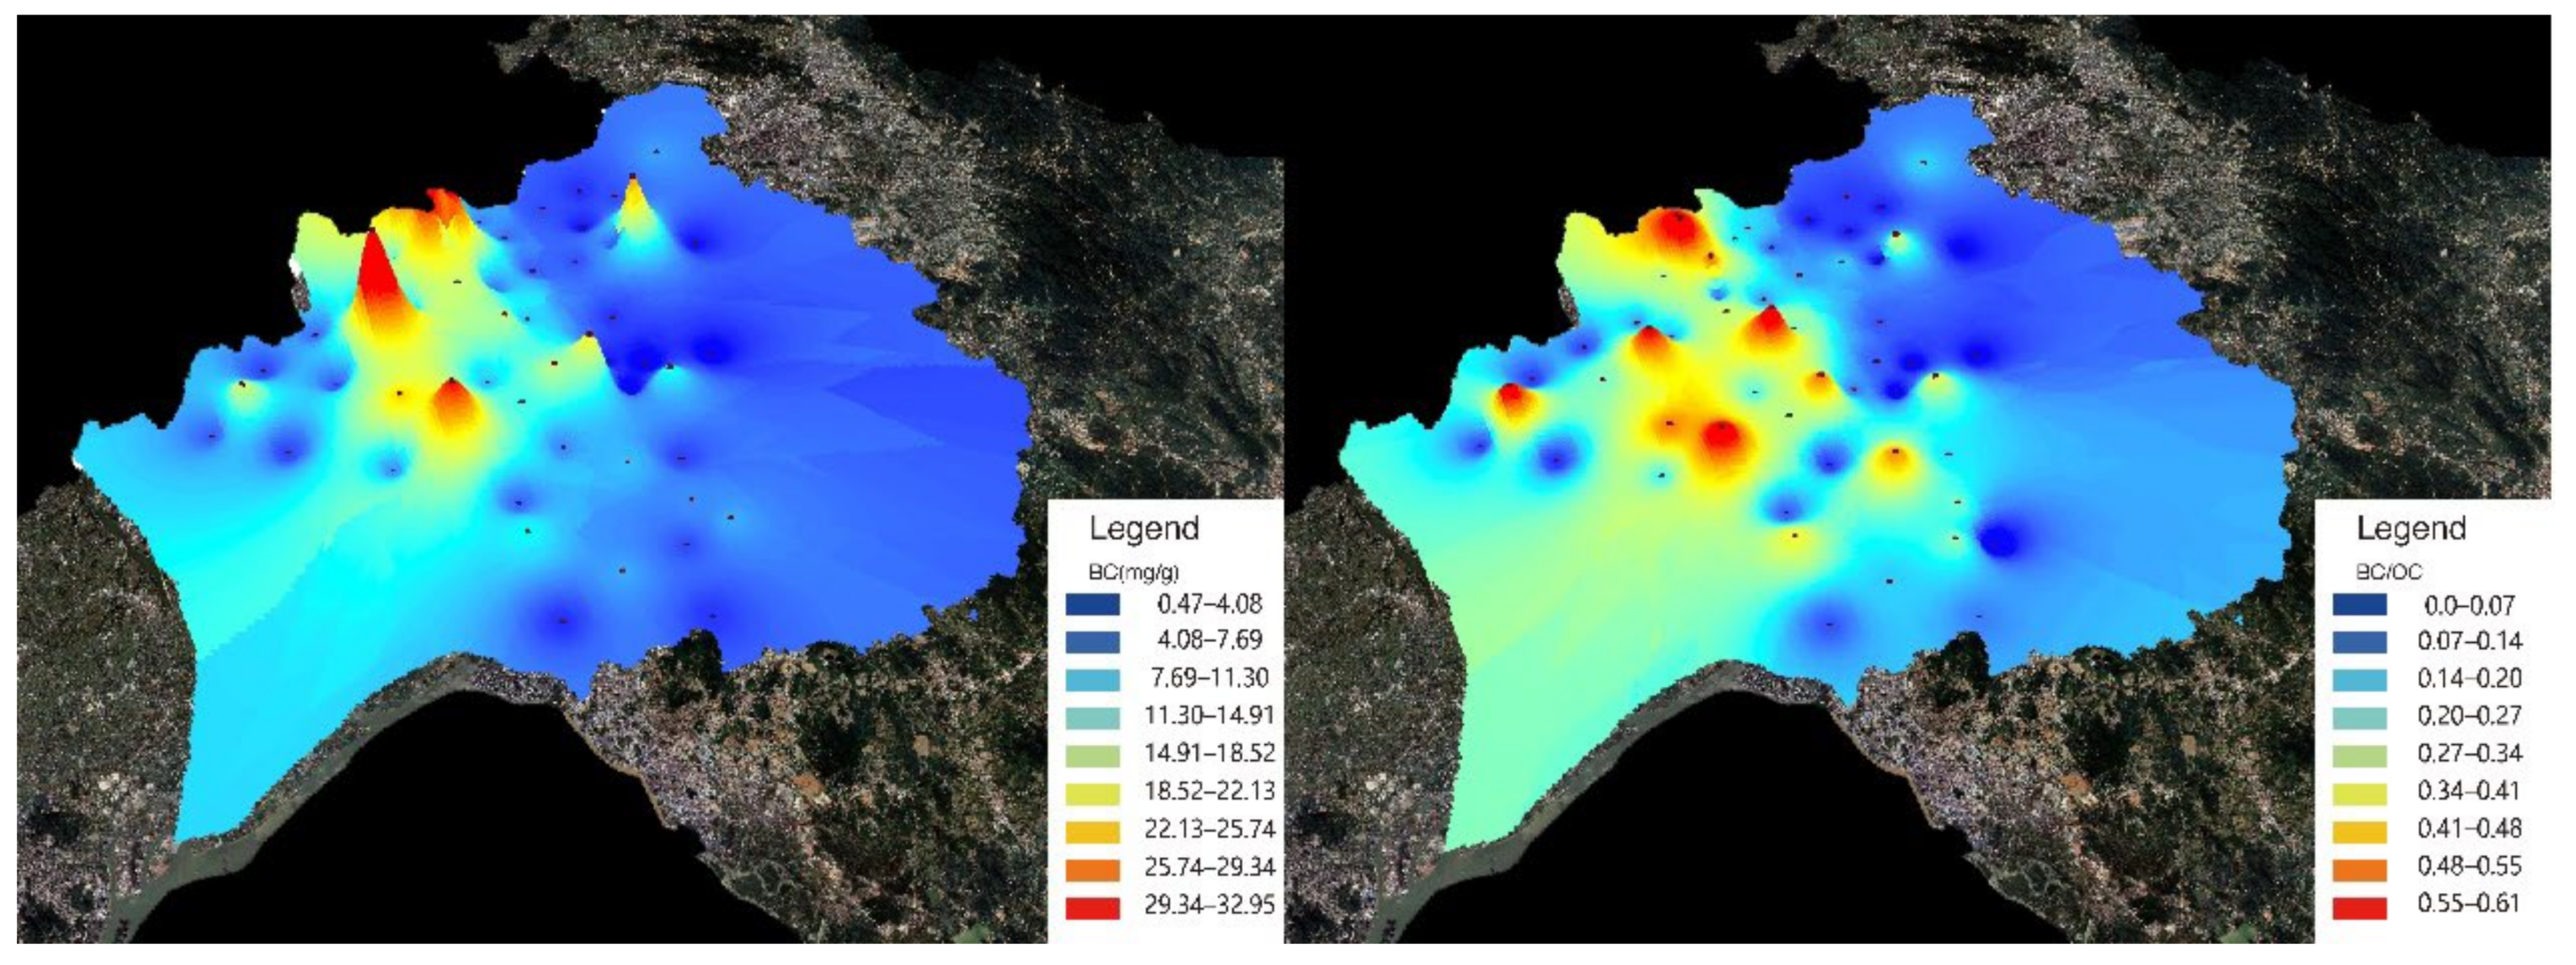
3.1. Spatial Distribution of BC in Surface Soils
3.2. Effects of Urbanization Intensity of Environmental Gradient on the Content of BC in Surface Soils
3.3. Effects of Urbanization Intensity of the Urban Built Environment on the Content of BC in Surface Soils
4. Discussion
4.1. Impact of Urbanization as Reflected by BC
4.2. Correlation between Different BC Indexes and Its Sources
5. Conclusions
Supplementary Materials
Author Contributions
Funding
Institutional Review Board Statement
Informed Consent Statement
Data Availability Statement
Acknowledgments
Conflicts of Interest
References
- Masiello, C.A.; Druffel, E.R.M. Black Carbon in Deep-Sea Sediments. Science 1998, 280, 1911–1913. [Google Scholar] [CrossRef] [PubMed] [Green Version]
- Kuhlbusch, T.A.J. Black Carbon and the Carbon Cycle. Science 1998, 280, 1903–1904. [Google Scholar] [CrossRef]
- Jacobsen, M.Z. Control of fossil-fuel particulate black carbon and organic matter, possibly the most effective method of slowing global warming. J. Geophys. Res. Atmos. 2005, 107, 4410. [Google Scholar] [CrossRef] [Green Version]
- Liu, D.; Joshi, R.; Wang, J.; Yu, C.; Allan, J.D.; Coe, H.; Flynn, M.J.; Xie, C.; Lee, J.; Squires, F.; et al. Contrasting physical properties of black carbon in urban Beijing between winter and summer. Atmos. Chem. Phys. 2019, 19, 6749–6769. [Google Scholar] [CrossRef] [Green Version]
- Schmidt, M.W.I.; Skjemstad, J.O.; Czimczik, C.I.; Glaser, B.; Prentice, K.M.; Gelinas, Y.; Kuhlbusch, T.A.J. Comparative analysis of black carbon in soils. Glob. Biogeochem. Cycles 2001, 15, 163–167. [Google Scholar] [CrossRef] [Green Version]
- Edmondson, J.L.; Stott, I.; Potter, J.; Lopez-Capel, E.; Manning, D.; Gaston, K.J.; Leake, J. Black Carbon Contribution to Organic Carbon Stocks in Urban Soil. Environ. Sci. Technol. 2015, 49, 8339–8346. [Google Scholar] [CrossRef]
- Ramanathan, V.; Carmichael, G. Global and regional climate changes due to black carbon. Nat. Geosci. 2008, 1, 221–227. [Google Scholar] [CrossRef]
- Bond, T.C.; Doherty, S.J.; Fahey, D.W.; Forster, P.M.; Berntsen, T.; DeAngelo, B.J.; Flanner, M.G.; Ghan, S.J.; Kärcher, B.; Koch, D.; et al. Bounding the role of black carbon in the climate system: A scientific assessment. J. Geophys. Res. Atmos. 2013, 118, 5380–5552. [Google Scholar] [CrossRef]
- Baumgartner, J.; Zhang, Y.; Schauer, J.J.; Huang, W.; Wang, Y.; Ezzati, M. Highway proximity and black carbon from cookstoves as a risk factor for higher blood pressure in rural China. Proc. Natl. Acad. Sci. USA 2014, 111, 13229–13234. [Google Scholar] [CrossRef] [Green Version]
- Zong, Y.; Xiao, Q.; Lu, S. Morphology, molecular structure, and stable carbon isotopic composition of black carbon (BC) in urban topsoils. Environ. Sci. Pollut. Res. 2017, 25, 3301–3312. [Google Scholar] [CrossRef]
- Gatari, M.J.; Boman, J. Black carbon and total carbon measurements at urban and rural sites in Kenya, East Africa. Atmos. Environ. 2003, 37, 1149–1154. [Google Scholar] [CrossRef]
- Han, Y.; Cao, J.; Chow, J.; Watson, J.; An, Z.; Liu, S. Elemental carbon in urban soils and road dusts in Xi’an, China and its implication for air pollution. Atmos. Environ. 2009, 43, 2464–2470. [Google Scholar] [CrossRef]
- He, Y.; Zhang, G.-L. Historical record of black carbon in urban soils and its environmental implications. Environ. Pollut. 2009, 157, 2684–2688. [Google Scholar] [CrossRef]
- Min, X.; Wu, J.; Lu, J.; Wen, X.; Gao, C.; Li, L. Distribution of Black Carbon in Topsoils of the Northeastern Qinghai-Tibet Plateau Under Natural and Anthropogenic Influences. Arch. Environ. Contam. Toxicol. 2019, 76, 528–539. [Google Scholar] [CrossRef]
- Li, Y.; Kang, S.; Chen, J.; Hu, Z.; Wang, K.; Paudyal, R.; Liu, J.; Wang, X.; Qin, X.; Sillanpää, M. Black carbon in a glacier and snow cover on the northeastern Tibetan Plateau: Concentrations, radiative forcing and potential source from local topsoil. Sci. Total Environ. 2019, 686, 1030–1038. [Google Scholar] [CrossRef] [PubMed]
- Gautam, S.; Yan, F.; Kang, S. Black carbon in surface soil of the Himalayas and Tibetan Plateau. Environ. Sci. Pollut. Res. 2020, 27, 2670–2676. [Google Scholar] [CrossRef] [PubMed]
- Hamilton, G.A.; Hartnett, H.E. Soot black carbon concentration and isotopic composition in soils from an arid urban ecosystem. Org. Geochem. 2013, 59, 87–94. [Google Scholar] [CrossRef]
- Wang, Q.; Liu, M.; Yu, Y.; Du, F.; Wang, X. Black carbon in soils from different land-use areas of Shanghai, China: Level, sources and relationship with polycyclic aromatic hydrocarbons. Appl. Geochem. 2014, 47, 36–43. [Google Scholar] [CrossRef]
- Vasenev, V.; Kuzyakov, Y. Urban soils as hot spots of anthropogenic carbon accumulation: Review of stocks, mechanisms and driving factors. Land Degrad. Dev. 2018, 29, 1607–1622. [Google Scholar] [CrossRef]
- Wang, X.S. Black carbon in urban topsoils of Xuzhou (China): Environmental implication and magnetic proxy. Environ. Monit. Assess. 2009, 163, 41–47. [Google Scholar] [CrossRef]
- Liu, S.; Xia, X.; Zhai, Y.; Wang, R.; Liu, T.; Zhang, S. Black carbon (BC) in urban and surrounding rural soils of Beijing, China: Spatial distribution and relationship with polycyclic aromatic hydrocarbons (PAHs). Chemosphere 2011, 82, 223–228. [Google Scholar] [CrossRef] [PubMed]
- Skjemstad, J.O.; Reicosky, D.C.; Wilts, A.R.; McGowan, J.A. Charcoal Carbon in U.S. Agricultural Soils. Soil Sci. Soc. Am. J. 2002, 66, 1249–1255. [Google Scholar] [CrossRef] [Green Version]
- Czimczik, C.I.; Preston, C.M.; Schmidt, M.W.I.; Schulze, E.D. How surface fire in Siberian Scots pine forests affects soil organic carbon in the forest floor: Stocks, molecular structure, and conversion to black carbon (charcoal). Glob. Biogeochem. Cycles 2003, 17, 1020. [Google Scholar] [CrossRef] [Green Version]
- Dai, X.; Boutton, T.; Glaser, B.; Ansley, R.; Zech, W. Black carbon in a temperate mixed-grass savanna. Soil Biol. Biochem. 2005, 37, 1879–1881. [Google Scholar] [CrossRef]
- Ansley, R.J.; Boutton, T.; Skjemstad, J.O. Soil organic carbon and black carbon storage and dynamics under different fire regimes in temperate mixed-grass savanna. Glob. Biogeochem. Cycles 2006, 20, GB3006. [Google Scholar] [CrossRef]
- Rumpel, C.; Alexis, M.; Chabbi, A.; Chaplot, V.; Rasse, D.; Valentin, C.; Mariotti, A. Black carbon contribution to soil organic matter composition in tropical sloping land under slash and burn agriculture. Geoderma 2006, 130, 35–46. [Google Scholar] [CrossRef]
- Yin, Y.F.; Yang, Y.S.; Gao, R.; Chen, G.S.; Zhao, Y.C. Effects of slash burning on soil organic carbon and black carbon in Chinese fir plantation. Acta Pedol. Sin. 2016, 46, 352–355. [Google Scholar]
- Kopecký, M.; Kolář, L.; Váchalová, R.; Konvalina, P.; Batt, J.; Mráz, P.; Menšík, L.; Hoang, T.N.; Dumbrovský, M. Black Carbon and Its Effect on Carbon Sequestration in Soil. Agronomy 2021, 11, 2261. [Google Scholar] [CrossRef]
- Zong, Y.; Xiao, Q.; Lu, S. Black carbon (BC) of urban topsoil of steel industrial city (Anshan), Northeastern China: Concentration, source identification and environmental implication. Sci. Total Environ. 2016, 569–570, 990–996. [Google Scholar] [CrossRef] [PubMed]
- Ruellan, S.; Cachier, H. Characterisation of fresh particulate vehicular exhausts near a Paris high flow road. Atmos. Environ. 2001, 35, 453–468. [Google Scholar] [CrossRef]
- Bucheli, T.D.; Blum, F.; Desaules, A.; Gustafsson, Ö. Polycyclic aromatic hydrocarbons, black carbon, and molecular markers in soils of Switzerland. Chemosphere 2004, 56, 1061–1076. [Google Scholar] [CrossRef] [PubMed]
- Xia, X.; Chen, X.; Liu, R.; Liu, H. Heavy metals in urban soils with various types of land-use in Beijing, China. J. Hazard. Mater. 2011, 186, 2043–2050. [Google Scholar] [CrossRef] [PubMed]
- Bae, J.; Ryu, Y. Land-use and land cover changes explain spatial and temporal variations of the soil organic carbon stocks in a constructed urban park. Landsc. Urban Plan. 2015, 136, 57–67. [Google Scholar] [CrossRef]
- Liu, R.; Wang, M.; Chen, W.; Peng, C. Spatial pattern of heavy metals accumulation risk in urban soils of Beijing and its influencing factors. Environ. Pollut. 2016, 210, 174–181. [Google Scholar] [CrossRef] [PubMed]
- Semple, K.T.; Riding, M.J.; McAllister, L.E.; Sopena-Vazquez, F.; Bending, G. Impact of black carbon on the bioaccessibility of organic contaminants in soil. J. Hazard. Mater. 2013, 261, 808–816. [Google Scholar] [CrossRef]
- Liu, Y.H.; Wang, X.S.; Guo, Y.H.; Mao, Y.M.; Li, H. Association of black carbon with heavy metals and magnetic properties in soils adjacent to a cement plant, Xuzhou (China). J. Appl. Geophys. 2019, 170, 103802. [Google Scholar] [CrossRef]
- Ali, M.U.; Siyi, L.; Yousaf, B.; Abbas, Q.; Hameed, R.; Zheng, C.; Kuang, X.; Wong, M.H. Emission sources and full spectrum of health impacts of black carbon associated polycyclic aromatic hydrocarbons (PAHs) in urban environment: A review. Crit. Rev. Environ. Sci. Technol. 2020, 51, 857–896. [Google Scholar] [CrossRef]
- quality management with green infrastructure. Sci. Total Environ. 2018, 644, 1027–1035. [CrossRef]
- Yu, S.; Qiu, J.; Chen, X.; Luo, X.; Yang, X.; Wang, F.; Xu, G. Soil Mesofauna Community Changes in Response to the Environmental Gradients of Urbanization in Guangzhou City. Front. Ecol. Evol. 2021, 8, 546433. [Google Scholar] [CrossRef]
- Yeomans, J.C.; Bremner, J.M. A rapid and precise method for routine determination of organic carbon in soil. Commun. Soil Sci. Plant Anal. 1988, 19, 1467–1476. [Google Scholar] [CrossRef]
- Lim, B.; Cachier, H. Determination of black carbon by chemical oxidation and thermal treatment in recent marine and lake sediments and Cretaceous-Tertiary clays. Chem. Geol. 1996, 131, 143–154. [Google Scholar] [CrossRef]
- Oshan, T.M.; Li, Z.; Kang, W.; Wolf, L.J.; Fotheringham, A.S. mgwr: A Python Implementation of Multiscale Geographically Weighted Regression for Investigating Process Spatial Heterogeneity and Scale. ISPRS Int. J. Geo-Inf. 2019, 8, 269. [Google Scholar] [CrossRef] [Green Version]
- Jaime, B.; Marc, G.; Oriol, J. Local Traffic Contribution to Black Carbon Horizontal and Vertical Profiles in Compact Urban Areas. In Book of Abstracts; Barcelona Supercomputing Center: Barcelona, Spain, 2019; pp. 79–80. [Google Scholar]
- in urban topsoils and environmental implications. Int. J. Environ. Stud. 2012, 69, 705–713. [CrossRef]
- Ray, S.; Khillare, P.S.; Kim, K.-H.; Brown, R. Distribution, Sources, and Association of Polycyclic Aromatic Hydrocarbons, Black Carbon, and Total Organic Carbon in Size-Segregated Soil Samples Along a Background–Urban–Rural Transect. Environ. Eng. Sci. 2012, 29, 1008–1019. [Google Scholar] [CrossRef] [Green Version]
- Ye, H.; Huang, W.; Huang, S.; Huang, Y.; Zhang, S.; Dong, Y.; Chen, P. Effects of different sampling densities on geographically weighted regression kriging for predicting soil organic carbon. Spat. Stat. 2017, 20, 76–91. [Google Scholar] [CrossRef]
- Brodowski, S.; Amelung, W.; Haumaier, L.; Zech, W. Black carbon contribution to stable humus in German arable soils. Geoderma 2007, 139, 220–228. [Google Scholar] [CrossRef]


| Location | Anthropogenic Wastes | Aboveground Litter Layer | Management | Disturbance Intensity | |
|---|---|---|---|---|---|
| Rural forest (RF, 9 sites) | Rural | No | completed | No | Very low |
| Urban forest (UF, 19 sites) | Urban | Little | completed | No | Low |
| Urban woodland (UW, 15 sites) | Urban | Much | completed | No | High |
| Urban park (UP, 12 sites) | Urban | Little | absent | Yes | High |
| Scales | Variable | Mean | STD | Min | Median | Max | p |
|---|---|---|---|---|---|---|---|
| 500 m R2 = 0.19 | LUD | 0.015 | 0.047 | −0.050 | 0.005 | 0.101 | 0.608 |
| PI | −0.052 | 0.035 | −0.098 | −0.058 | 0.014 | 0.701 | |
| PPG | 0.106 | 0.063 | −0.006 | 0.103 | 0.204 | 0.829 | |
| PD | 0.097 | 0.014 | 0.061 | 0.098 | 0.122 | 0.356 | |
| PIS | −0.101 | 0.079 | −0.237 | −0.103 | 0.024 | 0.681 | |
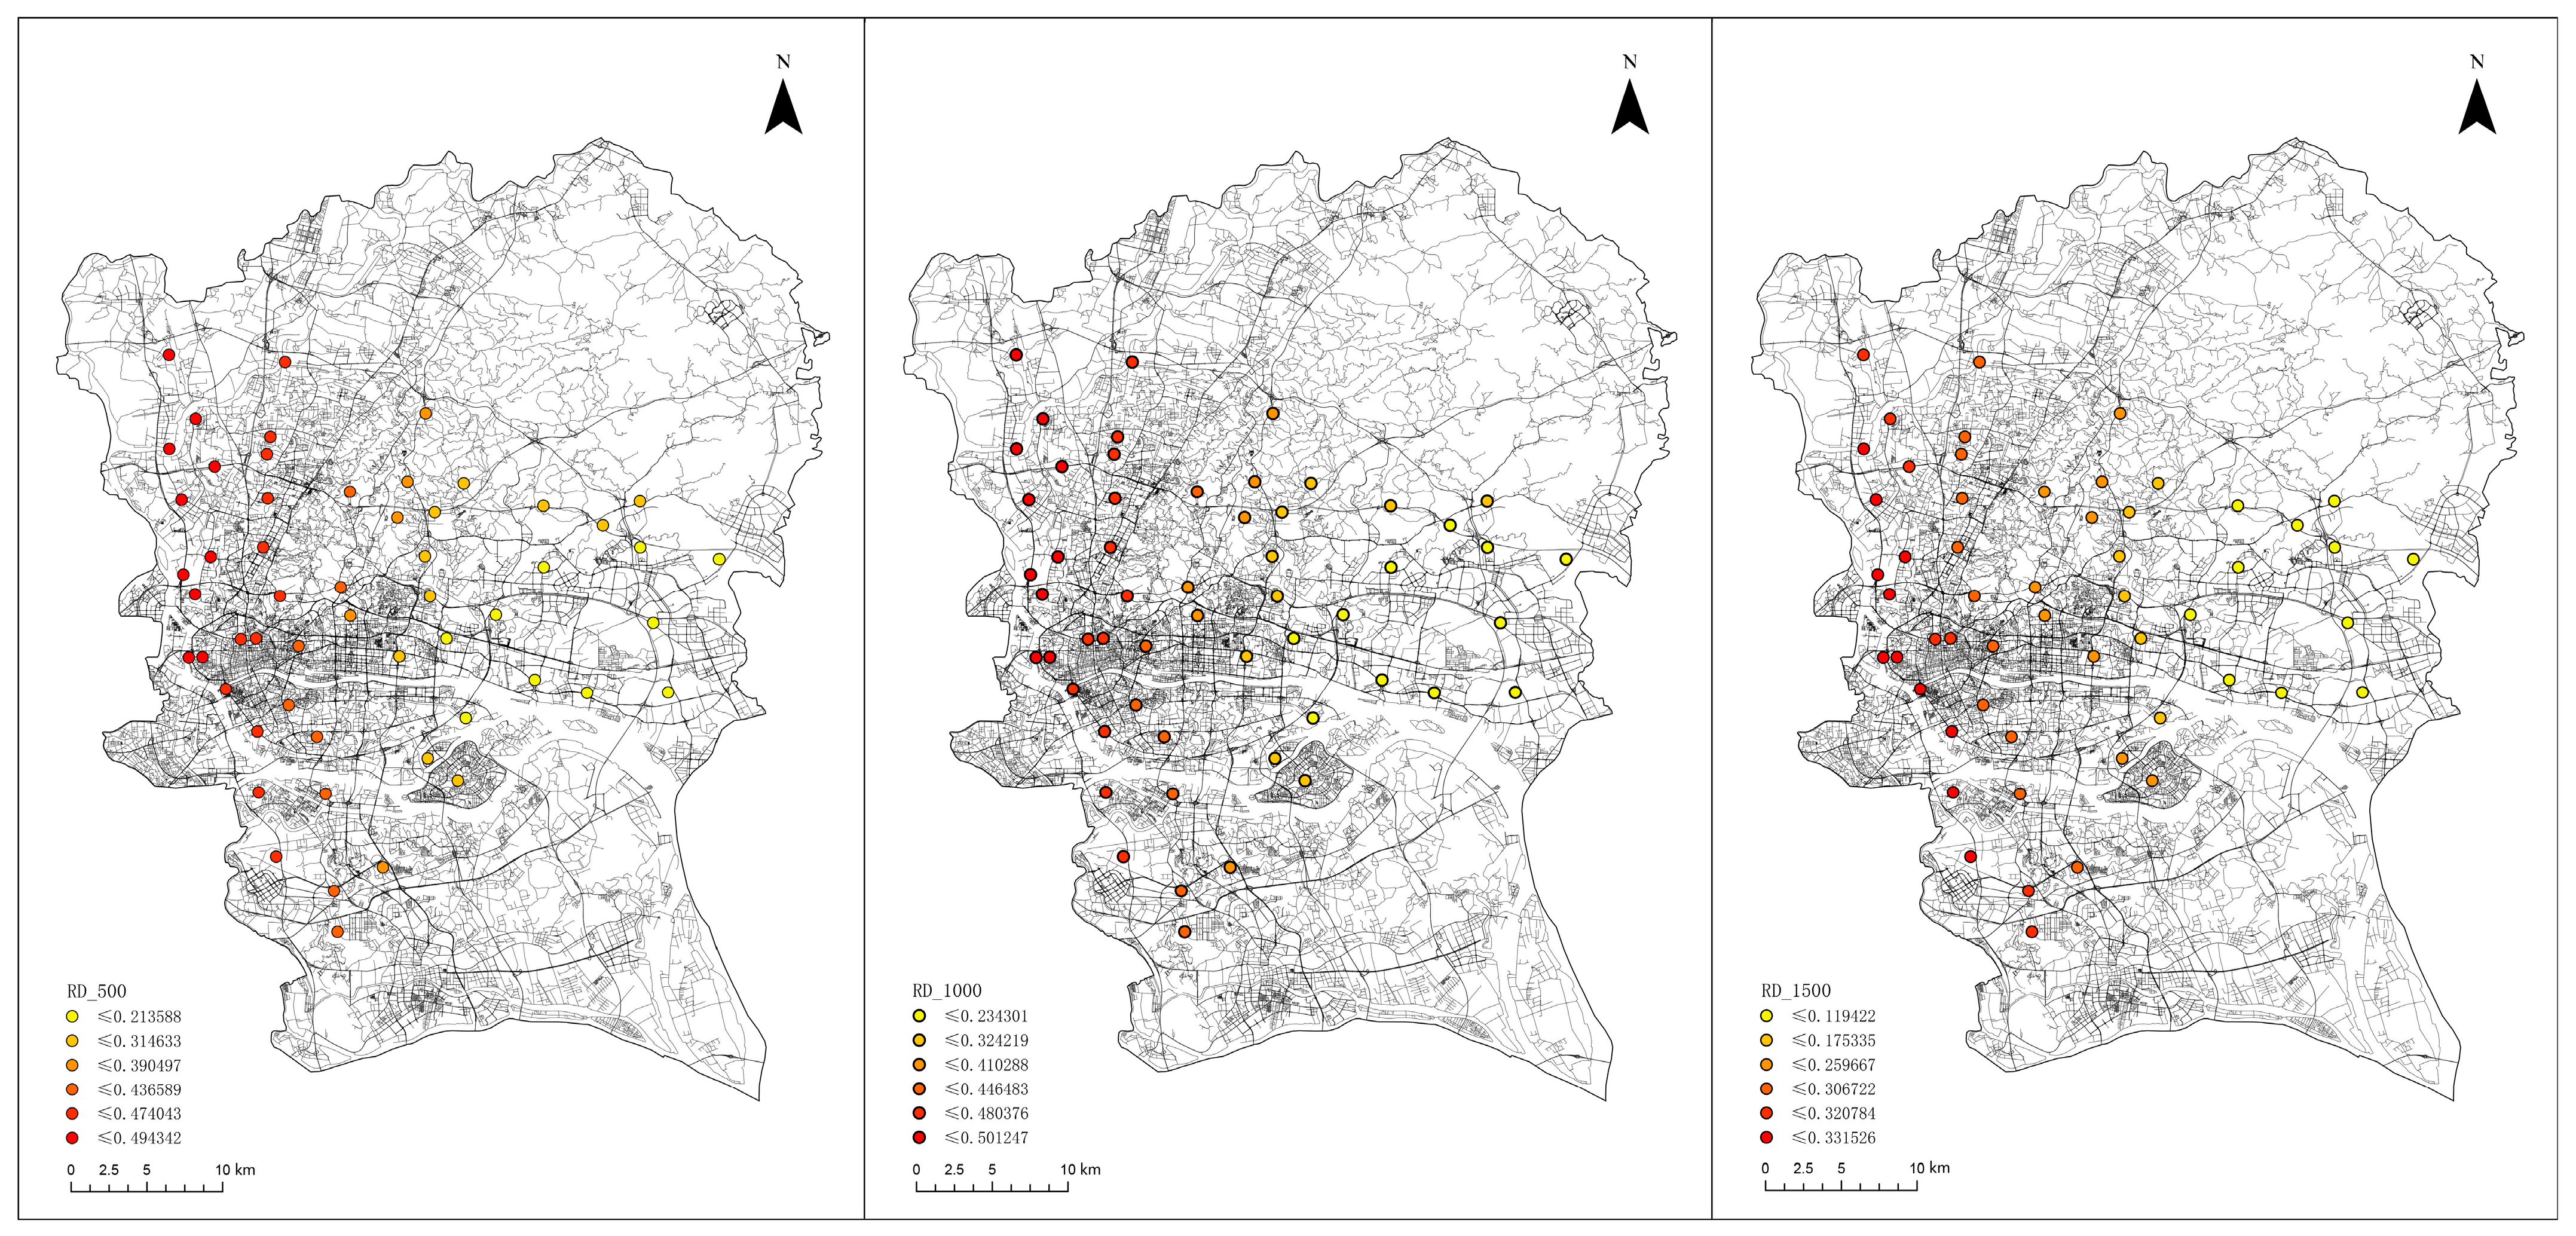
| RD | 0.367 | 0.121 | 0.111 | 0.416 | 0.494 | 0.009 | |
| 1000 m R2 = 0.28 | LUD | 0.166 | 0.149 | −0.075 | 0.166 | 0.590 | 0.394 |
| PI | −0.024 | 0.021 | −0.077 | −0.022 | 0.003 | 0.777 | |
| PPG | 0.16 | 0.023 | −0.121 | 0.158 | 0.213 | 0.686 | |
| PD | 0.18 | 0.016 | 0.145 | 0.182 | 0.212 | 0.186 | |
| PIS | −0.086 | 0.025 | −0.153 | −0.083 | −0.044 | 0.669 | |
| RD | 0.376 | 0.118 | 0.135 | 0.430 | 0.501 | 0.032 | |
| 1500 m R2 = 0.24 | LUD | 0.086 | 0.050 | 0.013 | 0.078 | 0.186 | 0.588 |
| PI | 0.158 | 0.061 | 0.068 | 0.140 | 0.318 | 0.579 | |
| PPG | −0.110 | 0.015 | −0.138 | −0.111 | −0.071 | 0.888 | |
| PD | 0.397 | 0.024 | 0.339 | 0.401 | 0.431 | 0.064 | |
| PIS | −0.272 | 0.024 | −0. 327 | −0.266 | −0.233 | 0.313 | |
| RD | 0.240 | 0.090 | 0.061 | 0.293 | 0.331 | 0.259 |
Publisher’s Note: MDPI stays neutral with regard to jurisdictional claims in published maps and institutional affiliations. |
© 2022 by the authors. Licensee MDPI, Basel, Switzerland. This article is an open access article distributed under the terms and conditions of the Creative Commons Attribution (CC BY) license (https://creativecommons.org/licenses/by/4.0/).
Share and Cite
Wang, M.; Liu, X.; Wu, W.; Zeng, H.; Liu, M.; Xu, G. Effects of Urbanization Intensity on the Distribution of Black Carbon in Urban Surface Soil in South China. Forests 2022, 13, 406. https://doi.org/10.3390/f13030406
Wang M, Liu X, Wu W, Zeng H, Liu M, Xu G. Effects of Urbanization Intensity on the Distribution of Black Carbon in Urban Surface Soil in South China. Forests. 2022; 13(3):406. https://doi.org/10.3390/f13030406
Chicago/Turabian StyleWang, Min, Xiaodong Liu, Wenkun Wu, Huixian Zeng, Mengyun Liu, and Guoliang Xu. 2022. "Effects of Urbanization Intensity on the Distribution of Black Carbon in Urban Surface Soil in South China" Forests 13, no. 3: 406. https://doi.org/10.3390/f13030406
APA StyleWang, M., Liu, X., Wu, W., Zeng, H., Liu, M., & Xu, G. (2022). Effects of Urbanization Intensity on the Distribution of Black Carbon in Urban Surface Soil in South China. Forests, 13(3), 406. https://doi.org/10.3390/f13030406