Article

MaxEnt Modeling to Estimate the Impact of Climate Factors on Distribution of Pinus densiflora

College of Ecology and Nature Conservation, Beijing Forestry University, Beijing 100089, China
*
Author to whom correspondence should be addressed.
Forests 2022, 13(3), 402; https://doi.org/10.3390/f13030402
Submission received: 19 December 2021 / Revised: 12 February 2022 / Accepted: 1 March 2022 / Published: 2 March 2022
(This article belongs to the Section Forest Inventory, Modeling and Remote Sensing)

Abstract

:
Pinus densiflora is an important evergreen coniferous species with both economic and ecological value. It is an endemic species in East Asia. Global climate warming greatly interferes with species survival. This study explored the impact of climate change on the distribution of this species and the relationship between its geographical distribution and climate demand, so as to provide a theoretical basis for the protection of P. densiflora under the background of global warming. This research used 565 valid data points and 19 typical climatic environmental factors distributed in China, Japan, and South Korea. The potential distribution area of P. densiflora in East Asia under the last glacial maximum (LGM), mid-Holocene, the current situation and two scenarios (RCP 2.6 and RCP 8.5) in the future (2050s and 2070s) was simulated by the MaxEnt model. The species distribution model toolbox in ArcGIS software was used to analyze the potential distribution range and change of P. densiflora. The contribution rates, jackknife test and environmental variable response curves were used to assess the importance of key climate factors. The area under the receiver-operating characteristic curve (AUC) was used to evaluate model accuracy. The MaxEnt model had an excellent simulation effect (AUC = 0.982). The forecast showed that the Korean Peninsula and Japan were highly suitable areas for P. densiflora, and the area had little change. Moreover, during the LGM, there was no large-scale retreat to the south, and it was likely to survive in situ in mountain shelters. The results suggested that Japan may be the origin of P. densiflora rather than the Shandong Peninsula of China. The distribution area of P. densiflora in the mid-Holocene and future scenarios was reduced compared with the current distribution, and the reduction of future distribution was greater, indicating that climate warming will have certain negative impacts on the distribution of P. densiflora in the future. The precipitation of the warmest quarter (Bio18), temperature seasonality (Bio4), mean annual temperature (Bio1) and mean temperature of the wettest quarter (Bio8) had the greatest impact on the distribution area of P. densiflora.

1. Introduction

Since the Quaternary Period (from 2.58 Ma to now), the drastic changes in the earth’s climate had an important impact on the current distribution pattern of species [1]. According to the sporopollen data, under the background of global cooling during the last glacial maximum (LGM), the vegetation types in Eurasia and North America retreated to the equator, and the forest area decreased and fragmented to varying degrees [2]. In the recent warm period (mid-Holocene), due to the high temperature and humidity, the forest belt in the northern middle latitude of Eurasia moved slightly northward, and the warm temperate evergreen broad-leaved forest and mixed forest in China also moved northward [2,3]. Obviously, climate has far-reaching impacts on the distribution range of species and is a key factor determining the distribution of species on a large scale [4].
The fifth assessment report of the Intergovernmental Panel on Climate Change (IPCC) points out that the global climate is obviously warming [5]. With global warming, species distribution, population size and genetic diversity will change [6], which will lead to plant migration, endangerment and even extinction [7,8,9,10,11,12]. Therefore, we should study the response of the plant distribution pattern to climate change and understand the climate demand of organisms and its relationship with the species geographical distribution. It is important to reveal the history of species formation, migration and diffusion and to put forward reasonable strategies for species diversity protection [13].
Species distribution models have been widely used to study the effects of climate change on the potential geographic species distribution based on maximum temperature, minimum temperature, relative humidity, rainfall and other environmental factors [14,15,16,17,18,19]. The MaxEnt model can simulate the potential geographic distribution of species based on environmental variable layers, species distribution records, machine learning and the maximum entropy principle. The MaxEnt model is suitable where the number of species distribution points is uncertain and the correlation between environmental variables is unclear [20,21]. Therefore, it is very suitable for modeling species distribution [22,23,24]. Moreover, MaxEnt is suitable when compared with other current approaches because it works with “presence data only” and cannot detect and collect ‘absence data’, which are rarely available [18,25]. The MaxEnt model has a continuous output (a maximum likelihood estimate of the relative probability of presence) instead of a deterministic role [26]. The MaxEnt model is widely used to study the relationship between species distribution dynamics and climate change [27]. It is also used to predict the sanctuary of organisms during the ice age [28,29].
P. densiflora can endure drought and barrenness, is an excellent pioneer species for secondary succession, and, thus, is crucial for reforestation and soil and water conservation [30]. The seed propagation of P. densiflora can be used for reforestation in the steeper barren hills. It can also be used as an ornamental tree species for afforestation in the sandy land on both sides of rivers [31]. P. densiflora is one of the established species of temperate coniferous forests in temperate and warm temperate forest regions. Moreover, a large area of forest communities has formed in the eastern part of the Liaodong Peninsula and Jilin Province, South Korea, North Korea, Russian Far East, and Japan [32]. Therefore, P. densiflora is endemic to East Asia. However, global warming may change the distribution of the P. densiflora due to the associated climate factors.
Many studies have assessed the population ecology, community characteristics, management techniques, and individual growth characteristics of P. densiflora in China and abroad [33,34]. However, no study has reported on the suitable distribution of P. densiflora. This study developed a prediction model employing extensive geo-referenced collections, field surveys data, presence data, and bioclimatic variables via a species distribution model with MaxEnt software. This study aimed to: (1) identify the most significant environmental factors influencing the potential distribution of P. densiflora and (2) predict the change trend of the geographical distribution of P. densiflora in different historical periods so as to provide a scientific basis for the formulation of protection policy, the delimitation of reserve and resource management of P. densiflora.

2. Materials and Methods

2.1. Data Collection

This study collected the distribution data of P. densiflora from the Global Biodiversity Information Facility (https://www.gbif.org (accessed on 25 November 2021)), the Chinese Virtual Herbarium (http://v5.cvh.org.c/ (accessed on 25 November 2021)), and survey data. The data were sifted to eliminate repetitive samples and any samples without detailed location information. Duplicate records were deleted and filtered spatially so that only one point occurred within each grid cell (10 km × 10 km). This study obtained 565 comprehensive and accurate distribution records (Figure 1). The longitude and latitude coordinates of the samples were recorded in the Excel database and converted into CSV format for developing the MaxEnt model.

2.2. Climatic Data

Environmental variables are key factors affecting species distribution. The climate data of the LGM, the mid-Holocene and the current climate data include 19 bioclimatic variables. This study selected the 19 bioclimatic variables (Bio1-Bio19) from the world climate database (www.worldclim.org (accessed on 20 May 2021)) using a spatial resolution of 2.5 arc-minutes [35]. The future climate data (2050s and 2070s) were determined based on the CCSM4 model, which has a strong simulation capability [36]. The model has four emission scenarios from the Fifth Emission Report of the IPCC. This study chose the lowest and the highest emission scenarios, RCP2.6 and RCP8.5, respectively. The ArcGIS conversion tool was used to convert the environmental factors into the ASCII format.

2.3. Model Simulation

MaxEnt software (MaxEnt 3.3.3 http://www.cs.princeton.edu/wschapire/Maxent/ (accessed on 10 May 2020)) was used for modeling [37]. This study used 75% of the data for training, and the remaining 25% were used to test the model’s ability to predict the species distribution. Threshold-independent receiver-operating characteristic analysis (ROC) was used to calibrate the model and validate its robustness. The area under the receiver-operating characteristic curve (AUC) was used for additional precision. A jackknife test was used to assess the relative importance of each variable [17]. Through SPSS 23.0 software, the Pearson correlation coefficient was used to test the multicollinearity among the 19 climatic variables, and, finally, 7 climatic variables were selected for subsequent modeling [38] (Table 1). ArcGIS 10.4 software was used for visual processing, and a natural breakpoint classification method was adopted. According to the corresponding fitness index (FI), the distribution area of P. densiflora was divided into four grades: high suitability (FI ≥ 0.6), medium suitability (0.4 ≤ FI < 0.6), low suitability (0.2 < FI < 0.4) and not suitable (FI ≤ 0.2) [39]. The distribution prediction map of the potential fitness area of P. densiflora in East Asia was drawn.

2.4. Geospatial Analysis

ArcGIS 10.4 software was used to calculate the area of the different suitable areas in each period, and SDM toolbox 2.4 tool was used to calculate the potential distribution area and distribution center change of P. densiflora in the different periods. In ArcGIS 10.4 software, the “reclass” function was used to modify the grid values corresponding to the suitable and not suitable areas that were predicted in each period of P. densiflora to 1 and 0, respectively, and then to add the SDM toolbox and select the “MaxEnt Tools” subdirectory in the “SDM Tools” module. The “distribution changes between binary SDMs” tool was used to successively calculate the area change range of the potential distribution areas in each period and to obtain the expansion area, stable area and contraction area of the distribution. The “centroid changes (lines)” tool was used to calculate the geometric center of displacement of the predicted distribution in the different periods and to detect the overall change trend of the P. densiflora distribution area [40].

3. Results

3.1. Evaluation of MaxEnt Model Prediction Accuracy

The MaxEnt3.3.3k software was used to simulate the potential geographic distribution of P. densiflora in East Asia based on 565 current distribution record data points and 7 climatic variables. The average AUC value of the 10 replicates was 0.982 (Figure 2), indicating an excellent level. The AUC values of the LGM, mid-Holocene and future (2050s and 2070s) simulations were as high as 0.980 or more, indicating that the prediction results of the MaxEnt model were accurate and suitable.

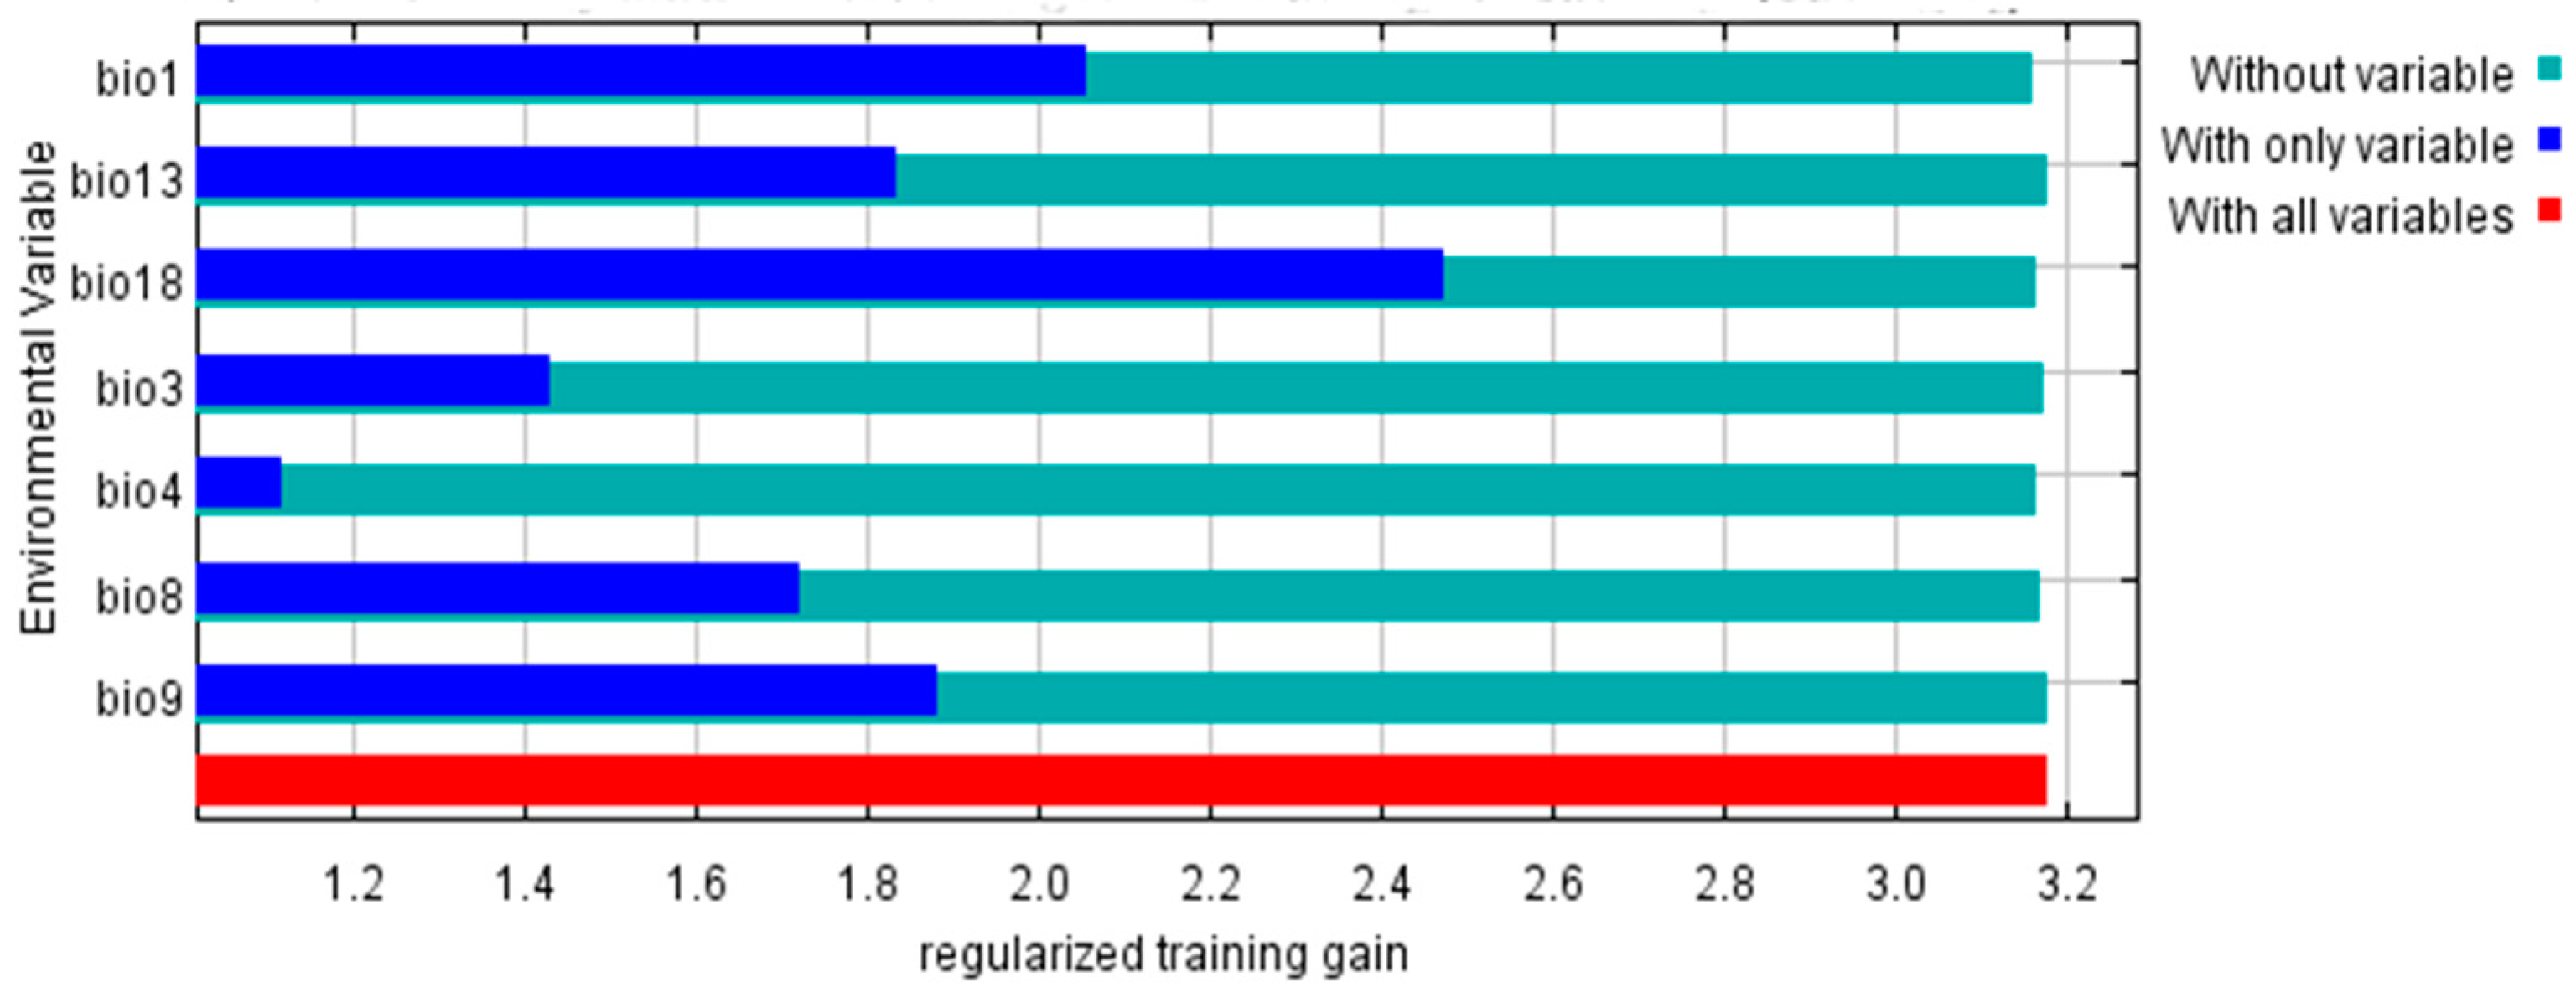
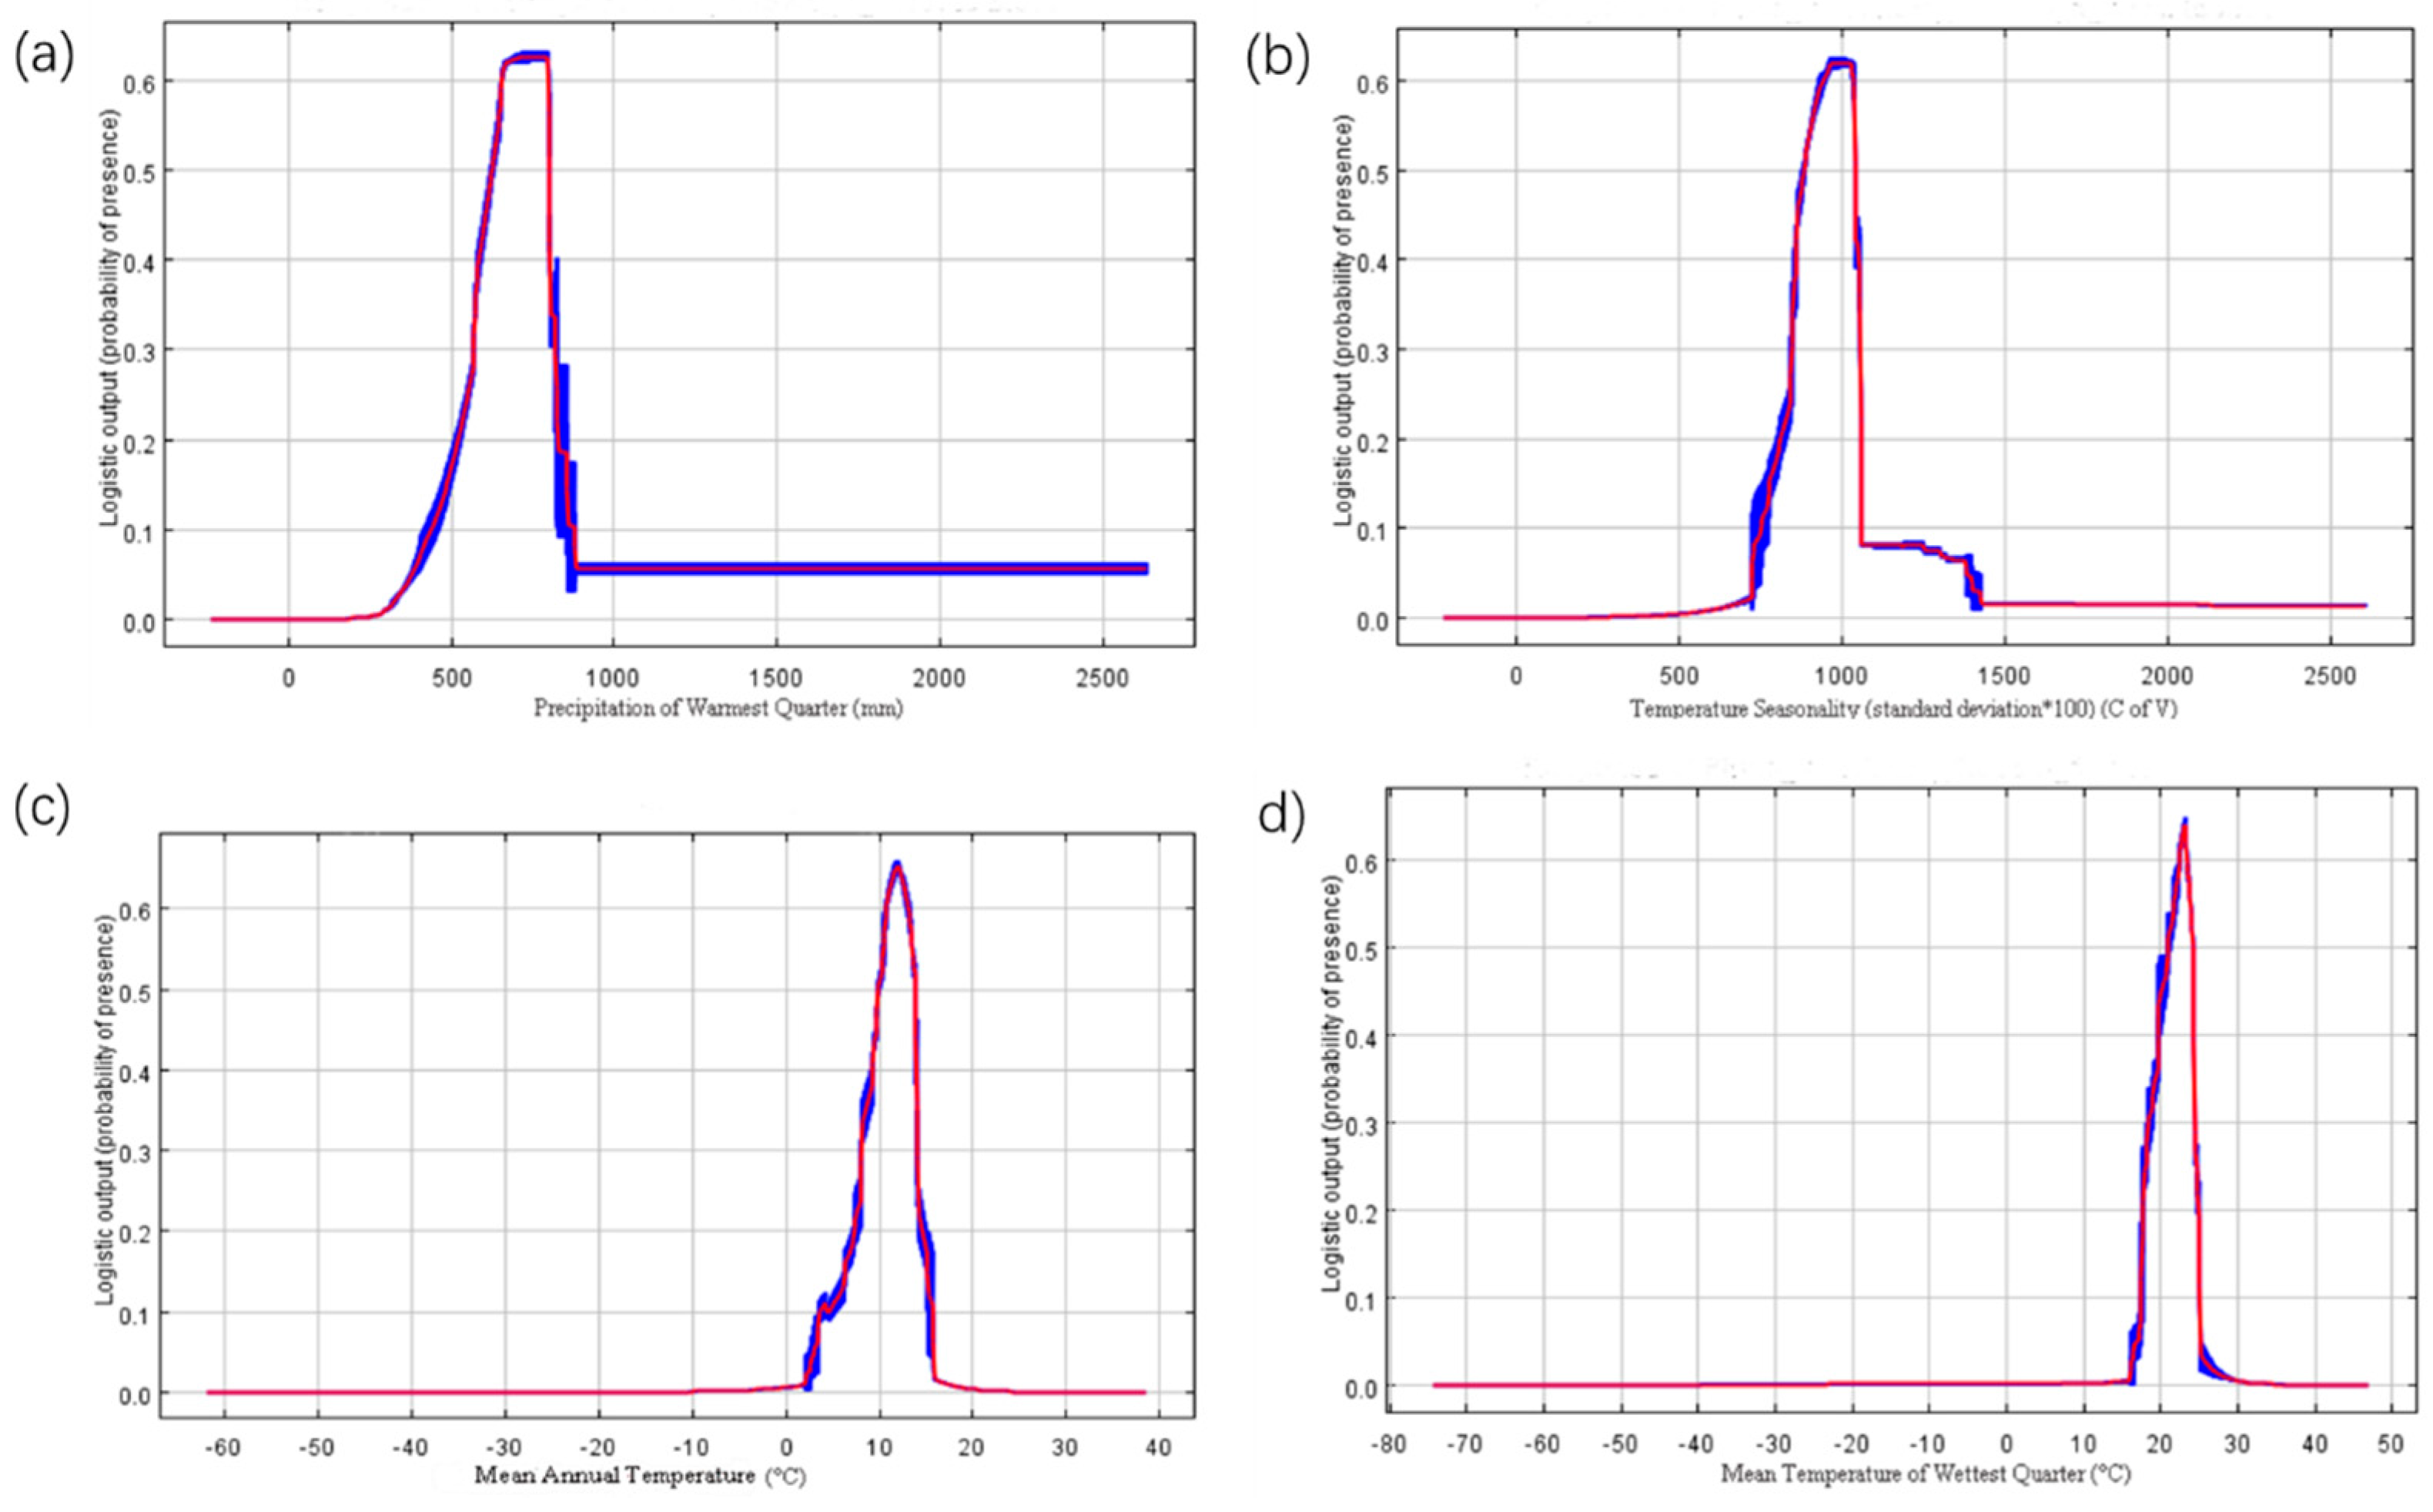
3.2. Climate-Dominant Factors and the Potential Distribution Areas of P. densiflora

The precipitation of the warmest quarter (Bio18) (67.7%), temperature seasonality (Bio4) (13.9%), mean annual temperature (Bio1) (6.6%), mean temperature of the wettest quarter (Bio8) (5.6%) and isothermality (Bio3) (5.1%) had the greatest impacts on the distribution range of the P. densiflora population (Figure 3, Table 2). These results show that precipitation and temperature are the main environmental factors affecting the distribution of P. densiflora plants in East Asia. The response curve of P. densiflora plants to the main climatic factors is shown in Figure 4. When the FI was greater than or equal to 0.6, the suitability grade was a high-suitability distribution. The precipitation of the warmest quarter (650–800 mm), temperature seasonality (900–1050), mean annual temperature (10–13 °C) and mean temperature of the wettest quarter (23–24 °C) were the major climatic factors at this time.
The current distribution area of P. densiflora was mainly between 32–45.3° N and 114–141° E (Figure 1). The total suitable area was about 3.62 × 10⁶ Km2. The areas of the high-, medium- and low-suitability areas were about 5.24 × 10⁵ Km2, 5.81 × 10⁵ Km2 and 1.42 × 10⁶ Km2, respectively (Table 3). Heilongjiang, Jilin, Liaoning, Shandong, Jiangsu, Zhejiang, Fujian, Jiangxi, Hubei, Hunan, Guizhou, Henan, Hebei, North Korea, Korea and Japan were the suitable areas for P. densiflora. The Korean Peninsula, Japan and China’s Jilin Province, Liaoning Province and Shandong Province were the highly suitable areas. Zhejiang, Jiangxi and Hubei had some fragmented distribution (Figure 1).

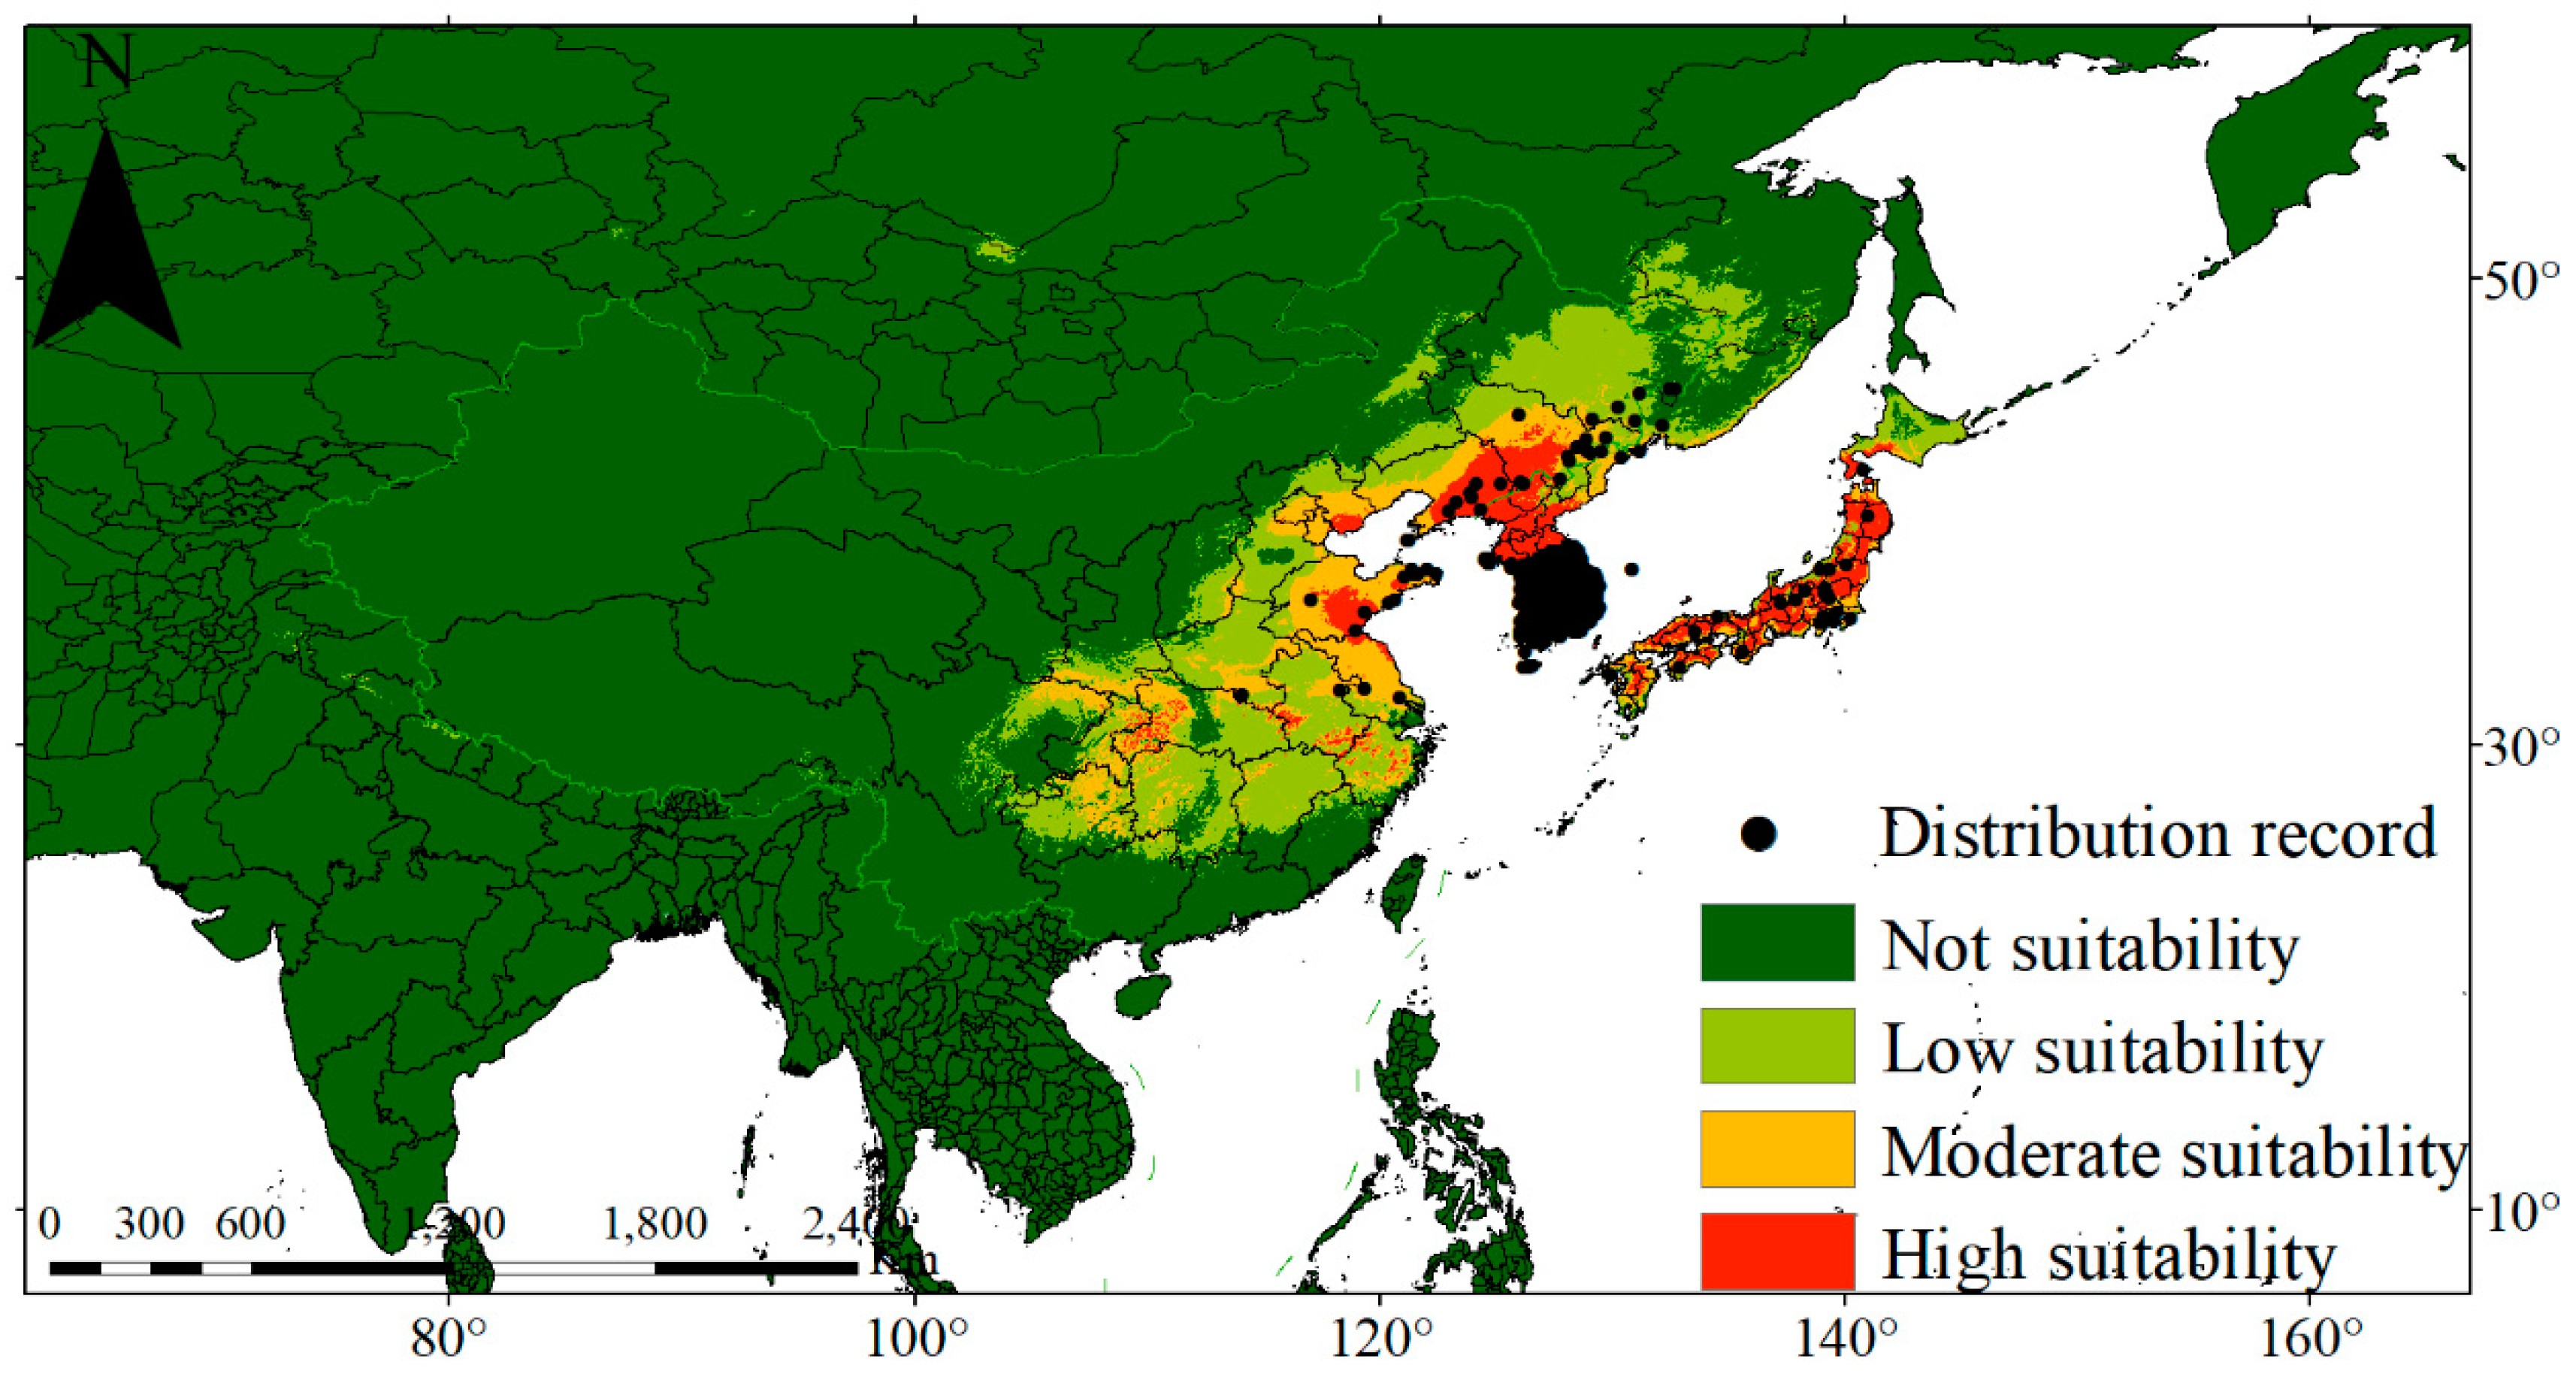
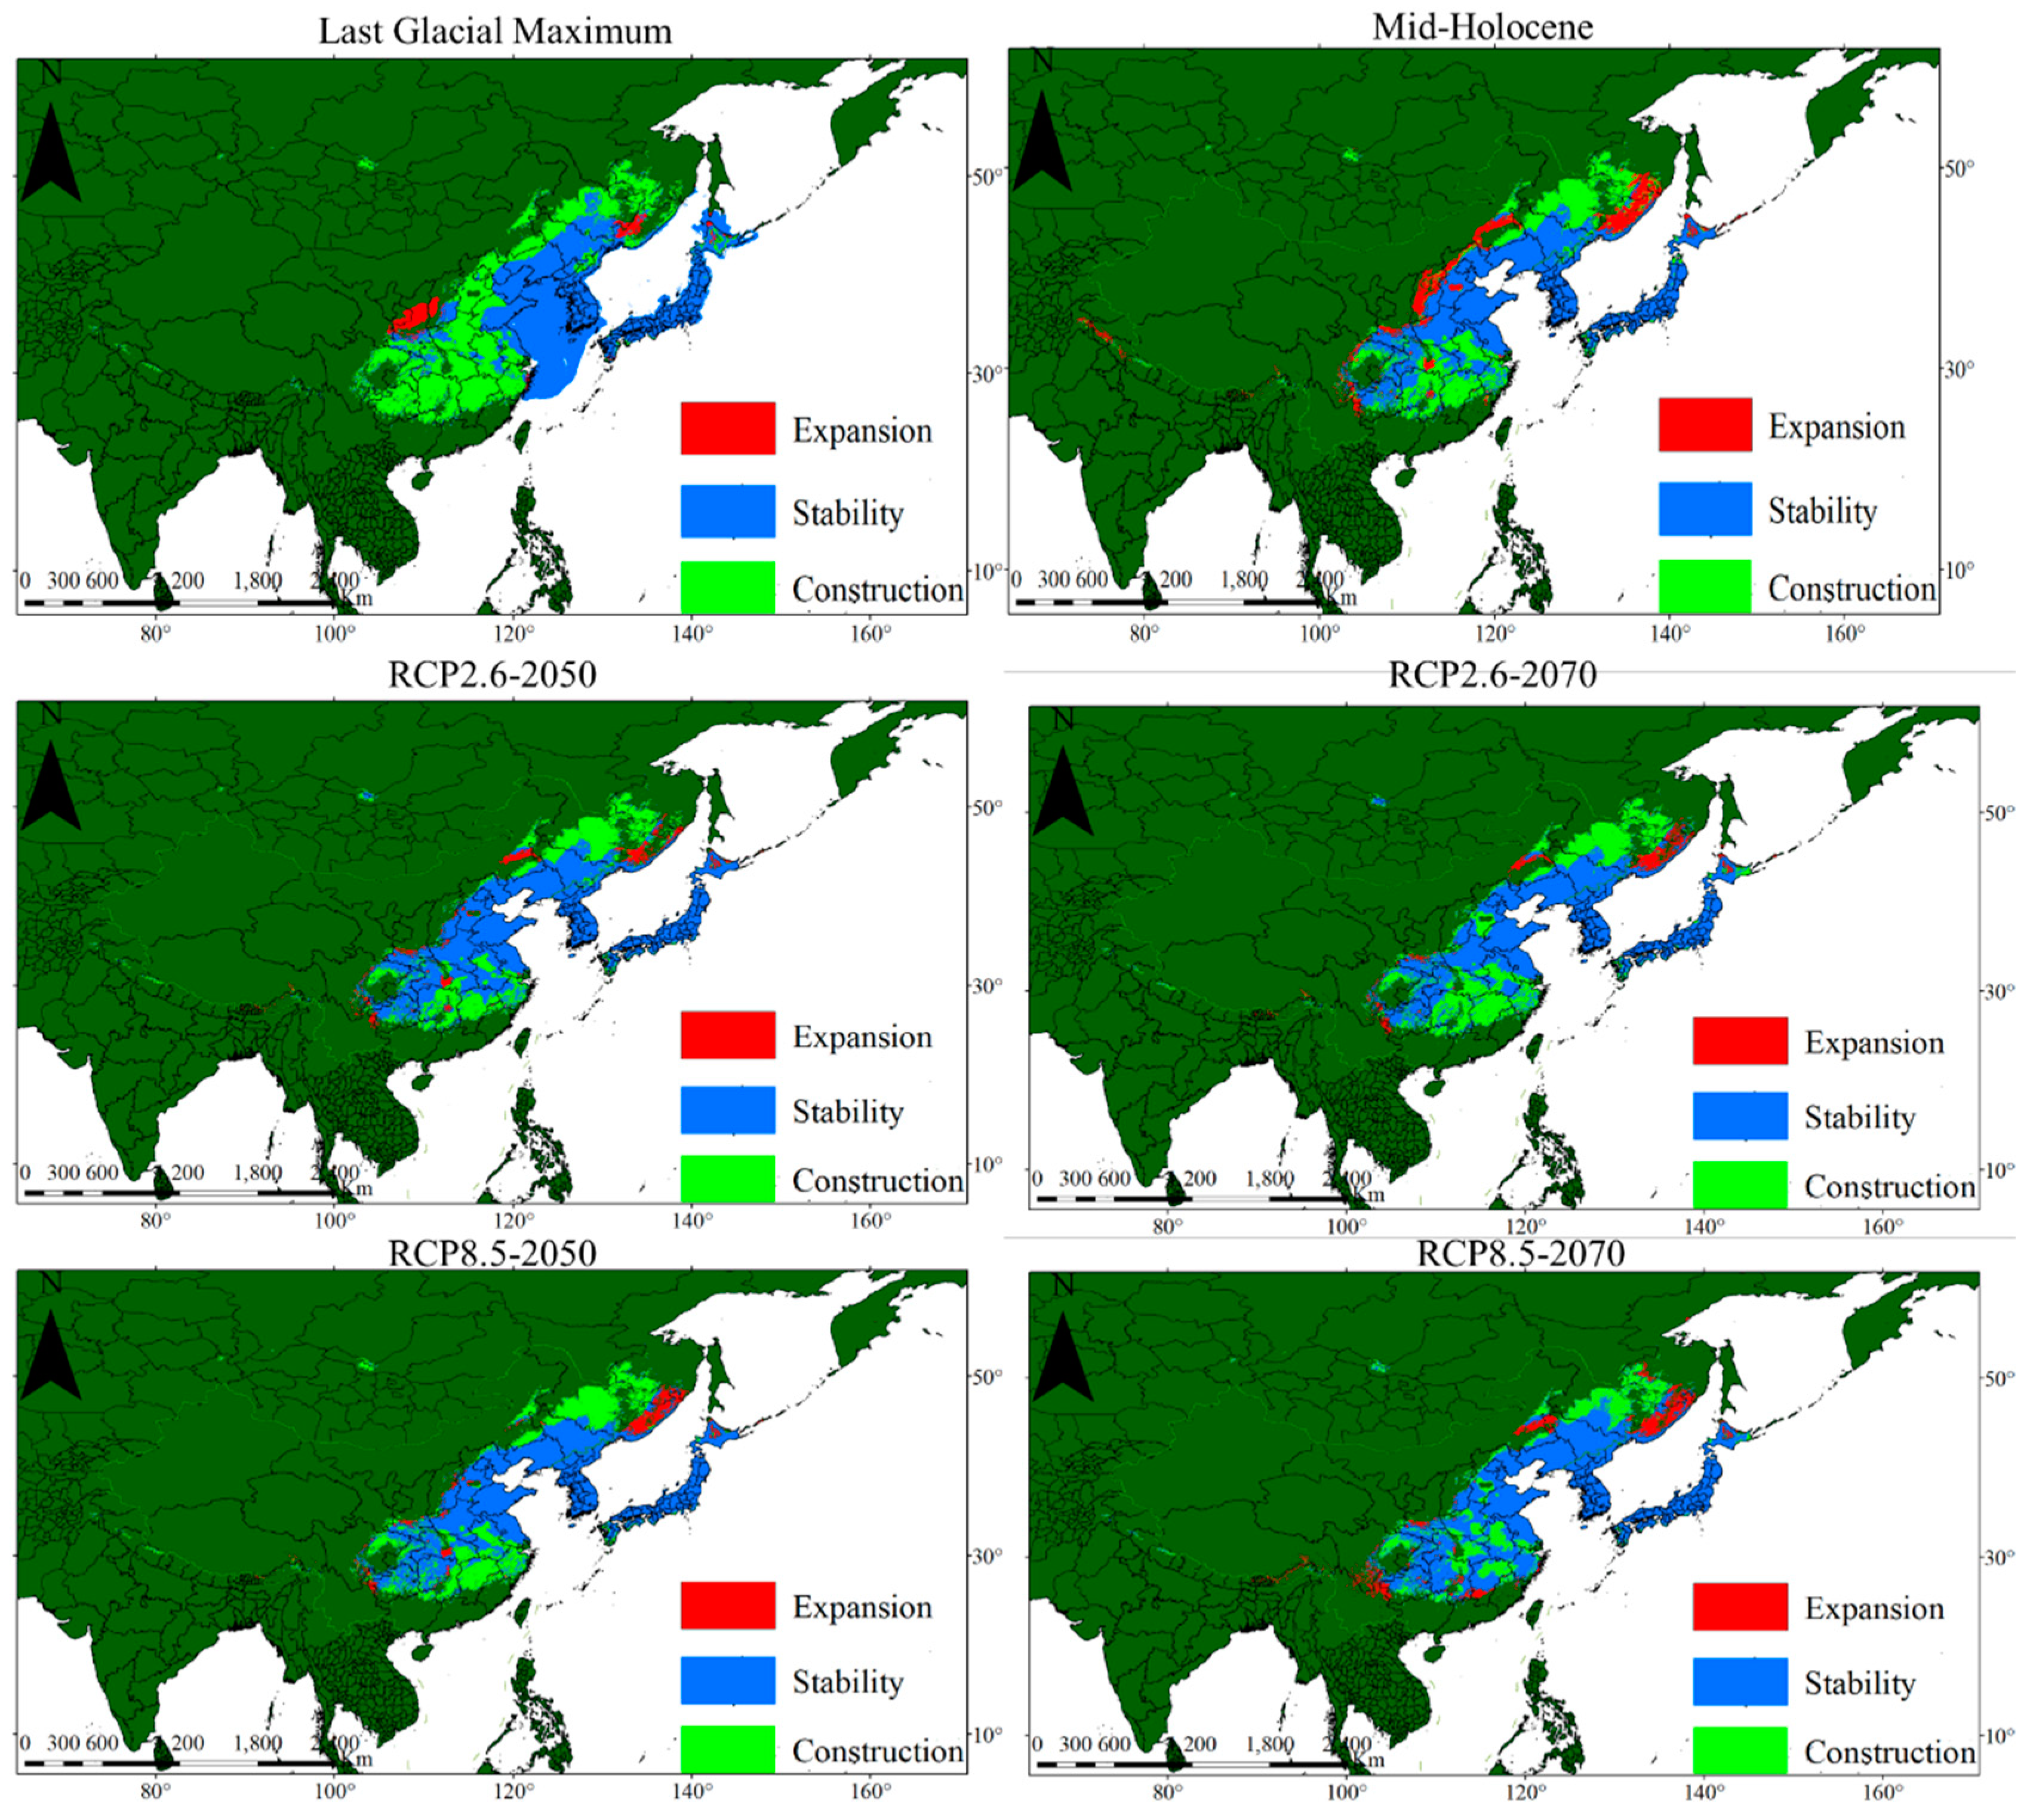
3.3. Potential Distribution and Changes of P. densiflora

In the LGM, mid-Holocene, current situation and future scenarios, the suitable area shows a single-peak trend, and the current area is the peak (Figure 1 and Figure 5, Table 3). The total suitable areas of the LGM and the mid-Holocene decreased by 25.76% and 11.65%, respectively. However, the high-suitability area increased by 47.56% and 32.35%, respectively. During the LGM and the mid-Holocene, the medium-suitability area decreased by 20.46% and 20.12%, respectively, and the low-suitability area decreased by 44.67% and 26.40%, respectively. Under the RCP 2.6 scenario, the total suitable area in 2050 will be about 2.52 × 10⁶ km2, 30.19% less than the current distribution area. The high-suitability area will decrease by 4.13%, the medium-suitability area will decrease by 22.10% and the low-suitability area will decrease by 38.90%. The total suitable area in 2070 will be about 2.31 × 10⁶ km2, 36.18% less than the current distribution area. The high-suitability area will increase by 12.18%, the medium-suitability area will decrease by 33.24% and the low suitability area will decrease by 48.48%. Under the scenario of RCP 8.5, the total suitable area in 2050 will be about 2.43 × 10⁶ km2, 32.73% less than the current distribution area. The high-suitability area will increase by 1.50%, the medium-suitability area will decrease by 21.46% and the low-suitability area will decrease by 43.67%. In 2070, the total suitable area will be about 2.30 × 10⁶ km2, 36.61% less than the current distribution area. The high-suitability area will decrease by 2.53%, the medium-suitability area will decrease by 38.41% and the low-suitability area will decrease by 45.21% (Table 3, Figure 5).
As can be seen from Figure 6 and Figure 7, the centroid (123°33′ E, 36°2′ N) of the habitat in the LGM period was close to the Shandong Peninsula. Compared with current situation, the latitude was increased by 3.42°, and the distribution area was shrinking in most directions, only slightly expanding in the northwest and northeast. The centroid (118° E, 33°59′ N) of the habitat in the mid-Holocene was in Jiangsu Province, China. Compared with the current, the latitude was increased by 1.36°, and the distribution area has obviously contracted in the southeast and northeast, with slight expansion in the other directions. Under the RCP 2.6 scenario, the distribution center of P. densiflora in 2050 will be located in Anhui Province, China, which is about 0.46° higher than the current distribution center latitude. The distribution area will obviously shrink in southeast and northeast China, will slightly expand in northwest and northeast China and new suitable areas will appear in areas close to Russia. The distribution center of P. densiflora in 2070 will increase by 0.42° compared with that of 2050. The distribution area will contract significantly in southeast and northeast China, and new suitable areas will appear in the coastal areas of Russia (Figure 6 and Figure 7). Under the RCP 8.5 scenario, the distribution center in 2050 will also be located in Anhui Province, China, which is about 0.72° higher than the current distribution center. The distribution area will shrink significantly in northeast and southwest China, will only expand slightly in a few areas and new suitable areas will appear in the coastal areas of Russia. The distribution center of P. densiflora in 2070 will decrease by 0.1° compared with that of 2050. The distribution area will contract significantly in northeast China, and new suitable areas will appear in the coastal areas of Russia (Figure 6 and Figure 7).

4. Discussion

A detailed understanding of species distribution is crucial for the rehabilitation and use of a species in an ecosystem [24,41]. This study performed a detailed analysis of the suitable habitat for P. densiflora, providing an important first step in developing strategies and policies for the management and utilization of P. densiflora.

4.1. Evaluation of the MaxEnt Model

Models are usually evaluated using overall accuracy, sensitivity, specificity, kappa and true skill statistic indicators [42,43]. The threshold cannot affect the ROC curve. As a result, the ROC curve is presently considered one of the best evaluation indicators. MaxEnt software can directly draw the ROC curve and calculate the AUC value of the model and is, thus, convenient for judging the predictive effect of the model. Therefore, ROC curves are widely used in the evaluation of MaxEnt models. The stability of a model is usually verified using 10 repeated AUC values. Herein, the average AUC value of the 10 repeated runs of the model was 0.982, indicating that the simulation effect was ‘excellent’, and, thus, the model can be used to simulate the potential distribution of P. densiflora in East Asia [44].

4.2. Habitat Suitability Response to Environmental Variables

Herein, Bio18, Bio4, Bio1 and Bio8 were the predominant variables influencing the potential distribution of P. densiflora, indicating that those factors play important roles in its distribution. Bio18 is one of the environmental factors affecting plant growth and can be used to understand the effect of climate change on plant species diversity [45]. Precipitation is correlated with many environmental factors influencing the physiological and biochemical processes of plants, e.g., soil moisture is the main factor affecting the plant assimilation rate [46]. Excessive water can cause root rot, promoting pest and disease invasion, especially at high temperatures and extremely high humidity [47]. Herein, the optimal Bio18 value of P. densiflora was 650–800 mm, indicating a greater demand for precipitation, consistent with the current distribution of P. densiflora. Moreover, the high-suitability area was mainly in the temperate coastal mountains and plains. P. densiflora is a strong light-loving species. Moreover, it has a strong cold resistance and is not affected by frost damage at −40 °C, indicating that P. densiflora has strong adaptability to low temperatures. The response curves of Bio4, Bio1 and Bio8 showed that temperature significantly affects P. densiflora. However, the predicted reduction of the suitable area of P. densiflora in the future showed that it is very sensitive to climate change. Therefore, a reasonable cultivation technique must be adopted based on the growth traits when cultivating P. densiflora in different regions.
Besides the above climatic factors, some other factors, such as soil texture and human activities, can influence the suitable habitats for P. densiflora. Sandy soil is loose and allows water discharge. Poor water discharge can cause plant disease, insect attack and root rot. Therefore, sandy soils can effectively avoid such issues. The effects of land use transformation can also significantly increase the spatial extent of unsuitable habitats [48]. Although this study suggested that P. densiflora has a wide distribution area, much of the suitable area may disappear due to human exploitation. Therefore, further studies are needed to verify the anthropogenic effects on the adaptation of P. densiflora to future climates.

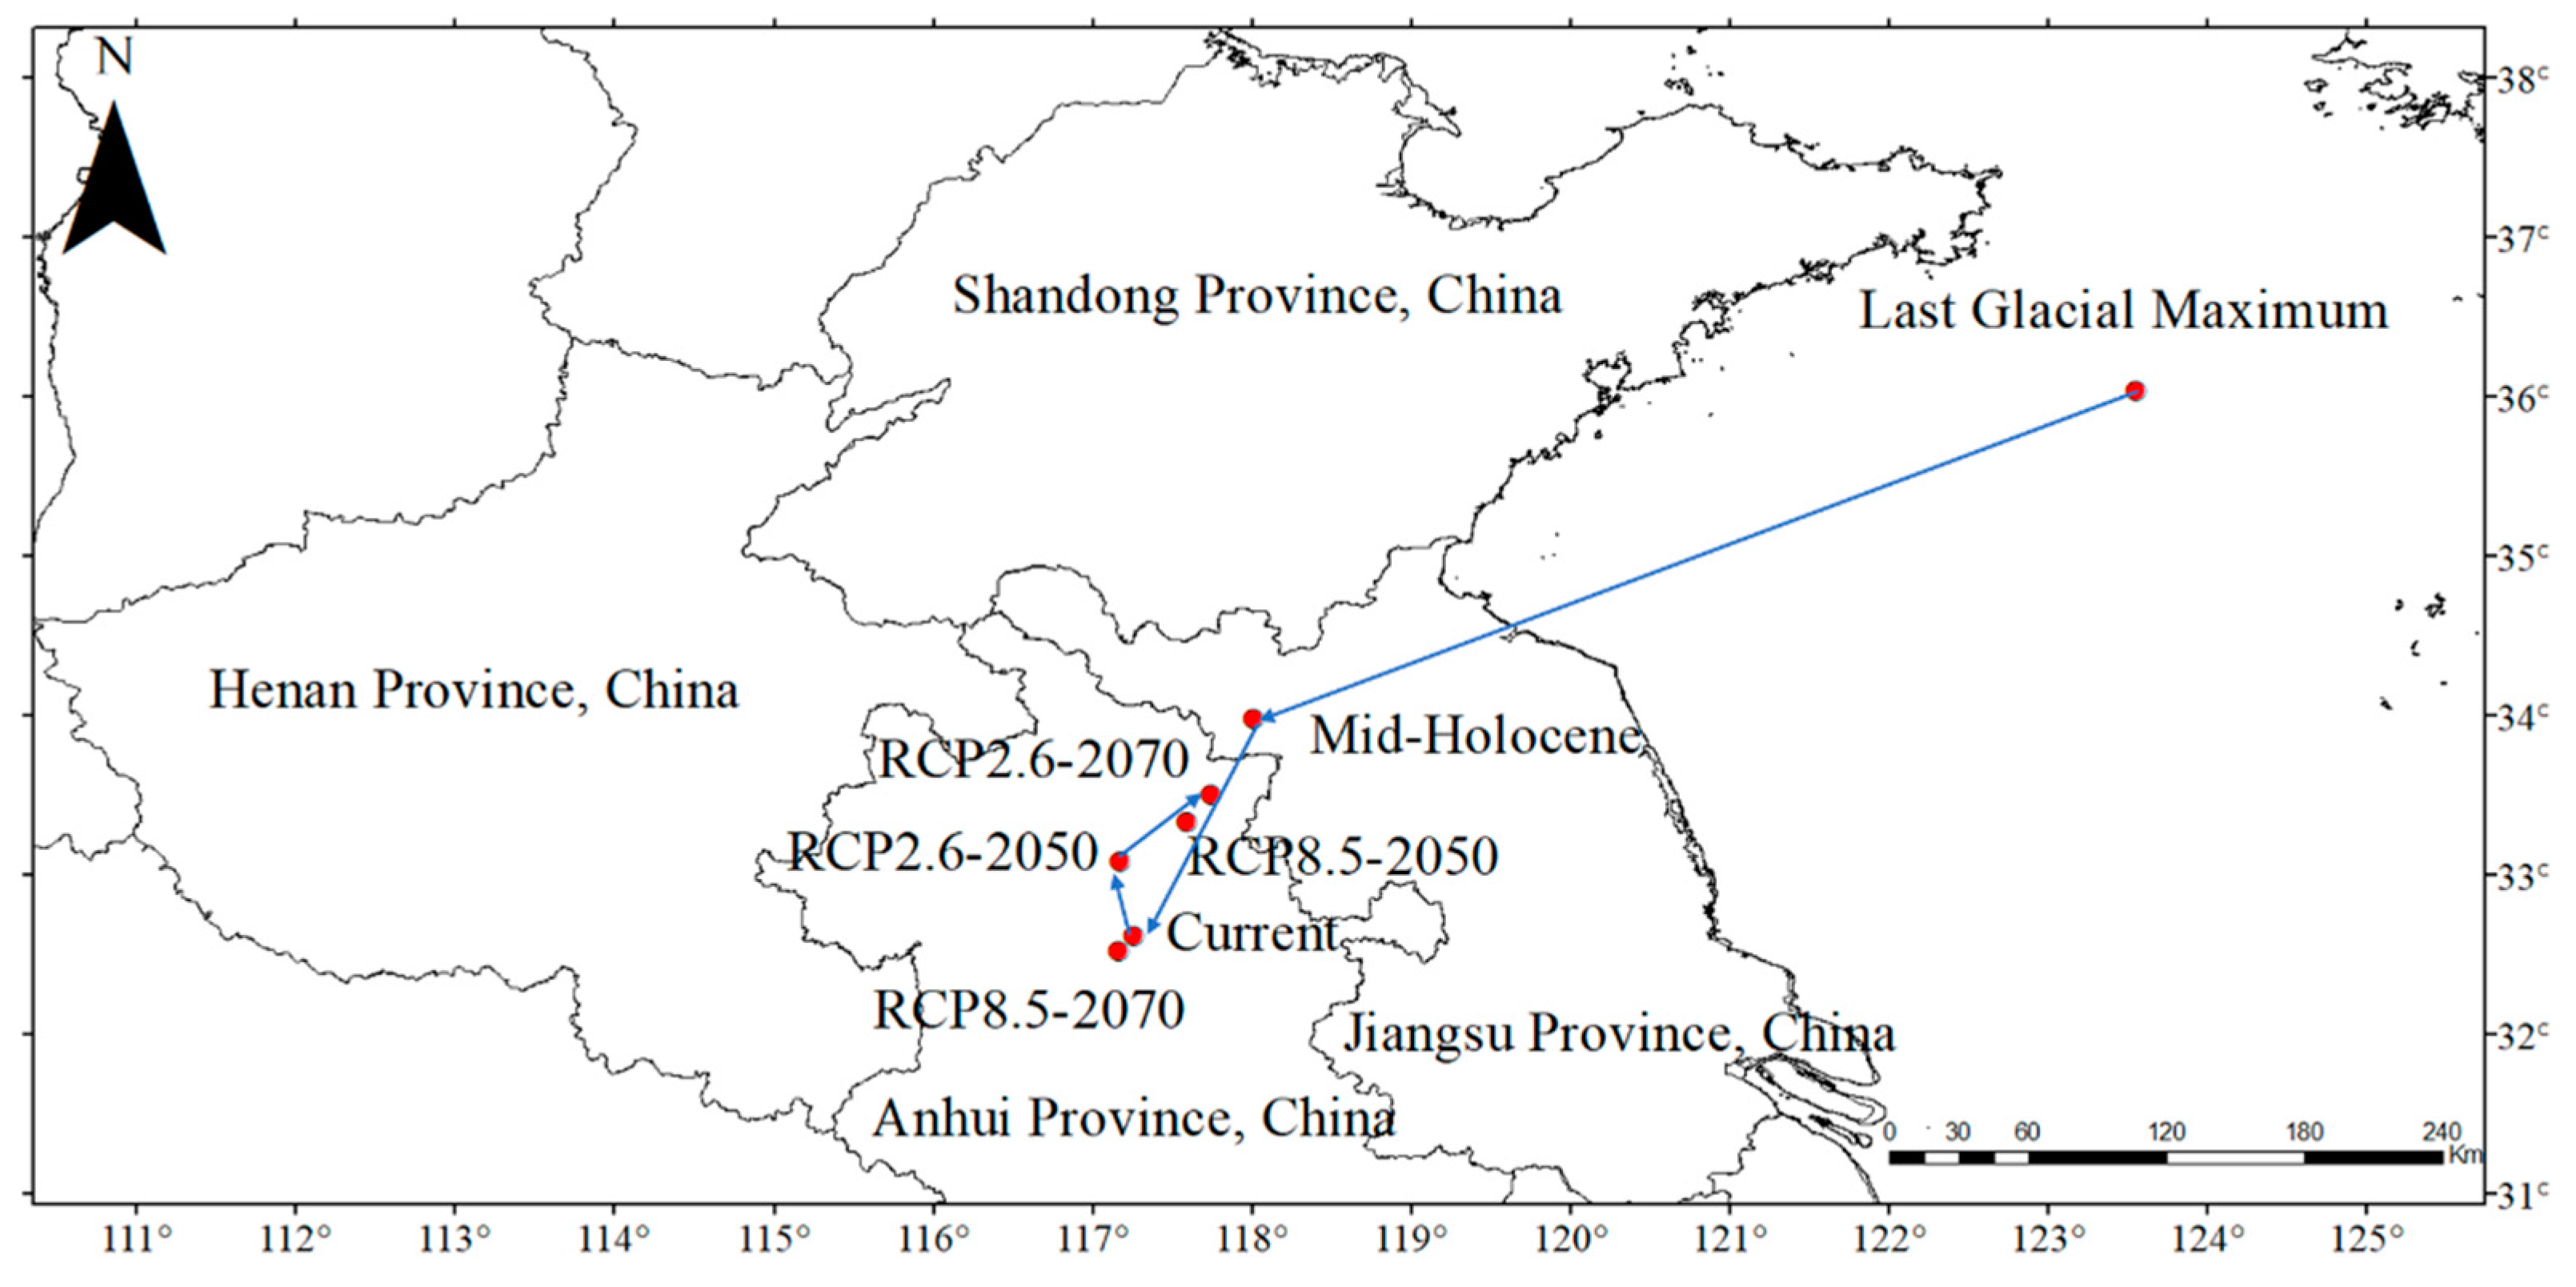
4.3. Geographical Distribution and Change of P. densiflora

Although fossil sporopollen data show that the cold and dry climate during the Quaternary glacial period forced many plants to migrate and take refuge southward, and the northern boundary of the evergreen broad-leaved forest retreated southward (24° N) [2]. However, a large number of phylogeographic studies have revealed the pattern of in situ refuge of subtropical plants in multiple shelters, and the potential distribution areas predicted by many plants in the last glacial period have not completely retreated to the south of 24° N [49]. During the LGM, the total suitable area contracted significantly in the southeast (Figure 6). The Korean Peninsula and Japan were high-suitability areas for P. densiflora, and the areas had little change in different periods (Figure 5). The overlapping areas of the past models and the current distribution may suggest a refuge area with rich genetic diversity [50,51,52]. Moreover, the mountainous area itself has a high topographic heterogeneity, maintains a high species diversity and uniqueness and is usually an important refuge for animals and plants. Therefore, it can be inferred that the P. densiflora population did not retreat southward on a large scale during the LGM. It is likely to have survived in the refuge formed by the complex mountainous terrain and mild microenvironment of Japan and the Korean Peninsula. It has not been adversely affected or restricted by the ice age, so it can also be speculated that Japan may be the origin of P. densiflora.
Many studies have shown that climate warming may reduce the potential distribution area of species [53,54]. Compared with the last glacial period, the climate in the mid-Holocene was warmer and wetter. The total suitable area was increased, but the high-suitability area had little change (Figure 5, Table 3). The reason is that P. densiflora is a species with a wide distribution range and strong ecological adaptability, which is related to a variety of environmental conditions in this area [24]. In a certain range, global warming can affect precipitation, accelerate the phenological process and prolong the growth season [55]. This study showed that the potential geographical distribution of P. densiflora under the two emission scenarios in the future will be significantly reduced compared with the current distribution area (Table 3), resulting in fragmentation (Figure 5). It showed that the future climate warming will have certain negative impacts on the growth of P. densiflora, and the habitat reduction of P. densiflora in the future will be much greater than that in the historical period. The distribution area will shrink significantly in the southeast, and the suitable areas in the southeast coast of Russia will increase significantly. The high-suitability areas will still be concentrated in Japan, the Korean Peninsula, Liaodong Peninsula and Shandong Peninsula (Figure 5 and Figure 6), indicating the strict requirements of P. densiflora to the temperature and precipitation range.
Research has shown that global climate change leads to the continuous rise of global temperature, precipitation mode (time and space) and precipitation intensity [56]. More than half of the research objects may be threatened by the 2080s, assuming that the species cannot spontaneously spread in Europe [7]. As a result, many species will migrate with global warming [6,57,58]. The results of this study showed that the distribution center of P. densiflora changes to a small northward migration from current to the future climate scenario. It showed the trend of north-south migration between the glacial and non-glacial periods (Figure 7). It is probably due to the formation of glaciers in the high-altitude and high-latitude areas under the glacial climate scenario that the species migrated to low-latitude and low-altitude areas. After entering the Holocene, the glaciers melted, and the species migrated to the high-altitude area with the continuous increase of temperature [59]. In short, the total suitable area of P. densiflora is different in different periods, but the high-suitability area is stable. It showed that P. densiflora had strong adaptability to climate change and had no extreme regression due to severe climate fluctuations. P. densiflora still had a broad and suitable natural habitat.

5. Conclusions

Estimating how climate change will affect the distribution of P. densiflora species is of vital importance for conservation. Herein, the MaxEnt model was used to identify a wide suitable habitat for P. densiflora. The suitable habitat for P. densiflora in East Asia was about 3.62 × 10⁶ Km2. The Bio18, Bio14, Bio1 and Bio8 climatic factors were 650–800 mm, 900–1050, 10–13 °C and 23–24 °C in the high-suitability distribution area, respectively. From the past to the future, the distribution area showed a single peak trend, and the current distribution area was the largest. Under the different climate scenarios, the distribution center of P. densiflora showed the trend of north-south migration between the glacial and non-glacial periods. Under the future climate scenarios, the potential habitat range of P. densiflora may increase fragmentation, which will have significant negative impacts on the habitat of P. densiflora. P. densiflora plays an important role in the stability of the local ecosystem. Therefore, this research can provide a scientific basis for the response to climate change and the protection and management of habitat.

Author Contributions

Writing—original draft preparation, X.D.; visualization, X.D.; writing—review and editing, J.L. and S.W. All authors have read and agreed to the published version of the manuscript.

Funding

This research was funded by the National Science and Technology Basic Resources Survey Project, grant number SQ2019FY010110-2.

Institutional Review Board Statement

Not applicable.

Informed Consent Statement

Not applicable.

Data Availability Statement

Geographic coordinate data and climate data have been described in Section 2.1 and Section 2.2 of the article.

Acknowledgments

We sincerely thank the Kunyu Mountain National Nature Reserve Administration for its financial support.

Conflicts of Interest

We declare that we have no financial and personal relationships with other people or organizations that can inappropriately influence our work.

References

  1. Hewitt, G.M. Genetic consequences of climatic oscillations in the Quaternary. Philos. Trans. R. Soc. Lond. Ser. B Biol. Sci. 2004, 359, 183–195; discussion 195. [Google Scholar] [CrossRef] [PubMed] [Green Version]
  2. Ni, J.; Yu, G.; Harrison, S.P.; Prentice, I.C. Palaeovegetation in China during the late Quaternary: Biome reconstructions based on a global scheme of plant functional types. Palaeogeogr. Palaeoclimatol. Palaeoecol. 2010, 289, 44–61. [Google Scholar] [CrossRef] [Green Version]
  3. Chen, Y.; Ni, J. Quantitative palaeovegetation reconstruction at lager scale based on the pollen records. J. Plant Ecol. 2008, 32, 1201–1212. [Google Scholar]
  4. Wu, J.; Lv, J.; Ai, L. The impacts of climate change on the biodiversity: Vulnerability and adaptation. Ecol. Environ. Sci. 2009, 18, 693–703. [Google Scholar]
  5. Intergovernmental Panel on Climate Change (IPCC). Climate Change 2013: The Physical Science Basis Contribution of Working Group I to the Fifth Assessment Report of the Intergovernmental Panel on Climate Change; Cambridge University Press: Cambridge, UK, 2013. [Google Scholar]
  6. Bertrand, R.; Lenoir, J.; Piedallu, C.; Riofrio-Dillon, G.; de Ruffray, P.; Vidal, C.; Pierrat, J.C.; Gegout, J.C. Changes in plant community composition lag behind climate warming in lowland forests. Nature 2011, 479, 517–520. [Google Scholar] [CrossRef]
  7. Thuiller, W.; Lavorel, S.; Araújo, M.; Sykes, M.; Prentice, I. Climate change threats to plant diversity in Europe. Proc. Natl. Acad. Sci. USA 2005, 102, 8245–8250. [Google Scholar] [CrossRef] [Green Version]
  8. Heller, N.E.; Zavaleta, E.S. Biodiversity management in the face of climate change: A review of 22 years of recommendations. Biol. Conserv. 2009, 142, 14–32. [Google Scholar] [CrossRef]
  9. Bellard, C.; Bertelsmeier, C.; Leadley, P.; Thuiller, W.; Courchamp, F. Impacts of climate change on the future of biodiversity. Ecol. Lett. 2012, 15, 365–377. [Google Scholar] [CrossRef] [Green Version]
  10. Diez, J.M.; D’Antonio, C.M.; Dukes, J.S.; Grosholz, E.D.; Olden, J.D.; Sorte, C.J.B.; Blumenthal, D.M.; Bradley, B.A.; Early, R.; Ibáñez, I.; et al. Will extreme climatic events facilitate biological invasions? Front. Ecol. Environ. 2012, 10, 249–257. [Google Scholar] [CrossRef] [Green Version]
  11. Grimm, N.B.; Chapin, F.S.; Bierwagen, B.; Gonzalez, P.; Groffman, P.M.; Luo, Y.; Melton, F.; Nadelhoffer, K.; Pairis, A.; Raymond, P.A.; et al. The impacts of climate change on ecosystem structure and function. Front. Ecol. Environ. 2013, 11, 474–482. [Google Scholar] [CrossRef] [Green Version]
  12. Qu, H.; Wang, C.-J.; Zhang, Z.-X. Planning priority conservation areas under climate change for six plant species with extremely small populations in China. Nat. Conserv. 2018, 25, 89–106. [Google Scholar] [CrossRef] [Green Version]
  13. John, W.W.; Stephen, T.J.; John, E.K. Projected distributions of novel and disappearing climates by 2100 AD. Proc. Natl. Acad. Sci. USA 2007, 104, 5738–5742. [Google Scholar]
  14. John, A.W.; Diana, S.; Dennis, J.; Christine, A.H.; Mark, A.S. Niches, models, and climate change: Assessing the assumptions and uncertainties. Proc. Natl. Acad. Sci. USA 2009, 106, 19729–19736. [Google Scholar]
  15. Bezeng, B.S.; Tesfamichael, S.G.; Dayananda, B. Predicting the effect of climate change on a range-restricted lizard in southeastern Australia. Curr. Zool. 2018, 64, 165–171. [Google Scholar] [CrossRef] [Green Version]
  16. Çoban, H.O.; Örücü, Ö.K.; Arslan, E.S. MaxEnt Modeling for Predicting the Current and Future Potential Geographical Distribution of Quercus libani Olivier. Sustainability 2020, 12, 2671. [Google Scholar] [CrossRef] [Green Version]
  17. Yang, X.-Q.; Kushwaha, S.P.S.; Saran, S.; Xu, J.; Roy, P.S. Maxent modeling for predicting the potential distribution of medicinal plant, Justicia adhatoda L. in Lesser Himalayan foothills. Ecol. Eng. 2013, 51, 83–87. [Google Scholar] [CrossRef]
  18. Phillips, S.J.; Dudík, M. Modeling of species distributions with Maxent: New extensions and a comprehensive evaluation. Ecography 2008, 31, 161–175. [Google Scholar] [CrossRef]
  19. Li, J.; Chang, H.; Liu, T.; Zhang, C. The potential geographical distribution of Haloxylon across Central Asia under climate change in the 21st century. Agric. For. Meteorol. 2019, 275, 243–254. [Google Scholar] [CrossRef]
  20. Jane, E.; Catherine, H.G.; Robert, P.A.; Miroslav, D.K.; Simon, F.; Antoine, G.; Robert, J.H.; Falk, H.; John, R.L.; Anthony, L.; et al. Novel methods improve prediction of species’ distributions from occurrence data. Ecography 2006, 29, 129–151. [Google Scholar]
  21. Petitpierre, B.; Kueffer, C.; Broennimann, O.; Randin, C.; Daehler, C.; Guisan, A. Climatic niche shifts are rare among terrestrial plant invaders. Science 2012, 335, 1344–1348. [Google Scholar] [CrossRef] [Green Version]
  22. Sadia, E.A.; Greg, M.; Kenton, O.H.; Richard, H.; Lara, S.; Stephen, E.; Lucas, N.J. Scientists and software—Surveying the species distribution modelling community. Divers. Distrib. 2015, 21, 258–267. [Google Scholar]
  23. Barbosa, F.G.; Schneck, F. Characteristics of the top-cited papers in species distribution predictive models. Ecol. Model. 2015, 313, 77–83. [Google Scholar] [CrossRef]
  24. Zhang, K.; Yao, L.; Meng, J.; Tao, J. Maxent modeling for predicting the potential geographical distribution of two peony species under climate change. Sci. Total Environ. 2018, 634, 1326–1334. [Google Scholar] [CrossRef] [PubMed]
  25. Pearson, R.G.; Raxworthy, C.J.; Nakamura, M.; Townsend Peterson, A. Predicting species distributions from small numbers of occurrence records: A test case using cryptic geckos in Madagascar. J. Biogeogr. 2006, 34, 102–117. [Google Scholar] [CrossRef]
  26. Stockwell, D. The GARP modelling system: Problems and solutions to automated spatial prediction. Int. J. Geogr. Inf. Sci. 1999, 13, 143–158. [Google Scholar] [CrossRef]
  27. Elith, J.; Kearney, M.; Phillips, S. The art of modelling range-shifting species. Methods Ecol. Evol. 2010, 1, 330–342. [Google Scholar] [CrossRef]
  28. Li, G.; Xu, G.; Guo, K.; Du, S. Geographical boundary and climatic analysis of Pinus tabulaeformis in China: Insights on its afforestation. Ecol. Eng. 2016, 86, 75–84. [Google Scholar] [CrossRef]
  29. Hu, Z.J.; Zhang, Y.L.; Yu, H.B. Simulation of Stipa purpurea distribution pattern on Tibetan Plateau based on MaxEnt model and GIS. Chin. J. Appl. Ecol. 2015, 26, 505–511. [Google Scholar]
  30. Lee, S.J.; Han, S.; Yoon, T.K.; Han, S.H.; Jung, Y.; Yun, S.J.; Son, Y. Growth and Physiological Characteristics of Pinus densiflora Seedlings in Response to Open-field Experimental Warming using the Infrared Lamp. J. Korean For. Soc. 2013, 102, 522–529. [Google Scholar] [CrossRef] [Green Version]
  31. Lee, C.S.; Chun, Y.M.; Lee, H.; Pi, J.H.; Lim, C.H. Establishment, Regeneration, and Succession of Korean Red Pine (Pinus densiflora S. et Z.) Forest in Korea. In Conifers; IntechOpen: London, UK, 2018. [Google Scholar]
  32. Weng, Y.H.; Liu, K.J.; Chen, Y.B.; Li, Y.; Wang, J.; Meng, Q.F. Variation in cone and seed traits in a clonal seed orchard of red pine (Pinus koraiensis Sieb. et Zucc.). Scand. J. For. Res. 2020, 35, 1–9. [Google Scholar] [CrossRef]
  33. Liang, D.; Ding, C.; Zhao, G.; Leng, W.; Zhang, M.; Zhao, X.; Qu, G. Variation and selection analysis of Pinus koraiensis clones in northeast China. J. For. Res. 2017, 29, 611–622. [Google Scholar] [CrossRef]
  34. Park, J.-M.; Kwon, S.-H.; Lee, H.-J.; Na, S.-J.; El-Kassaby, Y.A.; Kang, K.-S. Integrating fecundity variation and genetic relatedness in estimating the gene diversity of seed crops: Pinus koraiensis seed orchard as an example. Can. J. For. Res. 2017, 47, 366–370. [Google Scholar] [CrossRef] [Green Version]
  35. Hijmans, R.J.; Cameron, S.E.; Parra, J.L.; Jones, P.G.; Jarvis, A. Very high resolution interpolated climate surfaces for global land areas. Int. J. Climatol. 2005, 25, 1965–1978. [Google Scholar] [CrossRef]
  36. Otto-Bliesner, B.L.; Marshall, S.J.; Overpeck, J.T.; Miller, G.H.; Hu, A. Simulating Arctic climate warmth and icefield retreat in the last interglaciation. Science 2006, 311, 1751–1753. [Google Scholar] [CrossRef] [Green Version]
  37. Phillips, S.J.; Anderson, R.P.; Schapire, R.E. Maximum entropy modeling of species geographic distributions. Ecol. Model. 2006, 190, 231–259. [Google Scholar] [CrossRef] [Green Version]
  38. Yi, Y.-J.; Cheng, X.; Yang, Z.-F.; Zhang, S.-H. Maxent modeling for predicting the potential distribution of endangered medicinal plant (H. riparia Lour) in Yunnan, China. Ecol. Eng. 2016, 92, 260–269. [Google Scholar] [CrossRef]
  39. Li, J.; Fan, G.; He, Y. Predicting the current and future distribution of three Coptis herbs in China under climate change conditions, using the MaxEnt model and chemical analysis. Sci. Total Environ. 2020, 698, 134141. [Google Scholar] [CrossRef]
  40. Brown, J.L.; Anderson, B. SDMtoolbox: A python-based GIS toolkit for landscape genetic, biogeographic and species distribution model analyses. Methods Ecol. Evol. 2014, 5, 694–700. [Google Scholar] [CrossRef]
  41. Franklin, J. Species distribution models in conservation biogeography: Developments and challenges. Divers. Distrib. 2013, 19, 1217–1223. [Google Scholar] [CrossRef]
  42. Allouche, O.; Tsoar, A.; Kadmon, R. Assessing the accuracy of species distribution models: Prevalence, kappa and the true skill statistic (TSS). J. Appl. Ecol. 2006, 43, 1223–1232. [Google Scholar] [CrossRef]
  43. Wang, Y. Application of ROC curve analysis in evaluating the performance of alien species’ potential distribution models. Biodivers. Sci. 2007, 15, 365–372. [Google Scholar]
  44. Wang, R.; Yang, H.; Luo, W.; Wang, M.; Lu, X.; Huang, T.; Zhao, J.; Li, Q. Predicting the potential distribution of the Asian citrus psyllid, Diaphorina citri (Kuwayama), in China using the MaxEnt model. PeerJ 2019, 7, e7323. [Google Scholar] [CrossRef] [PubMed] [Green Version]
  45. Isaiah, G.; Amon, M.; Munyaradzi, D.S.; Mhosisi, M.; Christopher, C. Precipitation of the warmest quarter and temperature of the warmest month are key to understanding the effect of climate change on plant species diversity in Southern African savannah. Afr. J. Ecol. 2014, 52, 209–216. [Google Scholar]
  46. Wang, J.R.; Hawkins, C.D.B.; Letchford, T. Photosynthesis, water and nitrogen use effciencies of four paper birch (Betula papyrifera) populations grown under different soil moisture and nutrient regimes. For. Ecol. Manag. 1998, 112, 233–244. [Google Scholar] [CrossRef]
  47. Zhang, X.; Liu, H.; Su, J.; Tao, J.; Zhao, D. Research Progress on the Effect of Abiotic Stress on the Growth and Development of Paeonia Plant. Mol. Plant Breed. 2018, 16, 5072–5079. [Google Scholar]
  48. Hu, J.; Liu, Y. Unveiling the conservation biogeography of a data-deficient endangered bird species under climate change. PLoS ONE 2014, 9, e84529. [Google Scholar] [CrossRef]
  49. Qiu, Y.X.; Fu, C.X.; Comes, H.P. Plant molecular phylogeography in China and adjacent regions: Tracing the genetic imprints of Quaternary climate and environmental change in the world’s most diverse temperate flora. Mol. Phylogenet. Evol. 2011, 59, 225–244. [Google Scholar] [CrossRef] [PubMed]
  50. Provan, J.; Bennett, K.D. Phylogeographic insights into cryptic glacial refugia. Trends Ecol. Evol. 2008, 23, 564–571. [Google Scholar] [CrossRef]
  51. Nogués-Bravo, D. Predicting the past distribution of species climatic niches. Glob. Ecol. Biogeogr. 2009, 18, 521–531. [Google Scholar] [CrossRef]
  52. Thomas, E.; van Zonneveld, M.; Loo, J.; Hodgkin, T.; Galluzzi, G.; van Etten, J. Present spatial diversity patterns of Theobroma cacao L. in the neotropics reflect genetic differentiation in pleistocene refugia followed by human-influenced dispersal. PLoS ONE 2012, 7, e47676. [Google Scholar] [CrossRef] [Green Version]
  53. Leng, W.; He, H.S.; Bu, R.; Dai, L.; Hu, Y.; Wang, X. Predicting the distributions of suitable habitat for three larch species under climate warming in Northeastern China. For. Ecol. Manag. 2008, 254, 420–428. [Google Scholar] [CrossRef]
  54. Flower, A.; Murdock, T.Q.; Taylor, S.W.; Zwiers, F.W. Using an ensemble of downscaled climate model projections to assess impacts of climate change on the potential distribution of spruce and Douglas-fir forests in British Columbia. Environ. Sci. Policy 2013, 26, 63–74. [Google Scholar] [CrossRef]
  55. Zhang, H.; Wang, X.P.; Zhang, Y.F.; Hu, R.; Pan, Y.X.; Chen, N. Responses of plant growth of different life forms to rainfall amount changes in an arid desert area. Chin. J. Ecol. 2015, 34, 1847–1853. [Google Scholar]
  56. Chen, Y.; Xie, H.; Luo, H.; Yang, B.; Xiong, D. Impacts of climate change on the distribution of Cymbidium kanran and the simulation of distribution pattern. Chin. J. Appl. Ecol. 2019, 30, 3419–3425. [Google Scholar]
  57. Welter, S.; Brunner, K.; Hofstraat, J.W.; De Cola, L. Electroluminescent device with reversible switching between red and green emission. Nature 2003, 421, 54–57. [Google Scholar] [CrossRef]
  58. Lenoir, J.; Gegout, J.C.; Marquet, P.A.; de Ruffray, P.; Brisse, H. A significant upward shift in plant species optimum elevation during the 20th century. Science 2008, 320, 1768–1771. [Google Scholar] [CrossRef]
  59. Li, J.; Xu, Z.; Shi, M.; Chen, J. Prediction of potential geographical distribution patterns of Salix tetrasperma Roxb. in Asia under different climate scenarios. Acta Ecol. Sin. 2019, 39, 3224–3234. [Google Scholar]
Figure 1. Current distribution sites and potential distribution area of P. densiflora.
Forests 13 00402 g001
Figure 2. ROC test of the MaxEnt model.
Forests 13 00402 g002
Figure 3. The impacts of the environmental variables on the distribution gain of P. densiflora detected using the jackknife test.
Forests 13 00402 g003
Figure 4. Response curves of the major climate factors. (a) Precipitation of the Warmest Quarter (mm), (b) Temperature Seasonality (standard deviation ×100) (C of V), (c) Mean Annual Temperature (°C), (d) Mean Temperature of the Wettest Quarter (°C).
Forests 13 00402 g004
Figure 5. Potential distribution of P. densiflora in different periods.
Forests 13 00402 g005
Figure 6. Geographical distribution changes of P. densiflora in different periods.
Forests 13 00402 g006
Figure 7. Migration route of P. densiflora in East Asia under different climates.
Forests 13 00402 g007
Table 1. Environmental data used in this study.
Abbreviation DescriptionWhether to Use for Modeling
Bio1 Mean Annual Temperature (°C)Yes
Bio2Mean Diurnal Range (Mean of monthly (max temp-min temp)) (°C)No
Bio3Isothermally (Bio2/Bio7) (×100)Yes
Bio4Temperature Seasonality (standard deviation ×100) (C of V)Yes
Bio5Max Temperature of Warmest Month (°C)No
Bio6Min Temperature of Coldest Month (°C)No
Bio7Temperature Annual Range (Bio5–Bio6) (°C)No
Bio8Mean Temperature of Wettest Quarter (°C)Yes
Bio9Mean Temperature of Driest Quarter (°C)Yes
Bio10Mean Temperature of Warmest Quarter (°C)No
Bio11Mean Temperature of Coldest Quarter (°C)No
Bio12Annual Precipitation (mm)No
Bio13Precipitation of Wettest Month (mm)Yes
Bio14Precipitation of Driest Month (mm)No
Bio15Precipitation Seasonality (C of V)No
Bio16Precipitation of Wettest Quarter (mm)No
Bio17Precipitation of Driest Quarter (mm)No
Bio18Precipitation of Warmest Quarter (mm)Yes
Bio19Precipitation of Coldest Quarter (mm)No
Table 2. Contribution rate of the climatic factors.
AbbreviationDescriptionContribution (%)
Bio1Mean Annual Temperature (°C)6.6
Bio3Isothermality (Bio2/Bio7) (×100)5.1
Bio4Temperature Seasonality (standard deviation ×100) (C of V)13.9
Bio8Mean Temperature of the Wettest Quarter (°C)5.6
Bio9Mean Temperature of the Driest Quarter (°C)0.2
Bio13Precipitation of the Wettest Month (mm)0.9
Bio18Precipitation of the Warmest Quarter (mm)67.7
Table 3. Dynamics of the changes in the suitable habitat area under the different climate scenarios.
PeriodLow Suitability Area/104 km2Moderate Suitability Area/104 km2High Suitability Area/104 km2Total Suitable Area/104 km2
LGM128.7859.4180.6268.79
Mid-Holocene171.3276.2772.29319.88
Current232.7574.6954.62362.06
PCR2.6-2050142.2158.1852.36252.75
PCR2.6-2070119.9249.8661.27231.05
PCR 8.5-2050131.1158.6653.79243.56
PCR 8.5-2070127.524656229.52
Publisher’s Note: MDPI stays neutral with regard to jurisdictional claims in published maps and institutional affiliations.

