Article

Assessment and Sustainability of Logging Operations in Calabrian Pine High Forests

Dipartimento di Agraria, Università degli Studi Mediterranea di Reggio Calabria, Località Feo di Vito, 89122 Reggio Calabria, Italy
*
Author to whom correspondence should be addressed.
Forests 2022, 13(3), 403; https://doi.org/10.3390/f13030403
Submission received: 24 December 2021 / Revised: 13 February 2022 / Accepted: 26 February 2022 / Published: 2 March 2022

Abstract

:
Forest mechanisation plays an important role in increasing labour productivity and reducing production costs. This work aims at evaluating various logging scenarios in Calabrian pine high forests, considering technical, economic and environmental aspects. The cut-to-length system was adopted and structured as follows: felling and processing operations were carried out using a medium-sized chainsaw while extraction of the processed material was carried out using three different vehicles for timber extraction: (i) by cable skidder, (ii) by grapple skidder and (iii) by a forwarder. The methodology was based on productivity analysis and production cost analysis, while for environmental performance, the life cycle assessment (LCA) approach was adopted. The selected functional unit (FU) was referred to as 1 h of logging operations. However, to assess the resulting usefulness, further analyses were performed using an alternative FU consisting of 1 m3 of round wood. The study’s outcomes show the complexity in achieving an optimal balance between productivity, economic aspects and sustainable management in forest operations.

1. Introduction

In the last fifty years, in Mediterranean forests, a rapid expansion of pioneer conifers is occurring due to mountain depopulation and afforestation [1,2]. Furthermore, the history of forests in Italy is marked by an intense work of reconstitution and expansion carried out after the Second World War, when a reforesting programme was implemented by the State. In this context, an indigenous conifer tree species widely used in reforesting programs carried out in Calabria (southern Italy) was the Laricio pine (Pinus nigra J.F. Arn. ssp. laricio (Poiret) Maire).
Due to the high costs involved in reforestation [3], useful management interventions (e.g., intermediate cuts) have never been carried out. However, such interventions enable increasing socioeconomic stability in rural areas [4,5] and permit enhancing forest biodiversity [6]. The low level of mechanisation [7] did not favour active forest management, which opens the way to implement more innovative mechanised systems [8] and to increase the quantity and quality of merchantable timber [9].
The choice of a harvesting system indeed depends on many factors (terrain characteristics, level of mechanisation, forest accessibility, available workforce, etc.). Extraction technology and operator skills are part of that system, not a separate parameter [10,11]. In Calabria, chainsaws are the most low-cost tools used for tree felling and processing while wood extraction is mainly performed using farm tractors equipped with winches even if some other equipment could be used, too, such as cable cranes, chutes or animals [12,13].
Today, sustainable strategies based on the use of innovative machines represent an issue of great interest, and, at least, more diffuse employment of forestry skidders and forwarders should be achieved [14,15,16,17]. These machines have been thought to optimise the production efficiency, abating idle times, and they find application in the most common method of forest harvesting: (a) cut-to-length system, where harvesting equipment usually consists of a harvester that fells, delimbs and cuts trunks into final assortments and the forwarder, used for trees hauling along the roadside until landing; (b) tree-length system, where a feller is used for felling, delimbing and topping the trees and the skidder pulls the intact trunks to the roadside; and (c) full-tree system where the whole tree is felled and transported to the landing, usually by a skidder. However, we should take into account that felling and logging are still realised using chainsaws.
A common way to evaluate the harvesting productivity is to measure working time for every single phase considering the related cost-production. The determination of these factors can help to define the best method to improve harvesting activity and positively impact the costs of the worksite [18,19].
Akay [20] identified the variable factors influencing the cost of harvesting machines and computed the unit costs of specific harvesting methods in Turkey. Furthermore, Mederski [21] accounted for the economic aspects of thinning operations with and without midfield in Poland, while Ghaffariyan et al. [19] analysed operating costs of the cut-to-length (CTL) harvesting method in Northern Iran. Stoilov et al. [22] assessed salvage logging productivity and costs in the sensitive forests in Bulgaria, while Badraghi et al. [23] carried out a costs analysis for three ground-logging methods in a mixed broadleaved mountainous forest. Proto et al. [24] determined the operation cost for the two forwarders studied, and Jiroušek et al. [25], in a similar study, determined the operation costs for different harvester and forwarder classes.
A lack of insight still pertains to the environmental impacts of harvesting alternatives. Indeed, the impact of forestry mechanised processes on the environment should be validated, considering all implemented inputs and outputs related to the involved technology. Today, one of the most powerful and effective tools useful for assessing the environmental sustainability of a process or product is undoubtedly the Life Cycle Assessment (LCA). Although LCA can be very onerous in terms of amounts and quality of data needed to be gathered, this metric, widely recognised and validated from international standards [26,27], allows conducting of the expansion of the analysis boundaries to the whole life cycle of a product or a process in a so-called cradle-to-grave approach. However, according to Duka et al. [28], the LCA implementations in forestry are not yet widely spread, probably due to the complexity of concerns linked to the production process and the “dynamic nature of forests and long-term production period, corresponding to the rotation period”.
Several studies dealing with the environmental aspects of forestry operations have been performed. Some of them were limited to Greenhouse Gas (GHG) emissions assessment [29,30,31]; others focused on a single phase instead of the whole cycle within the system boundaries [32,33,34,35] or referred to logging operations realised in different geographical contexts and work conditions [36,37,38]. Indeed, Badraghi et al. [39] report the impacts of small-scale wood logging by mules in the mixed broadleaved mountain forest; Proto et al. [6,40] compared three different extraction systems concerning the valorisation of forest residuals; Gan et al. [41] analysed log harvesting from three types of natural forest.
In this context, the present research aims at evaluating the technical efficiency of small-scale harvesting companies, considering particularly the effects of mechanisation level on labour productivity, operational costs and environmental performances.

2. Materials and Methods

This research focuses on the analysis of three different harvesting systems taking into account:
(I) technical performances in terms of work capacity and productivity according to harvesting equipment and site organisation;
(II) economic aspects based on the estimation of both operating machinery cost and operator-machine labour cost, by performing the method described by Miyata [42];
(III) environmental performance in accordance with ISO standard [26] which consider the impacts engendered by a process or a product, along the entire life cycle, on different environmental indictors, including human health, ecosystem and resources. To stress the usefulness of the results, further simulations were achieved by scaling the data considering two Functional Units (FUs): one 1 h of logging operations and 1 m3 of round wood.

2.1. Logging Scenario Organisation and Technical Performances Evaluation

A Laricio pine (Pinus nigra J.F. Arn. ssp. laricio (Poiret) Maire) high forest with a density of 800 trees per hectare with an average age of 70 years was studied. The research area (38°37′28″ N 16°24′50″ E) located at an altitude between 1000–1200 m a.s.l, with a surface of more than 15 ha, had a good main road network density (in average 40 mha−1); the tracks opened during felling were used as the secondary road network (70 mha−1) [43]. The terrain roughness presents obstacles on less than 1/3 of the surface, while the slope was between I and II classes (0÷40%) [44]. To calculate the main dendrometric parameters shown in Table 1, four test plots of circular shape were randomly realised in the areas where the conditions were representative of the entire surface (one plot represents on average 3.5 hectares of forest); each test plot has a surface area of around 1200 m2, and a total of 700 plants were measured. Basal area was calculated according to the following formulation [45]:
G = Π/4 (n1 d12 + n2 d22 + … + nn dn2)
where:
  • n = number of plants corresponding to each diametric class;
  • d = diameter at breast height (cm);
Volume was estimated by using the functional expression [46]:
V = a+b1 d2 h + b2 d + b3 h + b4 dh + b5 d2 + b6 h2 + b7 d2 h2 + b8 d3 + b9 d3 h2
with:
  • a = 0.457023 × 10⁻³; b1 = 0.380346 × 10⁻⁴; b2 = −0.423233 × 10⁻⁴; b3 = 0.160308 × 10⁻²; b4 = −0.112508 × 10⁻³; b5 = 0.210093 × 10⁻⁴; b6 = 0.132827 × 10⁻⁴; b7 = 0.337571 × 10⁻⁸; b8 = −0.177836 × 10⁻⁶; b9 = −0.491192 × 10⁻⁹
  • d = diameter at breast height (cm);
  • h = compensated height (m).
A second thinning from below was carried out to remove around 20% of the trees per hectare, focusing on trees with diseases, defects, small diameters, etc., that would not respond with a large increase in growth, to guarantee the development of the remaining trees and decreasing tree mortality rates from a long-term perspective [9]. Three circular plots of three hectares each were randomly realised (spaced 200 m apart, taking into account the homogeneity of conditions) to evaluate logging operation. An amount of 120 trees were studied for felling. For logging, 50 cycles for each extraction system were studied.
Three scenarios were identified, where wood extraction was performed employing: (i) a cable skidder (John Deere 548H), (ii) a grapple skidder (John Deere 548H) and (iii) a forwarder (John Deere 1010D). Full-tree system (FTS) was employed for scenarios (i) and (ii), while cut-to-length system (CTL) was adopted for scenario (iii).
Dimensions of processed timber were as follows: logs 240 cm long with a minimum diameter of 22 cm destined for the production of packing material and pallets, and logs 230 cm long with a maximum diameter of 20 cm destined for the paper mill. Felling and processing operations were carried out using a medium-sized chainsaw (model Jonsered CS 2260) with an engine power of 3.5 kW. The two-man worker team consisted of the chainsaw operator and a helper with the task of keeping the work area clean and helping with delimbing and processing.
Trees extraction in scenario (i) was carried out by a work team of three operators: vehicle driver from felling site to landing and two choker setters, with the role of assistants for bunching and subsequent skidding. In scenario (ii), a skidder driver was employed to manage the grapple and to perform skidding. Moreover, another worker helped in load management. Regarding the extraction cycle, the handling scheme was adopted by Proto et al. [11]. Extraction involved a distance equal to 160 ± 23.12 m to which a bunching distance of 25 ± 3.9 m was added. The number of trees per load was on average 3.5 ± 0.7 with a volume of 0.90 ± 0.40 m3 and 1.87 ± 0.50 m3, respectively, for scenario (i) and (ii).
In scenario (iii) during timber forwarding, in addition to the driver operating the vehicle, another worker was entrusted to check loading operations. The extraction cycle time required to move a payload from the forest to roadside landing site was evaluated such as in Tiernan et al. [47]. Forwarding distance was equal to 560 ± 300 m including driving on the roadside landing site during loading/unloading. The number of logs per load was on average 30 ± 9 for a volume of 9.70 ± 3.80 m3.
Based on the engine power classification proposed by Spinelli et al. [48], the skidder was a medium-sized vehicle (power 110 kW) while the forwarder (Figure 1) belonged to a medium-class loading capacity (from 10 t to 14 t), according to Brunberg [49].
A forest work time study was conducted according to nomenclature proposed by Björheden et al. [50] and Acuna et al. [51]. In time-study [52,53], observed time was separated into working time (WT), which included the productive working time, the related main working time and the complementary working time, and nonworking time (NT), subdivided into mechanical, operational and personal delays.
The normal distribution of the results was checked by the Kolmogorov–Smirnov tests. Based on the outcomes of this analysis, a nonparametric Kruskal–Wallis test was used to test the results that did not meet the assumption of normality. Free R software version 4.0.4 (R Foundation for Statistical Computing Platform) was used for data processing. If a significant difference was found between groups, pairwise comparisons using the Dunn–Bonferroni approach was used.

2.2. Economic Analysis

The economic assessment was carried out by comparing the harvesting costs of different harvesting systems. The method described by Miyata [42] was applied to determine the machine hourly cost (Table 2), and thus, through the hourly yields of the individual mechanical operations, it was possible to determine the cost per m3 of wood harvested in each harvesting system. Both the fixed and variable costs were considered, whereas the fixed costs consisted of the interest on capital goods, depreciation, insurance and maintenance of the machinery, while equipment and variable costs consisted of the fuel and oil consumption and operator–machine labour.
The technical and economic data of the machinery were collected from direct measurements at the harvesting sites and through face-to-face interviews with experts in the silvicultural sector. For the labour remuneration, the opportunity cost approach was adopted by assuming the employment of temporary workers for felling and processing and mechanical extraction [54] and adopting the current hourly wage, which included social security contributions. The remuneration for the qualified workers undertaking mechanical operations was a gross pay of EUR 8.60 h−1, whereas that for the other workers was equal to EUR 7.20 h−1. The working day was considered 8 h. Was assumed a salvage value for the machinery equal to 10% of purchasing value, and an interest rate of 2% was used to determine the interest on capital goods.
To evaluate the harvesting cost of “1 m3 of wood”, the hourly cost of each operation was divided by the harvesting wood yield per hour, and then the single costs characterising the logging system were added up (Table 3).

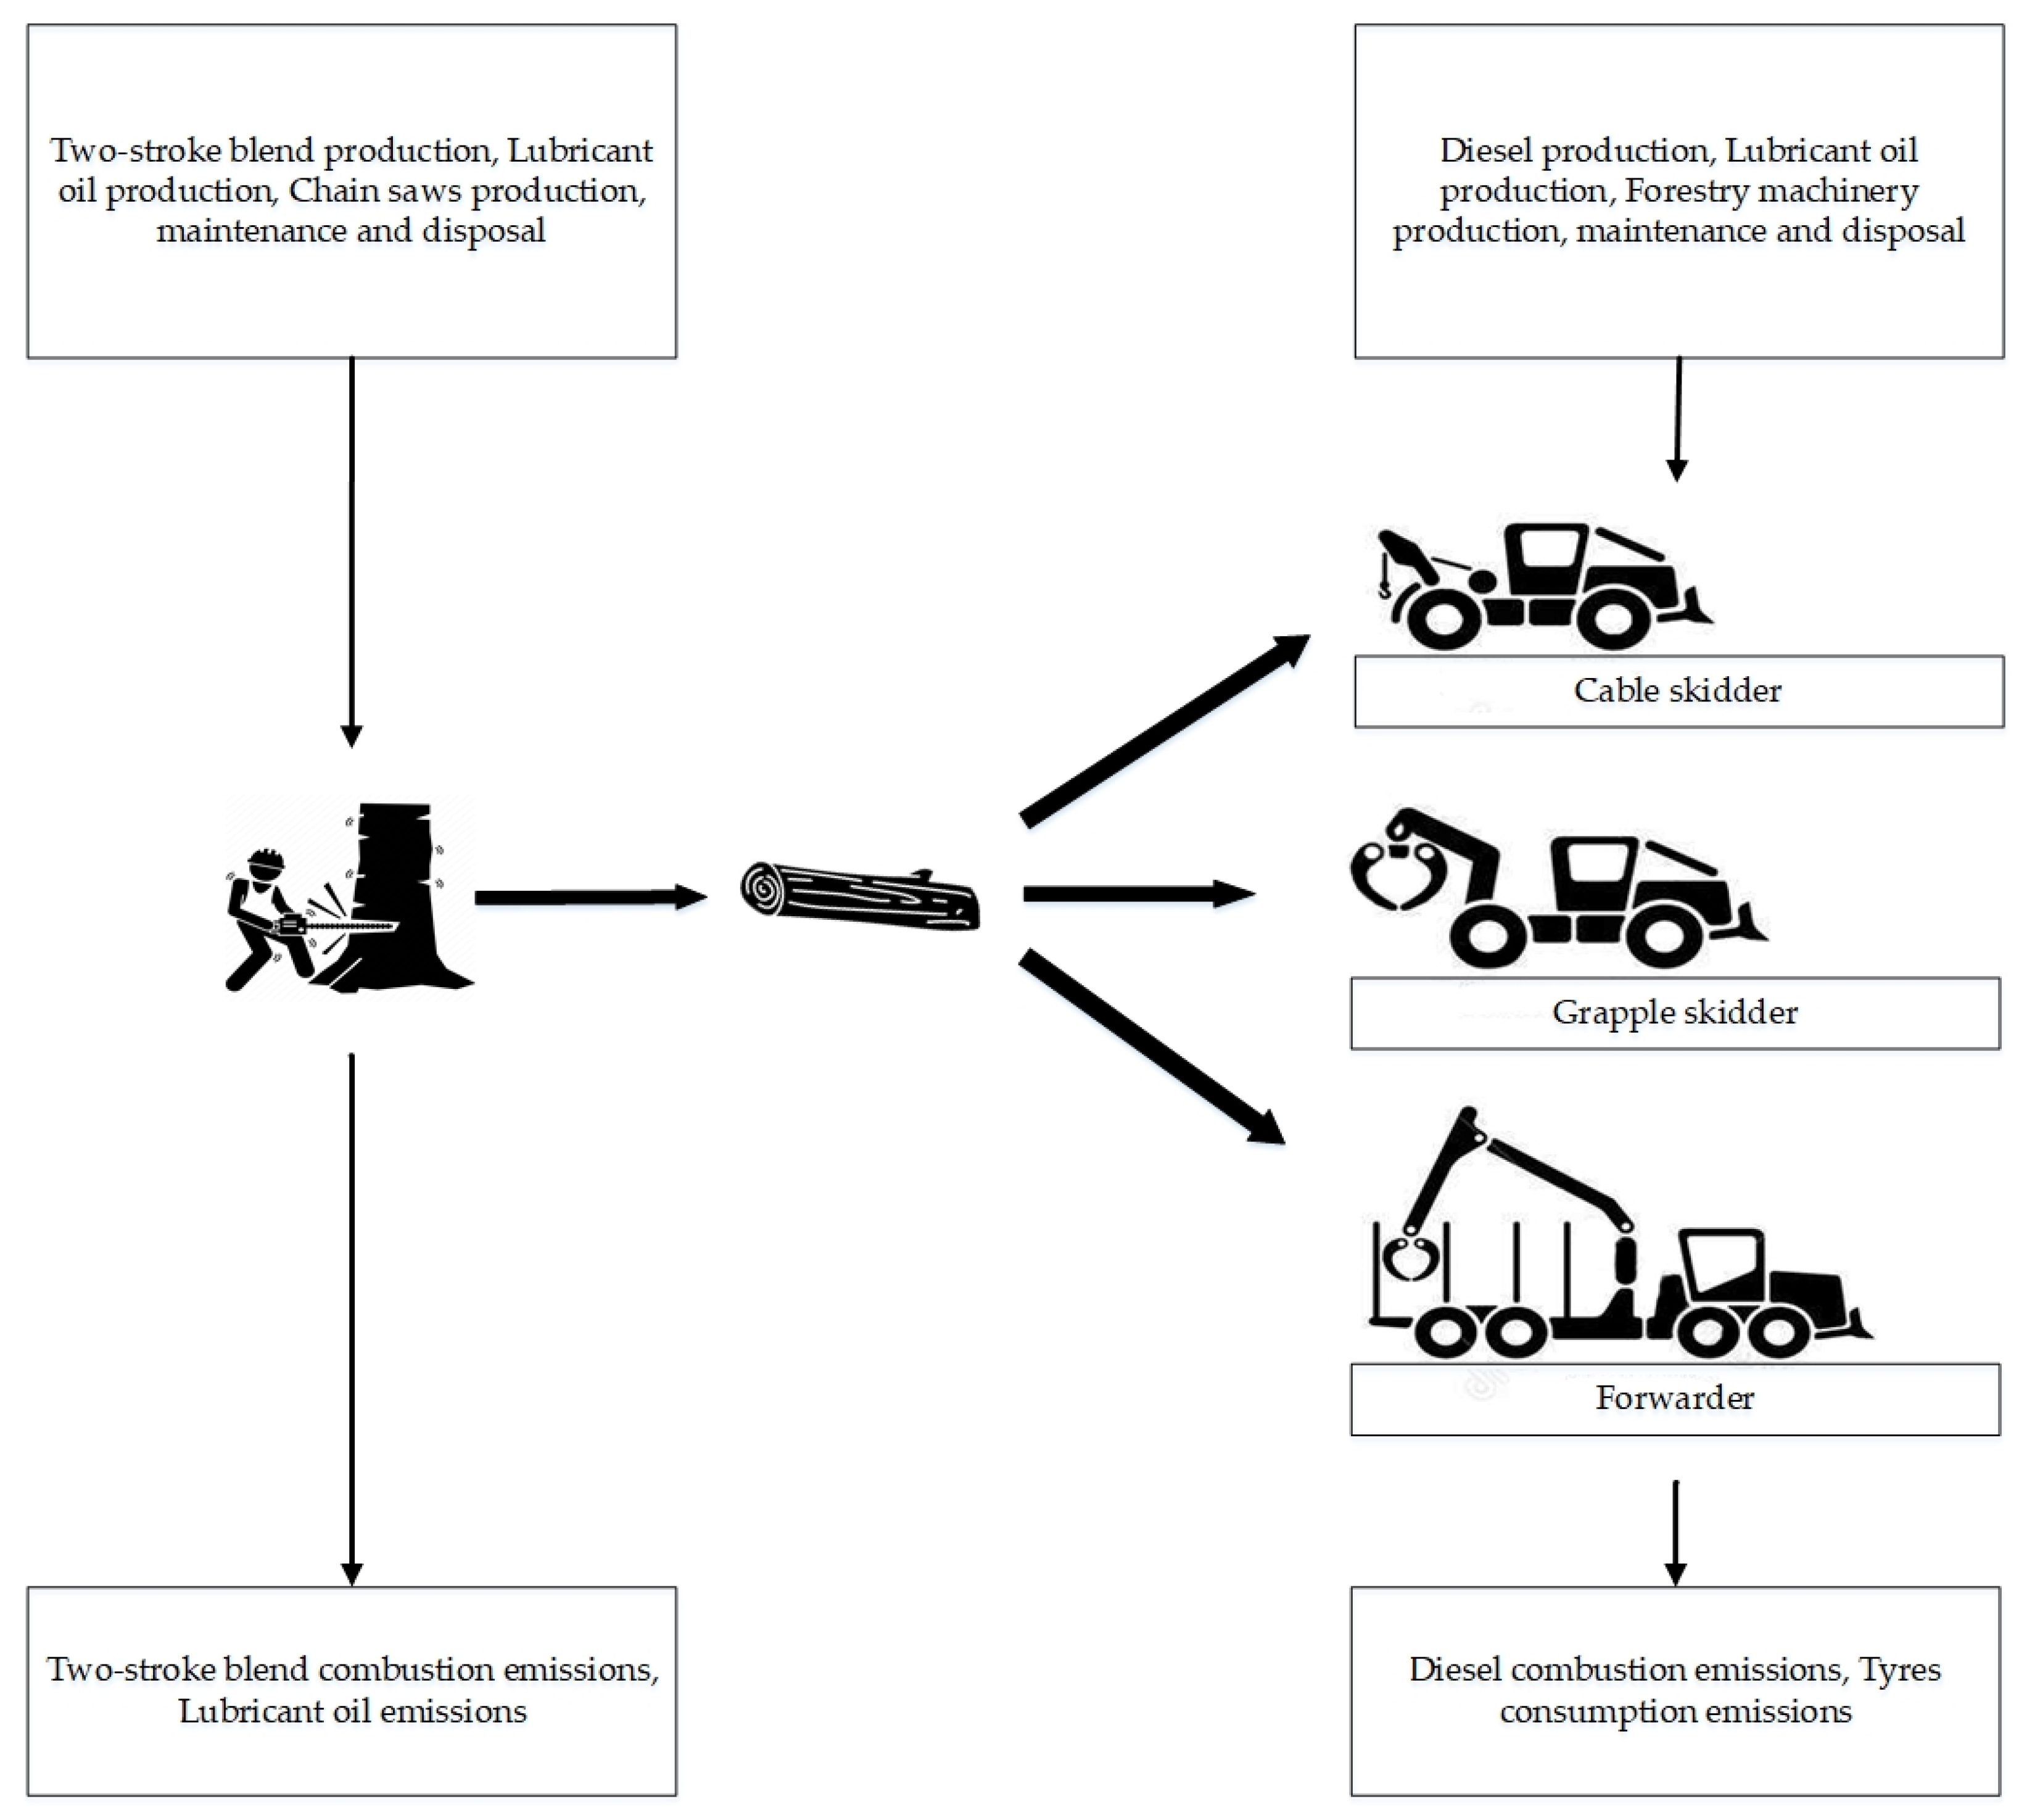
2.3. Environmental Analysis

The environmental analysis was carried out through the application of the LCA methodology. Framework and guidelines refer at ISO norms [26,27]. Following the structure suggested by ISO standard [26], the first step was to define the goals and scope. From an environmental perspective, the objective of the present study was to compare three different wood harvesting systems. According to Nemecek et al. [55], agricultural systems can perform different functions (e.g., productive, ecosystem, etc.); therefore, different Functional Units (FU) can be identified depending on the function to be analysed. The same can be said for forest systems, whose production process is mostly limited to wood harvesting. In particular, “1 m3 of wood harvested” was chosen as FU, preferring a volumes unit to a mass unit, since the latter is more conditioned by the moisture level of the product and the type of wood [6]. However, to provide useful data for the scientific community, elaborations were carried out for individual logging operations referring to a reference unit of “1 h of execution”. This unit is more easily scalable and therefore could be useful for applying the results obtained to other studies [56,57]. The system boundary includes all the operations of wood harvesting (felling, bunching, extraction and processing), chipping and secondary timber transport of wood. In particular, all background processes related to inputs involved in logging operation are considered (fuel production, lubricating oil production and machinery and tools construction maintenance and disposal) as well as foreground processes such as fuel and lubricant consumption, air emissions from fuel combustion, soil emissions from tyre abrasion and lubricant oil losses (Figure 2).
The inventory data related to background processes were collected from Ecoinvent 3.7.1 [58], while data from foreground processes were directly collected (Table 4), such as data on consumption or run times, while data on emissions generated by fuel combustion and those generated by tyre consumption were estimated according to Nemecek et al. [59]. For the chainsaw and shed, namely, the main machinery used in harvesting operations, an allocation was carried out considering their use in the operations and their lifetime.
Grease and other materials of minor importance (e.g., water, liquids for pneumatic systems) were excluded from inventory because their incidence on the results would have been negligible (less than 1%). In the life cycle impact assessment (LCIA) phase, the environmental impact data were processed using SimaPro 9.2 software [60] and the ReCiPe 2016 method at the midpoint level [61].

3. Results

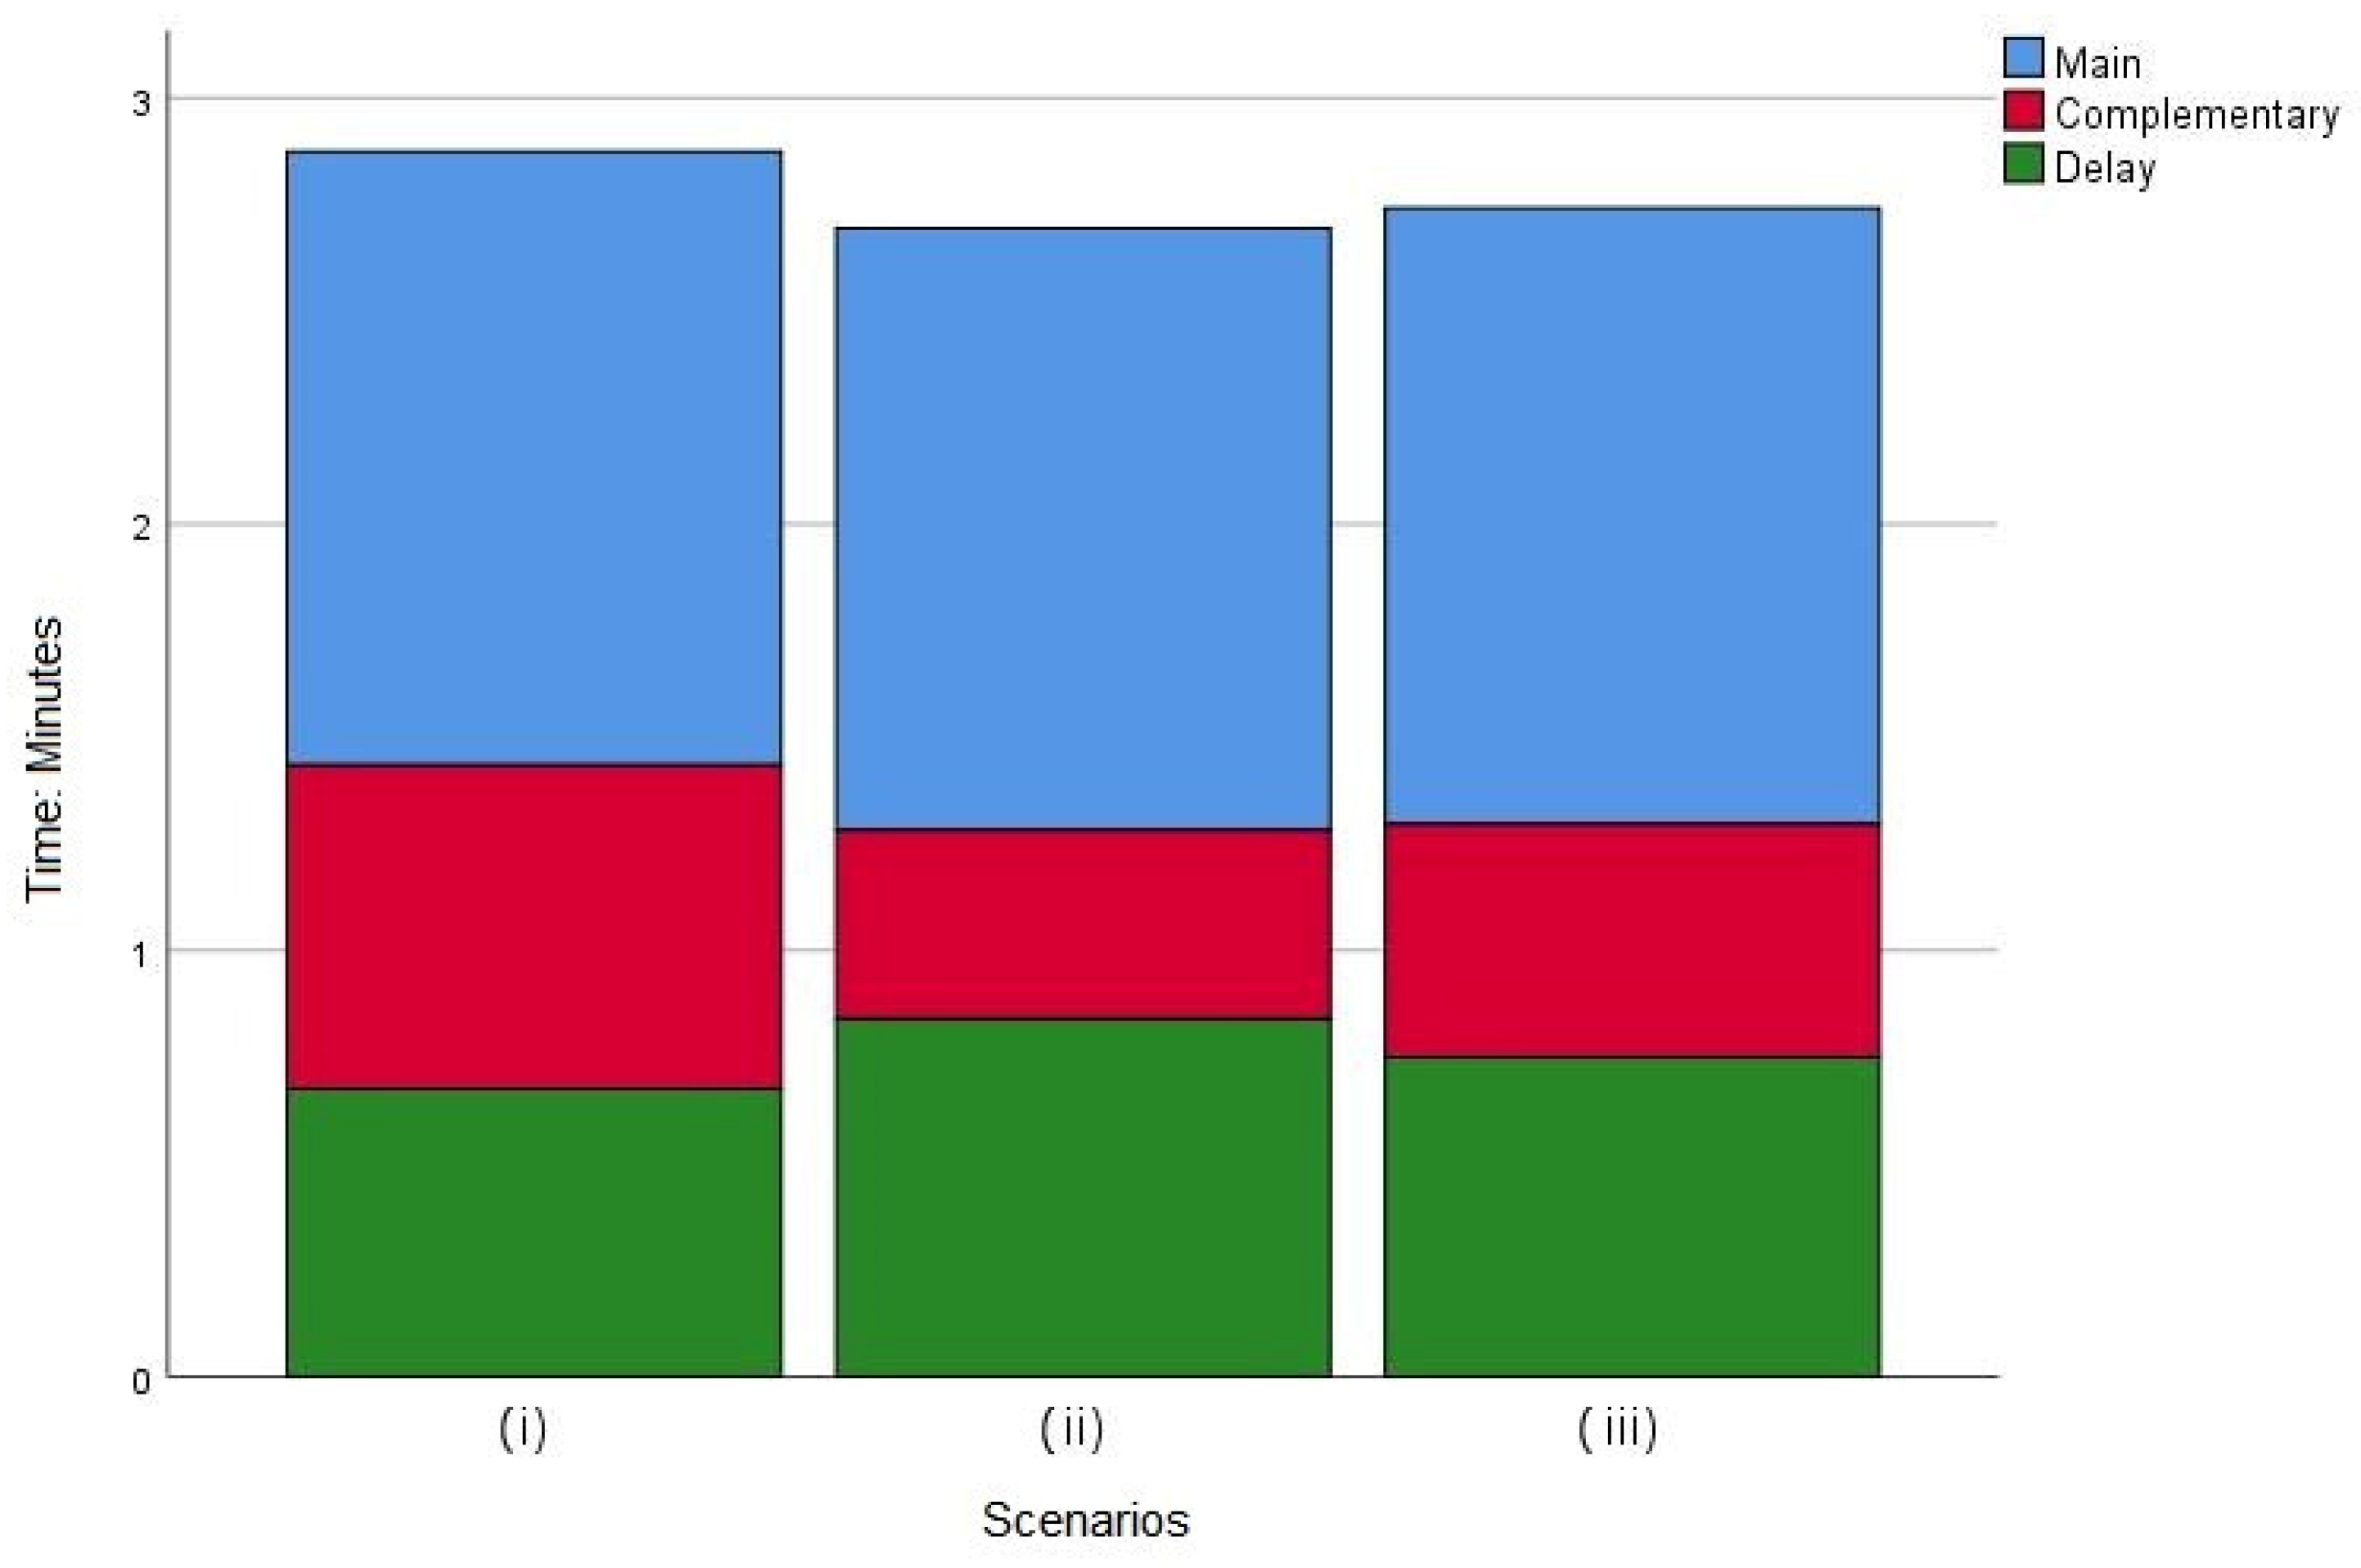
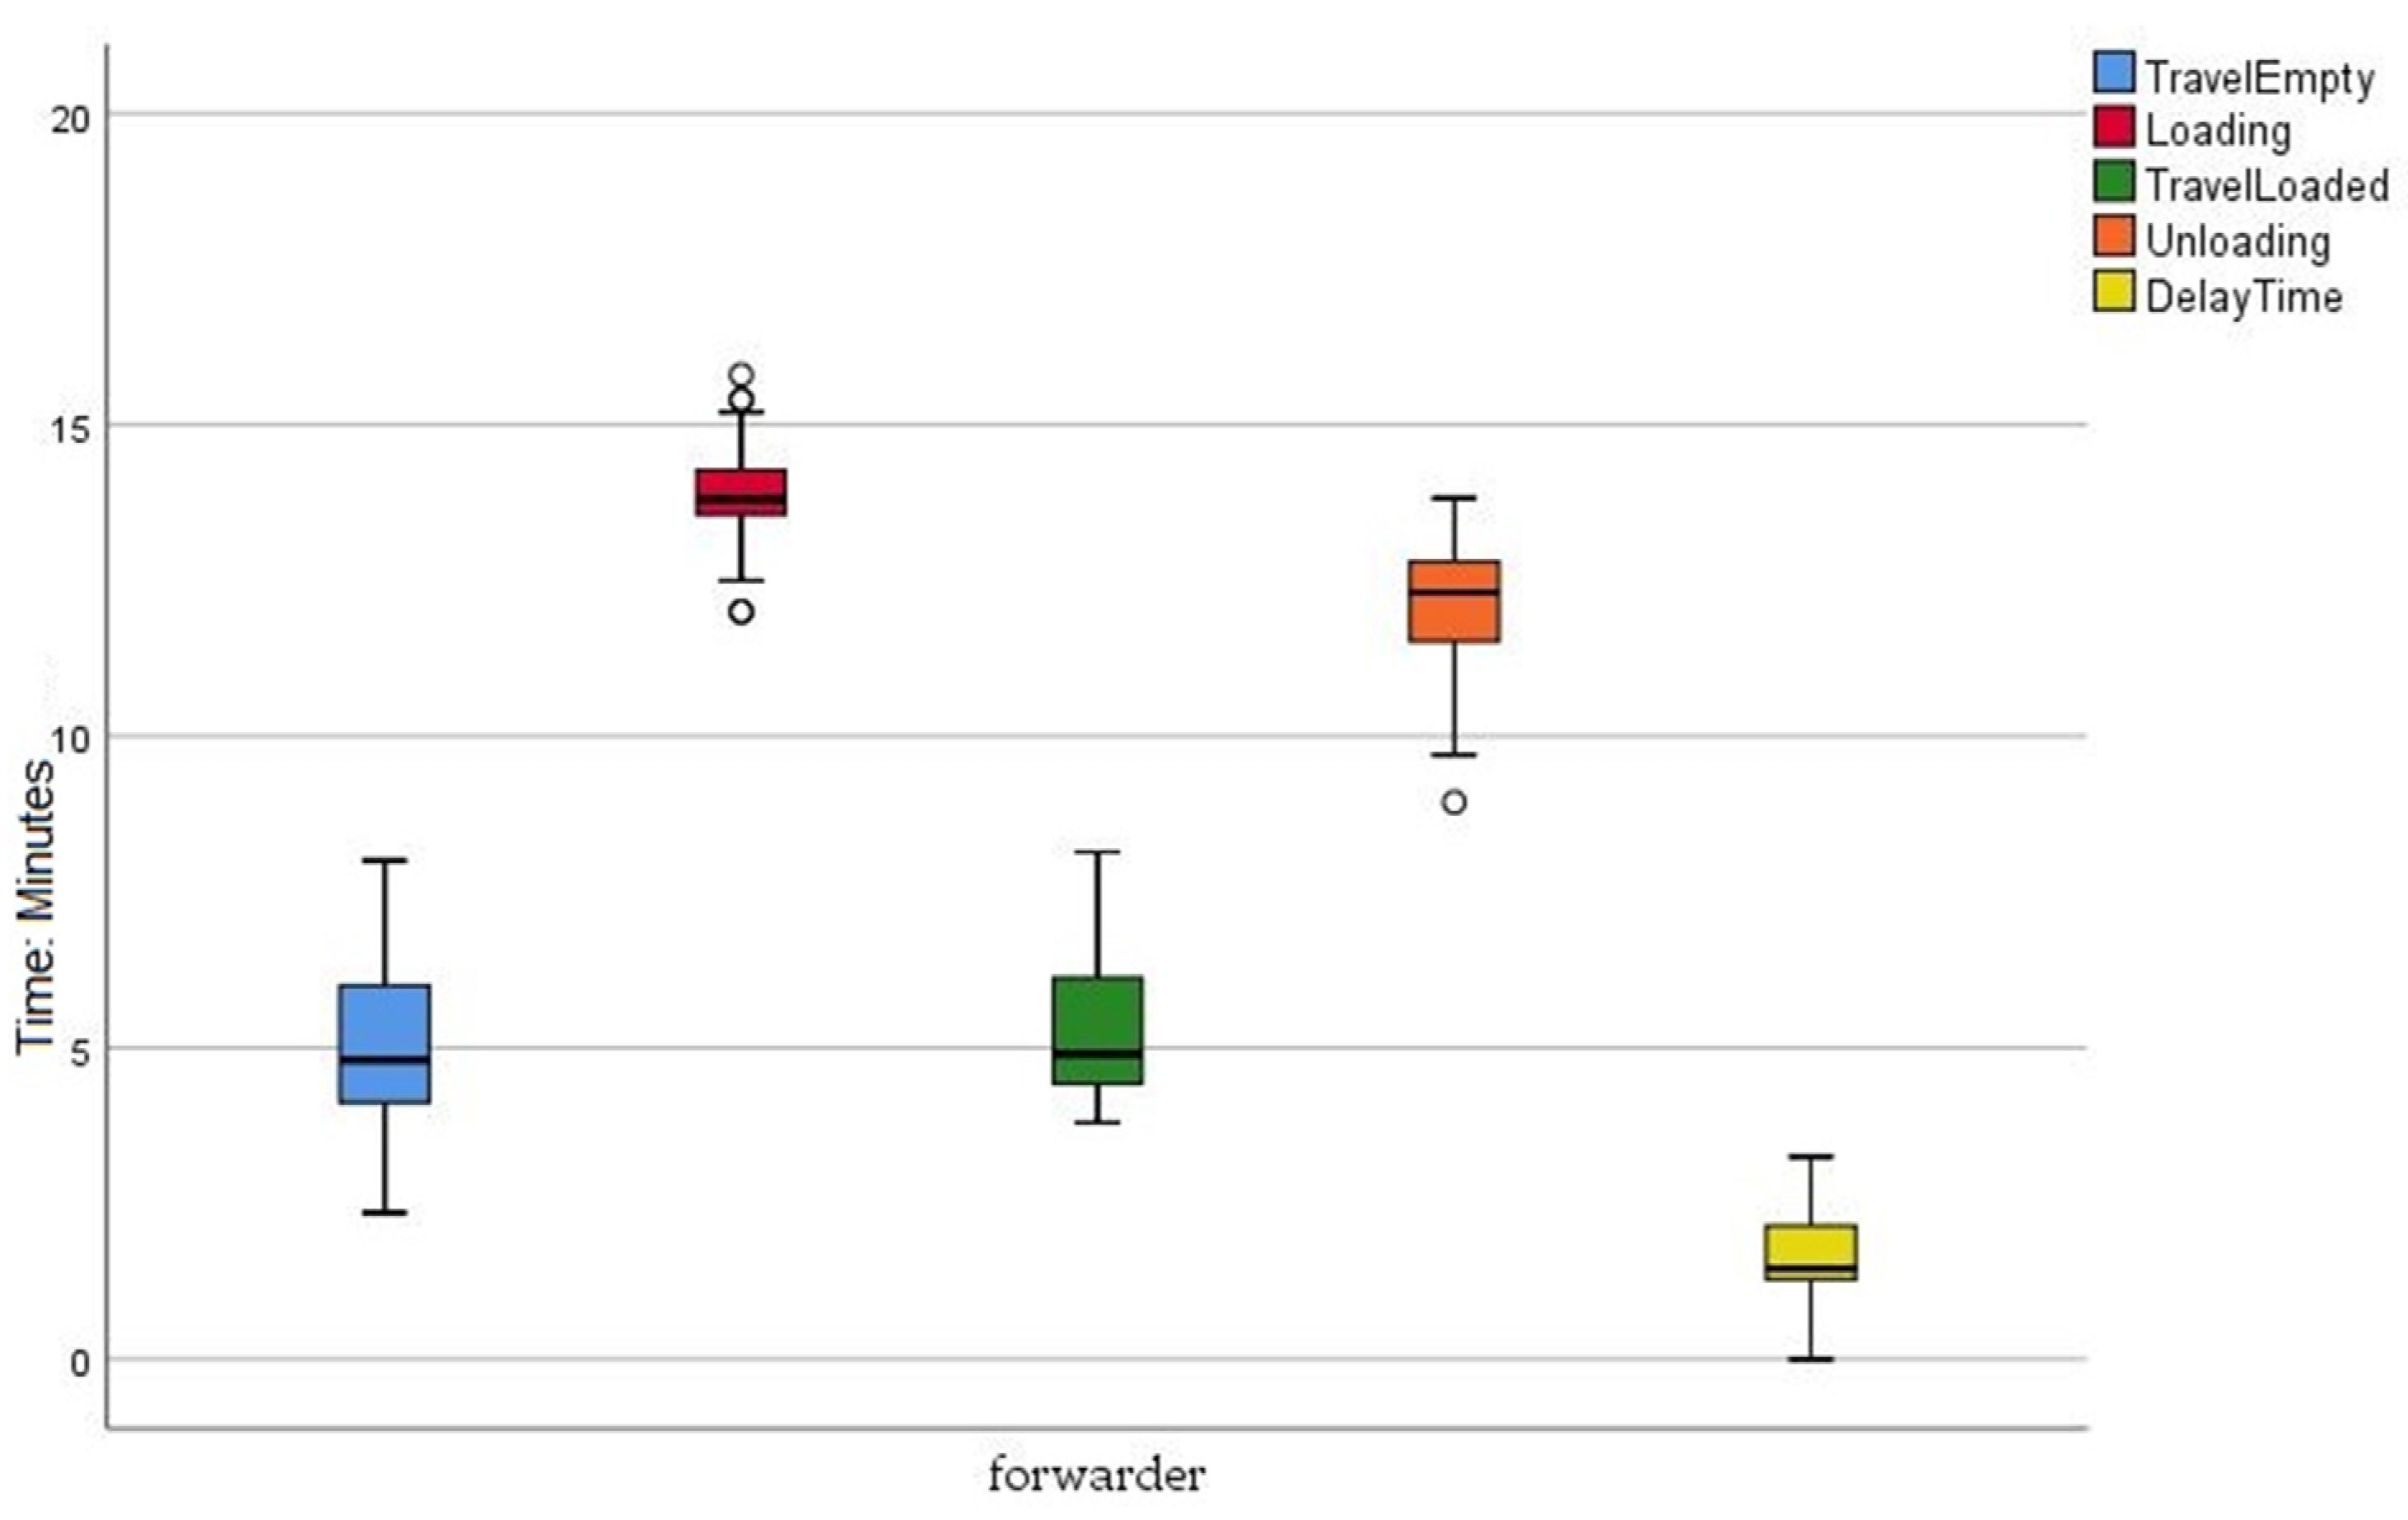
3.1. Productivity Assessment

Tree felling was realised by the same working team in all scenarios. The results do not show any significant difference; in results reported by Câmpu and Ciubotaru [62] under the same work conditions, only different working teams achieve different productivity. Figure 3 shows de facto a substantial homogeneity among work times recorded. Team productivity, calculated as average gross productivity, inclusive of all delays up to the maximum event duration of 15 min (Productive Hour System, PHS15), is equal to 21.7 trees h−1, corresponding to a volume of timber of 5.3 m3 h−1. The same value, when we consider average net productivity (PHS0) excluding the delays, is equal to 30 trees h−1 for a volume of 7.4 m3 h−1. On average, productive worktime occupies 69% of total workplace time, while work-related delay time 31%. Considering a working day of 8 h, productivity was equal to 86 trees d−1 worker−1 for a volume of timber of 21.6 m3 d−1 worker−1.
Wood extraction, carried out considering average net productivity (PHS0), highlights a significant difference between the three methods (χ2 = 130.32 df (2), p < 0.001). The same outputs were obtained considering the average gross productivity (PHS15) (χ2 = 130.37 df (2), p < 0.001). In scenarios (i) and (ii), significant differences among complementary times (χ2 = 68.53 df (1), p < 0.001) and delay times (χ2 = 12.14 df (1), p < 0.001) were observed.
Total extracted timber volume for all methods was around 700 m3, resulting in more than 2100 logs. About 46 m3 and 170 logs were extracted in scenario (i), 90 m3 and 190 logs in scenario (ii), and 560 m3 and 1750 logs in scenario (iii). On average, productive worktime occupied 90% of total workplace time, while work-related delay time was up to 10%. Higher mean time consumption per cycle was recorded in method (iii), due to the different organisation of work system, based on a high log’s number extracted. Furthermore, the winch took longer than the grapple compared to the half of volume logged. Time consumption was distributed as shown in Figure 4 and Figure 5.
In scenario (i), work productivity corresponds to a volume of timber for the worker of 1.6 m3 h−1, equal to 5.1 m3 h−1 if referred to the work team and 40.6 m3 day−1 considering a working day of 8 h. The other two scenarios have shown values of 6.8 and 9.3 m3 h−1worker−1, respectively, for methods (ii) and (iii), which, if referred to the work team, increased up to 13.6 m3 h−1 (108 m3 day−1) and 18.6 m3 h−1 (148.8 m3 day−1).

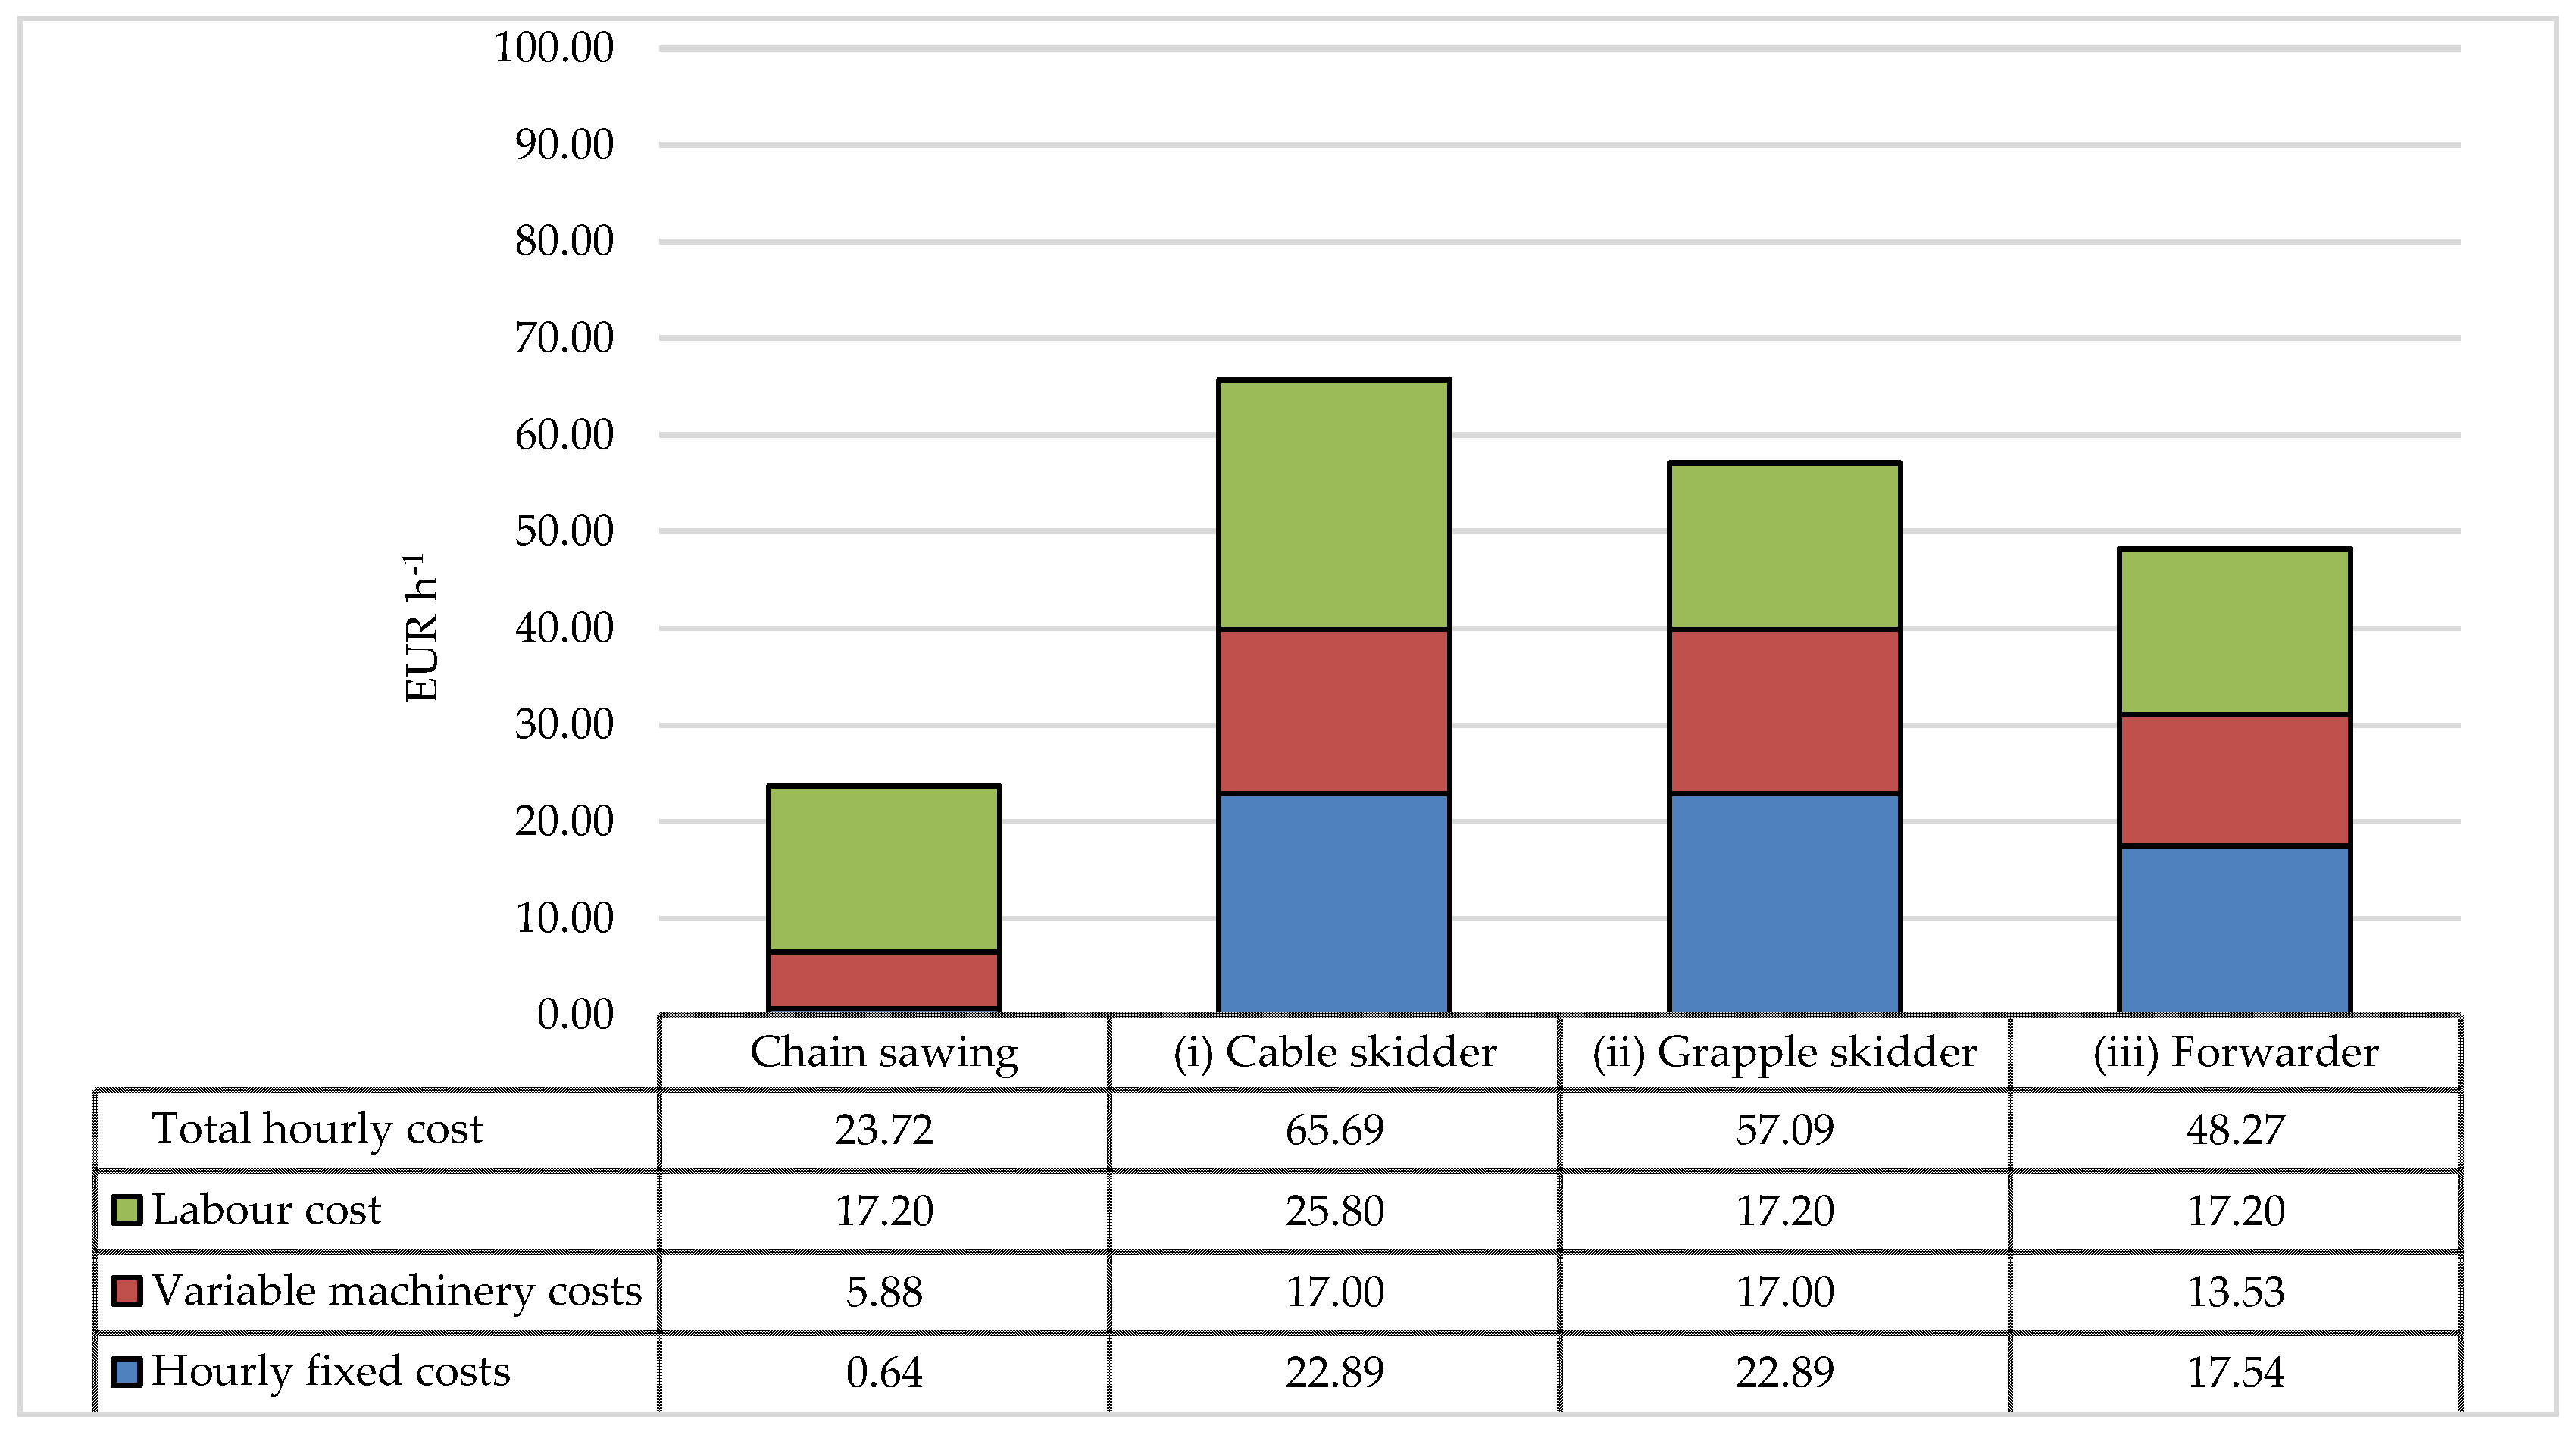
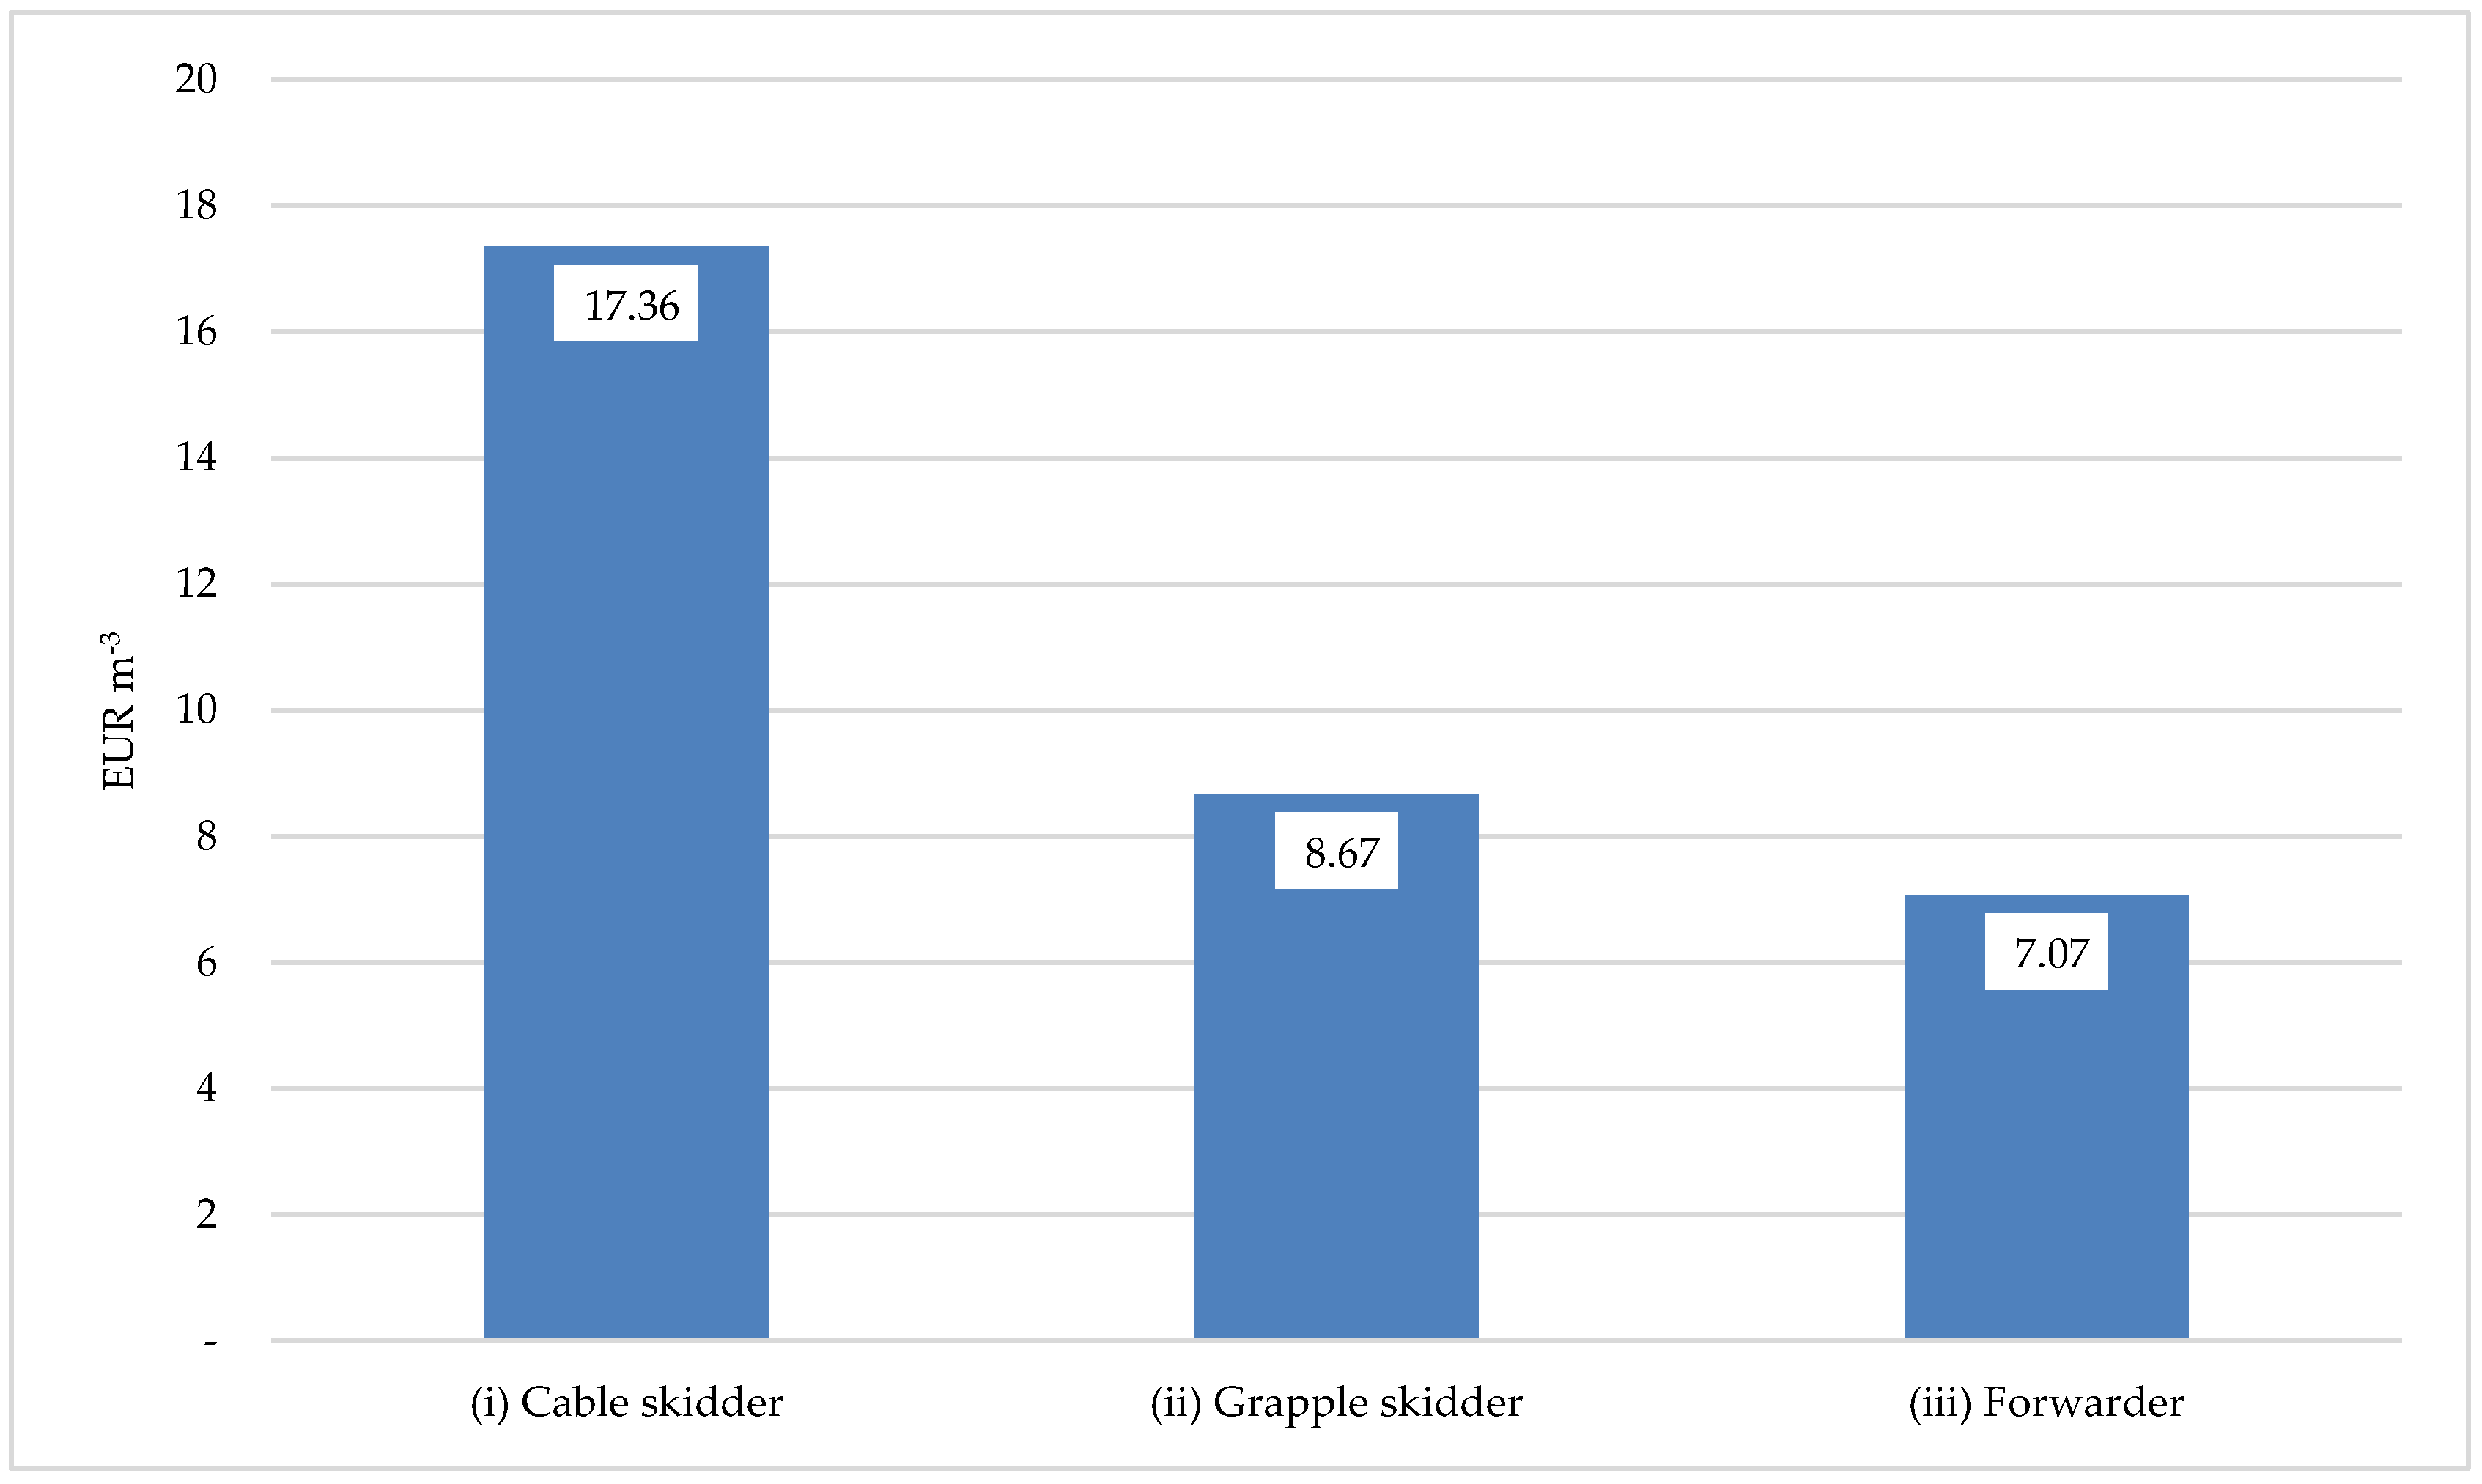
3.2. Economic Assessment

The economic results related to the hourly costs of the different logging operations show a certain variability. As can be seen in Figure 6, excluding the hourly costs related to felling and processing, which are common to all three logging systems, the hourly costs related to the three harvesting systems show quite different costs. In particular, scenarios (i) and (ii) differ substantially due to the greater use of labour in the first one, while in scenario (iii), the use of the forwarder presents lower fixed costs and lower variable costs compared to the use of the skidder.
Analysing the three different wood harvesting systems as a whole through the analysis of the cost of “1 m3 of harvested wood” (Figure 7) results in even greater differences observed. Scenario (i) presents an overall cost of EUR 17,356.00 m−3, making it the most expensive, followed by scenario (ii); scenario (iii) is the most convenient, with a cost of EUR 7071.00 m−3.
This result can be explained by the higher hourly yield of the scenario (ii) compared to the scenario (i) and lower labour costs.
As can also be seen in Table 5, in scenario (ii), there is a lower incidence of fixed costs and a higher incidence of variable costs.
The harvesting scenario (iii) showed better results due to a lower incidence of fixed and variable costs as well as a labour input for wood extraction limited to only two operators. From a purely economic point of view, this system would always seem to be preferable.

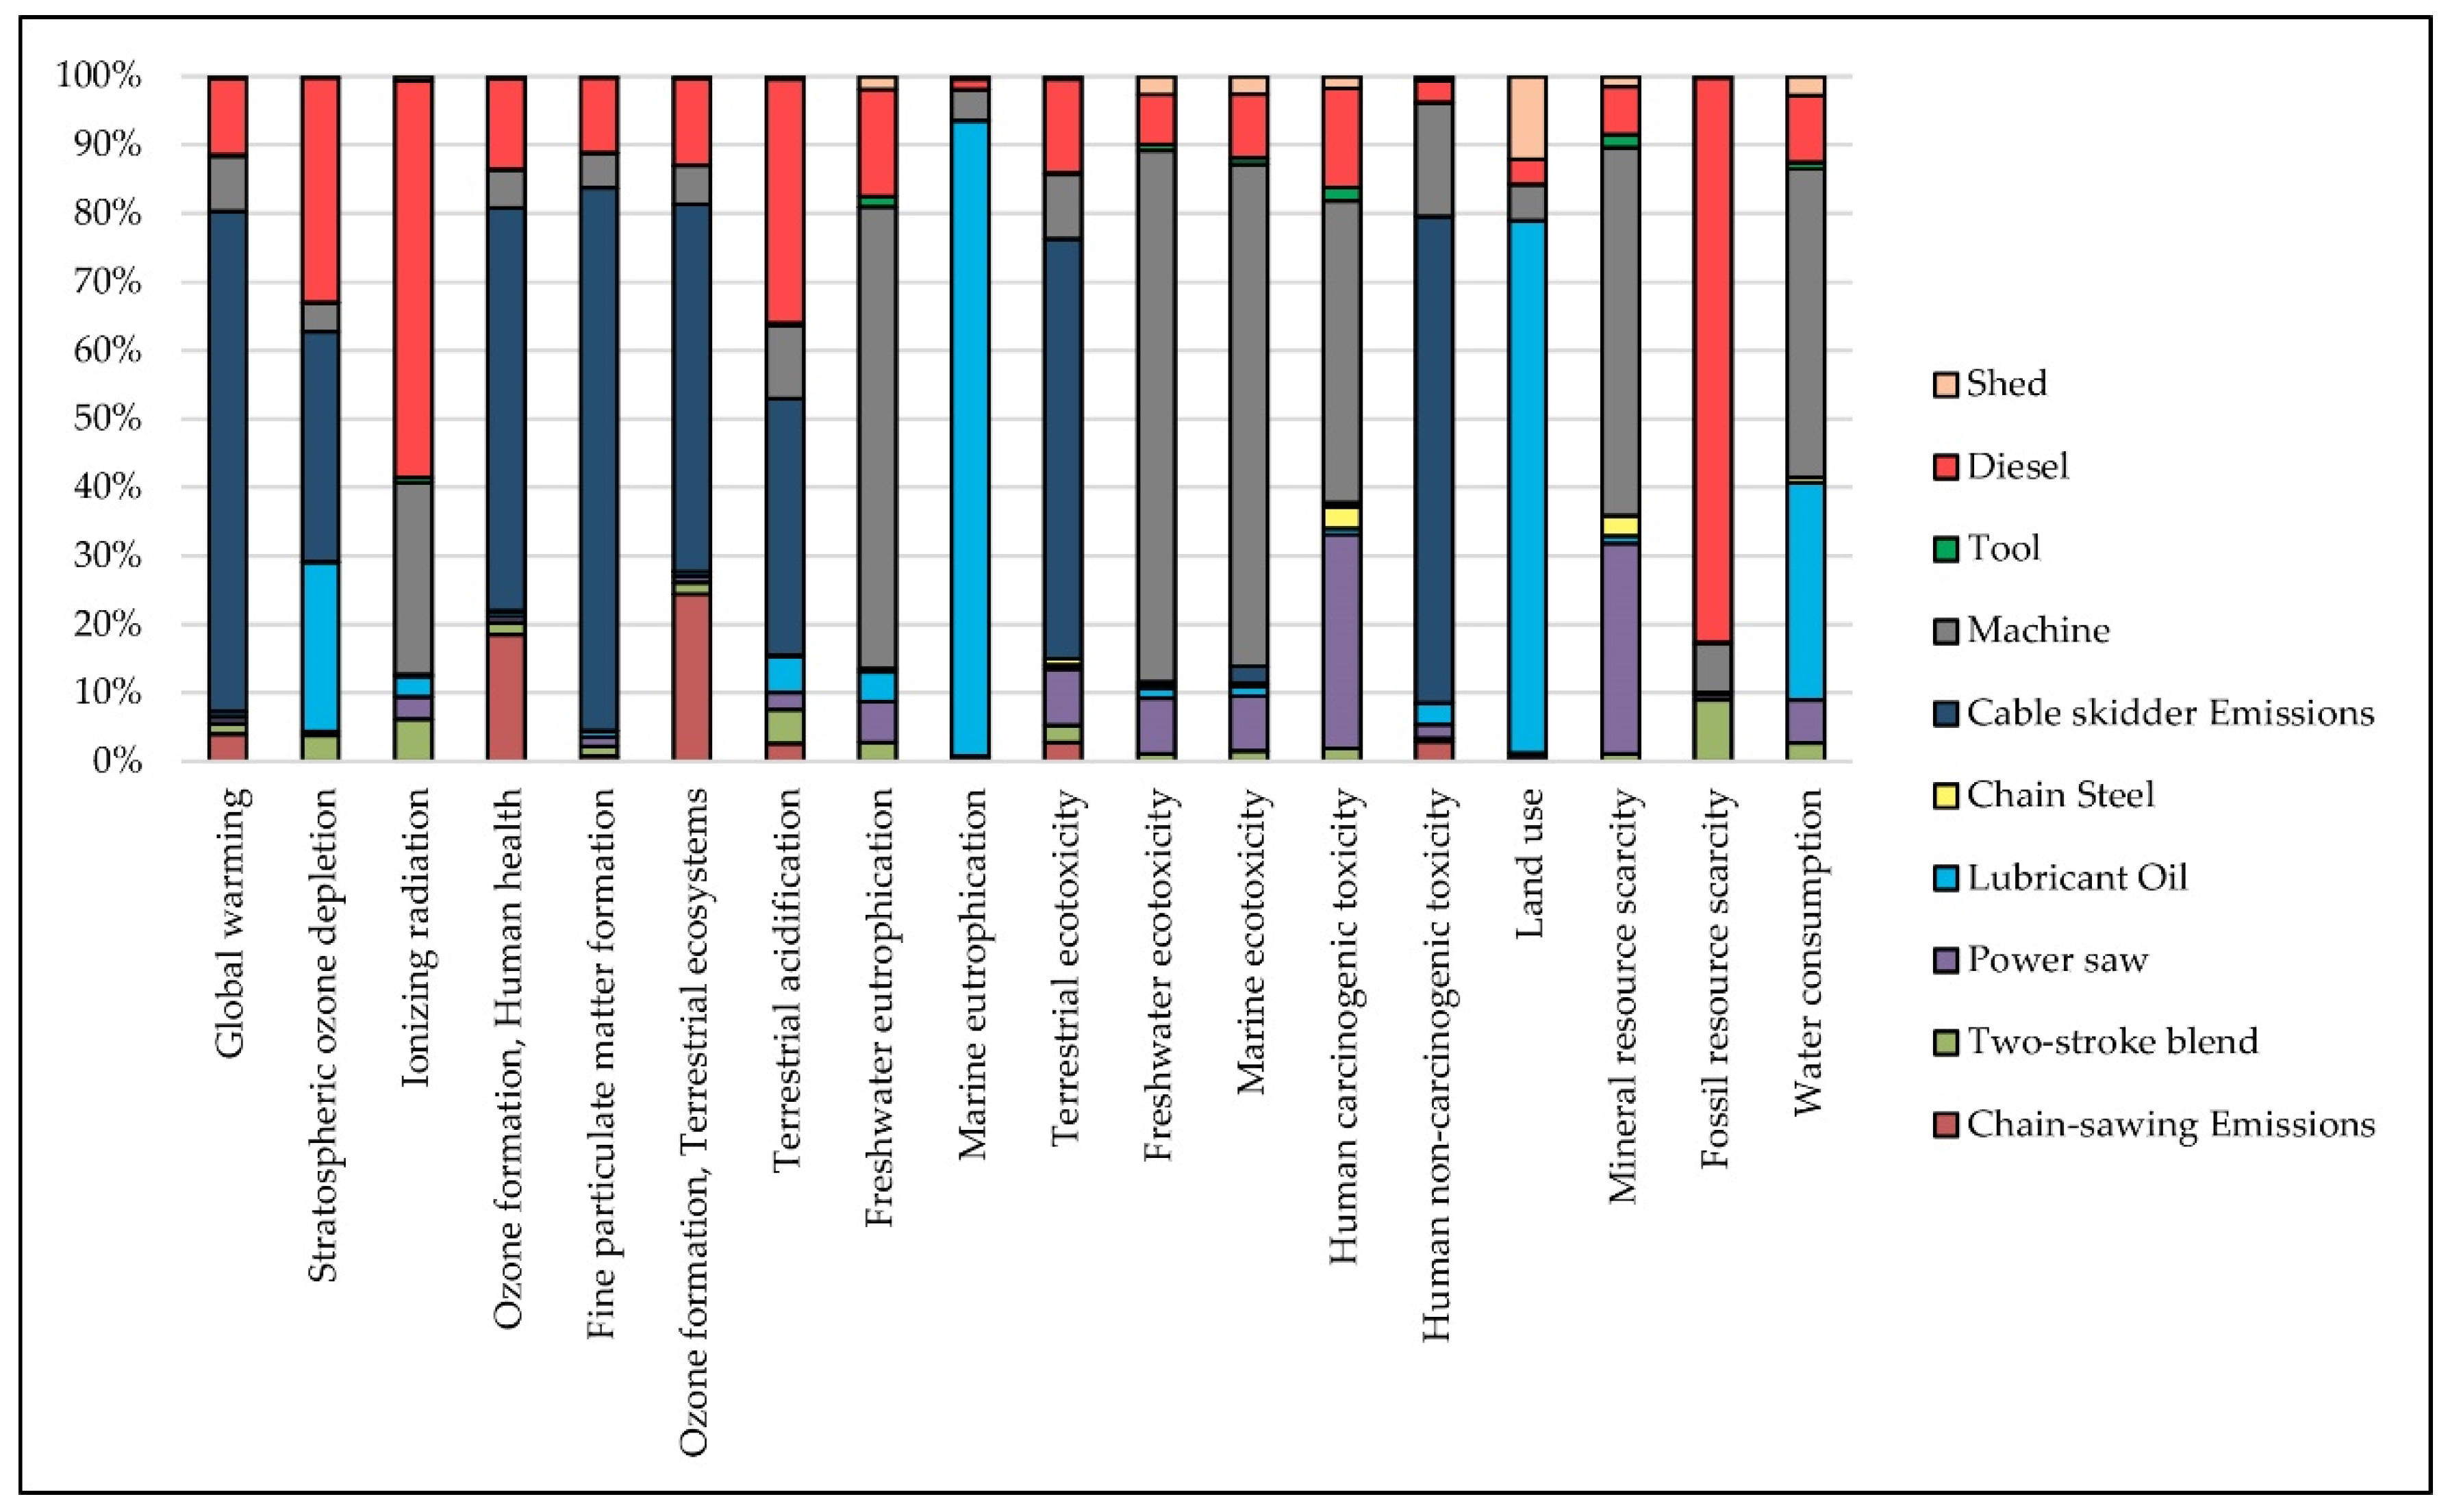
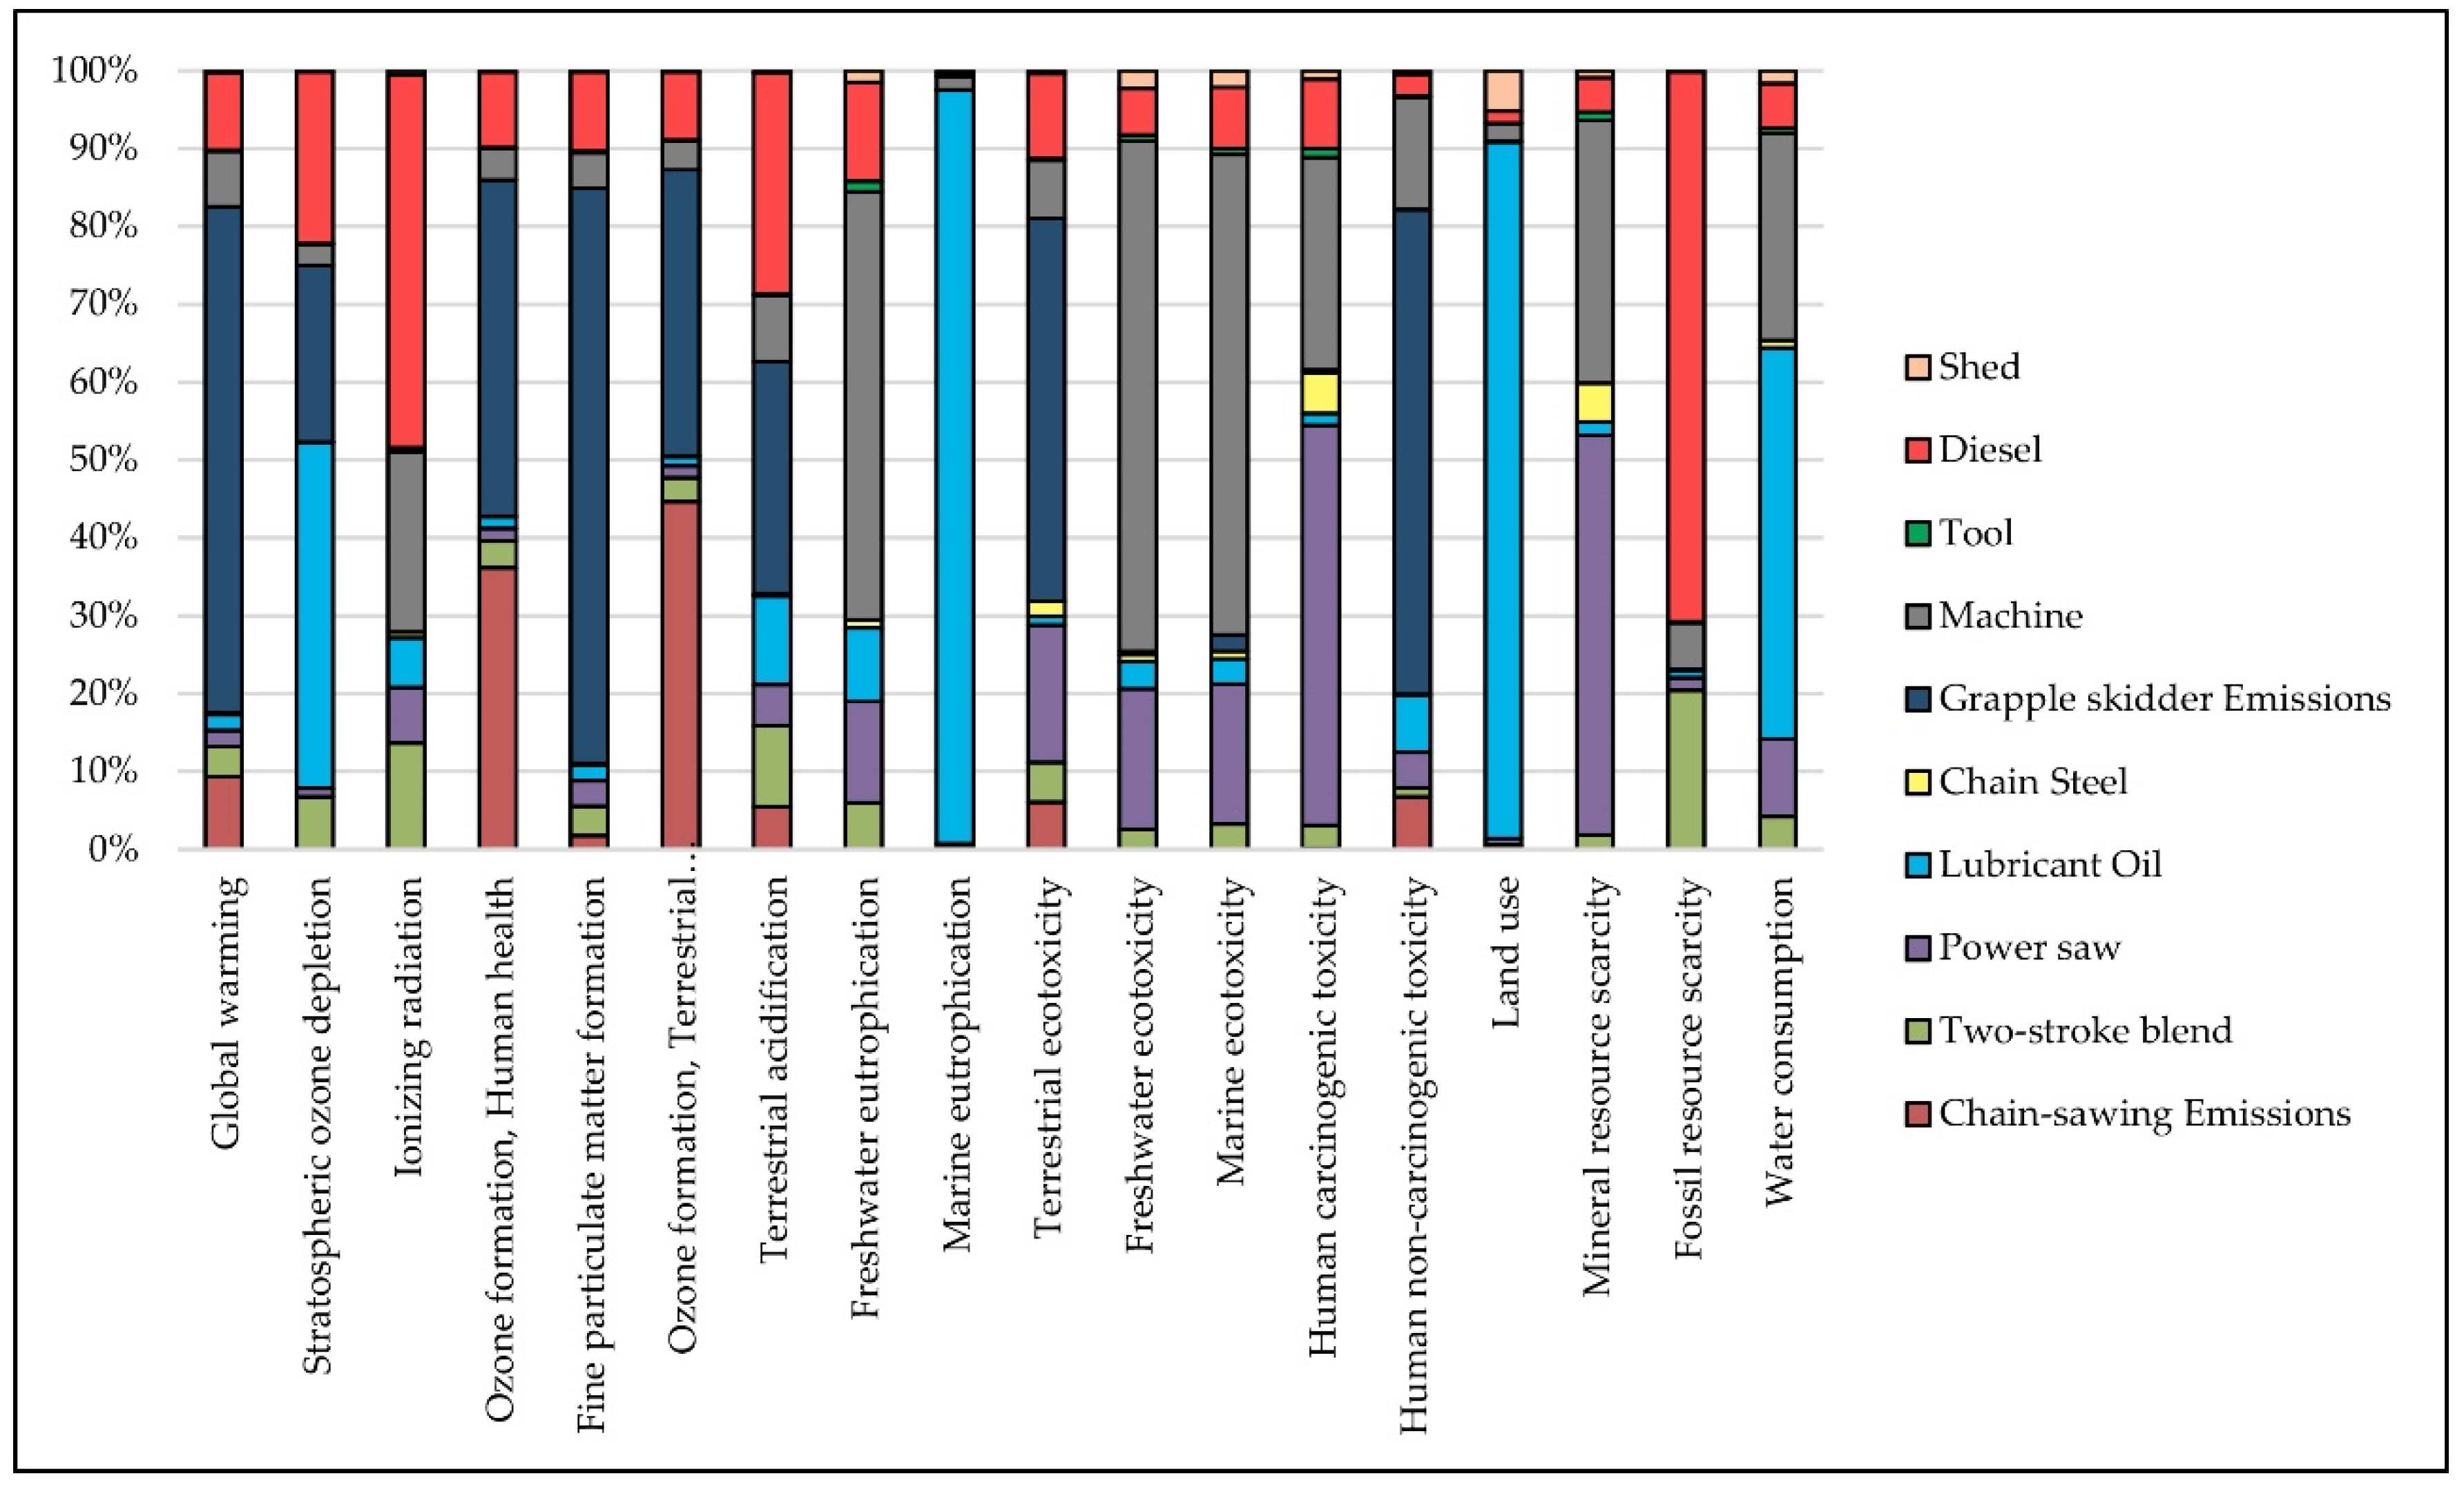
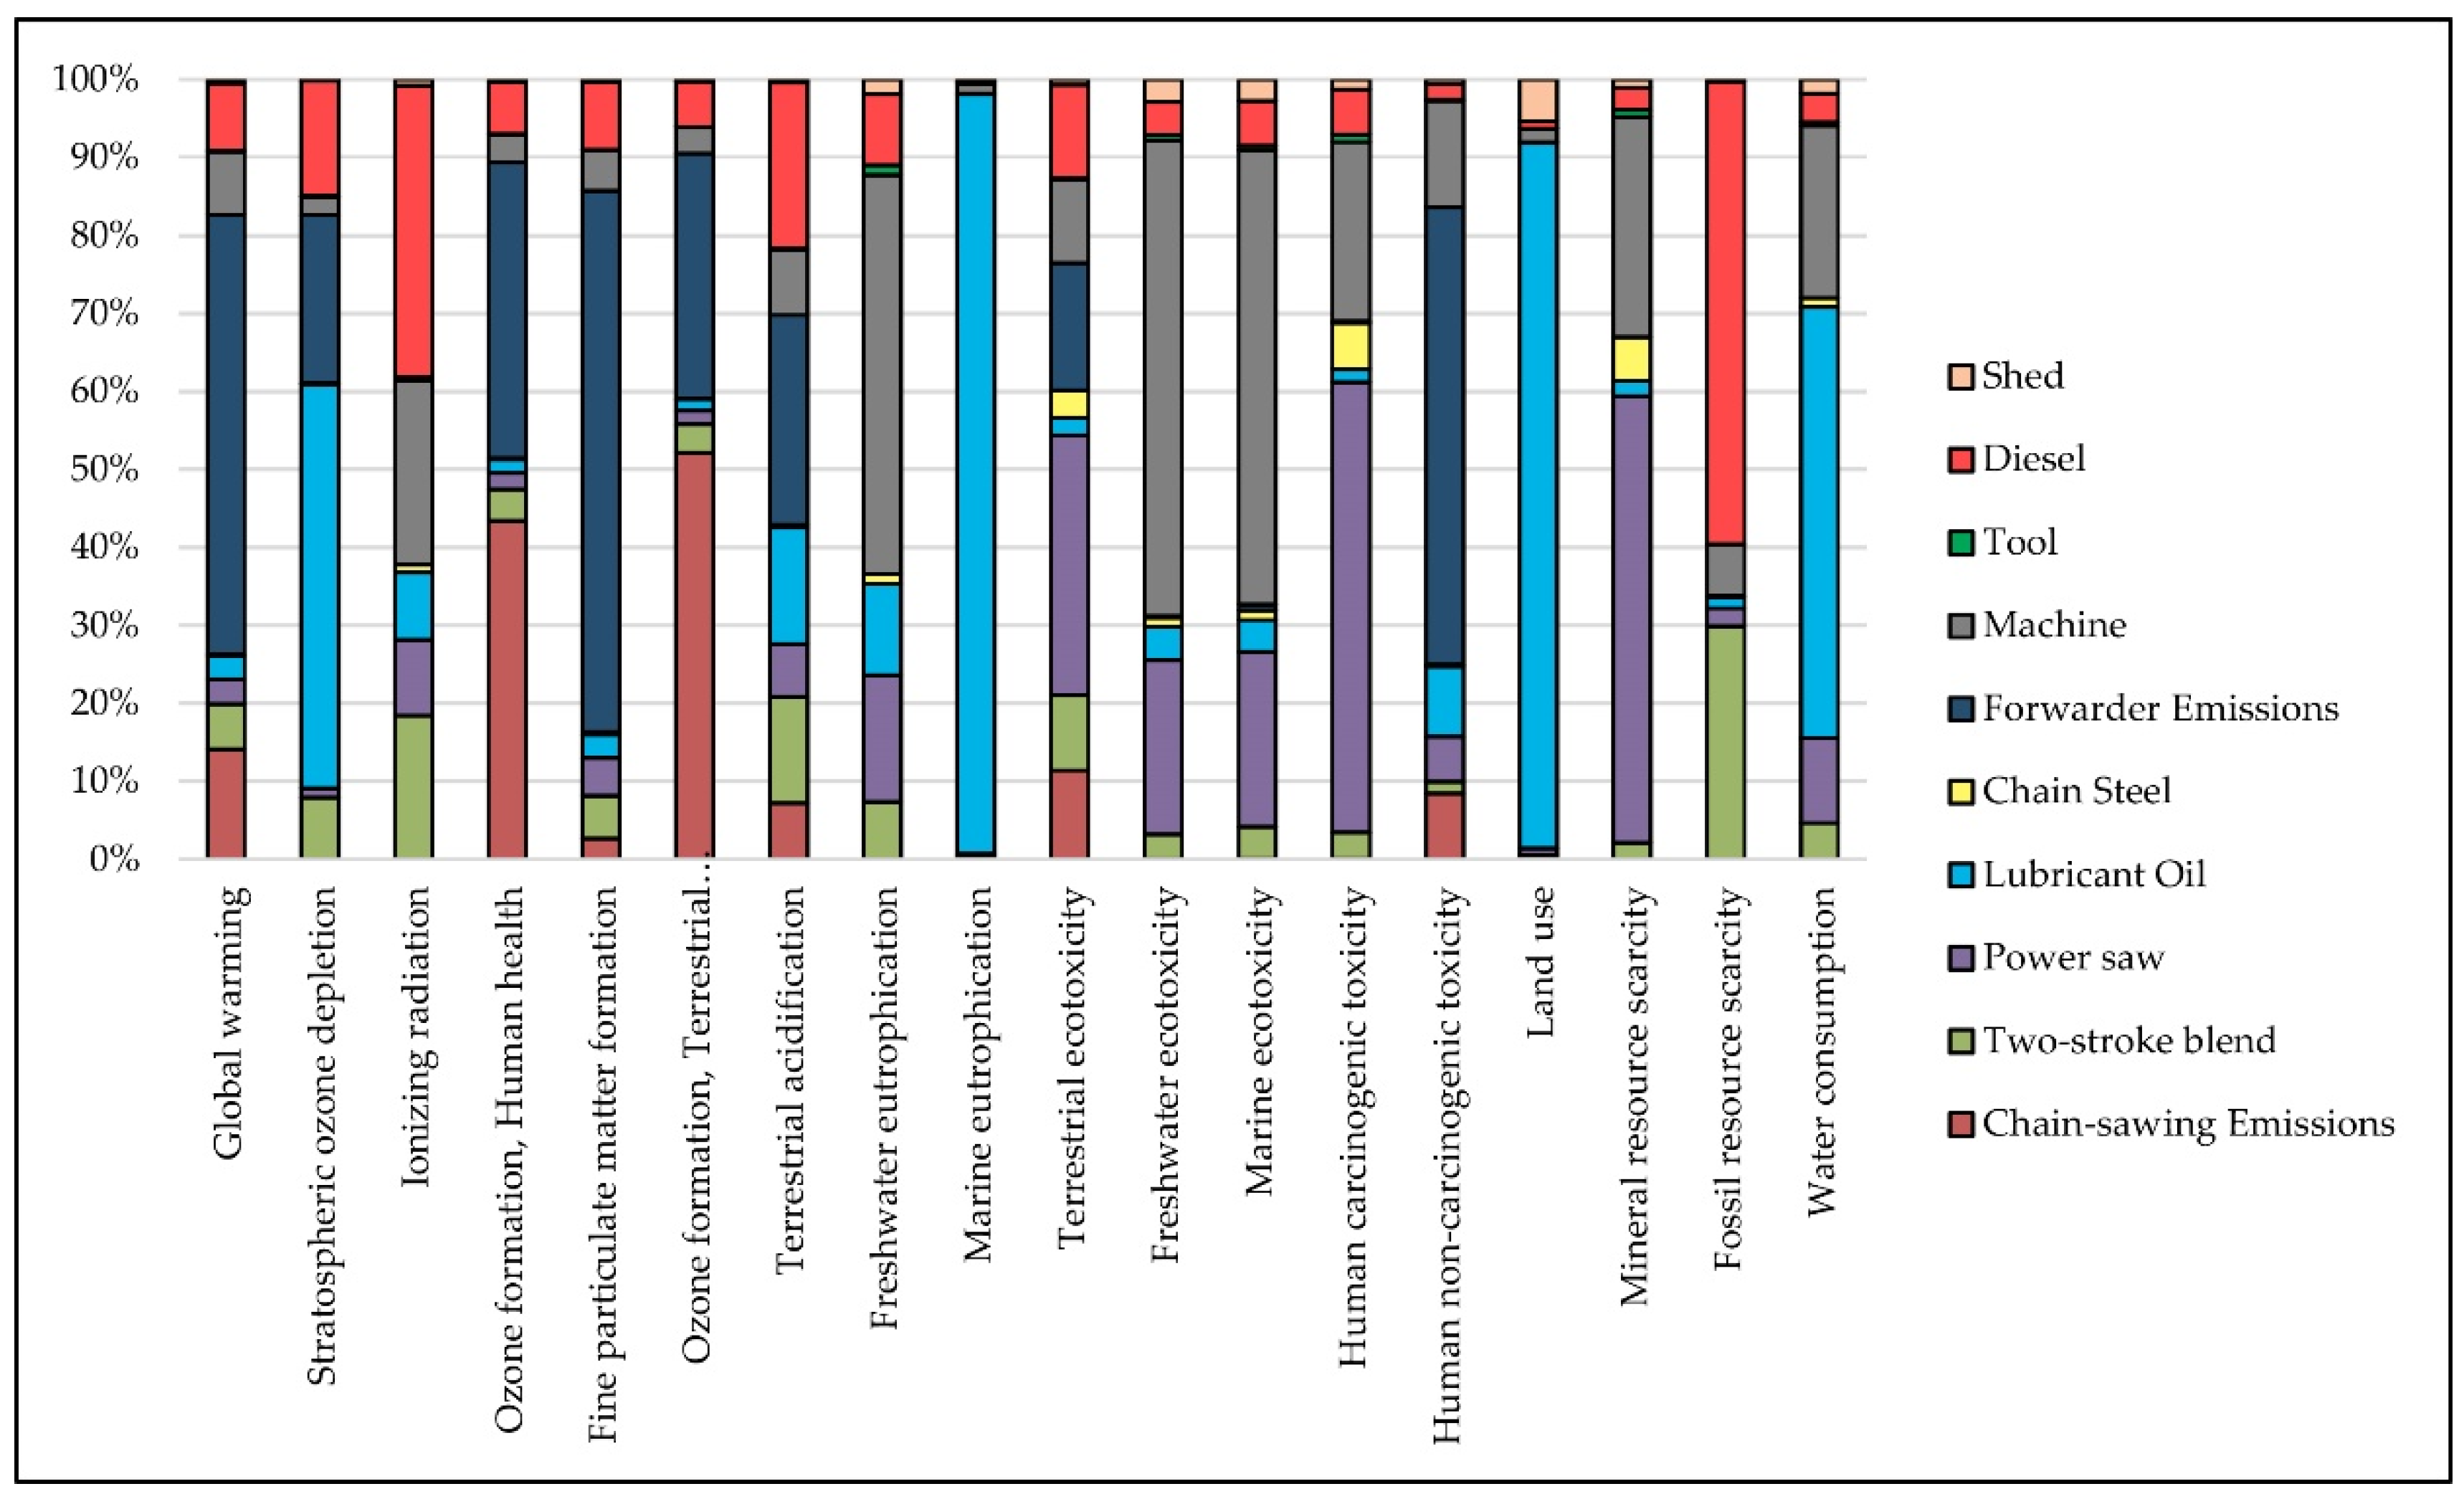
3.3. Environmental Assessment

From an environmental point of view, results of the impacts’ characterisation per “1 m3 of harvested wood” (Table 6) show that scenario (ii) has the best performances in all impact categories, except for the category “Fine particulate matter formation”, where it comes second to scenario (iii). However, analysing the absolute value of the impact for this category, it is easy to see that scenario (ii) and scenario (iii) present practically identical values. Scenario (i) and scenario (ii) rank second considering that scenario (i) performs better in the categories “Stratospheric ozone depletion”, “Ozone formation–Human health”, “Ozone formation–Terrestrial ecosystems”, “Marine eutrophication”, “Human carcinogenic toxicity”, “Land use”, “Mineral resource scarcity” and “Water consumption”, while scenario (ii) is less impactful in the categories “Global warming”, “Ionizing radiation”, “Terrestrial acidification”, “Freshwater eutrophication”, “Terrestrial ecotoxicity”, “Freshwater ecotoxicity”, “Marine ecotoxicity”, “Human noncarcinogenic toxicity” and “Fossil resource scarcity”.
In red, the highest impacts; in yellow, the intermediate ones; and in green, the lowest impacts.
As specified in the paragraph on materials and methods, calculations were also carried out on the hourly impacts linked to the individual extraction operations (Table 7). Excluding felling, which is common to all scenarios, among the various logging systems, the one that uses the forwarder always had the least impact (iii), while the two that use the skidder—i.e., scenarios (i) and (ii)—had identical ecoprofiles, since the machine with which they were carried out was the same. A few minor differences are linked exclusively to the different impacts generated by the production of the two tools (cable and grapple).
The contribution analysis, performed for all three scenarios (Figure 8, Figure 9 and Figure 10), shows that emissions related to fuel combustion represented the major hotspot in “Global warming”, “Ozone Formation–Human Health”, “Fine particulate matter formation”, “Ozone formation–terrestrial ecosystems”, “Terrestrial ecotoxicity” and “Human noncarcinogenic toxicity” categories. Diesel fuel production is the main hotspot in the “Ionizing radiation” and “Fossil resources scarcity” categories, while the construction of machinery used in mining operations is the main hotspot in the “Freshwater eutrophication”, “Freshwater ecotoxicity”, “Marine ecotoxicity”, “Human carcinogenic toxicity”, “Mineral resources scarcity” and “Water consumption” categories. Lubricating oil production is the most impactful process in terms of the “Marine eutrophication” and “Land use” categories.
In all three scenarios, the biggest contributor to GHG emissions are diesel and petrol production and combustion, further than the emissions of nitrogen oxides, carbon dioxide, methane and dinitrogen monoxide. Particularly, dinitrogen monoxide is the main responsible for stratospheric ozone depletion, and its emission is mainly due to diesel production and combustion as well as lubricating oil production. Impacts related to “Ionizing radiation” are mainly attributable to the production processes of fuels and forestry machinery. Emissions of NMVOCs, nitrogen oxides and benzene caused by gasoline and diesel combustion have a significant effect on “Ozone formation–human health” and “Ozone formation–terrestrial ecosystems” impact categories. Such an effect is also verified for the impact category “Fine particulate matter formation”, mainly caused by particulate emissions < 2.5 um, sulphur dioxide, nitrogen oxides and ammonia. The most important hotspot for this impact category is diesel combustion, which accounts for about 90% of all impacts. The last three substances released during diesel combustion represent the most impactful contributors on the “Terrestrial acidification” category, where a major hotspot is also represented by emissions generated during the production of diesel, lubricating oil and petrol.
The impacts on eutrophication in freshwater and marine waters, the former due to machinery construction and the latter to lubricating oil production, are negligible in entity (Table 6 and Table 7). The impacts on the three ecotoxicity indicators (marine, terrestrial and freshwater) and on human carcinogenic toxicity are mainly due to the heavy metal emissions generated during chainsaw, skidder and forwarder manufacturing. Heavy metals (particularly lead and zinc) fuel combustion emissions as well as soil emissions from tyre wear are the main impactful factors in the “Human noncarcinogenic toxicity” category. Resource consumption impacts are mainly generated by the production processes of the inputs used in the logging process. In terms of land use and water consumption, the impacts are mainly attributable to the production process of vegetal lubricating oil. Key hotspots include chainsaw production and the emissions generated from its use, which are a critical element in many impact categories across all the analysed logging scenarios.

4. Discussion

4.1. Productivity Assessment

Logging analysis from different points of view is an important step to evaluate the best way to lead forestry management. In this research, the first matter was represented by reached productivity level in manual tree felling with a chainsaw. If compared with data present in the literature on work productivity [8,62,63], the results confirm diameter at the breast height is one of the main parameters influencing tree felling with a chainsaw. According to these aspects, we can remark the considerations of Zimbalatti et al. [8] and Grzywiński et al. [64] about how it is possible to improve felling performance by reducing the unproductive time through selecting the right season, a more careful organisation of work and regular management of machines.
Considering cable and grape skidders productivity, the present study confirms the research carried out by Kluender et al. [65], which concluded that grapple skidding is more productive than cable skidders. According to Kulak et al. [15], the achieved results put in evidence that logging operations in thinning operations are less efficient, due to difficulty of skidder manoeuvrability in dense conditions, remarking that an essential role is played by skid road density. On these aspects, Orlovský et al. [66] highlight how the mean gross production depends on the type of forest stand and the skidding distance, recording values to 47.76 and 55.28 m3day−1 in the cases of cable and grapple skidders, respectively; in Horvat et al. [67], at a mountain working site, the daily output to 35.54 m3day−1 was achieved for a distance of 500 m; in Kulak et al. [13], where three types of treatment were conducted on Pinus sylvestris L. with an average diameter at breast height of 36 cm, productivity exceeded 112 m3day−1.
Referring to forwarder productivity, as reported by Cadei et al. [68], it is strongly influenced by load volume, extraction distance and operator experience. Based on the type of machine used, the results are very in line with other studies conducted on thinning operations and not hard terrain conditions. In Proto et al. [12], average productivity of forwarding was equal to 19.3 m3 PMH; Cadei et al. [68] show average productivity from 18.5 m3 PMH15 to 29.4 m3 PMH15 in three different sites; Eriksson et al. [69] and Hildt et al. [70] reach results in line with the mentioned studies, where the results highlight that productivity is higher for shorter forwarding distances and larger payloads.

4.2. Economic Assessment

The logging costs analysed are closely linked to the technologies used and the characteristics of the extraction site. The results of this research are in line with Badraghi et al. [39], which compared different logging systems, correlating economic results to three different factors: log diameter, winching distance and skidding distance, showing a gross cost ranging from a minimum of EUR 5.20 m−3 to a maximum of EUR 17.33 m−3. The overall efficiency of logging systems has a considerable impact in terms of unit cost. For example, Stoilov et al. [22] evaluated wood harvesting by cable crane, and despite a quite high hourly cost (EUR 120.17), the unit costs were always lower than the scenarios we analysed due to the high production efficiency of the extraction system. Jiroušek et al. [25] also correlated the cost of logging with transport distance and load volume: machine class III (large) has similar cost characteristics to the one used in our scenario (iii), although the machine power was more similar to class II (medium). The results for hourly costs as a function of machine productivity were very similar, and the differences are related to site characteristics. As specified by the authors themselves, one of the critical factors was the average volume of trees, which was less than 0.5 m3, which could cause significant differences in costs.
Similar conclusions were also obtained by Proto et al. [24], who report a forwarding cost varying between EUR 2.5 m−3 and EUR 4.5 m−3 versus EUR 2.5 m−3 obtained in the present study. The same authors correlated the cost of extraction with the distance and volume of payload, showing that this latter is negatively correlated with the average extraction distance.

4.3. Environmental Assessment

As previously mentioned, very few studies in literature can be quite compared with our research, due to different conditions in forest management, impacts categories highlighted, or functional unit considered.
Timmermann and Dibdiakova [30] analysed the impact of the forest industry in Norway and found that harvesting accounts for about 30% of the total impacts. In addition, they obtained an impact of 5.820 CO2eq kgm−3 during logging operations performed with a forwarder and then a cable crane, which is fully comparable to our findings in scenario (iii) forwarder. In addition, our results obtained in scenario (i) cable skidder are fully comparable with those of Zhou et al. [31], who compared different logging systems, including the implementation of a cable skidder.
Climate change is often the only considered impact category; from this point of view, according to Sonne [29] and Weyrens et al. [71], harvesting represents the main contributor to GHG emissions in forest management.
Several authors consider the weight of the produced biomass [32,33] or the amount of energy that can be obtained from it [34] as functional unit. Other studies use the volume of harvested biomass [35,72], with González-García [35] showing that about 40% of GHG emissions (approximately 14 CO2eq kgm−3) can be attributed to wood harvesting phase, while Valente et al. [72] consider the biomass for energy use.
From a purely environmental point of view, scenario (ii) would seem to be the most efficient, but it is not possible to generalise this statement because the choice of extraction system often depends on the characteristics of the forest site, which can make a system unusable. Moreover, the results are strictly referred to as logging systems adopted.
Nevertheless, our findings are shown to be fully consistent with those of LCA analysis conducted by Proto et al. [40]. For the impact categories selected, their results are quite similar, in particular, to scenario (i) of the present study (Table 8), obviously taking into account all the differences that characterise the two studies both from the point of view of experimental design and methodologies used.
Among the studies that have dealt specifically with LCA analysis of forest wood extraction, some authors [37,73,74] used the mass as functional unit; González-García et al. [75] instead considered the biomass produced by one hectare of forest over its lifetime. Additionally, the differences inherent to the several contexts of analysis should be considered. In this sense, González-García et al. [76] extended the assessment of forest wood harvesting and included planting and growth phases: in such a way, it is not possible to determine the contribution of logging operations on total impacts. However, they pointed out that for spruce, logging is the main impactful operation. Dias and Arroja [38] analysed different scenarios for eucalyptus and maritime pine production in Portugal. GHG emissions related to logging operations varied roughly between 7.5 and 4.8 CO2eq kgm−3. Hence, we can state that our results appear consistent with their findings. Similar outcomes are obtained for acidification, levels of which are close to 0.03 SO2eq kgm−3 for logging operations. The results are also coherent with those of Michelsen et al. [77], who report impact values during logging operations of 9.37 CO2eq kgm−3 and 0.044 SO2eq kgm−3, respectively, for “Global warming potential” and “Acidification” categories. In other studies always related to the evaluation of alternative logging systems, such as Gan et al. [40] and Proto et al. [6], the scenarios analysed are very different from those in our study, which makes it impossible to compare results.
However, by orienting the discussion to comparison within the same system boundaries, it is possible to see that the hotspots identified in these studies are the same as what emerged from our analysis, and in particular, felling and extraction operations turn out to be the main impactors due to emissions generated by fuel combustion. Through environmental sustainability analyses, it was possible to identify the system with the lowest impact, but this must always be linked to technical and economic analyses. The adoption of each of the three systems is conditioned by the structural characteristics of the extraction site (slope, forest density, accessibility, distances), so it is not possible to define a better or worse system in absolute terms. When comparing the three systems on the same site, the environmental results showed an advantage for the grapple skidder system. From an economic point of view, the forwarder scenario was the most cost-effective one, although the advantage over the grapple skidder is not very strong. The cable skidder system was the worst both economically and environmentally, mainly due to low extraction yields and higher labour input, but the conditions at the extraction site may not leave any alternative to the use of this system.

5. Conclusions

The present research would be helpful to develop a decision support system, based on machine productivity and cost evaluation, aimed at estimating the extraction rates by contractors.
Unless the soil is particularly vulnerable, requiring, therefore, the employment of cable crane systems, a wide range of different machines for timber extraction can be implemented. A fundamental feature to optimise forestry activities is the availability of a forest road network, which should be maintained in good condition to guarantee high working performance [78].
Additionally, during logging operations, machines can cause negative impacts, especially damages to residual trees. Hence, to reduce the environmental impacts, the capabilities of these machines should be well understood, and correct conservation techniques should be implemented during work phases [79].
Furthermore, the LCA is gaining significance in the wood sector, where industries aim to make a comprehensive and reliable assessment of all environmental aspects related to products, based on the interest in climate change that is expressed by regulators worldwide.

Author Contributions

Conceptualisation, B.B., G.M., G.F. and A.I.D.L.; methodology, B.B., G.M., G.F., T.S., S.B. and A.I.D.L.; formal analysis, B.B., G.M., G.F., T.S., S.B. and A.I.D.L.; investigation B.B., G.M., G.F., T.S., S.B. and A.I.D.L.; data curation, B.B., G.M., G.F., T.S., S.B. and A.I.D.L.; writing—original draft preparation, B.B., G.F., T.S., S.B. and A.I.D.L.; writing—review and editing, B.B., G.M., G.F., T.S., S.B. and A.I.D.L.; visualisation, B.B., G.F. and A.I.D.L.; supervision, B.B.; project administration, B.B. All authors have read and agreed to the published version of the manuscript.

Funding

This research received no external funding.

Data Availability Statement

Not applicable.

Conflicts of Interest

The authors declare no conflict of interest. The funders had no role in the design of the study; in the collection, analyses, or interpretation of data; in the writing of the manuscript; nor in the decision to publish the results.

References

  1. Marchi, M.; Paletto, A.; Cantiani, P.; Bianchetto, E.; De Meo, I. Comparing Thinning Systems Effects on Ecosystem 2 Services Provision in Black Pine (Pinus nigra J.F. Arnold) Artificial Forests. Forests 2018, 9, 188. [Google Scholar] [CrossRef] [Green Version]
  2. Picchio, R.; Venanzi, R.; Latterini, F.; Marchi, E.; Laschi, A.; Lo Monaco, A. Corsican Pine (Pinus laricio Poiret) Stand Management: Medium and Long Lasting Effects of Thinning on Biomass Growth. Forests 2018, 9, 257. [Google Scholar] [CrossRef] [Green Version]
  3. Ciancio, O. (Ed.) Nuove Frontiere Nella Gestione Forestale; Accademia Italiana di Scienze Forestali: Firenze, Italy, 1999; Volume XLV, p. 349. [Google Scholar]
  4. Tam, V.W.; Senaratne, S.; Le, K.N.; Shen, L.Y.; Perica, J.; Illankoon, I.C.S. Life-cycle cost analysis of green-building implementation using timber applications. J. Clean. Prod. 2017, 147, 458–469. [Google Scholar] [CrossRef]
  5. Siebert, A.; Bezama, A.; O’Keeffe, S.; Thrän, D. Social life cycle assessment indices and indicators to monitor the social implications of wood-based products. J. Clean. Prod. 2018, 172, 4074–4084. [Google Scholar] [CrossRef]
  6. Proto, A.R.; Bacenetti, J.; Macrì, G.; Zimbalatti, G. Roundwood and bioenergy production from forestry: Environmental impact assessment considering different logging systems. J. Clean. Prod. 2017, 165, 1485–1498. [Google Scholar] [CrossRef]
  7. Zimbalatti, G.; Proto, A.R. Prospects of Forest Utilizations in the South of Italy. In Proceedings of the IUFRO (Unit 3.06.00) Workshop on Forestry Utilization in Mediterranean Countries, Reggio Calabria, Italy, 17–19 June 2009. [Google Scholar]
  8. Zimbalatti, G.; Bernardi, B.; Morabito, S. Analysis of thinning operations in Corsican pine artificial high forests in Calabria (Italy). J. Agric. Eng. 2008, 39, 37–43. [Google Scholar] [CrossRef]
  9. Russo, D.; Marziliano, P.A.; Macri, G.; Proto, A.R.; Zimbalatti, G.; Lombardi, F. Does Thinning Intensity Affect Wood Quality? An Analysis of Calabrian Pine in Southern Italy Using a Non-Destructive Acoustic Method. Forests 2019, 10, 303. [Google Scholar] [CrossRef] [Green Version]
  10. Heinrich, R. Sustainable Forest Harvesting 1. Environmentally Sound Forest Harvesting Operations; Food and Agriculture Organization of the United Nations (FAO): Rome, Italy, 1999. [Google Scholar]
  11. Proto, A.R.; Sperandio, G.; Costa, C.; Maesano, M.; Antonucci, G.; Macrì, G.; Scarascia Mugnozza, G.; Zimbalatti, G. A Three-Step Neural Network Artificial Intelligence Modeling Approach for Time, Productivity and Costs Prediction: A Case Study in Italian Forestry. Croat. J. For. Eng. 2017, 41, 35–47. [Google Scholar] [CrossRef]
  12. Proto, A.R.; Macrì, G.; Visser, R.; Russo, D.; Zimbalatti, G. Comparison of Timber Extraction Productivity between Winch and Grapple Skidding: A Case Study in Southern Italian Forests. Forests 2018, 9, 61. [Google Scholar] [CrossRef] [Green Version]
  13. Mologni, O.; Grigolato, S.; Cavalli, R. Harvesting systems for steep terrain in the Italian Alps: State of the art and future prospects. Contemp. Eng. Sci. 2016, 25, 1229–1242. [Google Scholar] [CrossRef]
  14. Mousavi, R.; Nikooy, M.; Esmailnezhad, A.; Ershadifar, M. Evaluation of full tree skidding by HSM-904 skidder in patch cutting of aspen plantation in Northern Iran. J. For. Sci. 2012, 58, 79–87. [Google Scholar] [CrossRef] [Green Version]
  15. Kulak, D.; Stanczykiewicz, A.; Szewczyk, G. Productivity and time consumption of timber extraction with a grapple skidder in selected pine stands. Croat. J. For. Eng. 2017, 38, 33–55. [Google Scholar]
  16. Gagliardi, K.; Ackerman, S.; Ackerman, P. Multi-product forwarder-based timber extraction: Time consumption and productivity analysis of two forwarder models over multiple products and extraction distances. Croat. J. For. Eng. 2020, 41, 231–242. [Google Scholar] [CrossRef] [Green Version]
  17. Berendt, F.; Tolosana, E.; Hoffmann, S.; Alonso, P.; Schweier, J. Harvester productivity in inclined terrain with extended machine operating trail intervals: A german case study comparison of standing and bunched trees. Sustainability 2020, 12, 9168. [Google Scholar] [CrossRef]
  18. Rodolfo, P.; Mauro, M.; Serena, S.; Enrico, M. Productivity and energy balance in conversion of a Quercus cerris L. coppice stand into high forest in Central Italy. Croat. J. For. Eng. 2009, 30, 15–26. [Google Scholar]
  19. Ghaffariyan, M.R.; Naghdi, R.; Ghajar, I.; Nikooy, M. Time prediction models and cost evaluation of cut-to-length (CTL) harvesting method in a mountainous forest. Small-Scale For. 2012, 12, 181–192. [Google Scholar] [CrossRef]
  20. Akay, A.E.; Sessions, J. Identifying the Factors Influencing the Cost of Mechanized Harvesting Equipment. J. Sci. Eng. 2004, 7, 65. [Google Scholar]
  21. Mederski, P.S. A comparison of harvesting productivity and costs in thinning operations with and without midfield. For. Ecol. Manag. 2006, 224, 286–296. [Google Scholar] [CrossRef]
  22. Stoilov, S.; Proto, A.R.; Angelov, G.; Papandrea, S.F.; Borz, S.A. Evaluation of Salvage Logging Productivity and Costs in the Sensitive Forests of Bulgaria. Forests 2021, 12, 309. [Google Scholar] [CrossRef]
  23. Badraghi, A.; Erler, J.; Hosseini, S.A.O.; Lang, R. Cost evaluation of three ground-logging methods in a mixed broadleaved mountainous forest. For. Syst. 2018, 27, e013. [Google Scholar] [CrossRef]
  24. Proto, A.R.; Macrì, G.; Visser, R.; Harrill, H.; Russo, D.; Zimbalatti, G. Factors affecting forwarder productivity. Eur. J. For. Res. 2018, 137, 143–151. [Google Scholar] [CrossRef]
  25. Jiroušek, R.; Klvač, R.; Skoupý, A. Productivity and costs of the mechanised cut-to-length wood harvesting system in clear-felling operations. J. For. Sci. 2007, 53, 476–482. [Google Scholar] [CrossRef] [Green Version]
  26. ISO 14040:2021; Environmental Management-Life Cycle Assessment—Principles and Framework. International Organization for Standardization: Geneva, Switzerland, 2021.
  27. ISO 14044:2021; Environmental Management-Life Cycle Assessment—Requirements and Guidelines. International Organization for Standardization: Geneva, Switzerland, 2021.
  28. Đuka, A.; Vusić, D.; Horvat, D.; Šušnjar, M.; Pandur, Z.; Papa, I. LCA Studies in Forestry–Stagnation or Progress? Croat. J. For. Eng. 2017, 38, 311–326. [Google Scholar]
  29. Sonne, E. Greenhouse Gas Emissions from Forestry Operations: A Life Cycle Assessment. J. Environ. Qual. 2006, 35, 1439–1450. [Google Scholar] [CrossRef] [PubMed]
  30. Timmermann, V.; Dibdiakova, J. Greenhouse gas emissions from forestry in East Norway. Int. J. Life Cycle Assess. 2014, 19, 1593–1606. [Google Scholar] [CrossRef]
  31. Zhou, Y.; Zheng, L.; Zhou, X.; Hu, X.; Wu, Z.; Zhou, C.; Li, D. Greenhouse Gas (GHG) Emissions and the Optimum Operation Model of Timber Production Systems in Southern China. Fresenius Environ. Bull. 2015, 24, 3743–3753. [Google Scholar]
  32. de la Fuente, T.; González-García, S.; Athanassiadis, D.; Nordfjell, T. Fuel consumption and GHG emissions of forest biomass supply chains in Northern Sweden: A comparison analysis between integrated and conventional supply chains. Scand. J. For. Res. 2016, 32, 568–581. [Google Scholar] [CrossRef]
  33. Quinn, R.J.; Ha, H.; Volk, T.A.; Brown, T.R.; Bick, S.; Malmsheimer, R.W.; Fortier, M.-O.P. Life cycle assessment of forest biomass energy feedstock in the Northeast United States. GCB Bioenergy 2020, 12, 728–741. [Google Scholar] [CrossRef]
  34. Sgarbossa, A.; Boschiero, M.; Pierobon, F.; Cavalli, R.; Zanetti, M. Comparative Life Cycle Assessment of Bioenergy Production from Different Wood Pellet Supply Chains. Forests 2020, 11, 1127. [Google Scholar] [CrossRef]
  35. González-García, S.; Berg, S.; Feijoo, G.; Moreira, M.T. Environmental impacts of forest production and supply of pulpwood: Spanish and Swedish case studies. Int. J. Life Cycle Assess. 2009, 14, 340–353. [Google Scholar] [CrossRef]
  36. Berg, S.; Lindholm, E.-L. Energy use and environmental impacts of forest operations in Sweden. J. Clean. Prod. 2005, 13, 33–42. [Google Scholar] [CrossRef]
  37. Abbas, D.; Handler, R.M. Life-cycle assessment of forest harvesting and transportation operations in Tennessee. J. Clean. Prod. 2018, 176, 512–520. [Google Scholar] [CrossRef]
  38. Dias, A.C.; Arroja, L. Environmental impacts of eucalypt and maritime pine wood production in Portugal. J. Clean. Prod. 2012, 37, 368–376. [Google Scholar] [CrossRef]
  39. Badraghi, A.; Erler, J.; Hosseini, S.A.O.; Lang, R. Evaluation of animal logging in the mixed broadleaved mountain forest: Economic and environmental impacts. J. For. Sci. 2018, 64, e013. [Google Scholar]
  40. Proto, A.R.; Bacenetti, J.; Macri, G.; Fiala, M.; Zimbalatti, G. Mechanisation of Different Logging Operations: Environmental Impact Assessment using Life Cycle Assessment (LCA) Approach. Chem. Eng. Trans. 2017, 58, 229–234. [Google Scholar]
  41. Gan, K.S.; Zairul, A.R.; Geetha, R.; Khairu, M. Life Cycle Assessment on log harvesting from natural forest in Peninsular Malaysia. J. Trop. For. Sci. 2021, 33, 213–223. [Google Scholar]
  42. Miyata, E.S. Determining Fixed and Operating Costs of Logging Equipment. Forest Service General Technical Report; North Central Experiment Station USDA: St. Paul, MN, USA, 1980. [Google Scholar]
  43. Grigolato, S.; Marchi, E.; Laschi, A.; Cavalli, R. Riflessioni sulla viabilità forestale e opere connesse a supporto delle iniziative per la predisposizione dei decreti attuativi del Testo Unico in materia di Foreste e Filiere Forestali. Forest 2019, 16, 49–55. [Google Scholar] [CrossRef]
  44. Hippoliti, G.; Piegai, F. Tecniche e Sistemi di Lavoro per la Raccolta del Legno; Compagnia delle Foreste: Arezzo, Italy, 2000; p. 157. [Google Scholar]
  45. La Marca, O. Elementi di Dendrometria, 1st ed.; Patron Editore: Bologna, Italy, 1999; p. 512. [Google Scholar]
  46. Castellani, C.; Scrinzi, G.; Tabacchi, G.; Tosi, V. Inventario Forestale Nazionale Italiano. Tavole di Cubatura Doppia Entrata; Ministero dell’Agricoltura e delle Foreste, Istituto Sperimentale per l’Assestamento Forestale e per l’Alpicoltura: Trento, Italy, 1994. [Google Scholar]
  47. Tiernan, D.; Zeleke, G.; Owende, P.M.O.; Kanali, C.L.; Lyons, J.; Ward, S.M. Effect of Working Conditions on Forwarder Productivity in Cut-to-length Timber Harvesting on Sensitive Forest Sites in Ireland. Biosyst. Eng. 2004, 87, 167–177. [Google Scholar] [CrossRef]
  48. Spinelli, R.; Magagnotti, N.; Visser, R.; O’Neal, B. A survey of the skidder fleet of Central, Eastern and Southern Europe. Eur. J. For. Res. 2021, 140, 901–911. [Google Scholar] [CrossRef]
  49. Brunberg, T. Underlag Till Produktionsnormer För Skotare (Productivity-Norm Data for Forwarders); Skogforsk: Uppsala, Sweden, 2004. [Google Scholar]
  50. Björheden, R.; Apel, K.; Shiba, M.; Thompson, M.A. IUFRO Forest Work Study Nomenclature; Department of Operational Efficiency, Swedish University of Agricultural Science: Garpenberg, Sweden, 1995. [Google Scholar]
  51. Acuna, M.; Bigot, M.; Guerra, S.; Hartsough, B.; Kanzian, C.; Kärhä, K.; Lindroos, O.; Magagnotti, N.; Roux, S.; Spinelli, R.; et al. Good Practice Guidelines for Biomass Production Studies; CNR IVALSA: Sesto Fiorentino, Italy, 2012. [Google Scholar]
  52. Björheden, R. Basic Time Concepts for International Comparisons of Time Study Reports. J. For. Eng. 1991, 2, 33–39. [Google Scholar] [CrossRef]
  53. Spinelli, R.; Visser, R.J.M. Analyzing and estimating delays in harvester operations. Int. J. For. Eng. 2008, 19, 36–41. [Google Scholar] [CrossRef]
  54. Stillitano, T.; De Luca, A.I.; Falcone, G.; Spada, E.; Gulisano, G.; Strano, A. Economic profitability assessment of Mediterranean olive growing systems. Bulg. J. Agric. Sci. 2016, 22, 517–526. [Google Scholar]
  55. Nemecek, T.; Hayer, F.; Bonnin, E.; Carrouée, B.; Schneider, A.; Vivier, C. Designing eco-efficient crop rotations using life cycle assessment of crop combinations. Eur. J. Agron. 2015, 65, 40–51. [Google Scholar] [CrossRef]
  56. Bernardi, B.; Falcone, G.; Stillitano, T.; Benalia, S.; Strano, A.; Bacenetti, J.; De Luca, A.I. Harvesting system sustainability in Mediterranean olive cultivation. Sci. Total Environ. 2018, 625, 1446–1458. [Google Scholar] [CrossRef] [PubMed]
  57. Bernardi, B.; Falcone, G.; Stillitano, T.; Benalia, S.; Bacenetti, J.; De Luca, A.I. Harvesting system sustainability in mediterranean olive cultivation: Other principal cultivar. Sci. Total Environ. 2021, 766, 142508. [Google Scholar] [CrossRef] [PubMed]
  58. Weidema, B.P.; Bauer, C.; Hischier, R.; Mutel, C.; Nemecek, T.; Reinhard, J.; Vadenbo, C.O.; Wernet, G. Overview and Methodology. Data Quality Guideline for the Ecoinvent Database Version 3. Ecoinvent Report 1(v3); The ecoinvent Centre: St. Gallen, Switzerland, 2013. [Google Scholar]
  59. Nemecek, T.; Kägi, T. Life Cycle Inventories of Swiss and European Agricultural Production Systems. Final Report Ecoinvent V2.0 No. 15a; Agroscope Reckenholz-Taenikon Research Station ART, Swiss Centre of Life Cycle Inventories: Zurich, Switzerland, 2007. [Google Scholar]
  60. Goedkoop, M.; Oele, M.; Leijting, J.; Ponsioen, T.; Meijer, E. Introduction to LCA with SimaPro; PRè-Product Ecology Consultants: Amersfoort, The Netherlands, 2013. [Google Scholar]
  61. Goedkoop, M.; Heijungs, R.; Huijbregts, M.A.J.; De Schryver, A.; Struijs, J.; Van Zelm, R. ReCiPe 2008, A Life Cycle Impact Assessment Method which Comprises Harmonised Category Indicators at the Midpoint and the Endpoint Level. First Edition (Version 1.08)-Report I: Characterisation; RIVM Report: Bilthoven, The Nederlands, 2013. [Google Scholar]
  62. Câmpu, V.R.; Ciubotaru, A. Time consumption and productivity in manual tree felling with a chainsaw–a case study of resinous stands from mountainous areas. Silva Fenn. 2017, 51, 1657. [Google Scholar] [CrossRef] [Green Version]
  63. Ciubotaru, A.; Câmpu, R.V. Delimbing and Cross-cutting of Coniferous Trees–Time Consumption, Work Productivity and Performance. Forests 2018, 9, 206. [Google Scholar] [CrossRef] [Green Version]
  64. Grzywiński, W.; Turowski, R.; Naskrent, B.; Jelonek, T.; Tomczak, A. The effect of season of the year on the frequency and degree of damage during commercial thinning in black alder stands in Poland. Forests 2019, 10, 668. [Google Scholar] [CrossRef] [Green Version]
  65. Kluender, R.; Loretz, D.; Mscoy, W.; Stokes, B.J.; Klepac, J. Productivity of rubber-tired skidders in southern pine forests. For. Prod. J. 1997, 47, 53–58. [Google Scholar]
  66. Orlovský, L.; Messingerová, V.; Danihelová, Z. Analysis of the time efficiency of skidding technology based on the skidders. Cent. Eur. For. J. 2020, 66, 177–187. [Google Scholar] [CrossRef]
  67. Horvat, D.; Zečić, Ž.; Šušnjar, M. Morphological characteristics and productivity of skidder ECOTRAC 120V. Croat. J. For. Eng. 2017, 28, 11–25. [Google Scholar]
  68. Cadei, A.; Mologni, O.; Röser, D.; Cavalli, R.; Grigolato, S. Forwarder Productivity in Salvage Logging Operations in Difficult Terrain. Forests 2020, 11, 341. [Google Scholar] [CrossRef] [Green Version]
  69. Eriksson, M.; Lindroos, O. Productivity of harvesters and forwarders in CTL operations in northern Sweden based on large follow-up datasets. Int. J. For. Eng. 2014, 25, 179–200. [Google Scholar] [CrossRef]
  70. Hildt, E.; Leszczuk, A.; Donagh, P.M.; Schlichter, T. Time consumption analysis of forwarder activities in thinning. Croat. J. For. Eng. 2020, 41, 13–24. [Google Scholar] [CrossRef]
  71. Weyrens, J.P.; Therasme, O.; Germain, R.H. Quantifying the Life Cycle Greenhouse Gas Emissions of a Mechanized Shelterwood Harvest Producing Both Sawtimber and Woodchips. Forests 2022, 13, 70. [Google Scholar] [CrossRef]
  72. Valente, C.; Spinelli, R.; Hillring, B.G. LCA of environmental and socio-economic impacts related to wood energy production in alpine conditions: Valle di Fiemme (Italy). J. Clean. Prod. 2011, 19, 1931–1938. [Google Scholar] [CrossRef]
  73. Cerutti, A.K.; Calvo, A.; Bruun, S. Comparison of the environmental performance of light mechanization and animal traction using a modular LCA approach. J. Clean. Prod. 2014, 64, 396–403. [Google Scholar] [CrossRef] [Green Version]
  74. Laschi, A.; Marchi, E.; González-García, S. Forest operations in coppice: Environmental assessment of two different logging methods. Sci. Total Environ. 2016, 562, 493–503. [Google Scholar] [CrossRef]
  75. González-García, S.; Bonnesoeur, V.; Pizzi, A.; Feijoo, G.; Moreira, M.T. The influence of forest management systems on the environmental impacts for Douglas-fir production in France. Sci. Total Environ. 2013, 461–462, 681–692. [Google Scholar] [CrossRef]
  76. González-García, S.; Moreira, M.T.; Dias, A.C.; Mola-Yudego, B. Cradle-to-gate Life Cycle Assessment of forest operations in Europe: Environmental and energy profiles. J. Clean. Prod. 2014, 66, 188–198. [Google Scholar] [CrossRef]
  77. Michelsen, O.; Solli, C.; Hammer Strømman, A. Environmental Impact and Added Value in Forestry Operations in Norway. J. Ind. Ecol. 2008, 12, 69–81. [Google Scholar] [CrossRef]
  78. Krumov, T. Determination of the optimal density of the forest road. J. For. Sci. 2019, 65, 438–444. [Google Scholar] [CrossRef]
  79. Akay, E.A.; Yilmaz, M.; Tonguc, F. Impact of Mechanized Harvesting Machines on Forest Ecosystem: Residuai Stand Damage. J. Appl. Sci. 2006, 6, 2414–2419. [Google Scholar]
Figure 1. (a) Skidder and (b) Forwarder used during trials.
Forests 13 00403 g001
Figure 2. System boundary flow chart.
Forests 13 00403 g002
Figure 3. Comparison of average work times referred to the working teams.
Forests 13 00403 g003
Figure 4. Time consumption of work element for scenarios (i) and (ii). The boxes include the variability of the data between the 25th and the 75th percentiles. The horizontal black line represents the median. Whiskers are the largest and smallest values that are not outliers.
Forests 13 00403 g004
Figure 5. Time consumption of work element for scenario (iii). The boxes include the variability of the data between the 25th and the 75th percentiles. The horizontal black line represents the median. Whiskers are the largest and smallest values that are not outliers.
Forests 13 00403 g005
Figure 6. Hourly costs (EUR h−1) of the different logging scenarios.
Forests 13 00403 g006
Figure 7. Unit costs (EUR m−3) of different logging scenarios.
Forests 13 00403 g007
Figure 8. Contribution analysis related to scenario (i), cable skidder.
Forests 13 00403 g008
Figure 9. Contribution analysis related to scenario (ii), grapple skidder.
Forests 13 00403 g009
Figure 10. Contribution analysis related to scenario (iii), forwarder.
Forests 13 00403 g010
Table 1. Main characteristics of trees (means ± SD).
Density
(Trees ha−1)
DBH 1
(cm)
Height
(m)
Basal Area
(m2 h−1)
Stand Volume
(m3 h−1)
800 ± 150.221.3 ± 5.323 ± 3.275 ± 15.4720 ± 69.9
1 Diameter at the breast height.
Table 2. Calculation of the machine hourly cost (Miyata 1980, modified).
Cost ItemSymbolUnitSource
Machinery value MVEURPrice list
Equipment valueEVEURPrice list
Total valueTVEURMV + EV
Salvage valueSVEUR% of TV
PowerPkWTechnical manual
Interest rateR%Market survey
Economic lifeELyearsTechnical manual
Average annual machine useAMUh year−1Field survey
Average daily machine useDMUh day−1Field survey
Fuel priceFPEUR L−1Price list
Oil priceOPEUR L−1Price list
Fuel consumptionFCL h−1Field survey
Oil consumptionOCL h−1Field survey
Area occupied by the machineAm2Technical manual
Price per m2PAEUR m2Local market
Average hourly wageHWEUR h−1Current local salary
Operator-machineOMN.Field survey
Hourly variable costs
 Fuel consumption costFCCEUR h−1FC*FP
 Oil consumption costOCCEUR h−1OC*OP
 Operator–machine labour costOMCEUR h−1HW*OM
 Total hourly variable costsHVCEUR h−1FCC + OCC + OMC
Annual fixed costs
 Interest on capital goodsIEUR year−1((MV + SV)/2) × r
 DepreciationDREUR year−1(TV-SV)/EL
 InsuranceIREUR year−1Field survey
 MaintenanceMREUR year−1Field survey
 Space costSCEUR year−1A * PA * (0.03)
 Total annual fixed costsAFCEUR year−1I + DR + IR + MR + SC
Hourly fixed costsHFCEUR h−1AFC/AMU
Total hourly costTHCEUR h−1HFC + HVC
Table 3. Costs per logging scenario analysed.
OperationFellingMechanical Extraction
MachineryChainsawCable Skidder Grapple SkidderForwarder
Purchase price (EUR)950350,000.00350,000.00260,000.00
Power (kW)3.511011086
Economic life (hours)164517,85017,85017,850
Average annual use (h year−1)5401,1901,1901190
Fuel consumption (L h−1)1.7415.7215.7212.37
Oil consumption (kg h−1)0.3750.200.200.20
Table 4. Inventory per “1 m3 of wood harvested”.
UnitChainsawing
Materials/fuelsTwo-stroke blendkg3.28 × 10−1
Power sawkg4.73 × 10−3
Lubricant Oilkg7.08 × 10−2
Chain Steelkg2.30 × 10−3
Emissions to airCarbon dioxide, fossilkg5.13 × 10−1
Carbon monoxide, fossilkg1.86 × 10−1
Leadkg1.65 × 10−5
Methane, fossilkg3.02 × 10−4
Nitrogen oxideskg2.13 × 10−3
NMVOC, nonmethane volatile organic compoundskg3.75 × 10−2
Sulphur dioxidekg1.52 × 10−4
Emissions to soilOilskg7.08 × 10−3
(i) Cable skidder(ii) Grapple skidder(iii) Forwarder
Materials/fuelsMachinekg1.34 × 10−15.01 × 10−23.76 × 10−2
Toolkg5.18 × 10−31.94 × 10−31.42 × 10−3
Dieselkg3.081.166.65 × 10−1
Shedm22.12 × 10−47.96 × 10−58.06 × 10−5
Emissions to airNMVOC, nonmethane volatile organic compoundskg2.35 × 10−38.82 × 10−46.45 × 10−4
Nitrogen oxideskg2.78 × 10−21.04 × 10−27.63 × 10−3
Carbon monoxidekg3.53 × 10−31.32 × 10−39.68 × 10−4
Carbon dioxidekg9.623.612.07
Sulphur dioxidekg3.11 × 10−31.17 × 10−36.69 × 10−4
Methanekg3.98 × 10−41.49 × 10−48.55 × 10−5
Benzenekg2.25 × 10−58.44 × 10−64.84 × 10−6
Particulates, <2.5 umkg2.69 × 10−21.01 × 10−26.31 × 10−3
Cadmiumkg3.00 × 10−81.00 × 10−81.00 × 10−8
Chromiumkg3.70 × 10−41.39 × 10−43.00 × 10−8
Copperkg5.24 × 10−61.97 × 10−61.13 × 10−6
Dinitrogen monoxidekg2.60 × 10−49.75 × 10−57.95 × 10−5
Nickelkg2.20 × 10−78.00 × 10−85.00 × 10−8
Zinckg3.08 × 10−61.16 × 10−66.60 × 10−7
Benzo(a)pyrenekg9.00 × 10−83.00 × 10−82.00 × 10−8
Ammoniakg6.17 × 10−52.31 × 10−51.33 × 10−5
Benzo(a)anthracenekg2.50 × 10−79.00 × 10−85.00 × 10−8
Benzo(b)fluoranthenekg1.50 × 10−76.00 × 10−83.00 × 10−8
Chrysenekg6.20 × 10−72.30 × 10−71.30 × 10−7
Dibenz(a,h)anthracenekg3.00 × 10−81.00 × 10−81.00 × 10−8
Fluoranthenekg1.39 × 10−65.20 × 10−73.00 × 10−7
Phenanthrenekg7.71 × 10−62.89 × 10−61.66 × 10−6
PAH, polycyclic aromatic hydrocarbonskg7.19 × 10−52.70 × 10−51.55 × 10−5
Seleniumkg3.00 × 10−81.00 × 10−81.00 × 10−8
Emissions to soilCadmiumkg1.62 × 10−56.07 × 10−64.56 × 10−6
Zinckg7.01 × 10−52.63 × 10−51.98 × 10−5
Leadkg4.31 × 10−41.62 × 10−41.22 × 10−4
Table 5. Share of fixed and variable costs related to unit costs (EUR m−3) of different logging scenarios.
Logging SystemHarvesting Cost per m3 of WoodFixed Costs per m3 of WoodVariable Costs per m3 of WoodFixed CostsVariable Costs
(EUR m−3)(EUR m−3)(EUR m−3)%%
(i) Cable skidder 17.364.6112.7526.5573.45
(ii) Grapple skidder8.671.806.8720.8079.20
(iii) Forwarder7.071.066.0115.0584.95
Table 6. Characterisation of the impacts of different logging scenarios per “1 m3 of wood harvested”.
Impact CategoryUnit(i) Cable Skidder (ii) Grapple Skidder(iii) Forwarder
Global warmingkg CO2 eq1.34 × 10+15.436.42
Stratospheric ozone depletionkg CFC11 eq8.82 × 10−64.31 × 10−61.09 × 10−5
Ionizing radiationkBq Co-60 eq1.91 × 10−18.13 × 10−21.29 × 10−1
Ozone formation, Human healthkg NOx eq4.93 × 10−22.28 × 10−24.96 × 10−2
Fine particulate matter formationkg PM2.5 eq3.91 × 10−21.54 × 10−21.54 × 10−2
Ozone formation, Terrestrial ecosystemskg NOx eq5.51 × 10−22.66 × 10−26.56 × 10−2
Terrestrial acidificationkg SO2 eq3.61 × 10−21.58 × 10−22.80 × 10−2
Freshwater eutrophicationkg P eq7.98 × 10−43.42 × 10−45.84 × 10−4
Marine eutrophicationkg N eq1.02 × 10−37.30 × 10−43.24 × 10−3
Terrestrial ecotoxicitykg 1,4-DCB3.70 × 10+11.61 × 10+12.40 × 10+1
Freshwater ecotoxicitykg 1,4-DCB2.46 × 10−11.03 × 10−11.62 × 10−1
Marine ecotoxicitykg 1,4-DCB3.31 × 10−11.39 × 10−12.18 × 10−1
Human carcinogenic toxicitykg 1,4-DCB6.45 × 10−13.35 × 10−19.67 × 10−1
Human noncarcinogenic toxicitykg 1,4-DCB1.72 × 10+17.049.83
Land usem2a crop eq5.93 × 10−13.94 × 10−11.64
Mineral resource scarcitykg Cu eq3.84 × 10−21.97 × 10−25.62 × 10−2
Fossil resource scarcitykg oil eq4.401.832.52
Water consumptionm31.65 × 10−28.83 × 10−32.70 × 10−2
Table 7. Characterisation of the impacts of different logging operations per “1 h of execution”.
Impact CategoryUnitChainsawing(i) Cable Skidder (ii) Grapple Skidder(iii) Forwarder
Global warmingkg CO2 eq5.196.29 × 10+16.29 × 10+15.09 × 10+1
Stratospheric ozone depletionkg CFC11 eq1.31 × 10−53.07 × 10−53.07 × 10−52.95 × 10⁻⁵
Ionizing radiationkBq Co-60 eq1.26 × 10−18.38 × 10−18.38 × 10−17.30 × 10⁻¹
Ozone formation, Human healthkg NOx eq5.58 × 10−21.91 × 10−11.91 × 10−11.85 × 10⁻¹
Fine particulate matter formationkg PM2.5 eq9.15 × 10−31.89 × 10−11.89 × 10−11.65 × 10⁻¹
Ozone formation, Terrestrial ecosystemskg NOx eq7.80 × 10−21.96 × 10−11.96 × 10−11.90 × 10⁻¹
Terrestrial acidificationkg SO2 eq2.91 × 10−21.53 × 10−11.53 × 10−11.36 × 10⁻¹
Freshwater eutrophicationkg P eq5.62 × 10−43.46 × 10−33.46 × 10−33.43 × 10⁻³
Marine eutrophicationkg N eq4.54 × 10−33.00 × 10−43.00 × 10−43.00 × 10⁻⁴
Terrestrial ecotoxicitykg 1,4-DCB2.87 × 10+11.58 × 10+21.58 × 10+26.67 × 10+1
Freshwater ecotoxicitykg 1,4-DCB1.43 × 10−11.101.101.12
Marine ecotoxicitykg 1,4-DCB1.96 × 10−11.471.471.47
Human carcinogenic toxicitykg 1,4-DCB1.211.971.971.94
Human noncarcinogenic toxicitykg 1,4-DCB7.717.95 × 10+17.95 × 10+18.11 × 10+1
Land usem2a crop eq2.255.77 × 10−15.77 × 10−16.88 × 10−1
Mineral resource scarcitykg Cu eq7.00 × 10−21.20 × 10−11.20 × 10−11.21 × 10⁻¹
Fossil resource scarcitykg oil eq2.331.99 × 10+11.99 × 10+11.61 × 10+1
Water consumptionm33.45 × 10−24.69 × 10−24.69 × 10−24.71 × 10⁻²
Table 8. Comparison of results for scenario (i) with results for the HS–SK system in Proto et al. [40].
Impact CategoriesUnitOur ResultsProto et al. [40]
Global warmingkg CO2 eq13.438.04
Stratospheric ozone depletionmg CFC11 eq8.821.27
Terrestrial acidificationkg SO2 eq0.040.025
Freshwater eutrophicationg P eq0.800.496
Marine eutrophicationkg N eq0.00100.0047
Fossil resource scarcitykg oil eq4.402.440
Publisher’s Note: MDPI stays neutral with regard to jurisdictional claims in published maps and institutional affiliations.

