Abstract
As a direct indicator of vegetation photosynthesis, the fraction of absorbed photosynthetically active radiation (FPAR) serves as a critical input in a series of land surface models. While existing satellite FPAR products are generally at coarse resolutions ranging from 250 m to 1 km, operational FPAR products at fine resolution are urgently needed in studying land surface processes at the plot scale. However, existing methods for estimating fine-resolution FPAR were mainly designed for Landsat data, and few studies have attempted to develop algorithms for Sentinel-2 data. In particular, the operational estimation of decameter FPAR has a higher requirement for the algorithms in terms of generalizability, efficiency, accuracy, and adaptability to Sentinel-2 data. In this paper, we developed a retrieval chain on the Google Earth Engine (GEE) platform to estimate FPAR by learning the relationship between MODIS FPAR and Sentinel-2 surface reflectance. Scale-consistent multilinear models were used to model the relationship between MODIS FPAR and Sentinel-2 surface reflectance, and the model coefficients were regressed from the selected training samples. To account for the spectral and spatial characteristics of the Sentinel-2 data, we designed criteria for selecting training samples and compared different band combinations. Three strategies for band combination were used: (1) green, red, and near infrared (NIR) bands at 10 m resolution (i.e., three bands); (2) green, red, NIR, and red edge (RE) 1, RE2, and RE3 bands at 20 m resolution (i.e., five bands); and (3) green, red, NIR, RE1, RE2, RE3, shortwave infrared1 (SWIR1) and SWIR2 bands at 20 m resolution (i.e., eight bands). Meanwhile, the official Sentinel Application Platform (SNAP) method has also been implemented to estimate the Sentinel FPAR at 10 m and 20 m resolutions for comparison. Both methods were applied to the western Guanzhong area, Shaanxi Province, China, for FPAR estimation of all cloud-free Sentinel-2 images in 2021. The results show that the scaling-based method using five bands at 20 m resolution was the most accurate compared to the in situ measurements (RMSE = 0.076 and R² = 0.626), which outperformed the SNAP method at 10 m and 20 m resolutions and the scaling-based method using other strategies. The results of the scaling-based method using all three strategies were highly consistent with the MODIS FPAR product, while the SNAP method systematically underestimated FPAR values compared to the MODIS FPAR products. The proposed method is more ready-to-use and more efficient than SNAP software. Considering that the service of the MODIS sensor is overdue, the proposed method can be extended to alternatives to MODIS products, such as VIIRS and Sentinel-3 data.
1. Introduction
The fraction of absorbed photosynthetically active radiation (FPAR) is defined as the fraction of photosynthetically active radiation (PAR) absorbed by vegetation, where PAR refers to the incoming solar radiation within the spectral range of 0.4–0.7 μm [1]. It is a direct indicator of vegetation photosynthesis and is used in a series of land surface models [2]. Satellite remote sensing is the only effective method to obtain spatially continuous FPAR information on a large scale [3]. With the development of sensors and FPAR retrieval algorithms, a series of FPAR satellite products is operationally available on a global scale, such as the moderate resolution imaging spectroradiometer (MODIS) and global land surface satellite (GLASS) [4,5,6]. However, the existing products are generally at a coarse resolution ranging from 250 m to 1 km and can hardly satisfy the increasing and urgent needs for FPAR products at a fine resolution, such as the decameter-scale FPAR in studying land surface processes at fine scales such as the plot scale or subfield scale [2,7,8]. When applied to a fine spatial resolution, existing methods for retrieving FPAR still confront a series of major problems, such as the availability of input parameters, computational efficiency, adaptability to large scales, and accuracy.
Traditional FPAR estimation methods mainly include two main groups: physical and empirical methods. Physical methods model FPAR by describing the interaction of incident photons with the canopy and soil through the radiative transfer model [4], gap probability [9], and recollisional probability [10,11,12]. Physical methods have been successfully applied to the generation of coarse-resolution FPAR satellite products, such as the MODIS FPAR products derived from a 3D radiative transfer model using the look-up table retrieval algorithm [4]. However, at a fine resolution, physical methods for FPAR estimation require multiple parameters as input, such as the clumping index and soil albedo, and these parameters are difficult to obtain and introduce additional uncertainty in FPAR estimation. Empirical methods directly establish linear or nonlinear relationships between remotely sensed reflectance and FPAR from ground measurement data [13] or physical model simulations [14,15,16]. They are simple and efficient but can hardly adapt to various land cover types or a large spatial scale.
In view of the problems of the existing methods, another approach is to estimate fine-resolution FPAR using coarse-resolution operational FPAR products as a reference. Previous studies have proposed several methods to establish FPAR retrieval models, such as the regression tree method [17], the random forest method [18], and the scaling-based method [19]. Since the MODIS FPAR products have been generated on a solid physical basis and validated globally, these methods generally used MODIS FPAR products as references to achieve the operational estimation of fine-resolution FPAR, such as the estimation of cropland FPAR in the North China Plain [18]. However, considering the overdue service and the associated signal decay of the MODIS sensor [20], such an algorithm needs to take into account their applicability to the alternatives of MODIS FPAR products, such as the Sentinel-3 FPAR products, whose performance is close to that of the MODIS FPAR products [21,22].
Sentinel-2 satellite data have a high spatial resolution at the decameter level and high temporal resolution at the 3–5-day interval [23], making them promising for monitoring vegetation dynamics at the plot scale. However, the existing fine-resolution FPAR estimation methods mainly focus on Landsat data, and few studies have attempted to develop algorithms for Sentinel-2 data. When developing the FPAR estimation method for Sentinel-2 data, a series of factors need to be considered, including the high spatial and high temporal resolution of Sentinel-2 data, the larger difference in spatial resolution with MODIS data, and the selection of optimal bands among the more available bands. In particular, the high spatiotemporal dynamics of Sentinel-2 place higher demands on the generalizability and speed of the algorithm. Weiss et al. [24] established a neural network to retrieve Sentinel-2 LAI/FPAR based on the PROSAIL radiative transfer model and integrated it into the Sentinel Application Platform (SNAP) toolbox as the official algorithm for Sentinel-2 secondary leaf area index (LAI)/FPAR products. The generality and accuracy of the algorithm also need to be further verified. Sun et al. [18] used a random forest algorithm for Sentinel-2 FPAR estimation, but the random forest training process is complex and not ready-to-use. In addition, the algorithm is only for cropland, which can hardly meet the requirements of universality and rapidity. Therefore, a generalized and rapid method for estimating Sentinel-2 FPAR is urgently needed for describing the land surface process at plot scales.
To address the above issues, this study developed a retrieval chain on the Google Earth Engine (GEE) platform for Sentinel-2 FPAR estimation using MODIS FPAR as a reference [19,25,26]. The issues of sample selection, and the selection of suitable bands and optimal spatial resolution were investigated based on the characteristics of Sentinel-2 data. The method can be readily extended to alternatives to the MODIS FPAR product. Meanwhile, the proposed method was compared with the official Sentinel-2 LAI/FPAR algorithm. Both methods were applied to the FPAR estimation of all 19 cloud-free Sentinel-2 images in 2021 in the western Guanzhong area, Shaanxi Province, China. The results were evaluated using in situ FPAR measurements and MODIS FPAR data in terms of accuracy, consistency across different scales and spatiotemporal continuities, and computational efficiency. This study provides a reference and methodological support for the rapid and operational estimation of Sentinel-2 FPAR.
2. Materials and Methods
2.1. Study Areas
The study area is in the western part of the Guanzhong region in Shaanxi Province, China, and covers a complete Sentinel-2 image scene (Figure 1). The northern part of the study area belongs to the southern edge of the Loess Plateau with interspersed forest and bare land, while the southern part is the Guanzhong Plain, which mainly grows wheat and maize. The area includes various land cover types, including cropland, woodland, grassland, and built areas typical of impervious surfaces, as shown in Figure 1d. The generalizability and accuracy of the FPAR estimation method can be tested on different land cover types.
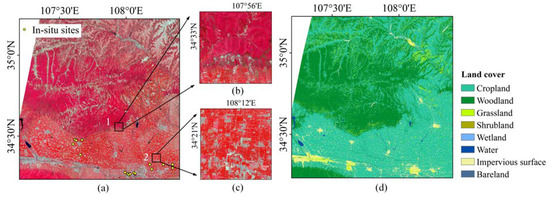
Figure 1.
Map of the study area. (a) Visible near-infrared composite Sentinel-2 images. (b,c) The subarea with high spatial heterogeneity. (d) FROM-GLC10 land cover map.
2.2. Data Acquisition and Processing
2.2.1. Sentinel-2 Data
Sentinel-2 consists of two polar-orbiting satellites, Sentinel-2A and Sentinel-2B [23]. The Sentinel-2 satellite carries a multispectral instrument (MSI), which contains 13 spectral bands from visible and near-infrared to shortwave infrared bands (Table 1). The Sentinel-2 level-2A (L2A) surface reflectance data products, which have been atmospherically and geometrically corrected and converted to the WGS-84/UTM projection, were used in this study. A total of 19 Sentinel-2 images in 2021 with less than 10% cloud coverage were selected, which had an average temporal resolution of 19 days due to unfavorable weather. The proposed retrieval chain was implemented on the GEE, where the Sentinel-2 L2A data were directly obtained from the GEE archive and further processed in an automatic manner. The official Sentinel-2 FPAR retrieval algorithm was implemented in the SNAP tool. As the tool requires, we downloaded the original zipped files of Sentinel-2 L2A data directly from the Copernicus Open Access Hub and used the tool to further process the data.

Table 1.
Band information of the Sentinel-2 sensor.
2.2.2. MODIS FPAR Product
The FPAR data used in this study were MODIS LAI/FPAR products (MCD15A3H) with 4-day intervals and 500-m spatial resolution. The MCD15A3H product used a maximum composite algorithm to obtain FPAR at 4-day intervals; thus, each MODIS FPAR image represents a 4-day interval. For example, MODIS FPAR on DOY 001 corresponds to the FPAR from DOY 001 to 004. To match the Sentinel-2 images in time, the MODIS FPAR images covering the dates of available Sentinel images were selected. To match the Sentinel-2 images in space, all the selected MODIS FPAR images were clipped and reprojected to the WGS-84/UTM projection (Zone 48 N).
2.2.3. In Situ Measurement
In this study, field experiments were conducted on April 16, April 17, and April 30, 2021, to obtain ground measurement FPAR data in the study area. The sample area was selected to cover a homogeneous area with a size of at least 30 m × 30 m. In the sampling unit, each sampling point was measured at 3–5 m intervals evenly along the diagonal direction. The precise location of each sampling point was measured using the Qianxun Continuously Operating Reference Stations (CORS) service and the Hi-Target Real Time Kinematic (RTK) system under the WGS-84 coordinate system. A SunScan canopy analyzer [27] was used to measure the incident and outgoing PAR above and below the canopy, respectively, to calculate FPAR [28]. For tall trees, it is difficult to measure the outgoing PAR above the canopy. Instead, the incident PAR in the open area and below the canopy were measured to calculate the fraction of intercepted PAR (FIPAR) by the canopy, which was used as an approximation of FPAR. The FIPAR and FPAR are equal when the PAR reflected by the understory layer is close to zero. For tall trees in our field work, a large portion of the incident PAR was intercepted by tree leaves, and the transmitted PAR was only a very small portion, which was further absorbed by the soils and grasses in the understory layer. This made the FIPAR of the tree canopy very close to the FPAR, which was verified in previous in situ measurements of dense vegetation [29]. Therefore, it is reasonable to use FIPAR as an alternative to FPAR for tall trees.
As all the sampling points were measured sequentially, the FPAR measurements at different points were obtained at different times. Since FPAR exhibits unique diurnal variations [29], the FPAR measurements at different times (e.g., 9:30 and 16:30) cannot be compared with each other or with the satellite observations. Therefore, we normalized the FPAR measurements at different time to the times of satellite overpass using the temporal normalization method proposed by Wang et al. [28].
A total of 197 sampling points were measured and temporally normalized. Some sampling points fell in the same Sentinel-2 image pixel, and their FPAR values were averaged to derive the pixel-level FPAR for comparison with the estimated Sentinel-2 FPAR images. As a result, 95 pixel-level FPAR measurements at 10 m resolution and 64 pixel-level FPAR measurements at 20 m resolution were derived. The number of pixel-level FPAR measurements for tall trees was only 5 and 3 for 10 m and 20 m resolutions, respectively. Therefore, the errors caused by using FIPAR as an alternative to FPAR were regarded as negligible.
2.3. Scaling-Based Method
Considering the characteristics of Sentinel-2 imagery, this study proposed a retrieval chain based on a scale-consistent transfer between MODIS FPAR and fine-resolution surface reflectance in [19] to retrieve decameter-scale FPAR, which we will refer to as the scaling-based method hereafter. The flowchart of the retrieval chain is shown in Figure 2. All the steps were implemented on the GEE (available at https://earthengine.google.com/, accessed on 12 March 2022), and we visited the GEE platform via a local computer with an i7-10700F CPU and RTX 2060 GPU.
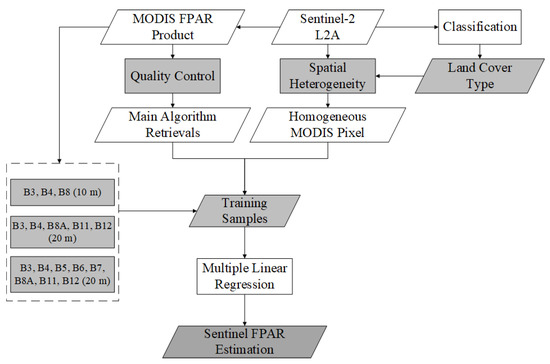
Figure 2.
Flowchart of the scaling-based retrieval chain for Sentinel-2 FPAR estimation.
The core of the scale-consistent transfer from MODIS FPAR to fine resolution is to model FPAR as a linear combination of multiband surface reflectance, which can avoid scale effects across different scales [30]. Thus, the multiple linear regression model between FPAR and surface reflectance is valid at both coarse and fine resolutions. Therefore, we can use a land cover-specific multilinear model to model FPAR for a specific date, expressed as
where is the MODIS FPAR values of l selected samples for land cover type c on date t, is the reflectance of nb bands plus a constant term of l selected samples, represents the algorithm coefficients (including the constant term) for a specific linear retrieval model, and ε is the residual error between the prediction and true value.
To derive the algorithm coefficients correctly, the major steps of the retrieval chain are described as follows.
- Unsupervised classification
Since the relationship between FPAR and surface reflectance differs for different land cover types, the Sentinel-2 images were first classified into five different land cover types, including cropland, forestland, grassland, bare land and built areas, using the K-means unsupervised classification method. The K-means unsupervised classification method was used for its simplicity and efficiency, without requiring any manually selected training samples.
- 2.
- Sample screening
To derive the coefficients of the linear model in Equation (1), adequate samples with high-quality MODIS FPAR retrievals on homogeneous pixels should be selected. Because the differences in spatial resolution between MODIS FPAR products and Sentinel-2 imagery are large and Sentinel-2 imagery has two different spatial resolutions at 10 m and 20 m, the criteria for selecting samples need to be carefully designed.
First, to better represent the saturated pixels in densely vegetated areas, the criterion for selecting high-quality MODIS FPAR retrievals was set as the quality control (QC) flag ≤ 50, which includes the FPAR retrievals derived from MODIS main algorithm under both saturated and unsaturated conditions.
Second, to account for the large difference in spatial resolutions between MODIS and Sentinel-2 data, the criterion of selecting homogeneous MODIS pixels should be self-adaptive and representative of the two spatial resolutions. The proposed retrieval chain defines the mean coefficient of variation (CV) of the image as the threshold. A MODIS pixel with a CV value less than this threshold is regarded as homogeneous. The mean CV is assumed to represent the general spatial heterogeneity, which can apply to different images and different spatial resolutions.
- 3.
- Band selection
Since Sentinel-2 data have many bands and two different spatial resolutions, it is meaningful to determine the optimal combination of bands or the optimal spatial resolution in fine-resolution FPAR estimation using the retrieval chain.
We designed three strategies using different combinations of spectral bands as input to the retrieval chain, as shown in Table 2. The first combination includes three bands at 10 m resolution, i.e., green, red, and near-infrared (NIR) bands, which were consistent with the bands used in the SNAP toolbox at 10 m resolution. Both the second and third combinations correspond to 20 m resolution. The second combination includes green, red, NIR, and shortwave infrared 1 (SWIR1) and SWIR2 bands, which were consistent with the bands used for the FPAR estimation from Landsat data. The third combination includes bands green, red, NIR, red-edge1 (RE1), RE2, RE3, SWIR1, and SWIR2, which were consistent with the bands used in the SNAP toolbox at 20 m resolution. For the strategies at 20 m resolution, the surface reflectance in the green and red bands were aggregated from 10 m resolution to 20 m resolution using a simple averaging approach, which computes the average values of the 2 × 2 pixels at 10-m resolution within one 20-m resolution pixel.
Table 2.
Three combinations of bands used in the scaling-based FPAR retrieval chain.
- 4.
- Fine-resolution FPAR estimation
The coefficients of the linear model for different strategies were derived for each land cover type by regressing on the selected samples from one specific pair of MODIS-Sentinel-2 images at 500 m resolution. Then, the linear model was applied to the Sentinel-2 reflectance data to estimate the FPAR using a specific combination of bands at a specific spatial resolution. Corresponding to the three strategies, we will refer to the derived results as scaled FPAR with three bands (10 m), scaled FPAR with five bands (20 m), and scaled FPAR with eight bands (20 m), hereafter.
2.4. SNAP Algorithm
To obtain fine-resolution vegetation parameters, the European Space Agency (ESA) officially developed a retrieval algorithm and integrated it with SNAP software. The algorithm is provided by SNAP as the “Biophysical processor” tool (version 2.1, available at https://step.esa.int/main/download/snap-download/, accessed on 24 February 2022), which uses an artificial neural network trained on the PROSAIL radiative transfer model to retrieve FPAR [31], and we will refer to it as the SNAP algorithm hereafter. The SNAP algorithm was developed for two combinations of bands: one includes the three bands of green, red, and NIR bands at 10 m resolution, and the other includes eight bands, i.e., green, red, NIR, RE1, RE2, RE3, SWIR1, and SWIR2 bands, at 20 m resolution. Both SNAP algorithms were used to estimate FPAR from Sentinel-2 images, which we refer to as SNAP FPAR at 10 m and 20 m, respectively. The SNAP tool was run on the same local computer with an i7-10700F CPU and an RTX 2060 GPU.
2.5. Validation and Comparison
We estimated the FPAR for the 19 Sentinel-2 images in 2021 using SNAP and the proposed methods at both 10 m and 20 m resolutions. The results were validated using in situ FPAR measurements and compared with MODIS FPAR products. Since the in situ measurements are sparse in space and time, the results were also compared with the MODIS FPAR product that have been validated as reliable globally [32]. The metrics for evaluation include root mean square error (RMSE), mean absolute error (MAE), and coefficient of determination (R²) [33]. In addition, the computational efficiency of the two methods was also evaluated and compared.
3. Results
3.1. Validation with In Situ Measurements
Figure 3 compares the fine-resolution FPAR values estimated by the two methods at different resolutions with the in situ FPAR measurements. Specifically, the FPAR values estimated by SNAP and the scaling-based methods were generally accurate at two different resolutions. Among the FPAR images estimated by different methods and strategies, the accuracy followed the order of scaled FPAR with five bands at 20 m (R² = 0.626 and RMSE = 0.076) > scaled FPAR with eight bands at 20 m (R² = 0.479 and RMSE = 0.100) > SNAP FPAR at 10 m (R² = 0.471 and RMSE = 0.106) > scaled FPAR with three bands at 10 m (R² = 0.454 and RMSE = 0.111) > SNAP FPAR at 20 m (R² = 0.482 and RMSE = 0.128). It is worth noting that the scaling-based method using five bands and eight bands both outweighed the SNAP method at 10 m resolution. This indicates that the SNAP method is an optimal choice for Sentinel FPAR estimation at 10 m resolution, and the scaling-based method using five bands is an optimal choice for Sentinel FPAR estimation at 20 m resolution. If a high accuracy is desired and 20 m resolution is acceptable, the scaling-based method using five bands is highly recommended. The scaling-based method using three bands is the only exceptional case in which the accuracy of the scaled FPAR is lower than that of the SNAP FPAR, probably because the use of three bands was insufficient to model the nonlinear FPAR-reflectance relations [34].
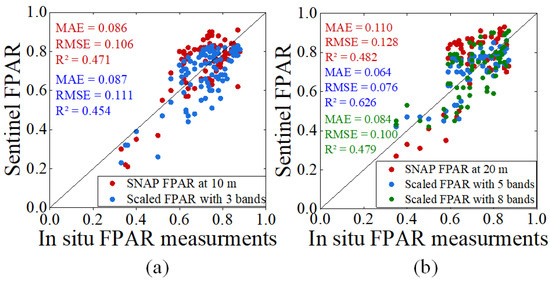
Figure 3.
Comparison of the in situ FPAR measurements and Sentinel FPAR retrievals from the (a) 10 m spatial resolution and (b) 20 m spatial resolution.
3.2. Consistency with MODIS FPAR
Figure 4 shows the Sentinel FPAR images estimated by different methods and strategies in the entire study area on 1 August 2021, and Figure 5 enlarges two test areas in comparison to the MODIS FPAR image. As shown in Figure 4a–f, the Sentinel FPAR estimated by both the SNAP and scaling-based methods were generally consistent with the MODIS FPAR. In Figure 4g, the SNAP method underestimated both high (>0.8) and low (<0.2) FPAR values at both 10 m and 20 m resolutions. In contrast, the FPAR values estimated by the scaling-based method were closer to the MODIS FPAR over the entire FPAR range at both 10 m and 20 m resolutions, and slight underestimations were found for high FPAR values (>0.8).
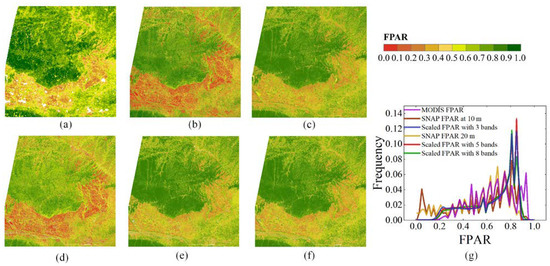
Figure 4.
Comparison of MODIS FPAR and Sentinel FPAR images retrieved by SNAP and the scaling-based method in the study area on 1 August 2021. (a) MODIS FPAR. (b) SNAP FPAR at 10 m. (c) Scaled FPAR with three bands. (d) SNAP FPAR at 20 m. (e) Scaled FPAR with five bands. (f) Scaled FPAR with eight bands. (g) Histograms of the results.
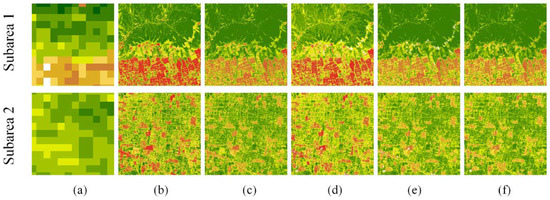
Figure 5.
Comparison of MODIS FPAR and Sentinel FPAR images retrieved by SNAP and the scaling-based method in the subarea area on 1 August 2021. (a) MODIS FPAR. (b) SNAP FPAR at 10 m. (c) Scaled FPAR with three bands. (d) SNAP FPAR at 20 m. (e) Scaled FPAR with five bands. (f) Scaled FPAR with eight bands.
The spatial details in Figure 5 show that the SNAP method underestimated FPAR values in both densely vegetated and sparsely vegetated areas compared to the MODIS FPAR, especially at 20 m resolution, which was consistent with previous studies [31,35]. The scaling-based method using each strategy accurately restored the spatial patterns of MODIS FPAR, while SNAP failed to capture the spatial details of MODIS FPAR in some areas. Such a significant difference revealed a large difference in the retrieval algorithms, which were the three-dimensional radiative transfer model contained in MODIS FPAR products and a trained neural network from the PROSAIL model.
Figure 6 visualizes the differences between the estimated Sentinel-2 FPAR images using the two methods and the MODIS FPAR image in the entire study area on 1 August 2021. Negative and positive values indicate underestimations and overestimations in the Sentinel-2 FPAR images, respectively. As shown in Figure 6a,d, the SNAP method systematically underestimated FPAR values at both 10 m and 20 m resolutions for all land cover types but only overestimated FPAR values in a small portion of cropland. As shown in Figure 6b,e,f, the scaling-based method slightly overestimated the FPAR values for cropland and underestimated the FPAR values for woodland. The histograms in Figure 6c,g clearly show the systematic differences between the SNAP FPAR images and the MODIS FPAR images, averaging approximately −0.087 and 0.120 at 10 m and 20 m resolutions, respectively. Such underestimation within the SNAP method was more significant at 20 m resolution than at 10 m resolution, probably due to the averaging of the subpixel heterogeneity at 20 m resolution [31]. In contrast, the average differences between the scaled FPAR using the three strategies and the MODIS FPAR images range from −0.003 to −0.001. This indicates that the scaling-based methods can derive MODIS-consistent Sentinel-2 FPAR estimations.
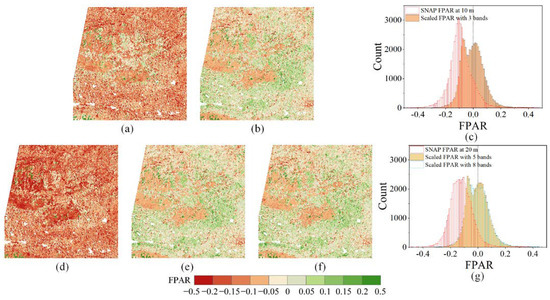
Figure 6.
Difference between the Sentinel-2 FPAR images and MODIS FPAR image in the study area on 1 August 2021. (a) SNAP FPAR at 10 m minus MODIS FPAR. (b) Scaled FPAR with three bands minus MODIS FPAR. (c) Histograms of the differences in Sentinel-2 FPAR at 10 m. (d) SNAP FPAR at 20 m minus MODIS FPAR. (e) Scaled FPAR with five bands minus MODIS FPAR. (f) Scaled FPAR with eight bands minus MODIS FPAR. (g) Histograms of the differences in Sentinel-2 FPAR at 20 m.
Figure 7 compares the Sentinel FPAR images estimated by the scaling-based and SNAP methods with the MODIS FPAR images for 2021. For both resolutions, the contour lines of the scaling-based method bulged out in the direction of the 1:1 line very well and were more concentrated than those of SNAP. The SNAP method significantly underestimated FPAR values over the entire range. Compared with the MODIS FPAR images, the Sentinel FPAR retrievals of the scaling-based method (overall RMSE ranging from 0.089 to 0.091, MAE from 0.066 to 0.067, and R² from 0.837 to 0.842) were more consistent than those of the SNAP method (overall RMSE ranging from 0.118 to 0.129, MAE from 0.092 to 0.103, and R² from 0.777 to 0.790). A possible reason might be that the PROSAIL model was built for homogeneous canopies [36], which might underestimate FPAR values compared to the MODIS algorithm that considered the three-dimensional canopy structures.
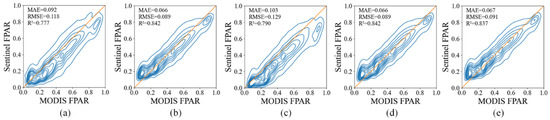
Figure 7.
Two-dimensional density contour of MODIS FPAR vs. Sentinel FPAR retrievals. (a) SNAP FPAR at 10 m. (b) Scaled FPAR with three bands. (c) SNAP FPAR at 20 m. (d) Scaled FPAR with five bands. (e) Scaled FPAR with eight bands.
Figure 8 shows the retrieved Sentinel FPAR values and the MODIS FPAR values as a function of day of year (DOY) in 2021. In general, the Sentinel FPAR values from the scaling-based method were more consistent with the MODIS FPAR values than those of SNAP in terms of the mean values, standard deviations and RMSE for all three vegetation types. The SNAP method underestimated the FPAR values for all three vegetation types at each growth stage, and the underestimation was even more significant at 20 m resolution. This may be attributed to the increased subpixel heterogeneity at 20 m resolution. The modeling error of the PROSAIL model to heterogeneous canopies and the scale effects [30,37] caused by using the aggregated reflectance of heterogeneous pixels in a nonlinear retrieval algorithm greatly increases the retrieval uncertainty [31]. The scaling-based method performed best over croplands, slightly underestimated the FPAR values for the woodlands and overestimated the FPAR values for the grasslands during peak growth stages. The scaled FPAR with five bands and eight bands at 20 m resolution showed slight improvements in the underestimation over the scaled FPAR with three bands at 10 m resolution, especially for slight overestimation of winter vegetation, indicating better representation of FPAR-reflectance relations using more spectral bands. Meanwhile, we calculated the green chlorophyll vegetation index (GCI) [38,39] using GCI = , where and represent the surface reflectance of NIR and green bands. We computed the mean GCI value for each Sentinel-2 image at 10 m resolution for comparison with the seasonal variations in FPAR. The GCI values among the different vegetation types followed the order of woodland > grassland > cropland. The seasonal variations in the estimated FPAR were very consistent with those of the GCI values that represent the chlorophyll content.
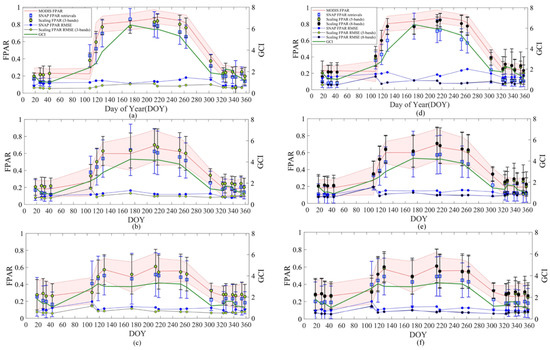
Figure 8.
Spatiotemporal patterns of Sentinel FPAR retrievals using the SNAP and scaling-based methods in the study area in 2021 compared with the MODIS FPAR values and mean green chlorophyll vegetation index as a function of DOY for (a,d) woodland, (b,e) grassland, and (c,f) cropland. (a–c) is 10 m resolution Sentinel FPAR; (d–f) is 20 m resolution Sentinel FPAR.
We further compared the consistency of the Sentinel-2 FPAR images with the MODIS FPAR images during different phenological stages, as shown in Figure 9. According to the seasonal variations in FPAR in Figure 8, we divided an entire year into five phenological stages, including a pre-growth period with consistently low FPAR values, a rapid growth period, a peak period with consistently high FPAR values, a rapid senescence period, and a postgrowth period with consistently low FPAR values. Figure 9 reveals the seasonal variations in the performance of all methods. For both methods, the agreement of the Sentinel-2 FPAR images with the MODIS FPAR was the highest for the pre-growth and rapid senescence periods, then in the postgrowth period, and the lowest for the rapid growth and peak periods. Overall, the scaling-based method achieved better agreement with the MODIS FPAR images than the SNAP method across all different phenological stages at both resolutions. This reinforced the robustness of the proposed method across different phenological periods.
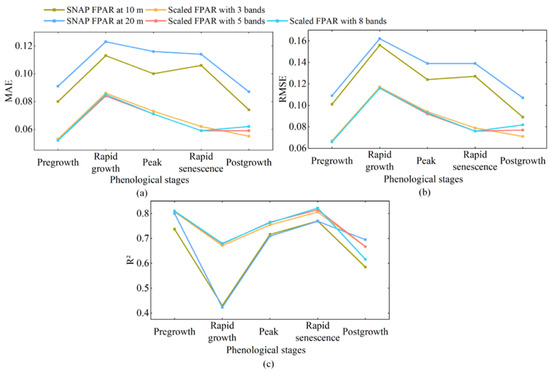
Figure 9.
The agreement of the Sentinel FPAR images estimated by the SNAP and the scaling-based method during different phenological periods. (a) MAE. (b) RMSE. (c) R². Phenological stages are (1) pre-growth from DOY 1 to DOY 100, (2) rapid growth from DOY 101 to DOY 130, (3) peak stage from DOY 131 to DOY 260, (4) rapid senescence from DOY 261 to DOY 320, and (5) post-growth from DOY 321 to DOY 365.
3.3. Computational Efficiency Comparison
The scaling-based method was implemented on the GEE, which inherited the advantages of the GEE and was much more efficient than the SNAP method. First, the use of GEE greatly reduces the time for acquiring and preprocessing data [25], whereas the SNAP method needs to select and download data to local computers. Second, the scaling-based method built upon multiple linear regressions can work through linear operations on the matrix of the entire image, which only costs 30 s for estimating FPAR from a single Sentinel-2 scene. In contrast, the SNAP algorithm based on a trained neural network works on a pixel-by-pixel basis, which takes an average of 10 min to estimate FPAR from a single Sentinel-2 scene on a local desktop workstation with an i7-10700F CPU and RTX 2060 GPU. Therefore, the scaling-based method is very suitable for the operational estimation of FPAR from Sentinel-2 images.
4. Discussion
In this study, we developed a retrieval chain for estimating FPAR from Sentinel-2 images using MODIS FPAR products as a reference. Scale-consistent multilinear models were used to build the FPAR-reflectance relations within the MODIS FPAR products. To account for the spectral and spatial characteristics of Sentinel-2 data, the criteria for selecting training samples and the use of different combinations of spectral bands were carefully designed. The performance of the proposed retrieval chain was compared with the official FPAR algorithm provided by SNAP software at both 10 m and 20 m resolutions.
The proposed scaling-based retrieval chain outperformed the official SNAP algorithm, probably due to the good performance of the radiative transfer algorithm contained in the MODIS FPAR algorithm. The strategy of using five bands at 20 m derived the most reliable results in terms of accuracy, consistency with MODIS FPAR, and computation efficiency. For the scaling-based method, using three bands might be insufficient, while using eight bands might be redundant to model the nonlinear FPAR-reflectance relations within the MODIS FPAR algorithms. For the SNAP algorithm, the FPAR estimations at 10 m resolution were more accurate and more consistent with the MODIS FPAR than those at 20 m resolution, probably because the PROSAIL algorithm basically assumes canopies are homogeneous and the FPAR estimation at 20 m resolution confronts increased subpixel heterogeneity [31]. However, our conclusions were drawn from the comparisons of different Sentinel FPAR images with in situ measurements and MODIS FPAR products. Since Sentinel-2 data are very new, available in situ measurements comparable to Sentinel-2 acquisition dates are very few. Further studies are expected to verify the accuracy of the scaling-based method using different combinations of spectral bands with more in situ measurements.
The high consistency of the scaled FPAR with the MODIS FPAR products verified the competence of the scaling-based method to model the FPAR-reflectance relations within the MODIS FPAR products. However, the underestimation of high FPAR values indicated the underrepresentation of complex FPAR-reflectance relations for dense vegetation in the scaling-based method. The saturation of Sentinel-2 surface reflectance in densely vegetated areas is a major cause for such underrepresentation. This saturation is represented by the very small increase in Sentinel-2 NDVI with increasing vegetation density after Sentinel-2 NDVI reaches above 0.8. In our experiments, the scaling-based method using eight bands shows little improvement over the scaling-based method using five bands, indicating that adding red-edge bands cannot effectively solve the problem. Moreover, leveraging the regression errors in the multiple linear regression can also cause FPAR underestimation for dense vegetation, which is common for similar methods based on statistical learning between MODIS FPAR and fine-resolution surface reflectance. Further studies can exert more efforts to overcome this problem.
The FPAR estimated by the scaling-based method inherited the high accuracy and wide applicability of the main algorithm of the MODIS FPAR products and can be easily automated on a cloud computing platform. After a series of comparisons, the scaling-based method proved to be simpler and more accurate than the SNAP method. Considering the overdue service of the MODIS sensor, the proposed method can be easily extended by using the alternatives of the MODIS FPAR product as a reference. The performance of such an extension largely depends on the accuracy of the alternative FPAR products, and future work can be conducted to evaluate and improve the accuracy of such MODIS-like products. In addition, the proposed method achieves high computational efficiency with the help of the GEE platform. If the GEE stops service due to some force majeure factors, the proposed method can be readily migrated to other similar cloud computing platforms, such as Pixel Information Expert (PIE)-Engine Studio [40] and NASA Earth Exchange (NEX) [41].
Compared to the scaling-based method, the SNAP method was less accurate and less computationally efficient. Previous studies also derived similar results. For example, Putzenlechner et al. [35] found that the SNAP method systematically underestimated FPAR values on forested land in different regions in comparison to the in situ measurements. Hu et al. [42] found that the SNAP method is less accurate for estimating FPAR than for LAI. The systematic underestimation of FPAR values by the SNAP method was probably attributed to modeling errors and uncertainty in the retrieval [35,42]. The SNAP method does not require any a priori information, such as land cover maps to ensure its high degree of generality, but this also increases the uncertainty of the retrieval [31]. Future improvements can be exerted on introducing priori information to increase the accuracy. However, the SNAP method was advantageous for not requiring coarse-resolution FPAR products as a reference.
5. Conclusions
Based on the spectral and spatial characteristics of Sentinel-2 data, this paper developed a scaling-based retrieval chain for the operational estimation of decameter FPAR from Sentinel-2 data. The proposed method was compared with the official SNAP method in regional application for the entire year of 2021. The performance of both algorithms on different spatial resolutions and using different combinations of spectral bands was further investigated. The main conclusions can be drawn as follows.
- (1)
- Validated with the in situ FPAR measurements, the scaling-based method using five bands at 20 m resolution was the most accurate, outperforming the SNAP method at 10 m and 20 m resolutions and the scaling-based method using eight bands. At 10 m resolution, the SNAP method performed better than the scaling-based method using three bands. Thus, the scaling-based method using five bands was optimal at 20 m resolution or when we only considered accuracy, while the SNAP method was optimal at 10 m resolution.
- (2)
- Compared with MODIS FPAR products, the SNAP method systematically underestimated FPAR values, especially for densely vegetated and sparsely vegetated areas. Such underestimation by the SNAP method was more significant at 20 m resolution than at 10 m resolution. The scaling-based method using three, five, and eight bands all achieved very good consistency with the MODIS FPAR products compared to the SNAP method.
- (3)
- The scaling-based method was implemented on the GEE and is more efficient than the SNAP method. Estimating FPAR from a single Sentinel-2 scene only takes 30 s, while the SNAP method takes an average of 10 min. The scaling-based method is very suitable for the operational estimation of FPAR from Sentinel-2 images.
Author Contributions
Conceptualization, Y.W.; Formal analysis, Y.W. and Y.Z.; Funding acquisition, Y.W.; Investigation, Y.W. and D.X.; Methodology, Y.W. and H.H.; Resources, Y.W.; Validation, Y.Z.; Visualization, Y.Z., J.L. and X.Z.; Writing—original draft, Y.W. and Y.Z.; Writing—review and editing, Y.W., Y.Z., D.X., D.Z. and Z.X. All authors have read and agreed to the published version of the manuscript.
Funding
This research was funded by the “National Natural Science Foundation of China (NSFC), grant number 41901301”, the “Open Research Fund Program of State Key Laboratory of Eco-hydraulics in Northwest Arid Region, Xi’an University of Technology, grant number 2020KFKT-7”, the “Science Fund Program for Distinguished Young Scholars by Xi’an University of Science and Technology”, grant number 2022YQ3-03, the “Open Fund of State Key Laboratory of Remote Sensing Science, grant number OFSLRSS201922”, and “Natural Science Foundation of Shaanxi Province, grant number 2020JQ-739”.
Institutional Review Board Statement
Not applicable.
Informed Consent Statement
Not applicable.
Data Availability Statement
Publicly available datasets were analyzed in this study. Sentinel-2 data can be found here: (GEE, https://earthengine.google.com, accessed on 12 Marth 2022; ESA, https://scihub.copernicus.eu/dhus/#/home, accessed on 24 February 2022), MODIS FPAR data can be found here: (GEE, https://earthengine.google.com, accessed on 12 Marth 2022).
Conflicts of Interest
The authors declare no conflict of interest.
References
- Gower, S.T.; Kucharik, C.J.; Norman, J.M. Direct and indirect estimation of leaf area index, fAPAR, and net primary production of terrestrial ecosystems. Remote Sens. Environ. 1999, 70, 29–51. [Google Scholar] [CrossRef]
- Castaldi, F.; Casa, R.; Pelosi, F.; Yang, H. Influence of acquisition time and resolution on wheat yield estimation at the field scale from canopy biophysical variables retrieved from SPOT satellite data. Int. J. Remote Sens. 2015, 36, 2438–2459. [Google Scholar] [CrossRef]
- Tian, D.; Fan, W.; Ren, H. Progress of fraction of absorbed photosynthetically active radiation retrieval from remote sensing data. J. Remote Sens. 2020, 24, 1307–1324. [Google Scholar]
- Myneni, R.B.; Hoffman, S.; Knyazikhin, Y.; Privette, J.; Glassy, J.; Tian, Y.; Wang, Y.; Song, X.; Zhang, Y.; Smith, G. Global products of vegetation leaf area and fraction absorbed PAR from year one of MODIS data. Remote Sens. Environ. 2002, 83, 214–231. [Google Scholar] [CrossRef]
- Knyazikhin, Y.; Martonchik, J.; Myneni, R.B.; Diner, D.; Running, S.W. Synergistic algorithm for estimating vegetation canopy leaf area index and fraction of absorbed photosynthetically active radiation from MODIS and MISR data. J. Geophys. Res. Atmos. 1998, 103, 32257–32275. [Google Scholar] [CrossRef]
- Xiao, Z.; Liang, S.; Sun, R.; Wang, J.; Jiang, B. Estimating the fraction of absorbed photosynthetically active radiation from the MODIS data based GLASS leaf area index product. Remote Sens. Environ. 2015, 171, 105–117. [Google Scholar] [CrossRef]
- Wang, Y.; Yan, G.; Xie, D.; Hu, R.; Zhang, H. Generating Long Time Series of High Spatiotemporal Resolution FPAR Images in the Remote Sensing Trend Surface Framework. IEEE Trans. Geosci. Remote Sens. 2021, 60, 1–15. [Google Scholar] [CrossRef]
- Wang, Y.; Xie, D.; Zhan, Y.; Li, H.; Yan, G.; Chen, Y. Assessing the accuracy of landsat-MODIS NDVI fusion with limited input data: A strategy for base data selection. Remote Sens. 2021, 13, 266. [Google Scholar] [CrossRef]
- Chen, J.M. Canopy architecture and remote sensing of the fraction of photosynthetically active radiation absorbed by boreal conifer forests. IEEE Trans. Geosci. Remote Sens. 1996, 34, 1353–1368. [Google Scholar] [CrossRef]
- Fan, W.; Liu, Y.; Xu, X.; Chen, G.; Zhang, B. A new FAPAR analytical model based on the law of energy conservation: A case study in China. IEEE J. Sel. Top. Appl. Earth Obs. Remote Sens. 2014, 7, 3945–3955. [Google Scholar] [CrossRef]
- Majasalmi, T.; Rautiainen, M.; Stenberg, P. Modeled and measured fPAR in a boreal forest: Validation and application of a new model. Agric. For. Meteorol. 2014, 189, 118–124. [Google Scholar] [CrossRef]
- Wang, W.; Nemani, R.; Hashimoto, H.; Ganguly, S.; Huang, D.; Knyazikhin, Y.; Myneni, R.; Bala, G. An interplay between photons, canopy structure, and recollision probability: A review of the spectral invariants theory of 3d canopy radiative transfer processes. Remote Sens. 2018, 10, 1805. [Google Scholar] [CrossRef]
- Fensholt, R.; Sandholt, I.; Rasmussen, M.S. Evaluation of MODIS LAI, fAPAR and the relation between fAPAR and NDVI in a semi-arid environment using in situ measurements. Remote Sens. Environ. 2004, 91, 490–507. [Google Scholar] [CrossRef]
- Myneni, R.; Williams, D. On the relationship between FAPAR and NDVI. Remote Sens. Environ. 1994, 49, 200–211. [Google Scholar] [CrossRef]
- Liu, R.; Ren, H.; Liu, S.; Liu, Q.; Yan, B.; Gan, F. Generalized FPAR estimation methods from various satellite sensors and validation. Agric. For. Meteorol. 2018, 260, 55–72. [Google Scholar] [CrossRef]
- Huemmrich, K.; Goward, S. Vegetation canopy PAR absorptance and NDVI: An assessment for ten tree species with the SAIL model. Remote Sens. Environ. 1997, 61, 254–269. [Google Scholar] [CrossRef]
- Gao, F.; Anderson, M.C.; Kustas, W.P.; Wang, Y. Simple method for retrieving leaf area index from Landsat using MODIS leaf area index products as reference. J. Appl. Remote Sens. 2012, 6, 063554. [Google Scholar] [CrossRef]
- Sun, Y.; Qin, Q.; Ren, H.; Zhang, Y. Decameter Cropland LAI/FPAR Estimation From Sentinel-2 Imagery Using Google Earth Engine. IEEE Trans. Geosci. Remote Sens. 2021, 60, 1–14. [Google Scholar] [CrossRef]
- Wang, Y.; Yan, G.; Hu, R.; Xie, D.; Chen, W. A scaling-based method for the rapid retrieval of FPAR from fine-resolution satellite data in the remote-sensing trend-surface framework. IEEE Trans. Geosci. Remote Sens. 2020, 58, 7035–7048. [Google Scholar] [CrossRef]
- Yan, K.; Pu, J.; Park, T.; Xu, B.; Zeng, Y.; Yan, G.; Weiss, M.; Knyazikhin, Y.; Myneni, R.B. Performance stability of the MODIS and VIIRS LAI algorithms inferred from analysis of long time series of products. Remote Sens. Environ. 2021, 260, 112438. [Google Scholar] [CrossRef]
- Donlon, C.; Berruti, B.; Buongiorno, A.; Ferreira, M.-H.; Féménias, P.; Frerick, J.; Goryl, P.; Klein, U.; Laur, H.; Mavrocordatos, C. The global monitoring for environment and security (GMES) sentinel-3 mission. Remote Sens. Environ. 2012, 120, 37–57. [Google Scholar] [CrossRef]
- Gobron, N.; Morgan, O.; Adams, J.; Brown, L.A.; Cappucci, F.; Dash, J.; Lanconelli, C.; Marioni, M.; Robustelli, M. Evaluation of Sentinel-3A and Sentinel-3B ocean land colour instrument green instantaneous fraction of absorbed photosynthetically active radiation. Remote Sens. Environ. 2022, 270, 112850. [Google Scholar] [CrossRef]
- Drusch, M.; Del Bello, U.; Carlier, S.; Colin, O.; Fernandez, V.; Gascon, F.; Hoersch, B.; Isola, C.; Laberinti, P.; Martimort, P. Sentinel-2: ESA’s optical high-resolution mission for GMES operational services. Remote Sens. Environ. 2012, 120, 25–36. [Google Scholar] [CrossRef]
- Weiss, M.; Baret, F. S2ToolBox Level 2 Products: LAI, FAPAR, FCOVER, Version 1.1; ESA Contract nr 4000110612/14/I-BG; INRA: Avignon, France, 2016; p. 52. [Google Scholar]
- Gorelick, N.; Hancher, M.; Dixon, M.; Ilyushchenko, S.; Thau, D.; Moore, R. Google Earth Engine: Planetary-scale geospatial analysis for everyone. Remote Sens. Environ. 2017, 202, 18–27. [Google Scholar] [CrossRef]
- Tamiminia, H.; Salehi, B.; Mahdianpari, M.; Quackenbush, L.; Adeli, S.; Brisco, B. Google Earth Engine for geo-big data applications: A meta-analysis and systematic review. ISPRS J. Photogramm. Remote Sens. 2020, 164, 152–170. [Google Scholar] [CrossRef]
- Mourad, R.; Jaafar, H.; Anderson, M.; Gao, F. Assessment of leaf area index models using harmonized landsat and sentinel-2 surface reflectance data over a semi-arid irrigated landscape. Remote Sens. 2020, 12, 3121. [Google Scholar] [CrossRef]
- Wang, Y.; Xie, D.; Liu, S.; Hu, R.; Li, Y.; Yan, G. Scaling of FAPAR from the Field to the Satellite. Remote Sens. 2016, 8, 310. [Google Scholar] [CrossRef]
- Li, W.; Fang, H.; Wei, S.; Weiss, M.; Baret, F. Critical analysis of methods to estimate the fraction of absorbed or intercepted photosynthetically active radiation from ground measurements: Application to rice crops. Agric. For. Meteorol. 2021, 297, 108273. [Google Scholar] [CrossRef]
- Wang, Y.; Xie, D.; Li, X. Universal scaling methodology in remote sensing science by constructing geographic trend surface. J. Remote Sens. 2014, 18, 1139–1146. [Google Scholar]
- Weiss, M.; Baret, F.; Jay, S. S2ToolBox Level 2 Products LAI, FAPAR, FCOVER, Version 2.0; EMMAH-CAPTE, INRAE: Avignon, France, 2020. [Google Scholar]
- Baret, F.; Weiss, M.; Lacaze, R.; Camacho, F.; Makhmara, H.; Pacholcyzk, P.; Smets, B. GEOV1: LAI and FAPAR essential climate variables and FCOVER global time series capitalizing over existing products. Part1: Principles of development and production. Remote Sens. Environ. 2013, 137, 299–309. [Google Scholar] [CrossRef]
- Willmott, C.J. Some comments on the evaluation of model performance. Bull. Am. Meteorol. Soc. 1982, 63, 1309–1313. [Google Scholar] [CrossRef]
- Dong, P.; Gao, L.; Zhan, W.; Liu, Z.; Li, J.; Lai, J.; Li, H.; Huang, F.; Tamang, S.K.; Zhao, L. Global comparison of diverse scaling factors and regression models for downscaling Landsat-8 thermal data. ISPRS J. Photogramm. Remote Sens. 2020, 169, 44–56. [Google Scholar] [CrossRef]
- Putzenlechner, B.; Castro, S.; Kiese, R.; Ludwig, R.; Marzahn, P.; Sharp, I.; Sanchez-Azofeifa, A. Validation of Sentinel-2 fAPAR products using ground observations across three forest ecosystems. Remote Sens. Environ. 2019, 232, 111310. [Google Scholar] [CrossRef]
- Jacquemoud, S.; Verhoef, W.; Baret, F.; Bacour, C.; Zarco-Tejada, P.J.; Asner, G.P.; François, C.; Ustin, S.L. PROSPECT+ SAIL models: A review of use for vegetation characterization. Remote Sens. Environ. 2009, 113, S56–S66. [Google Scholar] [CrossRef]
- Wu, H.; Li, Z.-L. Scale issues in remote sensing: A review on analysis, processing and modeling. Sensors 2009, 9, 1768–1793. [Google Scholar] [CrossRef] [PubMed]
- Gitelson, A.A.; Gritz, Y.; Merzlyak, M.N. Relationships between leaf chlorophyll content and spectral reflectance and algorithms for non-destructive chlorophyll assessment in higher plant leaves. J. Plant Physiol. 2003, 160, 271–282. [Google Scholar] [CrossRef]
- Hunt Jr, E.R.; Doraiswamy, P.C.; McMurtrey, J.E.; Daughtry, C.S.; Perry, E.M.; Akhmedov, B. A visible band index for remote sensing leaf chlorophyll content at the canopy scale. Int. J. Appl. Earth Obs. Geoinf. 2013, 21, 103–112. [Google Scholar] [CrossRef]
- Cheng, W.; Qian, X.; Li, S.; Ma, H.; Liu, D.; Liu, F.; Liang, J.; Hu, J. Research and application of PIE-Engine Studio for spatiotemporal remote sensing cloud computing platform. Natl. Remote Sens. Bull 2022, 26, 335–347. [Google Scholar]
- Nemani, R.; Votava, P.; Michaelis, A.; Melton, F.; Hashimoto, H.; Milesi, C.; Wang, W.; Ganguly, S. NASA Earth Exchange: A Collaborative Earth Science Platform. In AGU Fall Meeting Abstracts; American Geophysical Union: Washington, DC, USA, 2010; abstract id. IN53A-1161. [Google Scholar]
- Hu, Q.; Yang, J.; Xu, B.; Huang, J.; Memon, M.S.; Yin, G.; Zeng, Y.; Zhao, J.; Liu, K. Evaluation of global decametric-resolution LAI, FAPAR and FVC estimates derived from Sentinel-2 imagery. Remote Sens. 2020, 12, 912. [Google Scholar] [CrossRef]


Publisher’s Note: MDPI stays neutral with regard to jurisdictional claims in published maps and institutional affiliations. |
© 2022 by the authors. Licensee MDPI, Basel, Switzerland. This article is an open access article distributed under the terms and conditions of the Creative Commons Attribution (CC BY) license (https://creativecommons.org/licenses/by/4.0/).