Article

Contamination Status and Health Risk Assessment of Soil Heavy Metals in the Northern Slope of Eastern Tianshan Mountains Industrial Belt in Xinjiang, Northwest China

by
Abdugheni Abliz
1,2,3,4,
Qingdong Shi
4,* and
Abudukeyimu Abulizi
1,2
1
College of Geography and Remote Sensing Sciences, Xinjiang University, Urumqi 830046, China
2
Xinjiang Key Laboratory of Oasis Ecology, Xinjiang University, Urumqi 830046, China
3
Ecological Postdoctoral Research Station, Xinjiang University, Urumqi 830046, China
4
College of Ecology and Environment, Xinjiang University, Urumqi 830046, China
*
Author to whom correspondence should be addressed.
Forests 2022, 13(11), 1914; https://doi.org/10.3390/f13111914
Submission received: 15 October 2022 / Revised: 11 November 2022 / Accepted: 11 November 2022 / Published: 14 November 2022
(This article belongs to the Special Issue Pollution, Heavy Metal, and Emerging Threats in Forest Soil)

Abstract

:
In recent years, soil heavy metal pollution has become an important issue of general concern because it is an important factor that threatens the soil environment. To assess the risk of the human health of the people living in the economic belt on the northern slope of the eastern Tianshan Mountains, and provide guidance for pollution control and risk prevention, the northern slope of the eastern Tianshan Mountains was selected as the study area, and six heavy metals (i.e., Zn, Cu, Cr, Pb, and Hg) were measured. The results revealed that the Cu, Pb, Hg, and As contents of the soil exceeded the soil background value of Xinjiang by 1.02, 4.10, 1.76, and 7.98 times, respectively. The Zn and Cr contents were lower than the limits of regional soil standards. Based on the pollution assessment using the pollution index (PI), values indicate that the levels of Zn and Cr pollution were low, those of Cu and Hg pollution were moderate, and those of Pb and As pollution were high. The health risk assessment results revealed that there are non-carcinogenic risks to children. The carcinogenic health risks posed by the heavy metals in this region are higher than the threshold (10−4), indicating that they pose a hazard to human health. The results of this research provide a theoretical basis and reference for soil heavy metal pollution control and human health risk management in this area.

1. Introduction

Soil is an important resource for human survival and development, and its environmental quality plays a vital role in ensuring regional sustainable development [1,2,3]. As a result of rapid industrial and economic development, the competitive pressure between resources and the environment is increasing, the soil environmental quality is deteriorating, and soil heavy metal pollution has become an increasingly serious problem [4,5,6,7]. Human activities and natural processes are the main sources of the heavy metal accumulation in soil [8]. The former are considered to be the main contributors to soil heavy metal contamination in most studies [9,10,11,12]. Industrial and mining activities, transportation, agricultural fertilization, and irrigation cause an acceleration in the accumulation of heavy metals in soil, which not only affects crop production but also poses a potential threat to the functioning of ecosystems and human health via the food chain [13,14,15]. In addition, the heavy metals that enter the soil through the three pathways of ingestion, inhalation, and dermal contact absorption enter the human body, affecting human health [16,17].
The North Slope Economic Belt of the eastern Tianshan Mountains is located in the Xinjiang Uygur Autonomous Region. The Tianshan Mountains are located far from the sea and receive little precipitation. This region has a typical temperate continental climate, and the ecological environment is relatively fragile [18]. This region has the most developed economy, the densest population, and the greatest industrial and agricultural activities in Xinjiang. According to statistics, this region accounts for 69.1% of the gross domestic product (GDP) of Xinjiang, and the population of this region accounts for 38.9% of the population of Xinjiang [19]. There are many industrial facilities in this region, such as coal mines, coal power plants, chemical plants, petroleum industry facilities, cement plants, and non-ferrous metal manufacturing plants. Some of the industrial facilities have more than 20 years of industrial production history, and a large number of pollutants have been discharged during the production activities of these enterprises over many years. After entering the soil, this pollution leads to the accumulation of soil heavy metals and poses a threat to the regional ecological environment and human health. Therefore, research on soil heavy metal pollution and an assessment of human health risks in this area provides scientific guidance for regional soil environmental early warning and protection, and the reduction of the risks posed by soil heavy metals to human health.
To accurately assess the human health risk of the people living in this area, in this study, the surface soils (0–20 cm) in the Fukang, Qitai, Jimsar, and Midong districts were selected for analysis. The specific objectives of this study were (1) to determine the concentrations of and spatial variations in Zn, Cu, Cr, As, Hg, and Pb in the soil; (2) to evaluate the contamination level of the heavy metals in soil using different pollution assessment methods; and (3) to assess the human health risk of heavy metals in soil.

2. Materials and Methods

2.1. Study Area

The study area is located in Fukang City, Jimsar County, and Qitai County in the northern part of the Changji state (44°20′–45°10′ N, 88°36′–89°50′ E) in the Xinjiang Uyghur Autonomous Region, northwestern China. The central part of the study area consists of plains and is distributed along national highway 216 and provincial highway 303.This region is located in the southern part of the Tianshan Mountains and the northern part of the Gurbantonggut Deserts. The topography of this region is higher in the southeast than in the northwest, and it mainly has a continental semi-desert aridity climate, with high evaporation and less precipitation. The elevation range is 500–1000 m, the annual average temperature is about 8 °C, and the annual average precipitation is 140–500 mm [20]. The soil types from south to north are Arenosols, Anthrosols, Calcisols, Argosols, and Umbrisols. The eco-environment is fragile and easily destroyed, and will be difficult to repair.

2.2. Soil Sampling and Chemical Analysis

In this study, a total of 171 soil samples were collected from a depth of 0–20 cm in the study area (Figure 1). Considering the source of heavy metal emissions in the study area, the soil samples were collected from around industrial zones. In addition, considering that farmland is also vulnerable to heavy metal pollution, some soil samples were collected from farmland. In this study, the checkerboard sampling method was used for the collection of soil samples, and collection was evenly distributed in the research area. During sampling, the sampling plot was set first according to the diagonal method, and the plot size was 10 m × 10 m. A quantity of 1 kg of soil was collected using a hard plastic shovel and the position was recorded using a global positioning system (GPS). Then, the soil samples were transported to the laboratory, air dried, and passed through a 2 mm nylon sieve, purged of plant roots, stones, and other substances, and finally passed through a 0.25 mm nylon sieve for complete dissolution.
A soil sample of 0.5 g was digested using a mixture of concentrated HCI, HNO3, HF, and HCIO4 [21]. After preparing the soil samples, the concentrations of the heavy metals were measured using an anatomic absorption spectrometer (Hitachi-Z2000, Tokyo, Japan). The contents of Zn, Pb, Cu, and Cr were measured by inductively coupled plasma atomic emission spectrometry [22], and the elements of Hg and As were measured by the atomic fluorescence spectrometry (AFS) [23]. Quality assurance and quality control (QA/QC) were performed using the soil standard reference material of China (GBW07401, GSS-1). The accepted recoveries ranged from 94.8% to 112% for each element.

2.3. Assessment of Heavy Metal Pollution

The geo-accumulation index (Igeo) proposed by Müller in 1969 has been widely used to assess soil pollution in recent years [24,25,26]. Igeo is divided into seven classes, and the different classes represent the heterogeneity of the degree of pollution [27]:
I g e o = log 2 [ C n / ( 1.5 × B n ) ]
where Cn is the measured value of the heavy metals in soil; and Bn is the geochemical background value of the heavy metals in the local soil. In this study, for Bn, the background value for Xinjiang was used [28]. Igeo was divided into the following levels: unpolluted (Igeo ≤ 0); unpolluted to moderately polluted (0 < Igeo ≤ 1); moderately polluted (1 < Igeo ≤ 2); moderately to strongly polluted (2 < Igeo ≤ 3); strongly polluted (3 < Igeo ≤ 4); strongly to extremely polluted (4 < Igeo ≤ 5); and extremely polluted (Igeo > 5) [22].
The PI and pollution load index (PLI) of the heavy metals were calculated using the following equations [29]:
P I = C n B n
PLI = (PI1 × PI2 × PI3 ×…× PIn)1/n
where Cn is the measured value of the heavy metals in the soil, Bn is the geochemical background value of the heavy metals in the local soil, and n is the number of heavy metals. The PI of each element was calculated and classified as either low (PI ≤ 1), medium (1 < PI ≤ 3), or high (PI > 3) [18]. The PLI was classified as unpolluted (PLI ≤ 1), unpolluted to moderately polluted (1 < PLI ≤ 2), moderately polluted (2 < PLI ≤ 3), moderately to highly polluted (3 < PLI ≤ 4), highly polluted (4 < PLI ≤ 5), and very highly polluted (PLI > 5) [30,31].

2.4. Potential Ecological Risk Index (PRI)

The potential ecological risk index (PRI) was proposed by the Swedish scientist Lars Hakanson [32]. The equation for calculating PRI is given as follows:
P R I = i n E r i
E r i = T n i × C r i
C r i = C i C n i
where E r i is the individual potential ecological risk coefficient of a heavy metal, T n i is the toxic response factor of six heavy metals (Zn = 1; Cu = Pb = 5; Cr = 2; Hg = 40; and As = 10) [32,33], C r i is the pollution factor of the heavy metal, Ci is the measured value of the heavy metals in the soil, and C n i is the geochemical background value of the heavy metals. Hakanson defined five categories: low risk ( E r i ≤ 40), moderate risk (40 < E r i ≤ 80), considerable risk (80 < E r i ≤ 160), high risk (160 < E r i ≤ 320), and very high risk ( E r i ≥ 320). In this study, we analyzed six heavy metals; therefore, the PRI ranges were modified and the four categories of the PRI were defined as follows: low risk (PRI ≤ 70), moderate risk (70 < E r i ≤ 140), considerable risk (140 < E r i ≤ 280), and very high risk ( E r i ≥ 280).

2.5. Health Risk Assessment

2.5.1. Exposure Assessment

In this study, the health risk posed by heavy metals in soil was calculated and assessed based on the guidelines and Exposure Factors Handbook of the US Environmental Protection Agency [34,35,36]. The average daily dose (ADD) values for each heavy metal via three exposure pathways were calculated using the following Equations (7)–(9):
A D D i n g = C × ln g R × E F × E D B W × A T × 10 6
A D D i n h = C × ln h r × E F × E D S L × B W × A T
A D D d e r m a l = C × S L × S A × A B S × E F × E D B W × A T × 10 6
L A D D = C × E F A T × S L × ( I n h R c h i l d × E D c h i l d B W child + I n h R a d u l t B W a d u l t )
where ADDing, ADDinh, and ADDdermal are the average daily intakes from soil ingestion, inhalation, and dermal absorption, respectively (mg kg−1d−1). The important parameter values used to calculate the intake value and risk are given in Table 1.

2.5.2. Non-Carcinogenic Risk Assessment

The non-cancer risk can be characterized by the hazard quotient (HQ) [4]. For a mixture of contaminated soil, the hazard index (HI), which is equal to the sum of the HQ values of all of the heavy metals, was calculated and applied to assess the overall non-carcinogenic risk [34]. The equation is given as follows:
H Q i = j = 1 3 A D D ij R f D i j
H I = i = 1 4 H Q i
where RfDij is the reference dose for the six heavy metals, as presented in Table 2. If HI < 1, it is considered that there are no significant adverse health effects, whereas if HI > 1, there is a possibility of non-carcinogenic risks [11,37].

2.5.3. Carcinogenic Risk Assessment

Carcinogenic risk (CR) indicates that the probability of an individual suffering from any type of cancer due to exposure to carcinogenic risks in their whole lifetime [9]. The CR is calculated by summing the individual cancer risks of each exposure pathway using the following equations:
C R i = J = 1 3 A D D i j S F ij
T C R = J = 1 2 C R i
where the CR is carcinogenic risk (unitless), TCR is the total carcinogenic risk (unitless), and SF is the carcinogenicity slope factor (mg·kg−1·day−1). The SF values of the six heavy metals are presented in Table 2. According to the USEPA (2001), if the TCR are <10−6, there is no carcinogenic health risk to humans; the carcinogenic risk is acceptable in the range of 10−6 < TCR < 10−4; if the TCR > 10−4, the carcinogenic risk exceeds the tolerable range of the human body [38,39].

2.6. Data Analysis

The descriptive statistics, coefficient of variation (CV), E r i , HI, and CR were calculated and analyzed in Microsoft Excel 2019 (Microsoft, Redmond, WA, USA). Pearson’s correlation coefficient, Igeo, PI, PRI, and principal component analysis (PCA) were derived using the SPSS20.0 software package (IBM, Armonk, NY, USA). Spatial distributions of heavy metals were created by Arc GIS 10.2 (ESRI, NY Str., Redland’s city, Los Angeles, CA, USA).

3. Results and Discussion

3.1. Heavy Metal Concentration in Soil

The descriptive statistics and environmental quality standards of the six heavy metals in the soil are given in Table 3. In this study, the regional background value and national soil environmental quality standards of China (GB15618-1995) were selected as the pollution limits. It was observed that the average contents of Zn, Cu, Cr, Pb, Hg, and As were 55.34, 27.16, 37.31, 79.63, 0.03, and 89.38 mg kg−1, respectively. The order of the contents of the seven heavy metals was As >Pb > Zn > Cr > Cu > Hg. Among these, the Cu, Pb, Hg, and As contents exceeded the regional background values by 1.02, 4.10, 1.76, and 7.98 times, respectively. The Cu, Pb, and As contents were 1.2, 3.06, and 7.98 times greater, respectively, than the national soil environmental quality standards of China (GB15618-1995). The coefficient of variation (CV) reflects the average variation in the heavy metal concentrations, with CV > 35% reflecting a high level of variation, 15% < CV < 35% reflecting a moderate level of variation, and CV ≤ 15% reflecting a low level of variation [40]. In this study, the CVs of the six heavy metals were 15% < CV < 35%, indicating moderate variation.

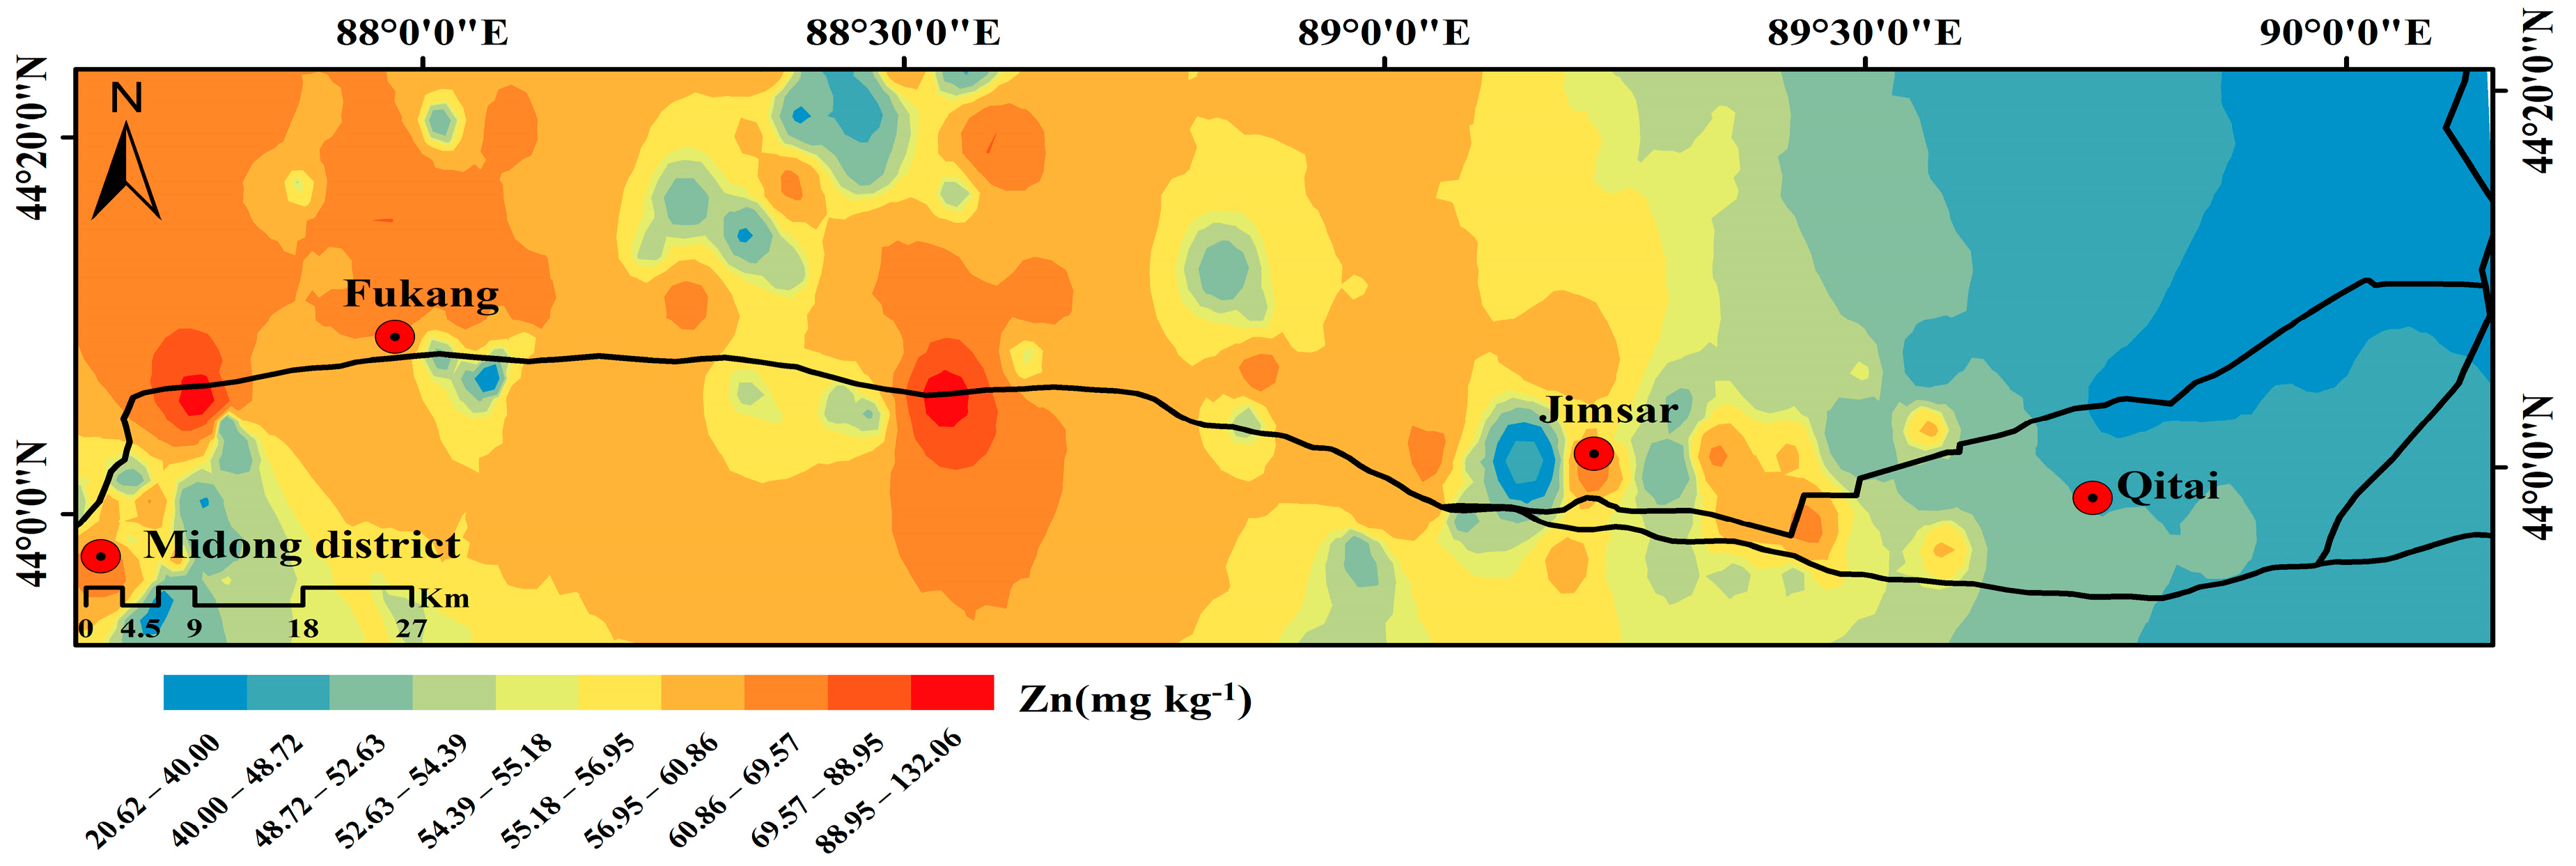
3.2. Spatial Distribution of Heavy Metals

The spatial distributions of the heavy metals in the soil are shown in Figure 2. It can be seen that, in the study area, the distribution trends of Zn, Cr, and Hg were basically consistent, and the high contents of these elements were mainly distributed in the soil around the main industrial regions in Jimsar County and Fukang City, including a coal mine, coal power plant, coal chemical plant, and electric aluminum plant. Except for Hg, the high values appeared in Qitai County, and Zn and Cr were present in low amounts in this region. The contents of the three heavy metals in the Midong District were lower than those in the other regions.
For Cu, most of the regions presented the same trend. The low values appeared in Midong District, the northeastern part of Jimsar County, and most of Qitai County. The high Pb contents appeared in the southern part of Fukang and most of Jimsar County. The low Pb contents were located in the northern part of Fukang City and Qitai County. The high As contents were distributed in Midong District, the main industrial region in the northern part of Jimsar County, and most of Qitai County, whereas the low contents appeared in the other regions of the study area.
Fukang City is the main industrial area in the East Tianshan Mountain Economic Belt; in this region, human activities are frequent and the soil is easily affected by human activities [18]. In the Ganhezi industrial region, which is located between Jimsar County and Fukang City, the main industries include electric power stations, chemical plants, cement factories, and fabric production. The deep red region in Figure 2 includes Tudunzi Town and Laotai Town. These areas are located between Jimsar County and Fukang City, and these regions are the main agricultural basis of Fukang City and Jimsar County. By comparing the distribution patterns of the six heavy metals in the four regions, it was found that the contamination level of Qitai County was lower than that of the other regions because there is less industrial activity in this region. Midong District is the main vegetation area, and it provides the vegetation for Urumqi. There is a significant degree of agricultural activity in this region; in addition, Midong District is the core area of the largest manufacturing base, a chemical industry city, and an important export processing base in Xinjiang. These enterprises emit contaminants in a different manner during their production process, causing the accumulation of heavy metals in this region [37].

3.3. Assessment of Heavy Metal Pollution in the Soil

The correlation analysis results for the seven heavy metals in the soil are shown in Figure 3. It can be seen that a high correlation existed between Cr–Hg, Cu–Cr, Cr–As, Zn–Cr, and Zn–Cu, with correlation coefficients of 0.61, 0.56, 0.52, 0.49, and 0.41, respectively. Weak correlations existed between the other elements.

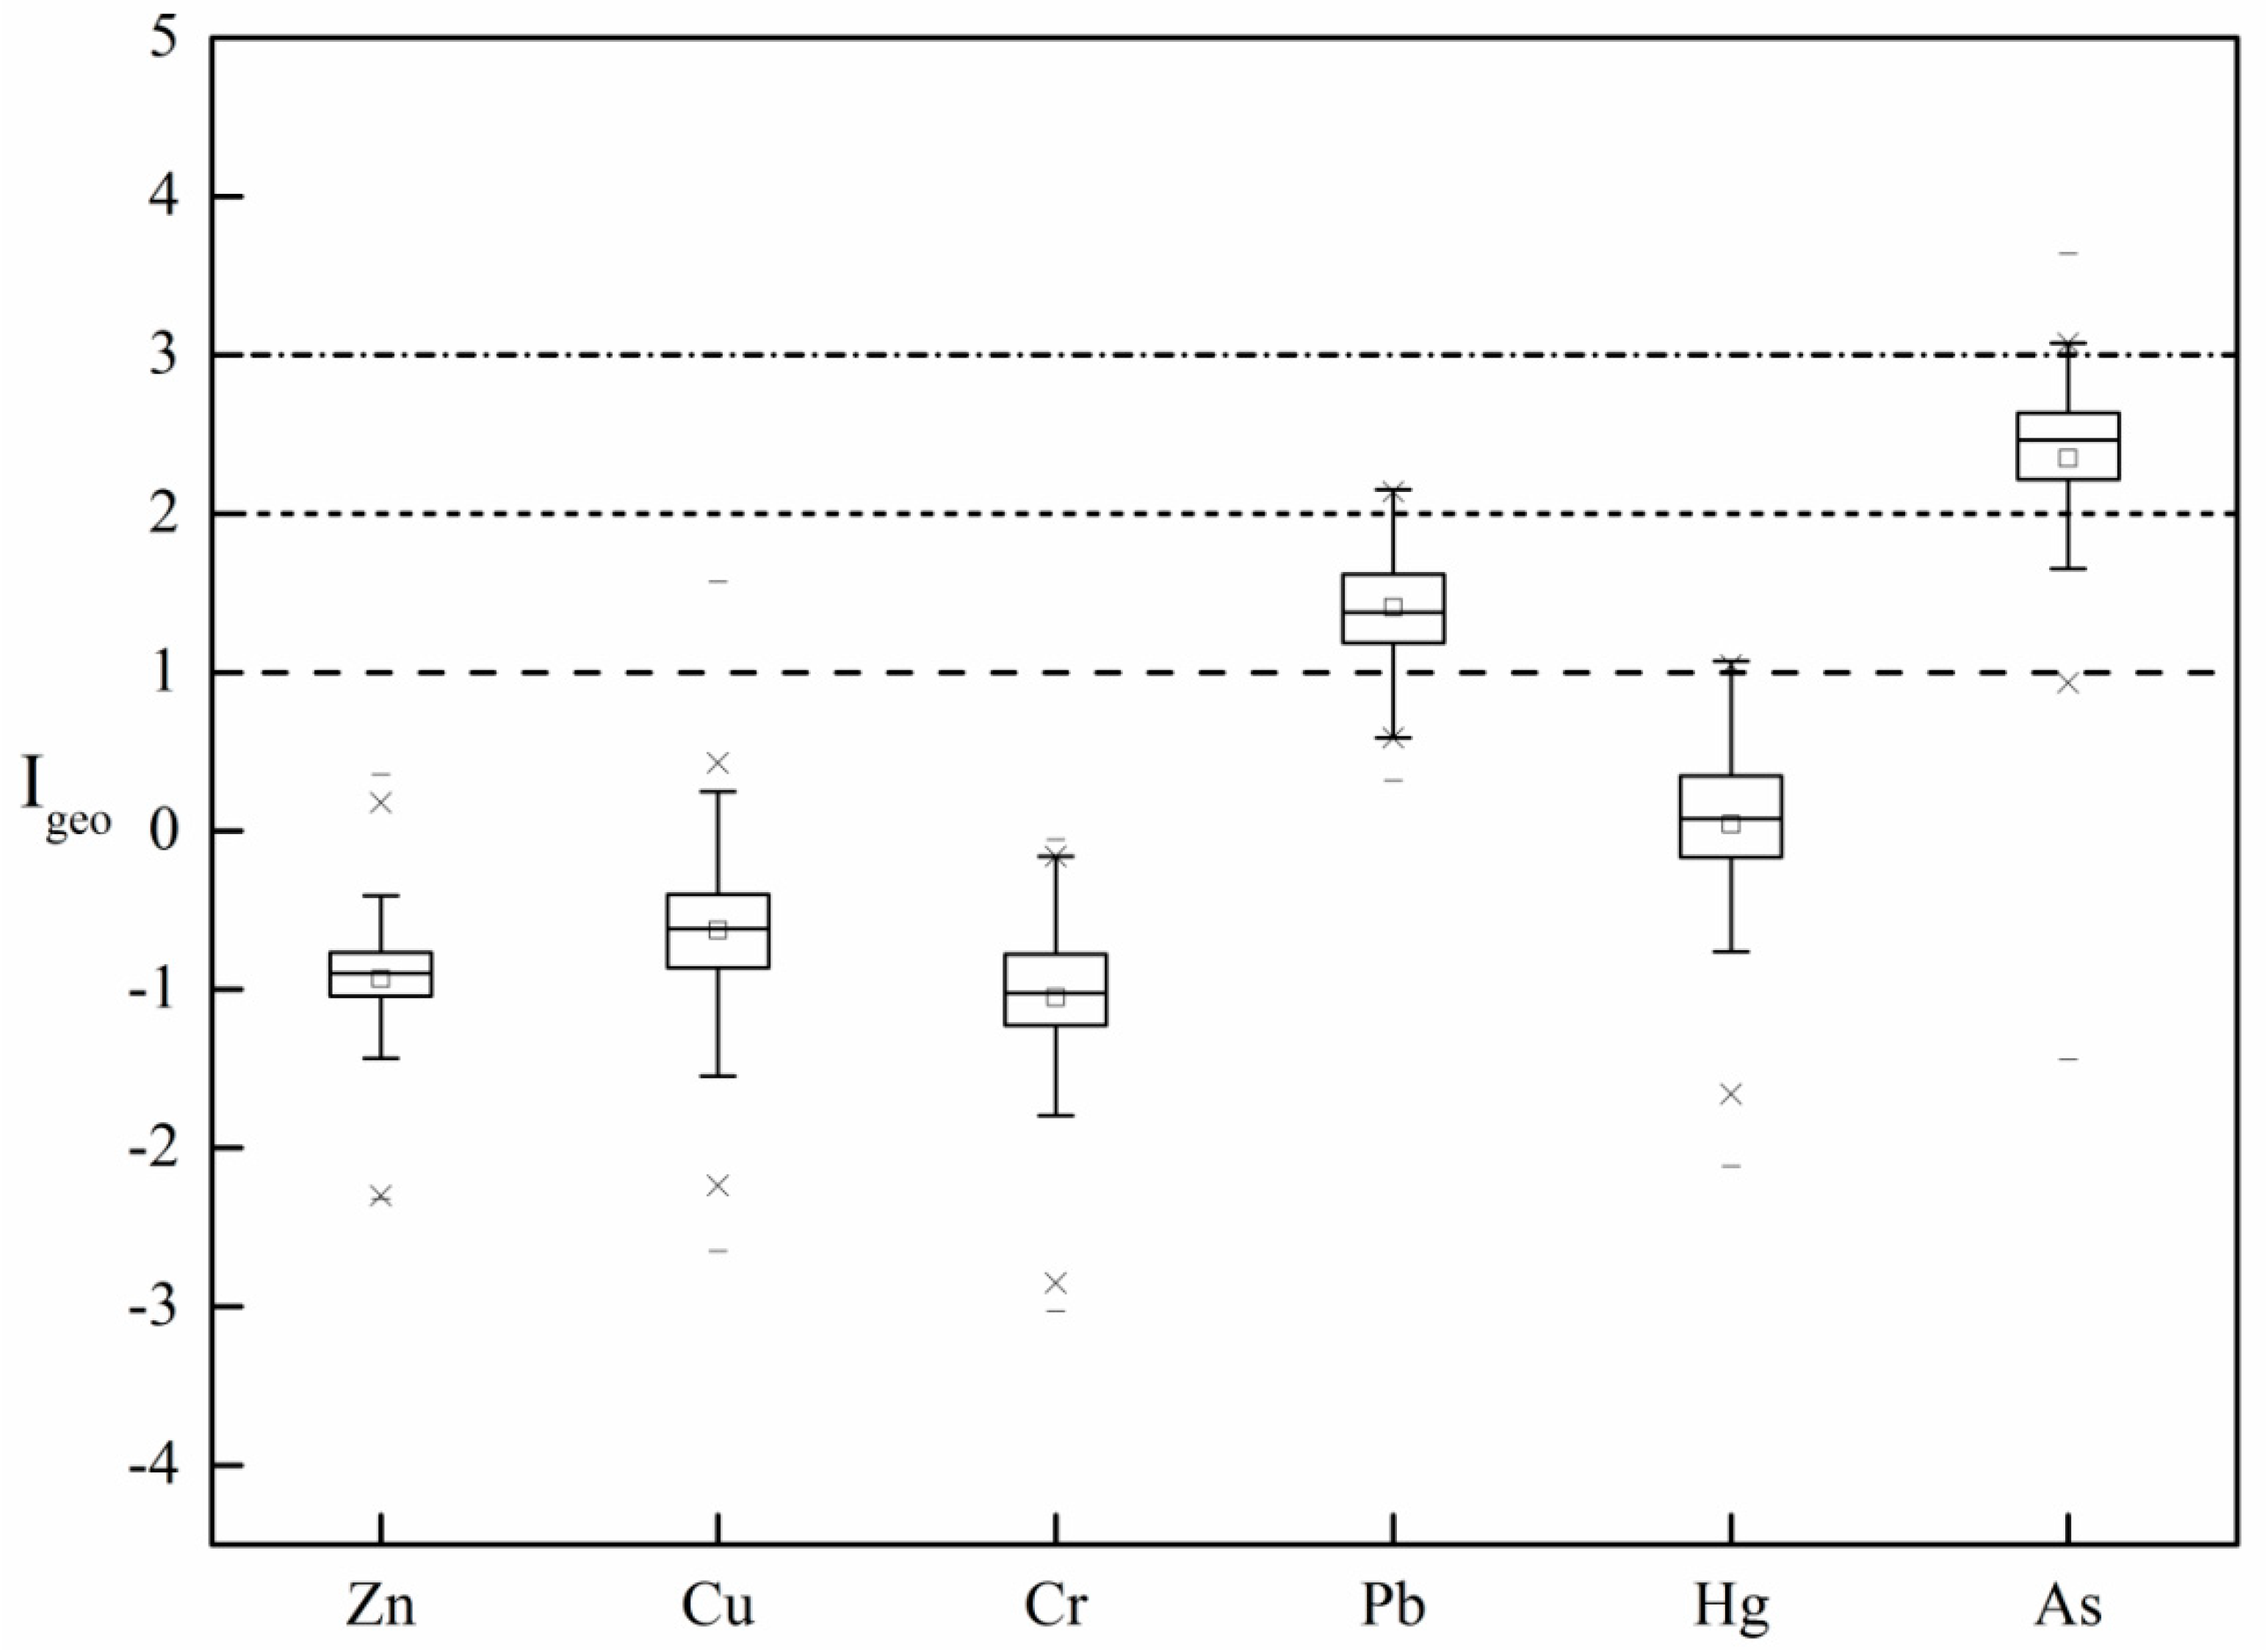
3.3.1. Results of the Igeo and PI

The results of the Igeo calculations (Figure 4) revealed that the Igeo values ranged from −2.32 to 0.36 (mean of −0.93) for Zn, from −2.65 to 1.57 (mean of −0.63) for Cu, from −3.03 to −0.06 (mean of −1.02) for Cr, from 0.32 to 2.15 (mean of 1.41) for Pb, from −2.11 to 1.07 (mean of 0.04) for Hg, and from −1.44 to 3.64 (mean of 2.35) for As. The mean Igeo values decreased in the order: As > Pb > Hg > Cu > Zn > Cr. The Igeo values of Zn, Cu, and Cr were less than 0, indicating no pollution. There was moderate Pb pollution, no to moderate Hg pollution, and the As pollution was moderate to strong.
As can be seen from Figure 5, the PI values of Cu, Pb, Hg, and As ranged from 0.24 to 4.64, 1.87 to 6.67, 0.41 to 3.71, and 0.55 to 18.72, with mean values of 1.02, 4.10, 1.90, and 7.98, respectively. The mean PI values of these heavy metals were ranked in the order of: As > Pb > Hg > Cu > Zn > Cr. The PIs of Zn (0.80) and Cr (0.76) were less than 1, indicating a low degree of pollution. The PIs of Cu (1.02) and Hg (1.90) indicated moderate pollution (1< PI ≤ 3), and those of Pb (4.10) and As (7.98) indicated a high level of pollution. The mean PLI value was 8.20. This mean PLI of greater than 5 (PLI > 5) indicates that all of the elements in this region exhibited very high levels of pollution.

3.3.2. Potential Ecological Risk (PRI) of Soil Heavy Metals

The PRI coefficient of the heavy metals in the 171 soil samples are presented in Table 4; the E r i values of Zn, Cu, Cr, and Pb were less than 40, presenting a low risk. The Hg in the 171 soil samples presented a low risk (13), moderate risk (129), and considerable risk (29). As in the 171 soil samples presented a low risk (13), moderate risk (70), and considerable risk (88). Therefore, Hg and As were considered to be main sources of risk in this region.
Based on the analysis of the PRI values of the heavy metals in the soils (Table 5), it was found that 19.3% of the values of the polluted sites were categorized as low risk, 80.1% as moderate risk, and 0.6% as considerable risk. In this study, the heavy metals in the soil of the study area exert moderate risks; this should be paid attention to, for control and to avoid further pollution.

3.4. Health Risk Assessment

3.4.1. Non-Carcinogenic Risk Assessment

Table 6 presents the non-carcinogenic risk index values of each element, through the three exposure pathways in soil. The average hazard quotients (HQs) for adults and children exhibited the same decreasing trend: HQAs > HQPb > HQCr > HQCu > HQZn > HQHg. The total HQs of Zn, Cu, Cr, Pb, Hg, and As for adults accounted for 0.06%, 0.21%, 3.74%, 7.09%, 0.04%, and 88.87% of the entire HI value, respectively. The total HQs of Zn, Cu, Cr, Pb, Hg, and As for children accounted for 0.06%, 0.21%, 3.72%, 6.84%, 0.03%, and 89.15% of the entire HI value, respectively. Based on these results, Cr, As, and Pb were the main non-carcinogenic factors in the heavy metal pollution of the soils in the study area. Based on comparative analysis, the three main pathways of the HQs are ranked as follows: HQingest > HQdermal > HQinhale. It can be concluded that oral ingestion and dermal contact were the main pathways of the non-carcinogenic health risks in this region. The order of non-carcinogenic HI values of heavy metals for both adults and children were As > Pb > Cr > Cu > Zn > Hg. Except for the HI values of As, which were higher than 1 (children), HI values for all studied heavy metals were below 1. There was no significant non-cancer risk for adults. As is the main element causing the non-cancer risk in this region. Comparison of the HI values of adults and children found that HI values of children were higher than those of adults. Because children spend more time playing outdoors and demonstrate more hand-to-mouth activities, HI values of children were higher than those of adults. Therefore, in this study, non-carcinogenesis risks caused by heavy metals in soil in children were greater than in adults, and this research result is consistent with earlier research [41].

3.4.2. Carcinogenic Risk Assessment

Table 7 shows the carcinogenic risk assessment results for As and Cr in the soil. Whether children or adults, the CR value of Cr is higher than that of As. The percentages of As and Cr of TCR for children are 92.16% and 7.84%, and the TCR values for adults are 92.11% and 7.89%, respectively. There are many industries in the study area, and arsenic mainly comes from industrial emissions, motor vehicles, and coal combustion. The atmosphere is an important means of transferring heavy metals from pollution sources. There is a northwest wind in the study area throughout the year, and people inhale pollutants in the air and from the soil during breathing, leading to the accumulation of heavy metals in their bodies. In this study, the content of arsenic was found to be greater than the regional background value of soil and the national soil quality standard, and the arsenic pollution situation presents a high pollution level. Combined with the carcinogenic risk assessment results, it can be seen that As is the main carcinogenic heavy metal element in this area. By comparing the three pathways for the CR of As, it was found that oral ingestion was the main pathway for the CR of As for both adults and children. Previous studies have reported that arsenic is a Class-A human carcinogen [42], and its presence in the topsoil throughout the entire city posed risk factors for children’s health [43]. Earlier research results showed that the heavy metals that present a cancer risk in this study area are Cr in food intake and As in food and dust intake; these are very high, i.e., up to 100 times the threshold (10−4), in Hunan Province in China [44]. The TCRs for adults and children were 9.85 × 10⁻⁴ and 4.89 × 10⁻⁴, respectively. The results of this study are consistent with the results of previous studies [25]. The carcinogenic health risks in this region exceed the tolerable range for the human body.

4. Conclusions

Our results indicate that the contents of Cu, Pb, and As in the soil exceeded the regional background values and the Chinese national soil environmental quality standards (GB15618-1995). The PIs of Zn (0.80) and Cr (0.76) were less than 1, indicating a low degree of pollution. The PIs of Cu (1.02) and Hg (1.90) indicated a moderate level of pollution (1< PI ≤ 3). The PIs of Pb (4.10) and As (7.98) indicated a high level of pollution. The mean PLI value was 8.20, which was greater than 5 (PLI > 5), indicating that all of the heavy metals in this region presented very high levels of pollution. The PRI values revealed that the soil in this region presented a moderate risk level.
The HI values for adults and children were lower than 1, and thus no non-carcinogenic risks are posed to adults; however, the element As poses non-carcinogenic risks to children. The results indicate that As is the main carcinogenic factor in this region. A comparison of the three pathways for the CR of As revealed that oral ingestion was the main pathway for the CR of As for both adults and children. The TCRs for adults and children were 9.85 × 10⁻⁴ and 4.89 × 10⁻⁴, respectively. As and Cr are the main heavy metals that pose human health risks in this region. The heavy metal pollution of these elements in this area needs to be paid special attention, and relevant departments should take measures to control the further impact of these heavy metals on human health.

Author Contributions

A.A. (Abdugheni Abliz) designed and wrote this paper, performed the experiments, and conducted the fieldwork, Q.S. conceived and supervision this study; A.A. (Abudukeyimu Abulizi) was responsible for manuscript proofreading and data analysis. All authors have read and agreed to the published version of the manuscript.

Funding

This research founded by the Chinese National Natural Science Foundation (42167058, U1903209), Postdoctoral Science Foundation, China (2018 M633609).

Data Availability Statement

Data is contained within the article.

Acknowledgments

Authors wish to thank the referees for providing helpful suggestions to improve this manuscript.

Conflicts of Interest

The authors declare no conflict of interest.

References

  1. Qin, G.W.; Niu, Z.D.; Yu, J.D.; Li, Z.H.; Xiang, P. Soil heavy metal pollution and food safety in China: Effects, sources and removing technology. Chemosphere 2021, 267, 129205. [Google Scholar] [CrossRef] [PubMed]
  2. Yang, S.; Taylor, D.; Yang, D.; He, M.; Xu, J. A synthesis framework using machine learning and spatial bivariate analysis to identify drivers and hotspots of heavy metal pollution of agricultural soils. Environ. Pollut. 2021, 287, 117611. [Google Scholar] [CrossRef] [PubMed]
  3. Lian, Z.M.; Zhao, X.M.; Gu, X.; Li, X.R.; Luan, M.M.; Yu, M. Presence, sources, and risk assessment of heavy metals in the upland soils of northern China using Monte Carlo simulation. Ecotox. Environ. Safe 2022, 230, 113154. [Google Scholar] [CrossRef] [PubMed]
  4. Yang, Q.Q.; Li, Z.Y.; Lu, X.N.; Duan, Q.N.; Huang, L.; Bi, J. A review of soil heavy metal pollution from industrial and agricultural regions in China: Pollution and risk assessment. Sci. Total Environ. 2018, 642, 690–700. [Google Scholar] [CrossRef]
  5. Keesstra, S.; Mol, G.; De Leeuw, J.; Okx, J.; De Cleen, M.; Visser, S. Soil-related sustainable development goals: Four concepts to make land degradation neutrality and restoration work. Land 2018, 7, 133. [Google Scholar] [CrossRef] [Green Version]
  6. Vareda, J.P.; Valente, A.J.; Duraes, L. Assessment of heavy metal pollution from anthropogenic activities and remediation strategies: A review. J. Environ. Manag. 2019, 246, 101–118. [Google Scholar] [CrossRef]
  7. Tan, K.; Wang, H.M.; Chen, L.H.; Du, Q.; Du, P.J.; Pan, C.C. Estimation of the spatial distribution of heavy metal in agricultural soils using airborne hyperspectral imaging and random forest. J. Hazard Mater. 2020, 382, 120987.1–120987.13. [Google Scholar] [CrossRef]
  8. Marrugo-Negrete, J.; Pinedo-Hernandez, J.; Diez, S. Assessment of heavy metal pollution, spatial distribution and origin in agricultural soils along the Sinu River Basin, Colombia. Environ. Res. 2017, 154, 380–388. [Google Scholar] [CrossRef]
  9. Li, Z.Y.; Ma, Z.W.; Kuijp, T.J.V.D.; Yuan, Z.W.; Huang, L. A review of soil heavy metal pollution from mines in China: Pollution and health risk assessment. Sci. Total Environ. 2014, 468, 843–853. [Google Scholar] [CrossRef]
  10. Li, P.Y.; Qian, H.; Howard, K.W.F.; Wu, J.H. Heavy metal contamination of Yellow River alluvial sediments, northwest China. Environ. Earth Sci. 2015, 73, 3403–3415. [Google Scholar] [CrossRef]
  11. Eziz, M.; Mohammad, A.; Mamut, A.; Hini, G. A human health risk assessment of heavy metals in agricultural soils of Yanqi Basin, Silk Road Economic Belt, China. Hum. Ecol. Risk Assess 2018, 24, 1352–1366. [Google Scholar] [CrossRef]
  12. Kang, J.; Ding, X.; Ma, H.; Dai, Z.; Li, X.; Huang, J. Characteristics and risk of forest soil heavy metal pollution in Western Guangdong Province, China. Forests 2022, 13, 884. [Google Scholar] [CrossRef]
  13. Dong, J.; Yang, Q.J.; Sun, L.N.; Zeng, Q.; Liu, S.J.; Pan, J.; Liu, X.L. Assessing the concentration and potential dietary risk of heavy metals in vegetables at a Pb/Zn mine site, China. Environ. Earth Sci. 2011, 64, 1317–1321. [Google Scholar] [CrossRef]
  14. Fei, X.F.; Lou, Z.H.; Christakos, G.; Ren, Z.Q.; Liu, Q.M.; Lv, X.N. The association between heavy metal soil pollution and stomach cancer: A case study in Hangzhou City, China. Environ. Geo Health 2018, 40, 2481–2490. [Google Scholar] [CrossRef] [PubMed]
  15. Buaisha, M.; Balku, S.; Özalp-Yaman, Ş. Heavy metal removal investigation in conventional activated sludge systems. Civ. Eng. J. 2020, 6, 470–477. [Google Scholar] [CrossRef] [Green Version]
  16. Wijayawardena, M.A.A.; Megharaj, M.; Naidu, R. Exposure, toxicity, health impacts, and bioavailability of heavy metal mixtures. In Advances in Agronomy; Sparks, D.L., Ed.; Elsevier Academic Press Inc.: San Diego, CA, USA, 2016; Volume 138, pp. 175–234. [Google Scholar] [CrossRef]
  17. Tong, S.; Li, H.; Wang, L.; Tudi, M.; Yang, L. Concentration, spatial distribution, contamination degree and human health risk assessment of heavy metals in urban soils across China between 2003 and 2019—A systematic review. Int. J. Environ. Res. Public Health 2020, 17, 3099. [Google Scholar] [CrossRef] [PubMed]
  18. Wu, X.L.; Zhang, T.X.; Wang, H.; Yu, X.J.; Zheng, X.N.; Li, H.Y. Characteristics of temperature and precipitation change in Xinjiang during 1961–2017. Desert Oasis Meteorol. 2020, 14, 27–34. [Google Scholar] [CrossRef] [Green Version]
  19. Zhang, P.P. Urban Comprehensive Carrying Capacity Evaluation of Economic Belt of Tianshan North-Slope. Master’s Thesis, Shihezi University, Shihezi, China, 2015; p. 25. [Google Scholar]
  20. Li, Q.; Wang, S.F.; Cao, Y.Z.; Wang, W.; Hong, C.L. Ecological risk assessment and source analysis of heavy metal pollution in farmland soils surrounding the coal mine of East Junggar Basin, China. J. Agro Environ. Sci. 2017, 36, 1537–1543. [Google Scholar] [CrossRef]
  21. GB15618-1995; Environmental Quality Standard for Soils. CEPA (Chinese Environmental Protection Administration): Beijing, China, 1995. (In Chinese)
  22. Liang, J.; Feng, C.T.; Zeng, G.M.; Gao, X.; Zhong, M.Z.; Li, X.D.; Li, X.; He, X.Y.; Fang, Y.L. Spatial distribution and source identification of heavy metals in surface soils in a typical coal mine city, Lianyuan, China. Environ. Pollut. 2017, 225, 681–690. [Google Scholar] [CrossRef]
  23. Mamat, Z.; Haximu, S.; Zhang, Z.Y.; Aji, R. An ecological risk assessment of heavy metal contamination in the surface sediments of Bosten Lake, northwest China. Environ. Sci. Pollut. Res. 2016, 23, 7255–7265. [Google Scholar] [CrossRef]
  24. Müller, G. Index of geoaccumulation in sediments of the Rhine River. Geojournal 1969, 2, 108–118. [Google Scholar]
  25. Ji, Y.Q.; Feng, Y.C.; Wu, J.H.; Zhu, T.; Bai, Z.P.; Duan, C.Q. Using geo-accumulation index to study source profiles of soil dust in China. J. Environ. Sci. 2008, 20, 571–578. [Google Scholar] [CrossRef]
  26. Kan, X.Q.; Dong, Y.Q.; Feng, L.; Zhou, M.; Hou, H.B. Contamination and health risk assessment of heavy metals in China’s lead–zinc mine tailings: A meta–analysis. Chemosphere 2021, 267, 128909. [Google Scholar] [CrossRef]
  27. Förstner, U.; Müller, G. Concentrations of heavy metals and polycyclic aromatic hydrocarbons in river sediments: Geochemical background, man’s influence and environmental impact. GeoJournal 1981, 5, 417–432. [Google Scholar] [CrossRef]
  28. CNEMC (China National Environmental Monitoring Centre). The Soil Background Value in China; China Environ Science Press: Beijing, China, 1990. [Google Scholar]
  29. Tomlinson, D.L.; Wilson, J.G.; Harris, C.R.; Jeffrey, D.W. Problems in the assessment of heavy-metals in estuaries and the formation of a pollution index. Helgol. Meeresunters. 1980, 33, 566–575. [Google Scholar] [CrossRef] [Green Version]
  30. Chen, H.; Teng, Y.G.; Lu, S.J.; Wang, Y.Y.; Wang, J.S. Contamination features and health risk of soil heavy metals in China. Sci. Total Environ. 2015, 512–513, 143–153. [Google Scholar] [CrossRef]
  31. He, J.; Yang, Y.; Christakos, G.; Liu, Y.; Yang, X. Assessment of soil heavy metal pollution using stochastic site indicators. Geoderma 2018, 337, 359–367. [Google Scholar] [CrossRef]
  32. Hakanson, L. An ecological risk index for aquatic pollution control. A sedimentological approach. Water Res. 1980, 14, 975–1001. [Google Scholar] [CrossRef]
  33. Pejman, A.; Nabi Bidhendi, G.; Ardestani, M.; Saeedi, M.; Baghvand, A. A new index for assessing heavy metals contamination in sediments: A case study. Ecol. Indic. 2015, 58, 365–373. [Google Scholar] [CrossRef]
  34. EPA/630/R-98/002; Guidelines for the Health Risk Assessment of Chemical Mixtures. US Environmental Protection Agency: Washington, DC, USA, 1986.
  35. EPA/540/1-89/002; Risk Assessment Guidance for Superfund. Human Health Evaluation Manual, (Part A). Office of Emergency and Remedial Response: Washington, DC, USA, 1989; Volume 1.
  36. OSWER9355.4–24; Supplemental Guidance for Developing Soil Screening Levels for Superfund Sites. Office of Solid Waste and Emergency Response: Washington, DC, USA, 2001.
  37. Sawut, R.; Kasim, N.; Balati, M.; Li, H.; Abdugheni, A.; Abdusalam, A.; Miradil, K. Pollution characteristics and health risk assessment of heavy metals in the vegetable bases of northwest China. Sci. Total Environ. 2018, 642, 864–878. [Google Scholar] [CrossRef]
  38. EPA/600/P-95/002F a–c; Exposure Factors Handbook. US Environmental Protection Agency: Washington, DC, USA, 1997.
  39. USEPA (United States Environmental Protection Agency). Exposure Factors Handbook 2011, final ed.; Office of Emergency and Remedial Response, US Environmental Protection Agency: Washington, DC, USA, 2011.
  40. Wang, M.S.; Han, Q.; Gui, C.L.; Cao, J.L.; Liu, Y.P.; He, X.D.; He, Y.C. Differences in the risk assessment of soil heavy metals between newly built and original parks in Jiaozuo, Henan Province, China. Sci. Total Environ. 2019, 676, 1–10. [Google Scholar] [CrossRef] [PubMed]
  41. Tao, X.Q.; Shen, D.S.; Shentu, J.L.; Long, Y.Y.; Feng, Y.J.; Shen, C.S. Bioaccessibility and health risk of heavy metals in ash from the incineration of different e-waste residues. Environ. Sci. Pollut. Res. Int. 2015, 22, 3558–3569. [Google Scholar] [CrossRef] [PubMed]
  42. Li, Z.J.; Yang, Q.C.; Yang, Y.S.; Xie, C.; Ma, H.Y.; Ma, H. Hydrogeochemical controls on arsenic contamination potential and health threat in an intensive agricultural area, northern China. Environ. Pollut. 2020, 256, 2078–2087. [Google Scholar] [CrossRef] [PubMed]
  43. Tepanosyan, G.; Sahakyan, L.; Belyaeva, O.; Maghakyan, N.; Saghatelyan, A. Human health risk assessment and riskiest heavy metal origin identification in urban soils of Yerevan, Armenia. Chemosphere 2017, 184, 1230. [Google Scholar] [CrossRef]
  44. Zeng, F.F.; Wei, W.; Li, M.S.; Huang, R.X.; Yang, F. Heavy metal contamination in rice-producing soils of Hunan Province, China and potential health risks. Int. J. Environ. Res. Public Health 2015, 12, 15584–15593. [Google Scholar] [CrossRef]
Figure 1. Sketch map of the study area.
Forests 13 01914 g001
Figure 2. Spatial distributions of soil heavy metals.
Forests 13 01914 g002aForests 13 01914 g002bForests 13 01914 g002c
Figure 3. Correlation coefficients of the heavy metals in the soil. Note (** Significant correlation at 0.05 level).
Forests 13 01914 g003
Figure 4. Box-plots of geo-accumulation index (Igeo) of soil heavy metals: boxes depict 25th, 50th (median), and 75th percentiles and whiskers minimum and maximum values. Mean values (O); outliers (*).
Forests 13 01914 g004
Figure 5. Box-plots of pollution index (PI) of soil heavy metals: boxes depict 25th, 50th (median), and 75th percentiles and whiskers minimum and maximum values. Mean values (O); outliers (*).
Forests 13 01914 g005
Table 1. The exposure parameters for the ADI estimation.
ParameterAbbreviationValue
Conversion factorCF1×10−6 kg mg−1
Ingestion ratelngRAdult: 100 m3 d−1; child: 200 m3 d−1
Inhalation ratelnhRAdult: 15 m3 d−1; child: 7.5 m3 d−1
Exposure frequencyEFAdult: 365 da−1; child: 365 da−1
Exposure durationEDAdult: 24; child: 6
Body weightBWAdult: 53.1 kg; child: 15 kg
Average timeATAdult: 24 × 365 d; child: 6 × 365 d
Soil-adherence factorSL0.2 mg (cm2 d)−1
Exposed skin areaSAAdult: 4350 cm2; child: 1600 cm2
Dermal absorption fractionABSd0.001
Table 2. Reference doses for non-carcinogenic metals and slope factors for carcinogenic metals.
ElementsRfD (mg·(kg·d)−1)SF ((kg·d)·mg−1)
IngestionInhalationDermalIngestionInhalationDermal
Zn3.0 × 10−13.0 × 10−10.060
Cu0.4 × 10−10.0400.012
Cr3.0 × 10−32.86 × 10−56.0 × 10−542.0
Pb3.5 × 10−33.52 × 10−35.25 × 10−4
Hg3.0 × 10−43.0 × 10−42.40 × 10−5
As3.0 × 10−41.23 × 10−43.0 × 10−41.54.3 × 10−31.5
Table 3. Descriptive statistics of the heavy metals in soil.
ElementsRangeMedianAverageStandardCoefficientKurtosisSkewnessRegionalNational Standard
(mg kg−1)(mg kg−1)(mg kg−1)Deviationof Variation Value(mg kg−1)
(mg kg−1)(%)(mg kg−1)
Zn20.63–132.0655.31 55.34 12.20 22 12.70 1.62 68.874.2
Cu6.38–119.1926.06 27.16 9.84 36 44.66 4.98 26.722.6
Cr9.06–71.2536.38 37.31 10.53 28 0.85 0.30 49.361
Pb36.25–129.3875.63 79.60 19.45 24 0.07 0.68 19.426
Hg0.01–0.060.03 0.03 0.01 28 1.25 0.29 0.0170.065
As6.19–209.6392.6389.3823.19264.230.2511.2011.20
Table 4. Distribution frequency of the potential ( E r i ) of each heavy metal in soil.
Heavy MetalMinimumMaximumMeanStandard DeviationLow RiskModerate Risk Considerable RiskHigh RiskVery High Risk
Zn1.49 9.97 4.02 0.89 171
Cu1.20 22.31 5.08 1.84 171
Cr0.37 2.89 1.51 0.43 171
Pb9.34 33.34 20.51 5.01 171
Hg13.87 126.13 64.67 17.15 1312929
As5.52 187.17 79.80 20.70 137088
Table 5. Statistical analysis of the PRI values of the six heavy metals in the soil.
Potential Ecological Risk LevelPRI < 150150 ≤ PRI < 300300 ≤ PRI < 600PRI ≥ 600
LevelLow riskModerate riskConsiderable riskVery high risk
Frequency331371
Percentage19.380.10.6
Table 6. The non-carcinogenic risk index values of the heavy metals in soil.
ElementsHQ IngestHQ InhaleHQ DermalHI
AdultsChildrenAdultsChildrenAdultsChildrenAdultsChildren
Zn3.10 × 10−46.20 × 10−43.42 × 10−81.71 × 10−81.35 × 10−54.96 × 10−63.23 × 10−46.25 × 10⁻⁴
Cu1.15 × 10−32.31 × 10−31.27 × 10−76.36 × 10−83.35 × 10−51.23 × 10−51.19 × 10−32.32 × 10⁻³
Cr2.08 × 10−24.17 × 10−22.41 × 10−41.21 × 10−41.81 × 10−46.67 × 10−52.13 × 10−24.19 × 10⁻²
Pb3.80 × 10−27.61 × 10−24.17 × 10−62.09 × 10−62.21 × 10−38.12 × 10−44.03 × 10−27.69 × 10⁻²
Hg1.81 × 10−43.61 × 10−41.99 × 10−89.96 × 10−91.96 × 10−57.23 × 10−62.00 × 10−43.68 × 10⁻⁴
As0.5.0 × 10−11.001.35 × 10−46.73 × 10−54.35 × 10−31.60 × 10−35.05 × 10−11.01
Table 7. The carcinogenic risk index values of heavy metals in soils in the study area.
ElementsCRingestCRinhaleCRdermalCRTCR
AdultsChildrenAdultsChildrenAdultsChildrenAdultsChildren
As7.72 × 10−53.86 × 10−52.13 × 10−91.06 × 10−91.93 × 10−91.77 × 10−107.72 × 10−53.86 × 10−59.85 × 10⁻⁴
Cr9.08 × 10−44.51 × 10−49.08 × 10−44.51 × 10−44.89 × 10−4
Publisher’s Note: MDPI stays neutral with regard to jurisdictional claims in published maps and institutional affiliations.

