Article

Crack Detection Method for Engineered Bamboo Based on Super-Resolution Reconstruction and Generative Adversarial Network

Jiangsu Co-Innovation Center of Efficient Processing and Utilization of Forest Resources, College of Mechanical and Electronic Engineering, Nanjing Forestry University, Nanjing 210037, China
*
Author to whom correspondence should be addressed.
Forests 2022, 13(11), 1896; https://doi.org/10.3390/f13111896
Submission received: 21 October 2022 / Revised: 8 November 2022 / Accepted: 10 November 2022 / Published: 11 November 2022
(This article belongs to the Special Issue Wood Conversion, Engineered Wood Products and Performance Testing)

Abstract

:
Engineering bamboo is a type of cheap and good-quality, easy-to-process material, which is widely used in construction engineering, bridge engineering, water conservancy engineering and other fields; however, crack defects lead to reduced reliability of the engineered bamboo. Accurate identification of the crack tip position and crack propagation length can improve the reliability of the engineered bamboo. Digital image correlation technology and high-quality images have been used to measure the crack tip damage zone of engineered bamboo, but the improvement of image quality with more-advanced optical equipment is limited. In this paper, we studied an application based on deep learning providing a super-resolution reconstruction method in the field of engineered bamboo DIC technology. The attention-dense residual and generative adversarial network (ADRAGAN) model was trained using a comprehensive loss function, where network interpolation was used to balance the network parameters to suppress artifacts. Compared with the super resolution generative adversarial network (SRGAN),super resolution ResNet (SRResNet), and bicubic B-spline interpolation, the superiority of the ADRAGAN network in super-resolution reconstruction of engineered bamboo speckle images was verified through assessment of both objective evaluation indices (PSNR and SSIM) and a subjective evaluation index (MOS). Finally, the images generated by each algorithm were imported into the DIC analysis software, and the crack propagation length was calculated and compared. The obtained results indicate that the proposed ADRAGAN method can reconstruct engineered bamboo speckle images with high quality, obtaining a crack detection accuracy of 99.65%.

1. Introduction

Engineered bamboo is a new type of renewable engineering structural material with certain strength, stiffness, and durability, which has been widely used for large electromechanical packaging, as a building load-bearing material, and in other fields [1]. Engineered bamboo is made of bamboo bundles or bamboo sheets. Due to the natural porous structure of bamboo and the inevitable bonding defects of engineered bamboo, the engineered bamboo structure may have visible cracks. Therefore, a reasonable assessment of the visible crack scale, crack development law, and tolerance of the structure needs to be conducted through fracture analysis [2]. Fracture failure caused by crack propagation is the main failure mode of engineered bamboo. Initial crack propagation will cause the structure to fail below the yield stress of the material, making the bearing capacity, stiffness, and even the service life of the structure significantly lower than expected [3,4,5,6,7]. Therefore, accurate identification of the crack tip position and crack propagation length can improve the reliability of engineered bamboo. This is the theoretical basis for establishing the strength theory, failure criteria, and durability and safety evaluations of engineered bamboo structures.
Digital image correlation technology is a non-contact modern optical measurement technology that has been gradually applied to the fracture analysis of engineered bamboo. By tracking speckle images of the object surface, measurement of crack propagation displacement during deformation can be realized [8,9,10]. In the study of material fracture mechanisms, as the cracks in engineered bamboo are relatively small, it is necessary to use a high-performance camera to capture high-quality digital speckle images of the crack surface of the measured engineered bamboo before and after deformation, in order to obtain the displacement of each point on the surface of the measured object. In a low-quality digital speckle image, the cracks are blurred or may not be visible at all, making it difficult to accurately identify the crack tip position. Therefore, improving the quality of images has become a serious problem under limited hardware conditions.
Super-resolution reconstruction technology breaks these limitations, allowing for the reconstruction of low-resolution images into high-resolution images through algorithms, in order to obtain images containing more information. Traditional image super-resolution reconstruction methods mainly include interpolation-based super-resolution algorithms, such as bicubic interpolation and nearest neighbor interpolation; super-resolution algorithms based on degradation models, such as iterative back-projection and maximum a posteriori probability methods; and learning-based super-resolution algorithms, such as manifold learning and sparse coding methods [11]. With the rapid development of deep learning theory and technology, deep learning has been introduced into the field of super-resolution reconstruction, achieving rapid development [12,13,14]. Sun, N [15] proposed an image super-resolution reconstruction method combining traditional algorithms with deep learning and applied it to the medical field. The algorithm is ideal for detail reconstruction, producing clear contours and high-quality images. Yang, TT [16] applied a super-resolution convolutional neural network (SRCNN) to underwater image processing. The results indicated that the SRCNN method is superior to traditional super-resolution image reconstruction methods in improving the resolution of underwater images. Das, V [17] conducted unsupervised super-resolution of OCT images based on generative adversarial networks to improve the diagnosis of age-related macular degeneration. Experimental results on clinical OCT images demonstrated that this method is superior to existing methods in terms of SR performance and calculation time. Super-resolution reconstruction techniques have also been used for crack detection. Tang, YL [18] used a super-resolution convolutional neural network (SRCNN) to obtain high-resolution images and corresponding temperature and deformation fields, proving that SRCNN has potential value in detecting surface defects or cracks. Xiang, C [19] proposed a micro-crack automatic detection method based on super-resolution reconstruction and semantic segmentation, in order to detect cracks in civil infrastructure. The results indicated that the method can achieve good results in detecting concrete cracks. However, in addition to our team, few people have studied the use of deep learning models for super-resolution reconstruction in the field of engineering bamboo speckle image DIC.
Based on super-resolution reconstruction technology and deep learning, this paper focuses on engineered bamboo speckle images, in order to identify the cracks in engineered bamboo. For this purpose, an attention-dense residual and generative adversarial network (ADRAGAN) model based on an attention-intensive residual structure and the relative mean value is proposed, which is trained using a comprehensive loss function, while network interpolation is used to balance the network parameters to suppress artifacts. The model provides a more reasonable structure for crack identification from engineered bamboo speckle images, effectively improving the engineered bamboo crack identification accuracy, providing effective support for fracture analysis of engineered bamboo, an effective means for calculation of the reliability of the fracture strain energy, and a theoretical basis for the reasonable design of mechanical and electrical packaging and building structures using engineered bamboo, ensuring the safety of the designed structure.

2. Materials and Methods
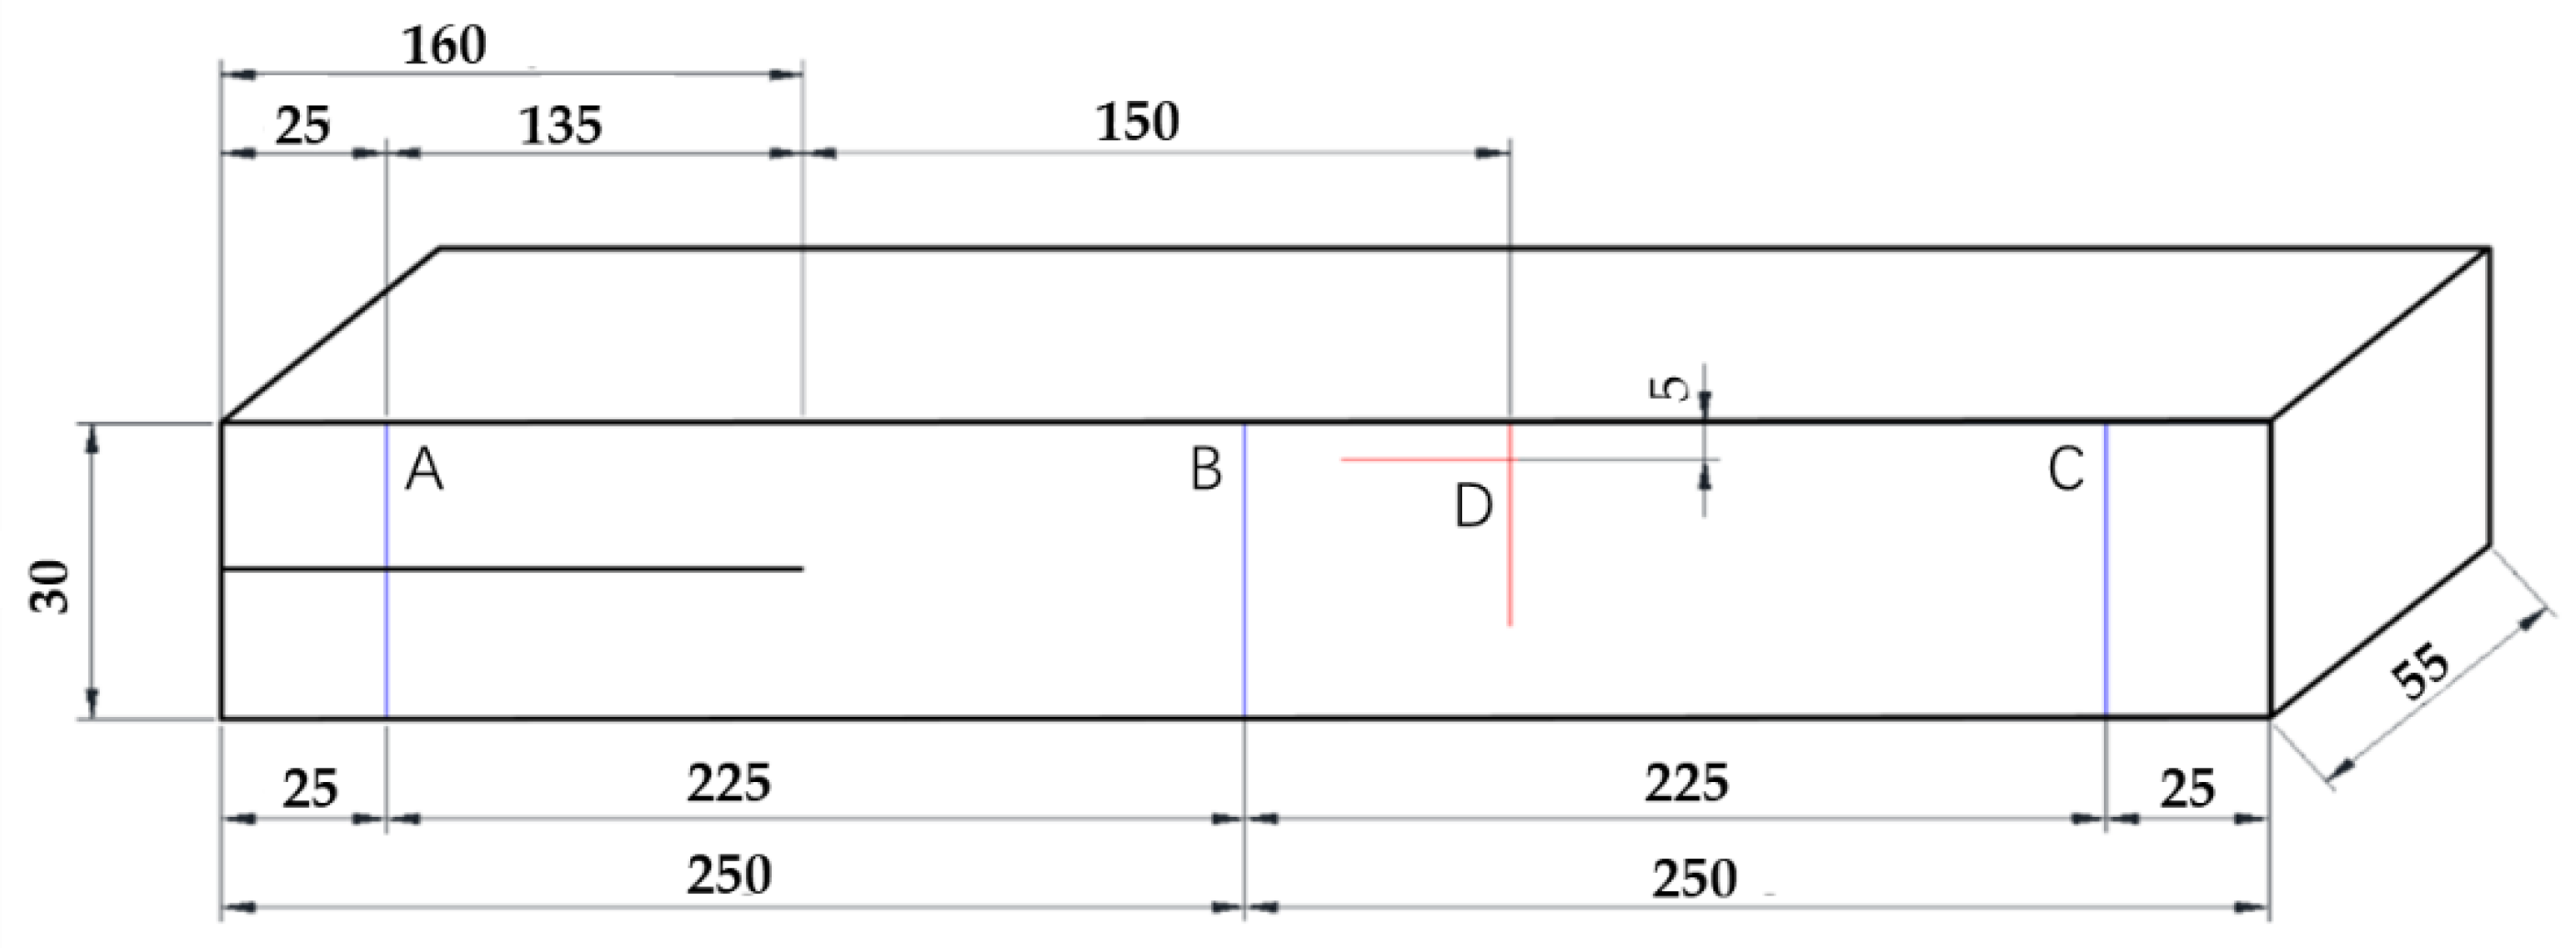
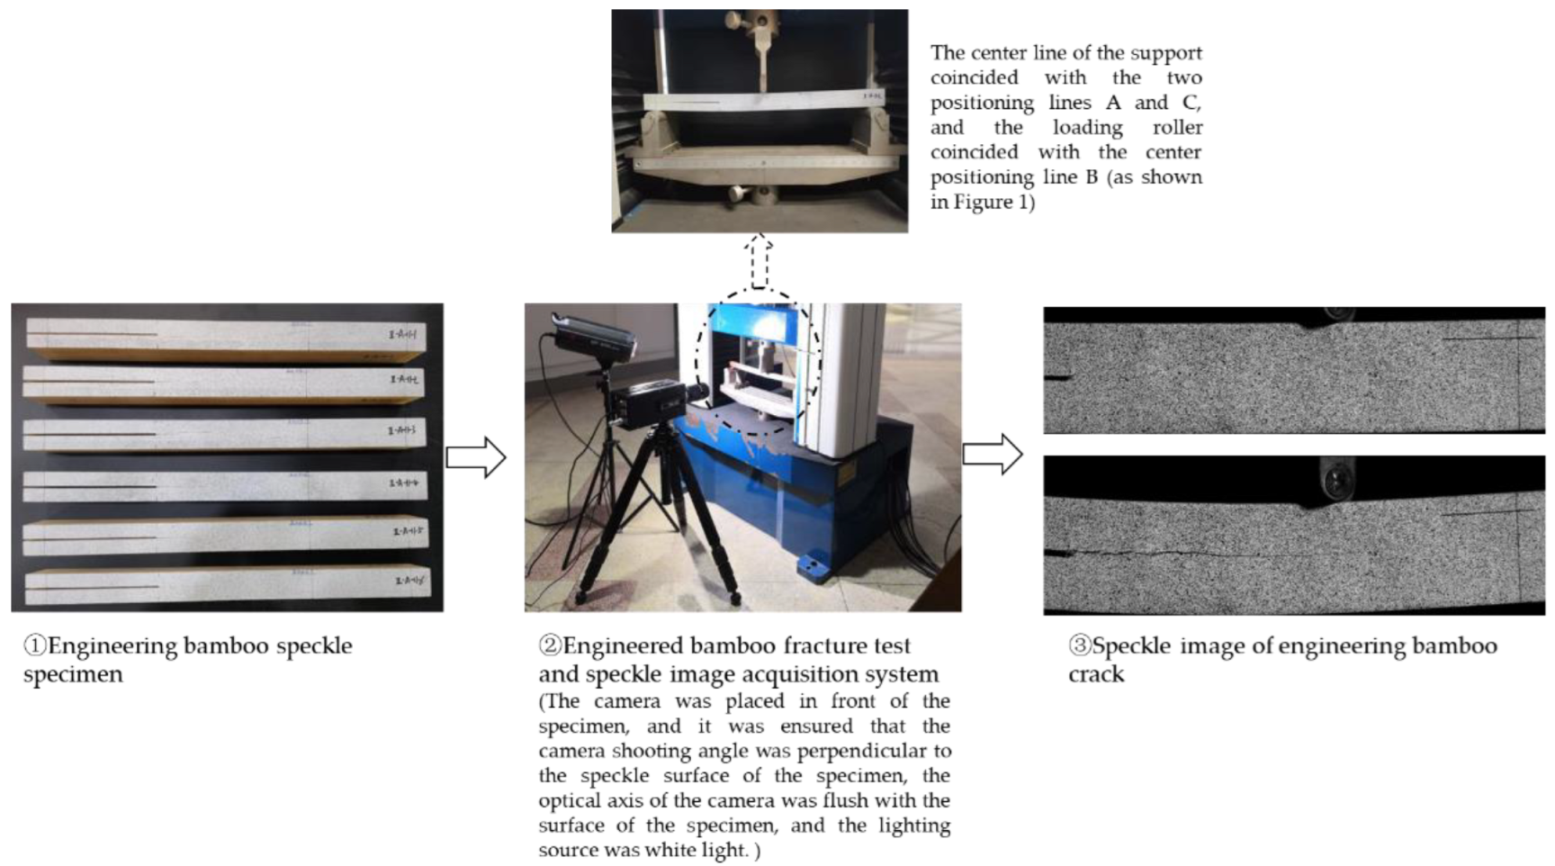
2.1. Imaging

In this experiment, 4-year-old bamboo with a diameter of about 0.3 m and a height of about 1.7 m from the ground was selected as the raw material. The engineering bamboo specimens were processed by a standard hot pressing process, and the specimens with obvious cracks, bubbling, depressions and other defects on the surface were eliminated. The moisture content of the obtained specimens was 10% [20]. The specific parameters of the specimens, whose pre-fabricated crack length was 160 mm, are detailed in Figure 1.
The engineered bamboo speckle image acquisition equipment included a DDL-100 kN universal testing machine, a 5F08 Wolf® Revealer high-speed camera, and an image acquisition (a high-speed camera, a light source, an image acquisition card, and a computer) and parameter control system, as shown in Figure 2 (②). Table 1 provides the types and performance parameters of the experimental equipment and the experimental parameters.

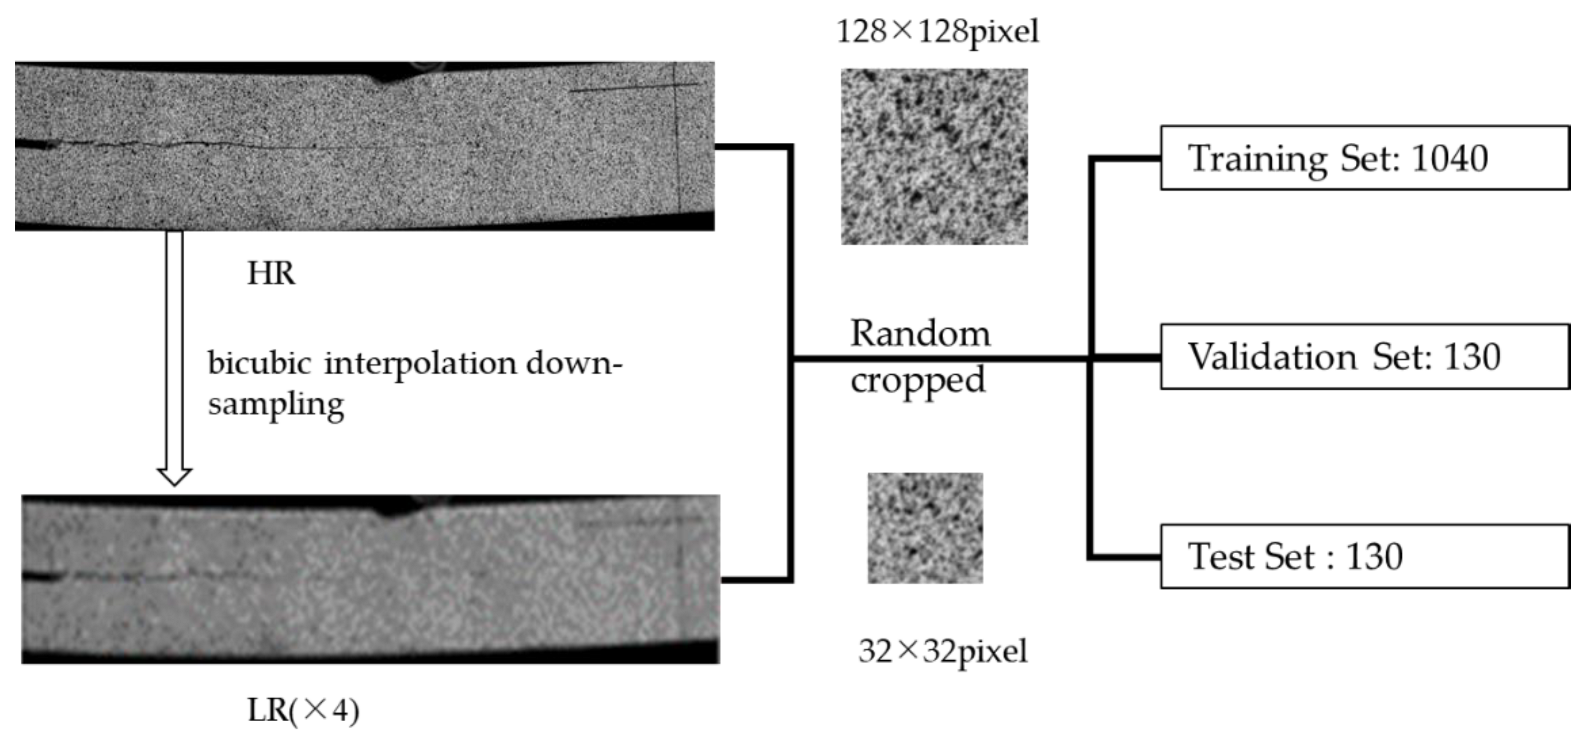
2.2. Image Pre-Processing

Through the above experimental platform and image acquisition process (shown in Figure 2), a total of 1300 images with size of 4032 × 1348 pixels were obtained. In order to avoid using unnecessary resources and achieve faster processing speed, the original images were pre-processed, the black area was removed, and the image was cut to obtain 128 × 128 pixel image blocks. The creation and allocation of the dataset are shown in Figure 3.

2.3. Super-Resolution Reconstruction Method for Engineered Bamboo Speckle Images Based on Generative Adversarial Network Model

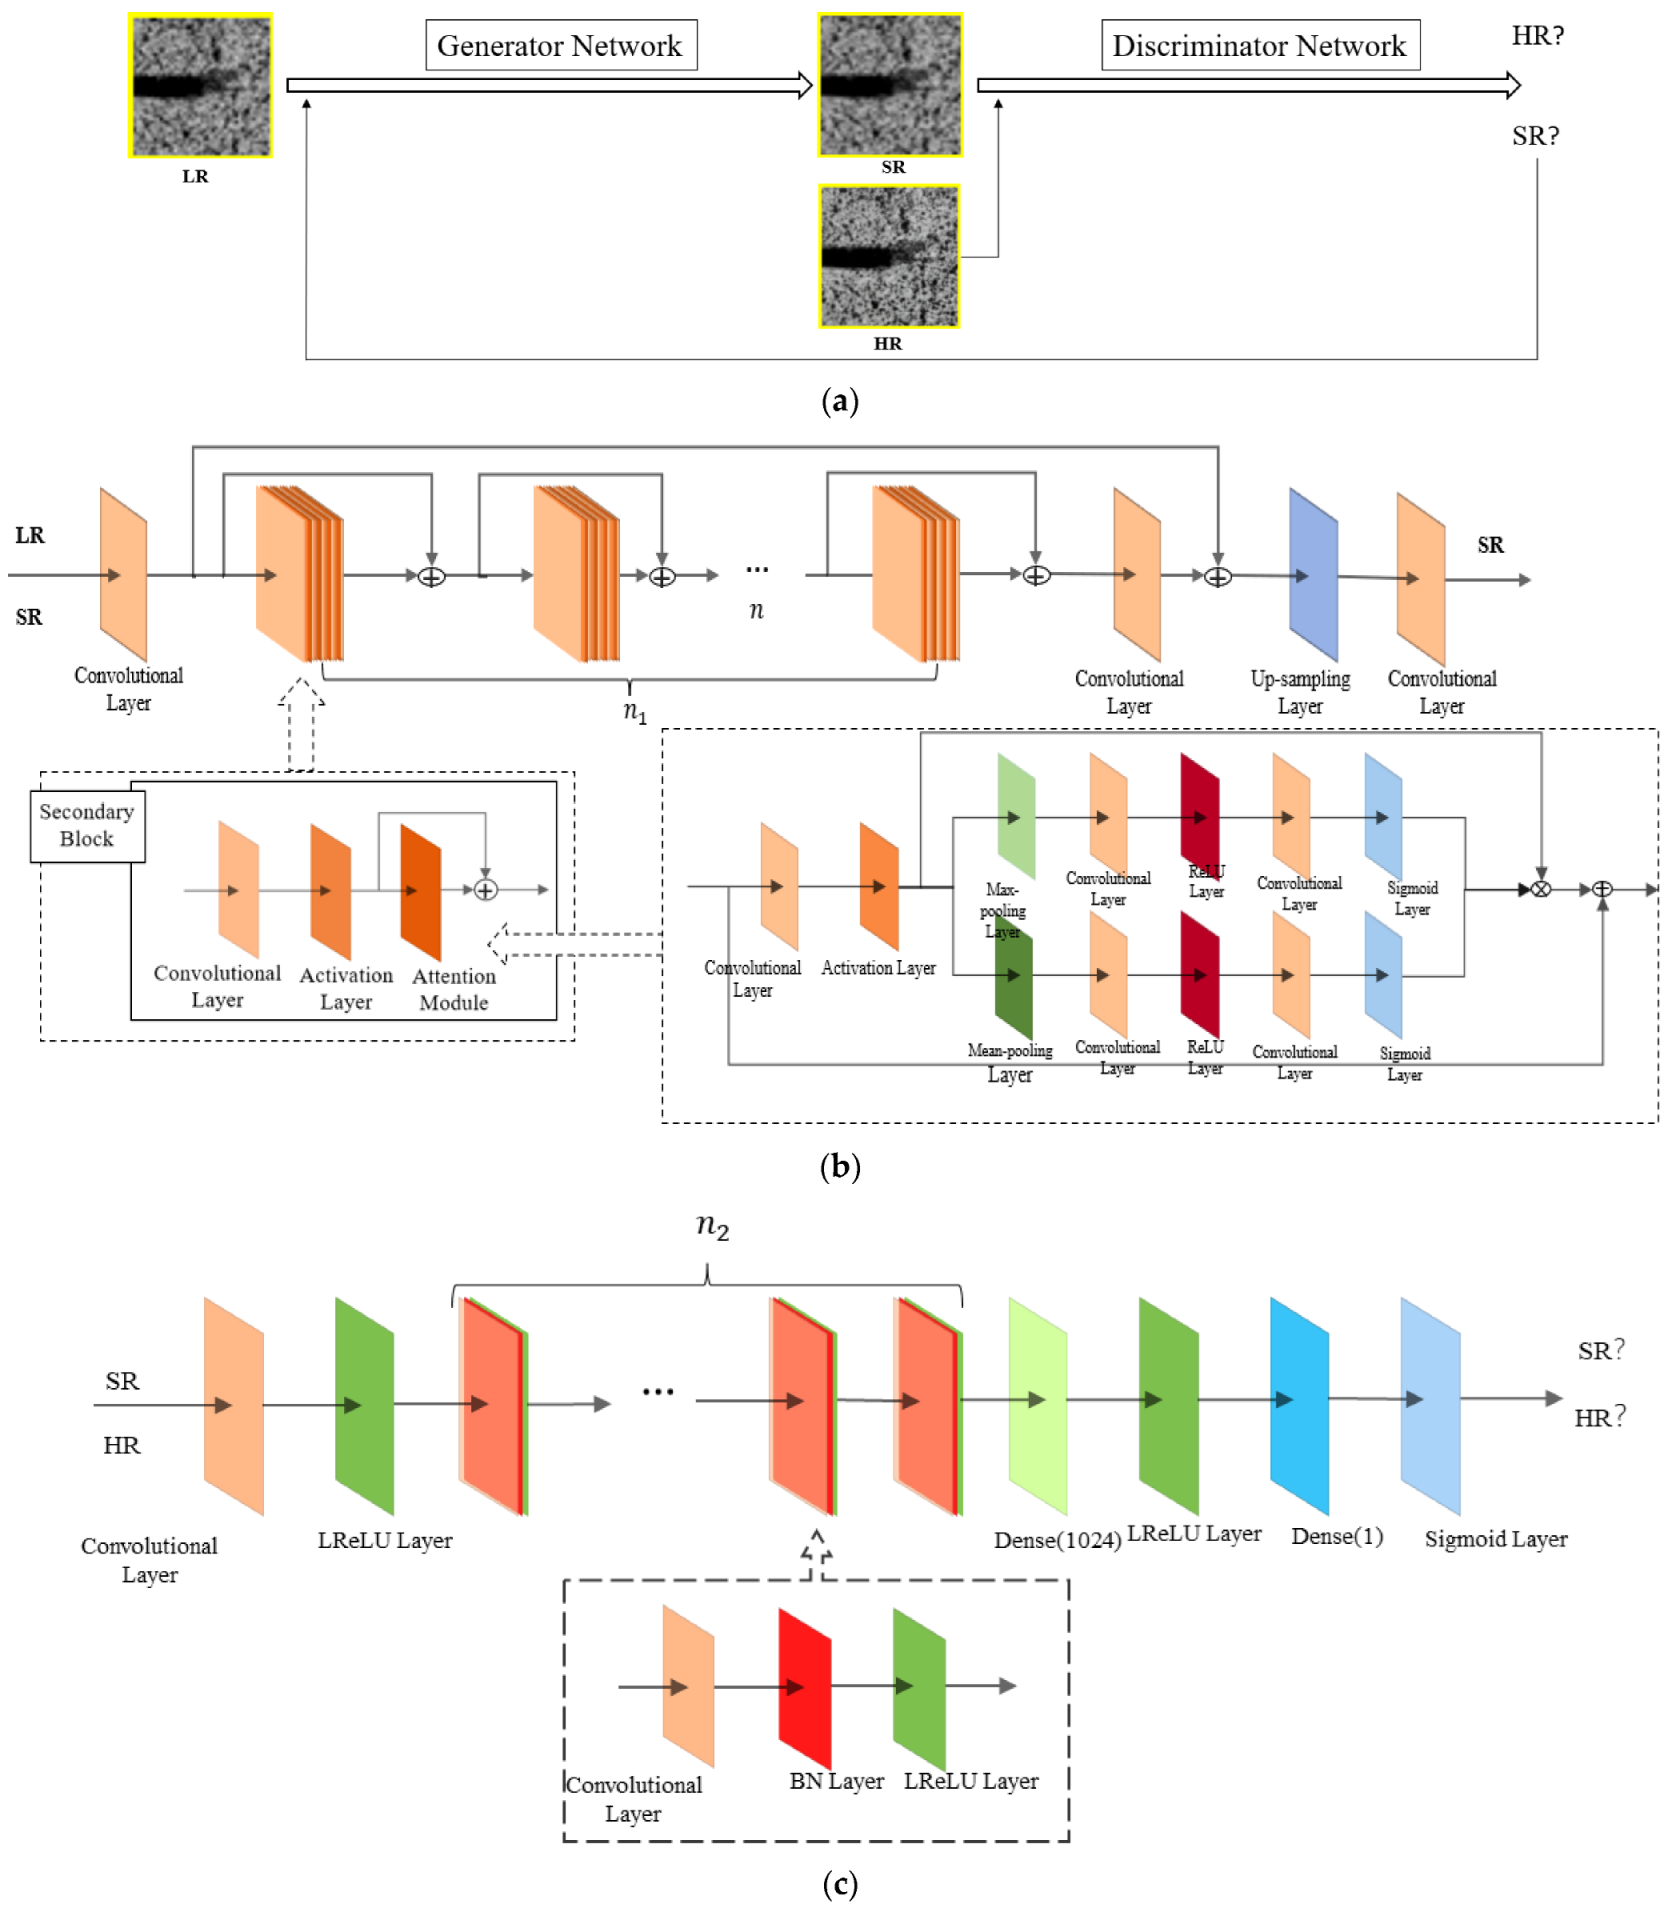
2.3.1. ADRAGAN Network Structure

A generative adversarial network is a combination of two networks: the generative network is responsible for generating simulated data, while the discriminant network is responsible for judging whether the input data are real or generated. The generative network aims to continuously optimize its own data generated, so that the discriminant network cannot judge that it is generated, while the discriminant network optimizes its own judgment, in order to increase its accuracy. Super-resolution algorithms based on generative adversarial networks comprise pioneering work, introducing the idea of generative adversarial networks into the field of super-resolution. SRResNet is a generative network that has been used to generate high-resolution images from low-resolution images, while Densenet is typically used as a discriminant network, in SRGAN architecture. The high-resolution images and the output images of the generative network are input into the discriminant network of the classification structure for (true/false) discrimination, in order to achieve the purpose of reconstructing high-quality images, such that the restored image edges are sharp and the texture details are clear. However, the reconstructed image will occasionally include artifacts, violating the requirements of training stability and consistency, and there is still a clear gap between the image reconstructed by the SRGAN model and real images, meaning that it cannot fully meet the authenticity requirements of engineered bamboo speckle images.
In order to further improve the quality of the restored image, we improved upon the SRGAN model. For the generative network, an improved attention-intensive residual block is used as the basic construction unit, and residual scaling and smaller initialization are used to reduce the difficulties associated with training. Based on the idea of the relativistic standard GAN [21], the discriminator estimates the probability that the real image is more realistic than the high-resolution image after super-resolution reconstruction, replacing the classical discriminator that estimates whether an image is a real image. The proposed super-resolution model for engineered bamboo speckle images based on the attention-dense residual and generative adversarial network (ADRAGAN) is depicted in Figure 4.
As shown in Figure 4a, the generator takes a low-resolution speckle image as input and outputs a super-resolution reconstructed image (SR), following which the original high-resolution image (HR) and SR are input into the discriminator for (true/false) discrimination. If the discriminant network identifies the image as an SR, it is returned to the generator, which then performs image super-resolution reconstruction using the interpolation balance network parameters. The loop between the generative network and discrimination network continues until an unrecognized high-quality super-resolution image is reconstructed.
Figure 4b shows the architecture of the generator of the ADRAGAN network, which contains n1 (n1 = 16) secondary blocks, each consisting of a convolutional layer, an activation layer, and an attention module. In particular, the attention module is a hybrid domain attention module. The hybrid domain attention mechanism utilizes the advantages of both channel domain and spatial domain attention mechanisms; that is, the signal of each channel is weighted to increase the correlation between channel information and key information [22,23]. The same spatial transformation is used for all channels, ignoring the inconsistency of the importance of different channel information for the current task [24]. Therefore, the weight distribution of the global information in the feature map is utilized to improve the resolution of the engineered bamboo speckle images and the recognition of detail information. The network structure proposed in this study did not contain a BN layer. In this way, the color, contrast, texture and other information of the image can be better expressed while saving the network space, which greatly improved the training speed, stability and image expression of the model.
As shown in Figure 4c, the discriminator network of the ADRAGAN contains n2 (n2 = 7) convolution blocks, each of which consists of a 3 × 3 convolution layer, a BN layer, and a leaky ReLU activation layer, as well as a 3 × 3 convolution layer and a leaky ReLU activation layer at the front end of the network. Therefore, the whole discriminator contains eight convolution layers.

2.3.2. Relative Mean Discriminator and Loss Function

In order to make the discriminator more global, we improved the discrimination network by using a discriminator DRa based on the relative mean, as shown in Equations (1) and (2) [25,26]:
D R a ( x r , x f ) = σ ( C ( x r ) E x f [ ( x f ) ] ) ,
D R a ( x f , x r ) = σ ( C ( x f ) E x r [ ( x r ) ] ) .
In the relative mean discriminator, the loss functions for the discriminator and generator are given in Equations (3) and (4), respectively [27]:
L D R a = E x r [ log ( D R a ( x r , x f ) ) ] E x f [ log ( 1 D R a ( x f , x r ) ) ] ,
L G R a = E x r [ log ( 1 D R a ( x r , x f ) ) ] E x f [ log ( D R a ( x f , x r ) ) ] .
The mean value is obtained by averaging all of the data in a mini-batch, xf = G(xi), where xirepresents an input low-resolution image.
From Equation (4), it can be seen that the corresponding generator loss function contains xr and xf, such that the generator can obtain guidance information from the gradient of the generated data and the real data during training. Compared with SRGAN, where the mechanism can only judge according to the gradient of the generated data, this constitutes obvious progress. This adjustment to the discriminator can allow the network-generated images to have clearer edges and richer details.
However, the guidance of a single loss function is not conducive to restoring the high-frequency detail information of the image [28], as the restored image may be too smooth and the visual effect is still blurred. Therefore, scholars have proposed many different loss functions, such as perceptual loss, content loss, and confrontation loss, among others, hoping to solve this problem. The loss function used by the discriminator in this article is shown in Equation (3), while the loss function used by the generator is a comprehensive loss function that combines perceptual loss, content loss, and adversarial loss, as shown in Equation (5) [29]:
L G = L p e r c e p + λ L G R a + η L 1 ,
where λ and η are the balance coefficients between the different loss functions.
L 1 is the content loss function between pixels—that is, the mean absolute error (MAE)—as shown in Equation (6) [30,31,32]:
L 1 = L M A E S R = 1 r 2 W H x = 1 r W y = 1 r H I x , y H R I x , y S R ,
where   I H R and   I S R represent the original high-resolution image and the high-resolution image after super-resolution reconstruction, respectively, and W and H are the width and height of the image, respectively.
Lpercep is the perceptual loss, which is the Euclidean distance between the features of the reconstructed image and the real image. It is based on the definition of the VGG19 network [33,34]. As shown in Equation (7), there are two shortcomings to the conventional method: (1) The features after activation are very sparse, especially in a deep network; these sparse features provide a weak supervision effect, reducing the performance of the network; and (2) compared with the real image, the activated features make the brightness of the reconstructed image inconsistent with the real image.
L p e r c e p = L V G G S R = 1 W i , j H i , j Σ x = 1 W i , j Σ y = 1 H i , j ( ϕ i , j ( I H R ) x , y ϕ i , j ( I S R ) x , y ) 2
where Wi,j and Hi,j are the width and height of the corresponding feature map in the VGG network, respectively, and ϕi,j is the feature map obtained after the jth convolution before the ith maximum pooling layer in the VGG19 network. In order to overcome these two shortcomings, in contrast to conventional methods, we use the features before the activation layer.

2.3.3. Network Interpolation
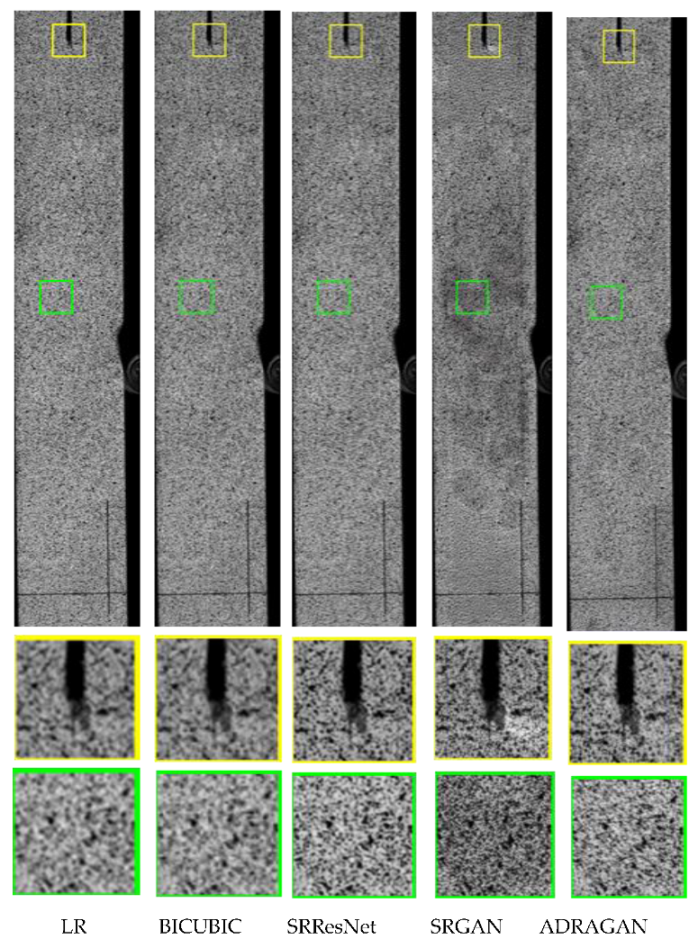
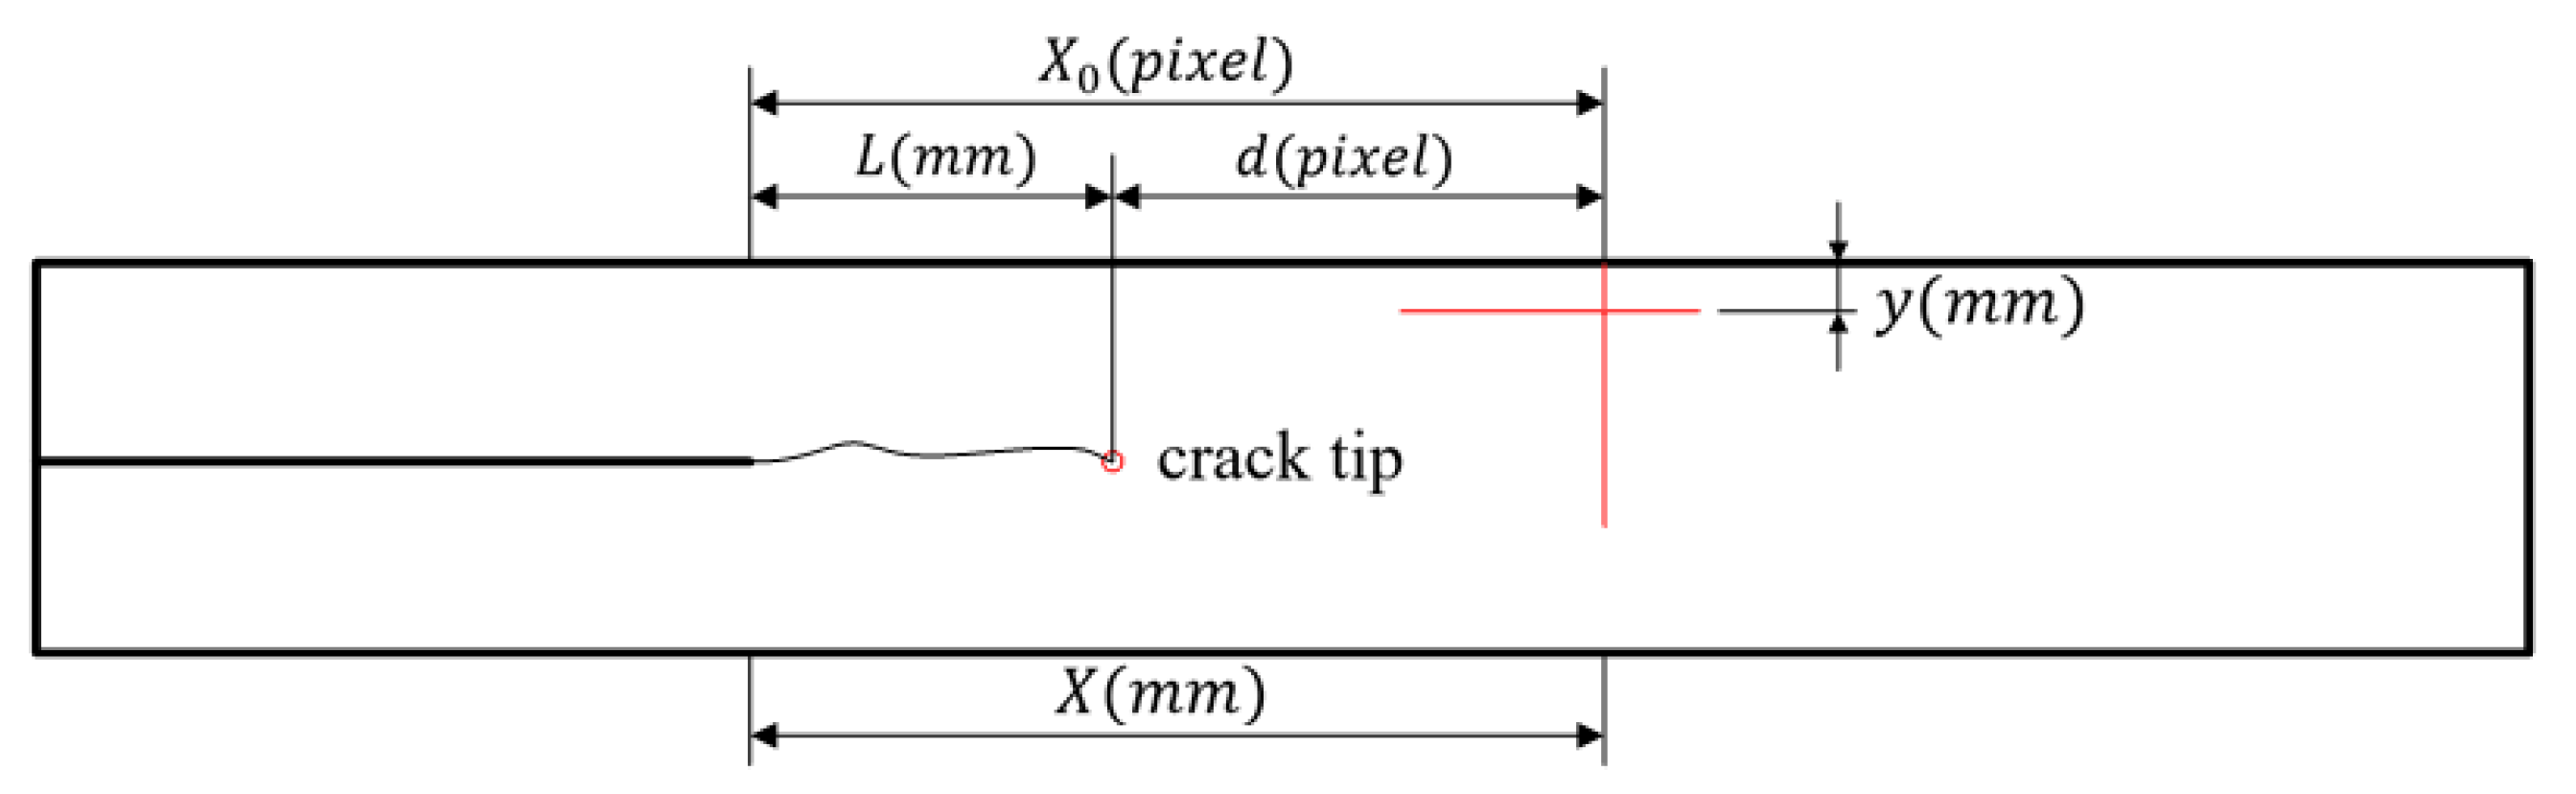
The use of a method based solely on a generative adversarial network can lead to output images with sharp edges and rich textures, which may cause artifacts, while the image output by methods based solely on PSNR indicators are typically too blurry. In order to remove artifacts while maintaining good visual perception quality of the image, we used network interpolation to balance various evaluation indicators. The low-resolution image is generated by the model parameters generated by the reconstruction image of the generation network GSPN R, with PSNR as the index, and the low-resolution image is generated using the model parameters generated by the entire adversarial network GSPAN. The corresponding parameters obtained by these two networks are interpolated to obtain the GSPN R interpolation network, according to Equation (8) [31,35]:
θ G I N T E R P = ( 1 α ) θ G P S N R + α θ G G A N ,
where θ G I N T E R P , θ G P S N R , and θ G G A N are the parameters of G I N T E R P , G P S N R , and G G A N , respectively, and α is the interpolation parameter ( α [ 0 , 1 ] ).

3. Results

This study was performed using the same hardware platform and software environment. The hardware platform configuration is detailed in Table 2. The software environment settings are shown in Table 3. In addition, this study used CUDA10.1 and CuDNN7604 to accelerate model training. The network parameters of each algorithm are shown in Table 4. The residual scaling coefficient was set to 0.2 before the residual was added to the main path.
Comparing the improved algorithm with other algorithms, the number of test set images was 130 under the condition of ×4 scaling. We used the objective indices of peak signal to noise ratio (PSNR) and structural similarity (SSIM) and the subjective index mean opinion score (MOS) to compare the improved algorithm with other algorithms [36]. PSNR is a full reference image quality evaluation index, providing an objective standard to measure the image distortion or noise level. The greater the PSNR value between two images, the more similar they are. SSIM is based on the similarity between two given images from the three aspects of brightness, contrast, and structure as a measure, where the mean value is used in the brightness evaluation, the standard deviation is used in the contrast evaluation, and the covariance is used in the structural similarity evaluation. The SSIM is provided as a value between 0 and 1. The larger the SSIM, the smaller the difference between the two images in these three aspects. The subjective index MOS involves consulting with professionals who study the engineered bamboo cracks and make a subjective qualitative evaluation of the image for the observer. Table 5 provides the PSNR, SSIM, and MOS values of the five algorithms on the engineered bamboo speckle image dataset.
It can be seen, from Table 5 that the ADRAGAN method used in this paper yielded higher index values in both objective and subjective indicators for super-resolution reconstruction on the engineered bamboo speckle image dataset. In particular, the SRResNet method was 4.02 dB higher than the traditional Bicubic B-spline interpolation method in the PSNR index, 0.212 higher than the traditional method in the SSIM index, and 1.29 higher than the traditional method in MOS value. Therefore, the super-resolution reconstruction method for engineered bamboo speckle images based on deep learning greatly improved the three indices, compared with the traditional method, indicating that the image super-resolution reconstruction effect based on deep learning provides a huge improvement. Compared with the SRResNet method, the PSNR index of the SRGAN method was increased by 3.4 dB, the SSIM index was increased by 0.018, and the MOS value was reduced by 0.08 points, indicating that the SRGAN method produced a slight improvement in the objective indices for the super-resolution reconstruction of engineered bamboo speckle images. In the image super-resolution task, it could form more abundant high-frequency information than the previous method; however, the SRGAN network model may produce artifacts, reducing the subjective evaluation value. In order to remove artifacts, we improved upon SRGAN in our method. Compared with the SRGAN method, the ADRAGAN method improved the PSNR index by 1.32 dB, the SSIM index by 0.024, and the MOS value by 0.11 points. Overall, the results for the ADRAGAN method were slightly better than those of the SRGAN method in the objective indices, while the subjective index value was greatly improved, indicating that the ADRAGAN method effectively removed artifacts and had an improved effect regarding the super-resolution reconstruction of engineered bamboo speckle images.
Figure 5 shows a comparison of the image reconstruction effects for each algorithm. It can be seen, from the figure, that under 4× scaling, the methods based on deep learning provided better images than the traditional method. The high-resolution image details and edge information reconstructed by the ADRAGAN and SRGAN networks were very rich. These results were not only better than the image quality when using the traditional method, but also better than the high-resolution image reconstructed using the SRResNet network. They provide output images with visual effect very close to that of the original high-resolution image, as can be seen in the figure. Therefore, the GAN network structure has certain advantages in restoring image visual effects. The SRGAN method performed relatively worse than the proposed method on the engineered bamboo speckle image dataset, often producing large-area artifacts. The ADRAGAN method, which uses network interpolation to balance the network parameters, avoided the problem of frequent artifacts, leading to good results and verifying the role of network interpolation. The ADRAGAN method also uses a comprehensive loss function to further improve the perceptual quality of the reconstructed image.

4. Discussion

The purpose of studying engineered bamboo speckle image super-resolution reconstruction methods is to capture the crack tip position of engineered bamboo more accurately, in order to obtain more accurate crack length data. The low-resolution images, original high-resolution images, and images generated by various algorithms of engineered bamboo were imported into DIC analysis software in batches. The pixel distance from the crack tip position to the vertical extensometer derived by the DIC analysis software was recorded as d pixels, while the actual distance from the pre-fabricated crack tip to the vertical extensometer was recorded as x , and the pixel distance from the prefabricated crack tip to the vertical extensometer measured by DIC analysis software was recorded as x 0 . The relevant calculation dimensions for crack propagation length are shown in Figure 6.
The actual distance, L , of the crack propagation length can be expressed as:
L = x d x x 0 .
When the crack had not yet appeared in the early stage of crack propagation, due to the existence of software analysis errors, the crack tip position identification was unstable at this time. After data comparison and analysis, crack tip identification in the DIC analysis software started from the 223rd image. At this point, it was stable, so the data of images 223–1300 were used for further analysis and comparison.
The DIC analysis software was used to derive the pixel distance d from the crack tip position of the original high-resolution image and the image generated by each algorithm to the vertical extensometer, and the actual distance L of the crack propagation length was calculated, respectively. The differences d and L between the parameters obtained from the images generated by each algorithm and the original high-resolution image parameters were calculated, and the above operations were performed on images 223–1300. The average pixel distance d e from the crack tip position of the image generated by each algorithm to the vertical extensometer, the average actual distance L e of the crack propagation length, the average difference d e between the pixel distance from the crack tip position to the vertical extensometer and that in the original high-resolution image, and the average difference L e between the crack propagation length and that in the original high-resolution image were calculated. Figure 7 depicts the comparison between images generated by the algorithms and the original high-resolution image. Table 6 provides comparison results for each algorithm.
As shown in Table 6, the average error between the actual crack propagation length in the low-resolution image, relative to the original high-resolution image, was −4.436 mm, while that for the bicubic B-spline interpolation method was 2.485 mm. Compared with the low-resolution image, although it was improved, the error was still large. The Δ L e of the SRResNet method was −1.179 mm, such that the restoration error was reduced by 52.6%, compared with the bicubic B-spline interpolation method. The value for the SRGAN method was −1.109 mm, and the error was reduced by 55.4%, compared with the bicubic B-spline interpolation method. The effect was more than doubled, indicating that methods based on deep learning have advantages over traditional methods. The reconstructed image output by the SRGAN method had an impact on the DIC calculation due to artifacts and, so, the calculation results were not obtained. However, the error value for the ADRAGAN method proposed in this paper was 0.205 mm, and the crack detection accuracy reached 99.65%. Compared with the traditional methods, the accuracy of the SRResNet and SRGAN methods was surpassed by the proposed method, indicating that the attention-intensive residual structure and the relative mean generative adversarial network model are very helpful for the restoration of the crack area in engineered bamboo speckle images, thus verifying the effectiveness of the improved algorithm proposed in this paper.
Overall, the proposed super-resolution reconstruction technology for engineered bamboo speckle image based on the generative adversarial network was used to obtain high-resolution images. These were directly imported into DIC analysis software to assess the crack detection accuracy, which was close to that of the image collected using high-performance equipment. Therefore, this paper demonstrates the potential of applying super-resolution reconstruction methods based on generative adversarial networks in the field of engineered bamboo DIC technology, which is of great value for improving measurement accuracy, reducing equipment requirements, and ensuring the safety of engineered bamboo structural parts.

5. Conclusions

In order to address the difficulty of determining the crack tip position and measuring the crack length in the process of measuring the crack propagation scale in engineered bamboo, a super-resolution reconstruction method for engineered bamboo speckle images based on the ADRAGAN network was proposed. ADRAGAN consists of a generative network of dense residual blocks with an attention mechanism, as well as a discriminant network using the reference relative mean. A comprehensive loss function was used for training, and network interpolation was utilized to balance the network parameters, thus suppressing artifacts. Then, the performance of various algorithms on a test set was evaluated using the evaluation indexes PSNR, SSIM and MOS. From the analysis of the objective and subjective evaluation indexes of image quality, the ADRAGAN method proposed in this study was 8.74 dB, 0.254, and 1.32 points higher than bicubic B-spline interpolation method; 4.72 dB, 0.042, and 0.03 points higher than SRResNet; and 1.32 dB, 0.024, and 0.11 points higher than SRGAN in PSNR, SSIM, and MOS, respectively. Therefore, the ADRAGAN method has obvious advantages over the other methods, in terms of speckle image super-resolution reconstruction. The images reconstructed by ADRAGAN have sharper edges and richer detail and are more realistic to the human eye. Finally, the super-resolution images generated by each algorithm were imported into DIC analysis software, and the crack propagation length was analyzed and compared. The crack error obtained by the ADRAGAN method was 0.205 mm. The results of this paper verify the superiority of the proposed algorithm and the application potential of image super-resolution reconstruction technology based on deep learning in the analysis of mechanical and fracture properties of engineered bamboo.

Author Contributions

Conceptualization, H.Z. and Y.L.; methodology, H.Z.; software, H.Z., Z.L., and Z.Z.; validation, Z.L., B.G. and X.W.; formal analysis, X.W. and Z.Z.; investigation, Y.L.; resources, Y.L.; data curation, H.Z.; writing—original draft preparation, H.Z.; writing—review and editing, Y.L.; visualization, H.Z.; supervision, Z.L.; project administration, Y.L.; funding acquisition, Y.L. All authors have read and agreed to the published version of the manuscript.

Funding

This research was funded by the Postgraduate Research & Practice Innovation Program of Jiangsu Province under grant KYCX22_1050 and the 2019 Jiangsu Province Key Research and Development Plan by the Jiangsu Province Science and Technology under grant BE2019112. This research was also funded by the National Natural Science Foundation of China under Grant 61901221, in part by the Postgraduate Research and Practice Innovation Program of Jiangsu Province under Grant KYCX21_0872, and in part by the National Key Research and Development Program of China under Grant 2019YFD1100404.

Data Availability Statement

Not applicable.

Acknowledgments

The authors would like to extend their sincere gratitude for the technical support from the Jiangsu Co-Innovation Center of Efficient Processing and Utilization of Forest Resources.

Conflicts of Interest

The authors declare no conflict of interest.

References

  1. Liu, Y.; Huang, D.; Zhu, J. Experimental investigation of mixed-mode I/II fracture behavior of parallel strand bamboo. Constr. Build. Mater. 2021, 288, 123127. [Google Scholar] [CrossRef]
  2. Yan, Y.; Fei, B.; Liu, S. The relationship between moisture content and shrinkage strain in the process of bamboo air seasoning and cracking. Dry. Technol. 2020, 40, 571–580. [Google Scholar] [CrossRef]
  3. Song, J.; Surjadi, J.U.; Hu, D.; Lu, Y. Fatigue characterization of structural bamboo materials under flexural bending. Int. J. Fatigue 2017, 100, 126–135. [Google Scholar] [CrossRef]
  4. Wang, X.; Zhong, Y.; Luo, X.; Ren, H. Compressive Failure Mechanism of Structural Bamboo Scrimber. Polymers 2021, 13, 4223. [Google Scholar] [CrossRef] [PubMed]
  5. Li, W.; Zhu, D.; Shao, W.; Jiang, D. Modeling of Internal Geometric Variability and Statistical Property Prediction of Braided Composites. Materials 2022, 15, 5332. [Google Scholar] [CrossRef]
  6. Xu, Y.; Liu, J.; Wan, Z.; Zhang, D.; Jiang, D. Rotor Fault Diagnosis Using Domain-Adversarial Neural Network with Time-Frequency Analysis. Machines 2022, 10, 610. [Google Scholar] [CrossRef]
  7. Jiang, D.; Qian, H.; Xu, Y.; Zhang, D.; Zheng, J. Residual strength of C/SiC composite after low-velocity impact. Mater. Today Commun. 2022, 30, 103140. [Google Scholar] [CrossRef]
  8. Gauss, C.; Savastano, H., Jr.; Harries, K.A. Use of ISO 22157 mechanical test methods and the characterisation of Brazilian P. edulis bamboo. Constr. Build. Mater. 2019, 228, 116728. [Google Scholar] [CrossRef]
  9. Li, Z.; He, X.Z.; Cai, Z.M.; Wang, R.; Xiao, Y. Mechanical Properties of Engineered Bamboo Boards for Glubam Structures. J. Mater. Civ. Eng. 2021, 33, 04021058. [Google Scholar] [CrossRef]
  10. Yang, T.-C.; Yang, H.-Y. Strain analysis of Moso bamboo (Phyllostachys pubescens) subjected to longitudinal tensile force. Mater. Today Commun. 2021, 28, 102491. [Google Scholar] [CrossRef]
  11. Lu, Z.; Wu, C.; Chen, D.; Qi, Y.; Wei, C. Overview on Image Super Resolution Reconstruction. In Proceedings of the 26th Chinese Control and Decision Conference (2014 CCDC), Changsha, China, 31 May–2 June 2014; pp. 2009–2014. [Google Scholar]
  12. Yu, M.; Wang, H.; Liu, M.; Li, P. Overview of Research on Image Super-Resolution Reconstruction. In Proceedings of the IEEE International Conference on Information Communication and Software Engineering (ICICSE), Chengdu, China, 19–21 March 2021; pp. 131–135. [Google Scholar]
  13. Tang, H.; Zhu, H.; Tao, H.; Xie, C. An Improved Algorithm for Low-Light Image Enhancement Based on RetinexNet. Appl. Sci. 2022, 12, 7268. [Google Scholar] [CrossRef]
  14. Tao, H.; Xie, C.; Wang, J.; Xin, Z. CENet: A Channel-Enhanced Spatiotemporal Network With Sufficient Supervision Information for Recognizing Industrial Smoke Emissions. IEEE Internet Things J. 2022, 9, 18749–18759. [Google Scholar] [CrossRef]
  15. Sun, N.; Li, H. Super Resolution Reconstruction of Images Based on Interpolation and Full Convolutional Neural Network and Application in Medical Fields. IEEE Access 2019, 7, 186470–186479. [Google Scholar] [CrossRef]
  16. Yang, T.; Jia, S.; Ma, H. Research on the Application of Super Resolution Reconstruction Algorithm for Underwater Image. Comput. Mater. Contin. 2020, 62, 1249–1258. [Google Scholar] [CrossRef]
  17. Das, V.; Dandapat, S.; Bora, P.K. Unsupervised Super-Resolution of OCT Images Using Generative Adversarial Network for Improved Age-Related Macular Degeneration Diagnosis. IEEE Sens. J. 2020, 20, 8746–8756. [Google Scholar] [CrossRef]
  18. Tang, Y.; Zhang, J.; Yue, M.; Qu, Z.; Wang, X.; Gui, Y.; Feng, X. Deep learning-based super-resolution images for synchronous measurement of temperature and deformation at elevated temperature. Optik 2021, 226, 165764. [Google Scholar] [CrossRef]
  19. Xiang, C.; Wang, W.; Deng, L.; Shi, P.; Kong, X. Crack detection algorithm for concrete structures based on super-resolution reconstruction and segmentation network. Automat. Constr. 2022, 140, 104346. [Google Scholar] [CrossRef]
  20. Lin, C.-Y.; Miki, T.; Kume, T. Potential Factors Canceling Interannual Cycles of Shoot Production in a Moso Bamboo (Phyllostachys pubescens) Stand. Front. For. Glob. Chang. 2022, 5, 913426. [Google Scholar] [CrossRef]
  21. Xing, X.; Zhang, D. Image-to-Image Translation using a Relativistic Generative Adversarial Network. In Proceedings of the 11th International Conference on Digital Image Processing (ICDIP 2019), Guangzhou, China, 10–13 May 2019. [Google Scholar]
  22. Zhu, H.; Tang, H.; Hu, Y.; Tao, H.; Xie, C. Lightweight Single Image Super-Resolution with Selective Channel Processing Network. Sensors 2022, 22, 5586. [Google Scholar] [CrossRef]
  23. Yang, F.; Jiang, Y.; Xu, Y. Design of Bird Sound Recognition Model Based on Lightweight. IEEE Access 2022, 10, 85189–85198. [Google Scholar] [CrossRef]
  24. Xie, C.; Zhu, H.; Fei, Y. Deep coordinate attention network for single image super-resolution. IET Image Process. 2022, 16, 273–284. [Google Scholar] [CrossRef]
  25. Nan, F.; Zeng, Q.; Xing, Y.; Qian, Y. Single Image Super-Resolution Reconstruction based on the ResNeXt Network. Multimed. Tools Appl. 2020, 79, 34459–34470. [Google Scholar] [CrossRef]
  26. Liu, B.; Chen, J. A Super Resolution Algorithm Based on Attention Mechanism and SRGAN Network. IEEE Access 2021, 9, 139138–139145. [Google Scholar] [CrossRef]
  27. An, Z.; Zhang, J.; Sheng, Z.; Er, X.; Lv, J. RBDN: Residual Bottleneck Dense Network for Image Super-Resolution. IEEE Access 2021, 9, 103440–103451. [Google Scholar] [CrossRef]
  28. Xie, C.; Liu, Y.; Zeng, W.; Lu, X. An improved method for single image super-resolution based on deep learning. Signal Image Video Porcess. 2019, 13, 557–565. [Google Scholar] [CrossRef]
  29. Wang, M.; Chen, Z.; Wu, Q.M.; Jian, M. Improved face super-resolution generative adversarial networks. Mach. Vis. Appl. 2020, 31, 22. [Google Scholar] [CrossRef]
  30. Seif, G.; Androutsos, D. Edge-Based Loss Function for Single Image Super-Resolution. In Proceedings of the IEEE International Conference on Acoustics, Speech and Signal Processing (ICASSP), Calgary, Canada, 15–20 April 2018; pp. 1468–1472. [Google Scholar]
  31. Zhang, C.-Y.; Niu, Y.; Wu, T.-R.; Li, X.M. Color Image Super-Resolution and Enhancement with Inter-Channel Details at Trivial Cost. J. Comput. Sci. Technol. 2020, 35, 889–899. [Google Scholar] [CrossRef]
  32. Tang, J.; Zhao, Y.; Feng, L.; Zhao, W. Contour-Based Wild Animal Instance Segmentation Using a Few-Shot Detector. Animals 2022, 12, 1980. [Google Scholar] [CrossRef]
  33. Lu, J.; Zhang, L. Cascaded Deep Hashing for Large-Scale Image Retrieval. In Proceedings of the 25th International Conference on Neural Information Processing (ICONIP), Siem Reap, Cambodia, 13–16 December 2018; pp. 419–429. [Google Scholar]
  34. Tian, S.; Zou, L.; Yang, Y.; Kong, C.; Liu, Y. Learning image block statistics and quality assessment losses for perceptual image super-resolution. J. Electron. Imaging 2019, 28, 013042. [Google Scholar]
  35. Nan, Y.; Zhang, H.; Zheng, J.; Yang, K.; Yang, W.; Zhang, M. Research on profiling tracking control optimization of orchard sprayer based on the phenotypic characteristics of tree crown. Comput. Electron. Agric. 2022, 192, 106455. [Google Scholar] [CrossRef]
  36. Zhang, Z.; Shi, Y.; Zhou, X.; Kan, H.; Wen, J. Shuffle block SRGAN for face image super-resolution reconstruction. Meas. Control 2020, 53, 1429–1439. [Google Scholar] [CrossRef]
Figure 1. Schematic diagram and dimensional parameters of engineered bamboo specimens (unit: mm). A, B, C: orientation line for specimen installation positioning; D: data analysis reference point.
Forests 13 01896 g001
Figure 2. Image acquisition process for engineering bamboo crack speckle.
Forests 13 01896 g002
Figure 3. Production and distribution of datasets.
Forests 13 01896 g003
Figure 4. Network structure of ADRAGAN. (a) Whole framework; (b) generator network; (c) discriminator network.
Forests 13 01896 g004
Figure 5. Comparison of reconstructed image effect.
Forests 13 01896 g005
Figure 6. Relevant calculation dimensions of crack propagation length.
Forests 13 01896 g006
Figure 7. Contrast in size between images generated by the algorithms and the original high-resolution image.
Forests 13 01896 g007
Table 1. Equipment performance parameters and experimental parameters.
DevicesPerformance Parameters
Universal Testing MachineRange100 kN
Sampling Frequency20 Hz
Loading ModeConstant Loading
Loading Speed2 mm/min
High-speed CameraMaximum Resolution4000 × 2000 pixel
Filming Speed4000 × 2000 @ 500 fps
Minimum Exposure Time1 µs
Pixel Dimension7 µm
Sensitivity4.64 V/lux.s @ 525 nm
Support Trigger ModeInternal trigger, external trigger
Image Acquisition and Parameter Control SystemAcquisition Cycle50,000–99,999 µs
Magnification
Support Maximum Resolution4536 × 3024 pixels
Sampling Frequency20 s−1
Table 2. Hardware platform configuration.
ItemHardware Configuration
ProcessorIntel Xeon [email protected] GHz
MainboardDell 0 × 8DXD Core i7
Graphics CardNvidia GeForce GTX 1080 Ti
Video Memory8 GB
MemoryHellis DDR4 2666 MHz 64 GB
Table 3. Software environment.
ItemParameter Settings
Operating SystemWindows 10 64-bit
Programming LanguagePython 3.7
Deep Learning FrameworksPytorch
IDECommunity Edition
Initial Learning Rate 2 × 10 4
Attenuation Rate β 1 = 0.9 , β 2 = 0.999
Table 4. Network parameters of each algorithm.
AlgorithmSRResNetSRGANADRAGAN
Number of residual blocks161616
Training image size128128128
Suitable for pre-training model?NoYesYes
Number of feature maps646464
Batch size161616
Table 5. Comparison of mean evaluation index results for four algorithms on the test set.
AlgorithmPSNR (dB)SSIMMOS
Bicubic B-spline interpolation20.640.6152.48
SRResNet24.660.8273.77
SRGAN28.060.8453.69
ADRAGAN29.380.8693.8
Table 6. Comparison results for the various algorithms.
Algorithm d e L e   ( mm ) Δ d e Δ L e   ( mm )
HR2080.96059.56300
LR2183.02855.128102.068−4.436
BICUBIC2138.14657.07857.186−2.485
SRResNet2108.08858.38427.127−1.179
SRGAN————————
ADRAGAN2076.23559.769−4.7250.205
Publisher’s Note: MDPI stays neutral with regard to jurisdictional claims in published maps and institutional affiliations.

