Article

Joint Analysis of Lightning-Induced Forest Fire and Surface Influence Factors in the Great Xing’an Range

1
Forestry College, Inner Mongolia Agricultural University, Hohhot 010019, China
2
Centre Eau Terre Environnement, Institut National de la Recherche Scientifique, Québec City, QC G1K 9A9, Canada
3
Department of Geography, Nipissing University, North Bay, ON P1B 8L7, Canada
4
College of Desert Control Science and Engineering, Inner Mongolia Agricultural University, Hohhot 010011, China
*
Author to whom correspondence should be addressed.
Forests 2022, 13(11), 1867; https://doi.org/10.3390/f13111867
Submission received: 1 October 2022 / Revised: 26 October 2022 / Accepted: 4 November 2022 / Published: 8 November 2022

Abstract

:
For several decades, warming-induced fires have been widespread in many forest systems. A forest fire could be a potential indicator, since the Great Xing’an Range is susceptible to global climate changes and frequent extreme events. This region has a relatively integrated forest community structure. This paper investigated 35 factors to explore how natural conditions affect fire scale. We analyzed the fire spatiotemporal distribution, by combining the Google Earth Engine (GEE) platform and historical records, and then reconstructed the fire-prone climate conditions. We used an exploratory model to minimize the climate factors and a geographically and temporally weighted regression (GTWR) model to predict regional large-scale lightning fire occurrence. The main results are (1) Lightning fire occurrence increased during the past four decades, and the regional fire season starts from the spring (May to June). (2) The time of occurrence of lightning fires had a strong correlation with the occurrence density. (3) The main natural factors affecting a fire-affected area are air moisture content, topographic slope, maximum surface air temperature, wind direction, and surface atmospheric pressure. The regional climate can be characterized that the prevailing southeastern wind bringing lots of precipitation and strong surface pressure, combined with the regional periodic lightning weather and irregular high temperatures, forming fire-prone weather. The abnormal soil water content in the spring led to vegetation growth and increased fuel storage. The low air water content and long-term water deficit made the local air dry. Lightning strikes are an influential factor in fire frequency, while climatic conditions shape the fire-affected areas. (4) The seven days of pre-fire data are more accurate for studying lightning fire occurrence. The GTWR model showed the best fitness among the four models. Fire-prone areas showed a trend of increasing from south to north. In the future, lightning fires will likely occur in this region’s north and east. Our work would promote the local forest fire policy-making process.

1. Introduction

The Great Xing’an Range has one of the well-preserved pristine Larix Gmelinii forests in China and is China’s most extensive national boreal forest [1]. Due to its specific geographical condition, this region experiences frequent forest fires and high forest fire risk grades [2,3]. As an essential terrestrial ecosystem [4], forests are directly affected by surface heat changes. The occurrence of forest fires will seriously threaten the regional ecological environment [5,6]. Studying the forest fires in the Great Xing’an Range can make up for the lack of research in this area and quantitatively monitor the restoration of forests after fires.
Fire is a vital natural factor in global ecosystems; it shapes boreal forests’ development and composition, covering over one billion hectares worldwide [7]. However, large-scale uncontrolled forest fires damage the structure and function of the forest, pollute the environment, and pose a major threat to human life and property security. Warming-induced fire activities have been widespread in many forest ecosystems for several decades [8].
Prior studies revealed that fire cycles were historically associated with climate oscillations [9]. Small fires considerably increased the burned area and carbon emissions all over the world [10]. To some degree, a low-intensity burn will reduce fire risk and benefit ecosystems. Yet, megafires will be part of future fire-regime problems (e.g., how to identify high-risk areas and concentrate efforts on reducing high-severity patch size) [11]. Previous quantitative research also demonstrated that drought-induced forest die-offs raise fire-spreading rates [12]. Forest fire patterns are studied using remote sensing (RS), geographic information systems (GIS), and historical fire data in Nepal [13], they found three factors mainly correlate to fire ignition and spread in mountain terrain, including fuel availability, temperature, and ignition potential. The work of Veraverbeke et al. [14] in the burned areas of North America suggested that lightning fires propel long-term burned area dynamics, and future lightning fires may hasten the northward expansion of the boreal forest treeline. Eskelson and Monleon [15] discussed the relation between forest fire fuel consumption and post-fire fuel accumulation in California forests. They indicated that different fire severity classes have different fuel accumulation patterns. With the progressive improvement of remote sensing technology, more and more remote sensing products are being used [16]. Since the extremely large fire of 1987 in northeastern China, which caused significant emissions on a global scale, Chinese fire researchers take the Great Xing’an Range’s forest fires seriously [7].
Knowing spatiotemporal fire regimes is essential to understanding the fire–vegetation–climate dynamics [17]. The burning during the past century was spatially variable [9]. Using a geographical interpolation and model combined with fire scars to modernize the historical fire areas is meaningful for spatially explicit fire frequency reconstruction [18,19]. Azpeleta Tarancón, et al. [20] used dendrochronological methods and various fire statistics to reconstruct and assess landscape fire regimes. Their results showed that historical fires were synchronous with drought years and were often preceded by wet years. Rodrigues, et al. [21] argued that fire trends in southern European countries are regionally decreasing in burned areas but increasing in fire occurrence. Fréjaville and Curt [22] state that fire–climate relationships changed rapidly, and fire activities were highly correlated with extreme fire weather, yet the relationship’s intensity is hydroclimate-dependent. According to four decades of study in the Iberian Peninsula, expanding urban–rural bonds may accelerate fire incidence [23]. In central Europe, Adámek, et al. [24] revealed that environmental factors primarily controlled fire occurrence, while human factors strongly drove fire density.
Previous research in China mainly emphasized the spatiotemporal distribution of nationwide fires. Yi, et al. [25] combined national fire records and satellite fire data to study vegetation fire patterns, illustrating the synchronous relationship between precipitation variation and burned area [26]. Ying, et al. [27] used county-level in situ observations to establish a random forest model analyzing the correlation between fire and five relevant factors. Their results suggested that spring temperature was the key factor affecting the number of fires. Liu, et al. [28] investigated forest fires in Jilin Province, Northeast China. They suggested that fire occurrence had a significant intro-annual temporal pattern, after the provincial government strictly implemented forest fire prevention measures [29].
As the technology develops, more and more models have been put into use [30,31,32,33]. However, China’s prevailing view of spatiotemporal fire regimes has not yet been thoroughly investigated. The natural conditions in the northern forests of the Great Xing’an Range of Inner Mongolia differ from those of Heilongjiang Province [34]. The regional spatiotemporal fire regimes remain poorly understood.
The discovery of previously unknown spatiotemporal patterns, by using spatiotemporal linear regression methods, provides a better understanding of the ecological world [35]. Several lines of evidence suggest that linear regression models are useful in evaluating fire risk [2,36]. When analyzing the relationship between fire occurrence and its influencing indices, simple linear regression models such as the ordinary least squares (OLS) [37] model and global linear regression (GLM) model [38] could not fully consider the spatial heterogeneity of different variables’ distribution. The geographically weighted regression (GWR) model [36,39] has been largely used for its unique features of accounting for spatial heterogeneity. GWR models can obtain the spatial non-stationarity changes by assigning distance-based regression coefficients to different variables. The GWR model focuses more on spatial variance and data analysis rather than spatiotemporal variance and prediction [40]. The geographically and temporally weighted regression (GTWR) model originated from the geographically weighted regression (GWR) model [41]. Adding a temporal regression function into the GWR model turns the two-dimensional spatial coordinates (geospatial) model into three-dimensional spatiotemporal coordinates, allowing the model to manage both the spatial and temporal variations in non-stationarity simultaneously [42,43]. GTWR is more fit in studying the potential rules under natural conditions [40]. However, much of the research up to now has been used in evaluating human-related fire risk [40,44], with not many attempts in the field of forest fire risk [45], and there are even fewer studies using the GTWR model to study lightning-induced forest fire or fire-affected areas.
Our study is based on a combination of fire records and multi-sensor satellite observations, using a geographically and temporally weighted regression (GTWR) model. We aim to explore the spatiotemporal fire regimes in forest fires and its correlation with surface influence factors between 1986–2020 in the boreal forest of the Great Xing’an Range of Inner Mongolia. The purpose of this study is to: (1) Find the most relevant surface influence factors that impact lightning fire scales and compare different pre-fire climate factors to reveal the effects of surface influence factors on fire occurrence and its affected areas in different time scales. (2) Explore the spatiotemporal patterns of fire activities and reconstruct seasonal variation and yearly fire-prone climatical patterns. (3) Test different linear regression models for analyzing the spatiotemporal heterogeneity of the impact of factors on fire activities.

2. Materials and Methodologies

2.1. Study Region

The northern forest of the Great Xing’an Range of Inner Mongolia is located in Northeast China and lies at the junction of Inner Mongolia, Heilongjiang Province, and Russia. It is characterized by a cold temperate continental climate, under alternating monsoons [46]. The historical annual average temperature and precipitation (Figure 1) present a general high regional precipitation, with noticeable temperature differences. The perennial temperature is low, at an average of −17.75 °C [47]. The annual precipitation fluctuates between 450 and 550 mm [48]. Between 1960 and 2018, annual precipitation at Genhe station increased at a rate of 15.5 mm per decade. Historical records show that the Great Xing’an Range of Inner Mongolia has had more than 3400 forest fires occurring in the last six decades [49]. Based on the European Centre for Medium-Range Weather Forecasts (ECMWF) data, we also made a map of historical monthly precipitation and air temperature (see Figure 1).
Our study area has a latitude of 50° N~54° N and covers an area of 53,449.1 km2, with most parts being larch forest. The dominant tree species are Xing’an larch, white birch, and Mongolian pine (Pinus sylvestris var. Mongolia) [50]. This region has an intact community structure with relatively less artificial disturbance. Nevertheless, this area has become one of China’s high forest fire risk regions because of the frequent wildfire disturbances.

2.2. Data Sources and Statistical Analysis

This paper uses multisource data to build a correlation between forest-fire-affected area and surface influence factors. The lightning fire records are collected from the local forest bureau, ranging from 1986 to 2020. As our study region has little influence from human activities, four influential factors were used: vegetation and topographical, climatic, and cloud parameters.
Vegetation data was derived from the NOAA CDR (National Oceanic and Atmospheric Administration, Climate Data Record) project, which has records of 5 spectral bands and satellite sensors. AVHRR (Advanced Very-High-Resolution Radiometer) can provide different spectral indices all over the world. We used the Normalized Difference Vegetation Index (NDVI) [51] and Leaf Area Index (LAI) [52] to represent the vegetation conditions in our study region.
Topographical factors are obtained from the National Aeronautics and Space Administration Digital Elevation Model (NASA DEM) dataset [53], which is reprocessing of Shuttle Radar Topography Mission (STRM) data [54].
The climate data in this study mostly comes from the ERA 5 dataset [55]. ERA5 dataset is the fifth generation of hourly global climate reanalysis data from ECMWF (European Centre for Medium-Range Weather Forecasts). ERA 5 dataset provides data from 1950 to the present, with a resolution of 30 km [56]. GEE delivers the data from 1981 to the present. As some of the environmental predicters are not directly included in ERA 5 dataset, we need to calculate some specific data based on the components available in the ERA5 dataset.
The wind speed or direction is calculated from the U and V components [57]. WS and WS, representing the wind speed and wind direction, respectively, are calculated as follows:
WS = U 2 + V 2
WD = tan 1 U , V × 180 π
Climatic water deficit (CWD) [58] is the difference between potential and total evaporation, to represent the climate’s unmet evaporative demand for water. The arid index (AI) is the ratio of total evaporation and total precipitation. It can be used to describe how much water is required to meet the evaporation [59].
Relative humidity (RH) is calculated from the surface temperature (T) and dewpoint temperature (Td) [60] as follows:
RH = 100 5 T T d
Due to lack of lightning flash observation data in the same time frame as our study, we employed cloud top properties to represent the lightning parameters. Previous research [61,62,63] has established that there exists a correlation between cloud top parameters and lightning density. We intend to use four cloud parameters consisting of cloud top height (CTH), cloud optical depth (COD), cloud top pressure (CTP), and cloud top temperature (CTT). Three simulated lightning density parameters have also been used in this study, which contain CTH-derived lightning density (LD_CTH), COD-derived lightning density (LD_COD), and CTP-derived lightning density (LD_CTP). Empirical models of lightning density can be found in the study by Karagiannidis, et al. [64]. All cloud top properties come from NOAA CDR of Reflectance and Brightness Temperatures from AVHRR Pathfinder Atmospheres—Extended (PATMOS-x), Version 5.3 (NOAA CDR PATMOSX v53) [65,66]. All products of NOAA CDR PATMOSX v53 were derived using the ABI (Advanced Baseline Imager) Cloud Height Algorithm (ACHA) [67]. Table 1 shows all 35 indices.

2.3. Data Processing

We first used the GEE platform to obtain the data (as shown in Table 1) and assigned them to the fire records points. Twenty-eight relevant factors were obtained for each fire point. Notably, due to the wind direction and aspect in a consistent degree number from 0 to 360, we divided them into different approaches to better visualize the results. The classification rules are defined as: the northern wind (0° to 22.5° and 337.5° to 360°); the northeastern wind (22.5° to 67.5°); the eastern wind (67.5° to 112.5°); the southeastern wind (112.5° to 157.5°); the southern wind (157.5° to 202.5°); the southwestern wind (202.5° to 247.5°); the western wind (247.5°~292.5°); the northwestern wind (292.5°~337.5°).
Due to a large amount of data, we need to choose the indexes most related to fire scale by applying an exploratory regression analysis in ArcGIS software [68]. The exploratory regression analysis can determine the possible combinations of exploratory variables that can best perform in an OLS model. It is a data mining tool aiming at applying data dimensionality reduction [69]. By evaluating all the possible variables and variable combinations, we have more chances to find the best varying variety and maximumly reduce the interference of the irrelevant variables [70]. We defined the fire-affected areas as the dependent variable and the surface influence factors as the independent values. In choosing the best models, we ranked them based on the adjusted R2, variance inflation factor (VIF), and Akaike Information Criterion (AIC) to find which climate and vegetation condition combinations are easier to occur in large fires. The VIF evaluates whether there is overfitting and multicollinearity in our regression model. A smaller VIF means better performance. The AIC is to evaluate the model’s fitness. A smaller AIC value means that the model fits the sample data better. The adjusted R2 measures data fitness degree, generally in the range of (−∞, 1). The larger values of adjusted R2 indicate better performance of the model. In our study, the VIF is the constraint factor, meaning we only evaluate those combinations under VIF 7.5 and choose the smallest VIF model. The correction coefficient, adjusted R2, and the AIC determine the performance of different combinations. We also performed a spatial autocorrelation test to avoid multicollinearity errors in order to evaluate the model residuals.
It is reported that the correlation of fire activities with climate parameters varies in different time scales [71,72], and these time scales vary from day to decade [73,74]. Existing studies of fire regimes [75,76,77,78] proved that climate factors may have a short-time-lagged effect on fuel moisture and soil moisture. To incorporate with lagged effect and periodic effect of different time scales in climate parameters, we applied different time scales to maximumly reveal the fire-related factors’ temporal patterns: the short-term scale refers to daily to monthly change; middle-term scale refers to month-to-seasonal change; the long-term scale refers to yearly or periodic change of whole study period.
We used an exploratory regression to find the most influential factors of fire-affected area in short-term (days to month) time scale. Hence, we appointed the fire-occurrence day and three types of pre-fire time length in this study to get more accuracy: 7 days before the fire (7d_pre), 14 days before the fire (15d_pre), and 30 days before the fire (30d_pre). We only differentiated climatical parameters and the vegetation parameters among different pre-fire scales; the topographical and cloud properties were the same in all four types. After finding the most relevant influence factors, we applied those climatic factors from the hourly images to monthly images to get the average values of all cells in our study region. In the middle-term scale, we firstly classified the fire-occurrence date into different months and distinguished the fire-prone season and other seasons based on the fire frequency. Next, we applied the climate data to seasons and used historical statistical analysis to reconstruct the perennial seasonal fire-prone climate. In the long-term scale, after a statistical summary, we performed a wavelets transformation to investigate the lagged effects and multi-year periodic effects.

2.4. Wavelet Transformation

Wavelet transform aims to describe non-stationarities of time-scale signal change and its transient phenomena [79]. We used a “waveletcomp” installed in Rstudio to process this analysis [80]. The basic equation is:
+ ψ t d t = 0
where, ψ t is mother wavelet function, which consists of a means of continuous signal functions ψ f a , b ,
ψ f a , b = a 1 2 Δ t k = 1 N f k Δ t φ ¯ k Δ t t a
where a represents the scale, which reflects the periodic change; b refers to time location, which reflects the change in time axis; f k Δ t is a real signal with wavelet transform; Δ t is a time change; k is the number of discrete points; and φ ¯ k Δ t t a denotes the complex conjugate of φ k Δ t t a . The wavelet transform aims to determine the distribution of fire-related climate factors at different time scales.

2.5. Geographically and Temporally Weighted Regression (GTWR) Model

Based on the most relevant climatic factors, we aimed to test models and predict the lightning-fire-prone areas in our study region by applying the GTWR model [41]. The core regression model is as follows:
y i = β 0 u i , v i , t i + k = 1 p β k u i , v i , t i x i k + ε i               i = 1 , 2 , 3 , , n
where yi is the dependent variables, here being the lightning-fire-affected area; (ui, vi, ti) is the space–time coordinates at point I; n is the number of observations (here as the lightning-fire-affected area); β0(ui, vi, ti) is the intercept value; βk(ui, vi, ti) is the parameter values of point i at the number k of independent variables; and εi is the residual at point i. To provide the estimation β ^ i for βk at point i, Equation (7) is proposed below.
β ^ i = β ^ 0 β ^ 1 β ^ d T = X T W i X 1 X T W i y
The Wi denotes the spatiotemporal weight matrix at point i. It is assumed that the closer points in space–time coordinate are, the greater the influence in estimation. The space–time distance determines the Wi. d i j S T of observing point i and its nearby point j in an ellipsoidal coordinate system.
d i j S T 2 = λ u i u j 2 + v i v j 2 + μ t i t j 2
λ is the spatial distance factor, and μ is the temporal distance factor. The selected bandwidths are followed by a Gaussian kernel function, with its equation as follows:
w i j = e x p d i j S T h S T 2
Furthermore, it can be written as
w i j = e x p λ u i u j 2 + v i v j 2 + μ t i t j 2 h S T = e x p u i u j 2 + v i v j 2 h S 2 + t i t j 2 h T 2 = e x p d i j S h S 2 + d i j T h T 2 = e x p d i j S h S 2 × e x p d i j T h T 2 = w i j S × w i j T
where h S T is spatiotemporal bandwidth. The spatiotemporal weight matrix can be expressed by the following equation. Due to a lack of prior knowledge, cross-validation (CV) based on spatial bandwidth h S and temporal bandwidth h T was performed.
C V h S , h T = 1 n i = 1 n y i y ^ i h S , h T 2
The spatiotemporal bandwidth was proposed by Fotheringham, et al. [81], the optimal spatiotemporal bandwidth is determined when the CV is minimized, and a step-by-step method was applied to reduce the spatial bandwidth and temporal bandwidth. Figure 2 is the technical scheme chart for all the methods.

3. Results

3.1. Lightning-Fire Spatiotemporal Distribution

According to the fire records in our study area (Figure 1), among all the 697 fire records, 684 fires are lightning fires, 1 fire is human-caused, 8 fires are of unknown reason, and 4 fires started outside the area then crossed the national borderline. Thus, lightning fire is the primary forest fire type in this area. From all the historical records, there is only one human-caused forest fire in our study area, and four cross-border fires happened in the northern part of our study region. In addition to the four cross-border fires in the northern, there is a slightly increasing trend of non-lightning fires occurring from north to south. We also observed that lightning fires have fluctuated since 1986, especially in the last five years. As for the spatial distribution, the statistical hotspots map showed an increasing trend from south to north, and the density gradually increased from west to east.
Many severe forest fires occurred in the central and northern parts of the region. From the fire-occurrence counts and fire-affected areas, we found that the northern part of our region is most severely affected by the lightning fires.
Forest fires mainly occurred between April and October (Figure 3). The fire season was concentrated between May and August, with June to August being the period with them most frequently occurring, with the percentage of fires being 35.91% in June, 36.29% in July, 14.06% in August, 8.01% in May, 4.61% in September, 0.45% in April, and 0.67% in October. The earliest forest fire occurred on April 4 and the latest fire on October 7.
Twelve months were reclassified into four seasons based on the fire concentration. The seasons were divided into December to the next February (December, January, and February; DJF) in winter, March to May (March, April, and May; MAM) in spring, June to August (June, July, and August; JJA) in summer, and September to November (September, October, and November; SON) in autumn. JJA was defined as the fire season.
From the aspect of the affected area and the fire-occurrence frequency, the most fire-prone parts of this region are the northern and eastern parts (Figure 4). Meanwhile, the most fire-prone point in these two parts is far from human settlements. From the day of year (DOY) statistics, the fire-occurrence date generally showed the same distribution pattern as the density distribution. There is a slight trend that the fire-occurrence DOY is typically delayed from south to north, indicating that the lightning fire tends to occur later in the northern region. However, some regions in the southern part also show a late occurrence DOY, and an area in the northern part has an early occurrence DOY. This indicates that the fire-occurrence date has a complicated regional-distribution pattern. Combined with the fire density map, it can be found that the lightning-fire-occurrence DOY in the northern and the south-central parts showed a strong correlation with fire-density distribution. In general, the fire-prone parts (northern and eastern) had lightning fires that occurred late and frequently. However, lightning fires occurred frequently in May and June in the north-central region. The fire density gradually increased from south to north (Figure 4C). We can characterize this region into three parts. The northern part is distributed with fires with large affected areas and a high frequency, which are mostly occurring late. The central and eastern parts are distributed with fires of medium affected areas and a medium frequency, which are occurring early. The southern part is distributed with fires in the least affected areas, which are occurring late and with the last occurrence.

3.2. Reconstruction of the Lightning-Fire Climate

3.2.1. Exploring Results of the Forest Fire

Due to lightning fire occurring as a result of prolonged periods of fire-prone climate conditions [77], existing studies [75,76] of the fire regime proved that precipitation had a short-time-lagged effect on fuel moisture and soil moisture. We appointed the fire-occurrence day conditions and three types of pre-fire time lengths in this study to acquire more accuracy: 7 days before the fire (7d_pre), 14 days before the fire (15d_pre), and 30 days before the fire (30d_pre).
The best performance models (or factor combinations) for different pre-fire time lengths are listed in Table 2. The adjusted R2 of the regressions are all at a low value of 0.05 for four types (1d_pre, 7d_pre, 14d_pre, and 30d_pre), indicating that the causes of lightning fires are relatively complex, and lightning fire occurrence is a natural hazard. It should consider spatial and temporal variability. In conditions of VIF under 7.5, the VIF varies across different pre-fire time lengths. The VIF of 7d_pre is the smallest, while the VIF of 1d_pre is the largest, indicating an interaction among all factors. The VIF from 30d_pre to 1d_pre showed an increase then a decrease, indicating that the pre-fire natural conditions had a complex changing process and that there was a mutual influence and independence among all the factors.
It is worth noting that the optimal combination of factors for different pre-fire time lengths is not the same. The four optimal exploratory models included climate water, aspect, maximum air temperature, wind direction, and surface pressure. These five factors had a more significant influence on lightning-fire occurrence than other factors.
As for different factors in the four different pre-fire lengths, the arid index and surface runoff were included in the model for 30d_pre, but they disappeared in the model for 14d_pre. In their replacement, the canopy evaporation and 10 cm volumetric soil water were included in the regression model. This indicated that before a lightning fire occurred, the region experienced a prolonged drought due to increasing canopy evaporation and decreased climate and soil water content. These situations later become the objective factor for lightning-fire occurrence and can be regarded as lightning-prone weather.
Based on the AIC values, the model with a smaller AIC value proves a better model exploration performance under the condition of a difference of the AIC greater than 3. In general, the exploratory regression of the 7d_pre has smaller VIF values and lowest AIC values, indicating that the 7d_pre model had better fitness in regression and predicting. Therefore, we selected 7d_pre for GTWR regression to regress and predict the extent of lightning-fire impact.

3.2.2. Fire-Season Climate Reconstruction

This region has experienced a 40-year trend of decreasing precipitation and increasing air temperature from 1980 to 2019 (Figure 5). The decreasing precipitation trend had a strong fluctuation or reversing change after 2007. Annual precipitation decreased from 635 mm in 1980 to 186 mm in 2019, with an average decrease of 4.65 mm per year. On the other hand, the annual mean air temperature increased from −4.5 °C to −2.3 °C, with an overall increase of 2.1 °C and an average increase of 0.05 °C per year.
To accurately reconstruct the fire season’s climate conditions, we arranged the different meteorological conditions in different seasons. We first acquired the regional mean value of each season in each year, then put it into a line chart. Moreover, we mainly observed the difference between the fire season (JJA) and other seasons. The surface soil temperature was higher in the fire season JJA when lightning fires were frequent (Figure 6), and it is the hottest season of the year. Combined with the frequency of lightning fires [78], the years frequently disturbed by lightning fires were 2003, 2010, and 2019. All experienced about three years of high-temperature before the fire year (for example, the high-temperature years 2000~2002 before the fire year 2003). There exists a significant increase in the JJA surface soil temperature one year before the high fire-frequency years (2002, 2010, and 2019). Besides, Figure 6 also reveals that there has been a gradual decrease in DJF, MAM, and SON 5 years before high fire-frequency years. The overall surface temperature after the forest fires shows a slight downward trend.
It can be seen from Figure 7 that the seasonal wind direction is mostly east, southeast, and south in summer (JJA). Besides, the wind direction in summer varies significantly with the time changes. Moreover, the southwestern and western winds are the main wind directions in spring (MAM), autumn (SON), and winter (DJF). Very few years existed with the northwestern and northern winds. From the high firefrequency years, 2003, 2010, and 2019, we found that the wind direction in the summer was dominated by the southeastern wind, and the winter and spring were dominated by the western wind.
The climatic moisture content chart (Figure 8) reveals a long-term regional climatic moisture deficit in the MAM, JJA, and SON seasons. However, this is not apparent for the DJF season. Every MAM and JJA experienced a water deficit for a long time. The spring moisture deficit is numerically higher than the summer moisture deficit. We can find more severe moisture deficits for the high fire-frequency years in 2002, 2010, and 2019. It is noteworthy that a more severe moisture deficit was observed in the next year after each high fire frequency year.
The surface soil moisture content generally decreased over 40 years (Figure 9). Among all the seasons, SON showed a steady declining trend, while JJA showed a steeper decreasing trend. Usually, the surface soil moisture content was higher in MAM than in JJA. In 2003, 2010, and 2019, the surface soil water content showed a uniquely high level in MAM. However, it was low in JJA. Moreover, in the next year after a significant fire year, there was a large increase in spring surface soil water content.
The surface pressure is stronger in SON and DJF than in JJA and MAM (Figure 10). JJA has the lowest surface pressure. The surface pressure difference between MAM and JJA is low. On the contrary, the surface pressure difference between SON and DJF largely differs from between MAM and JJA. In the significant fire years of 2003, 2010, and 2019, there was an increasing surface air pressure in MAM of the following year after a high firefrequency year.
From the statistical chart of the lightning-fire-occurrence aspect (Figure 11), it is easier for lightning fires to occur on the southwestern slope, as reflected by the 101 fires, followed by the southeastern slope with 100 fires. The least occurring slope is the northwestern slope, with 64 cases. Lightning fires are more likely to occur on the sunny slopes, such as the southwestern and southern slopes, and are less likely to appear on the northwestern or shady slopes.

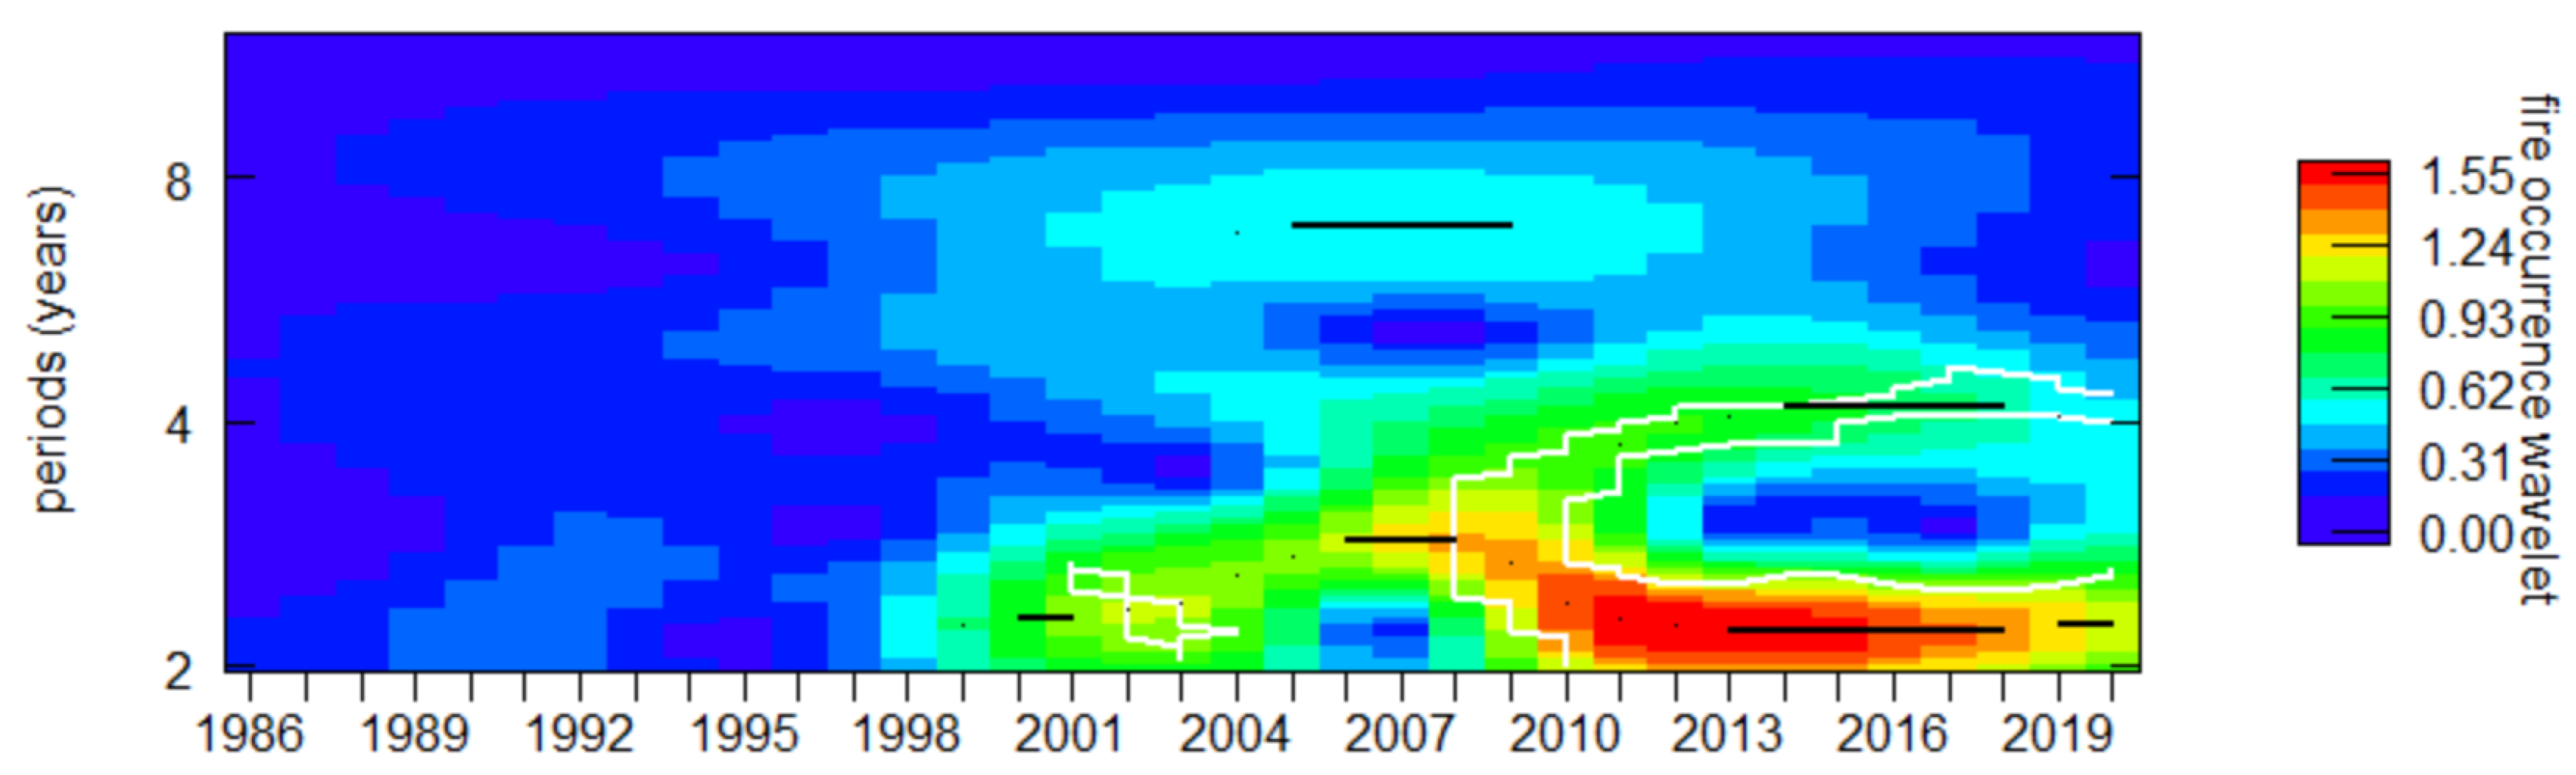
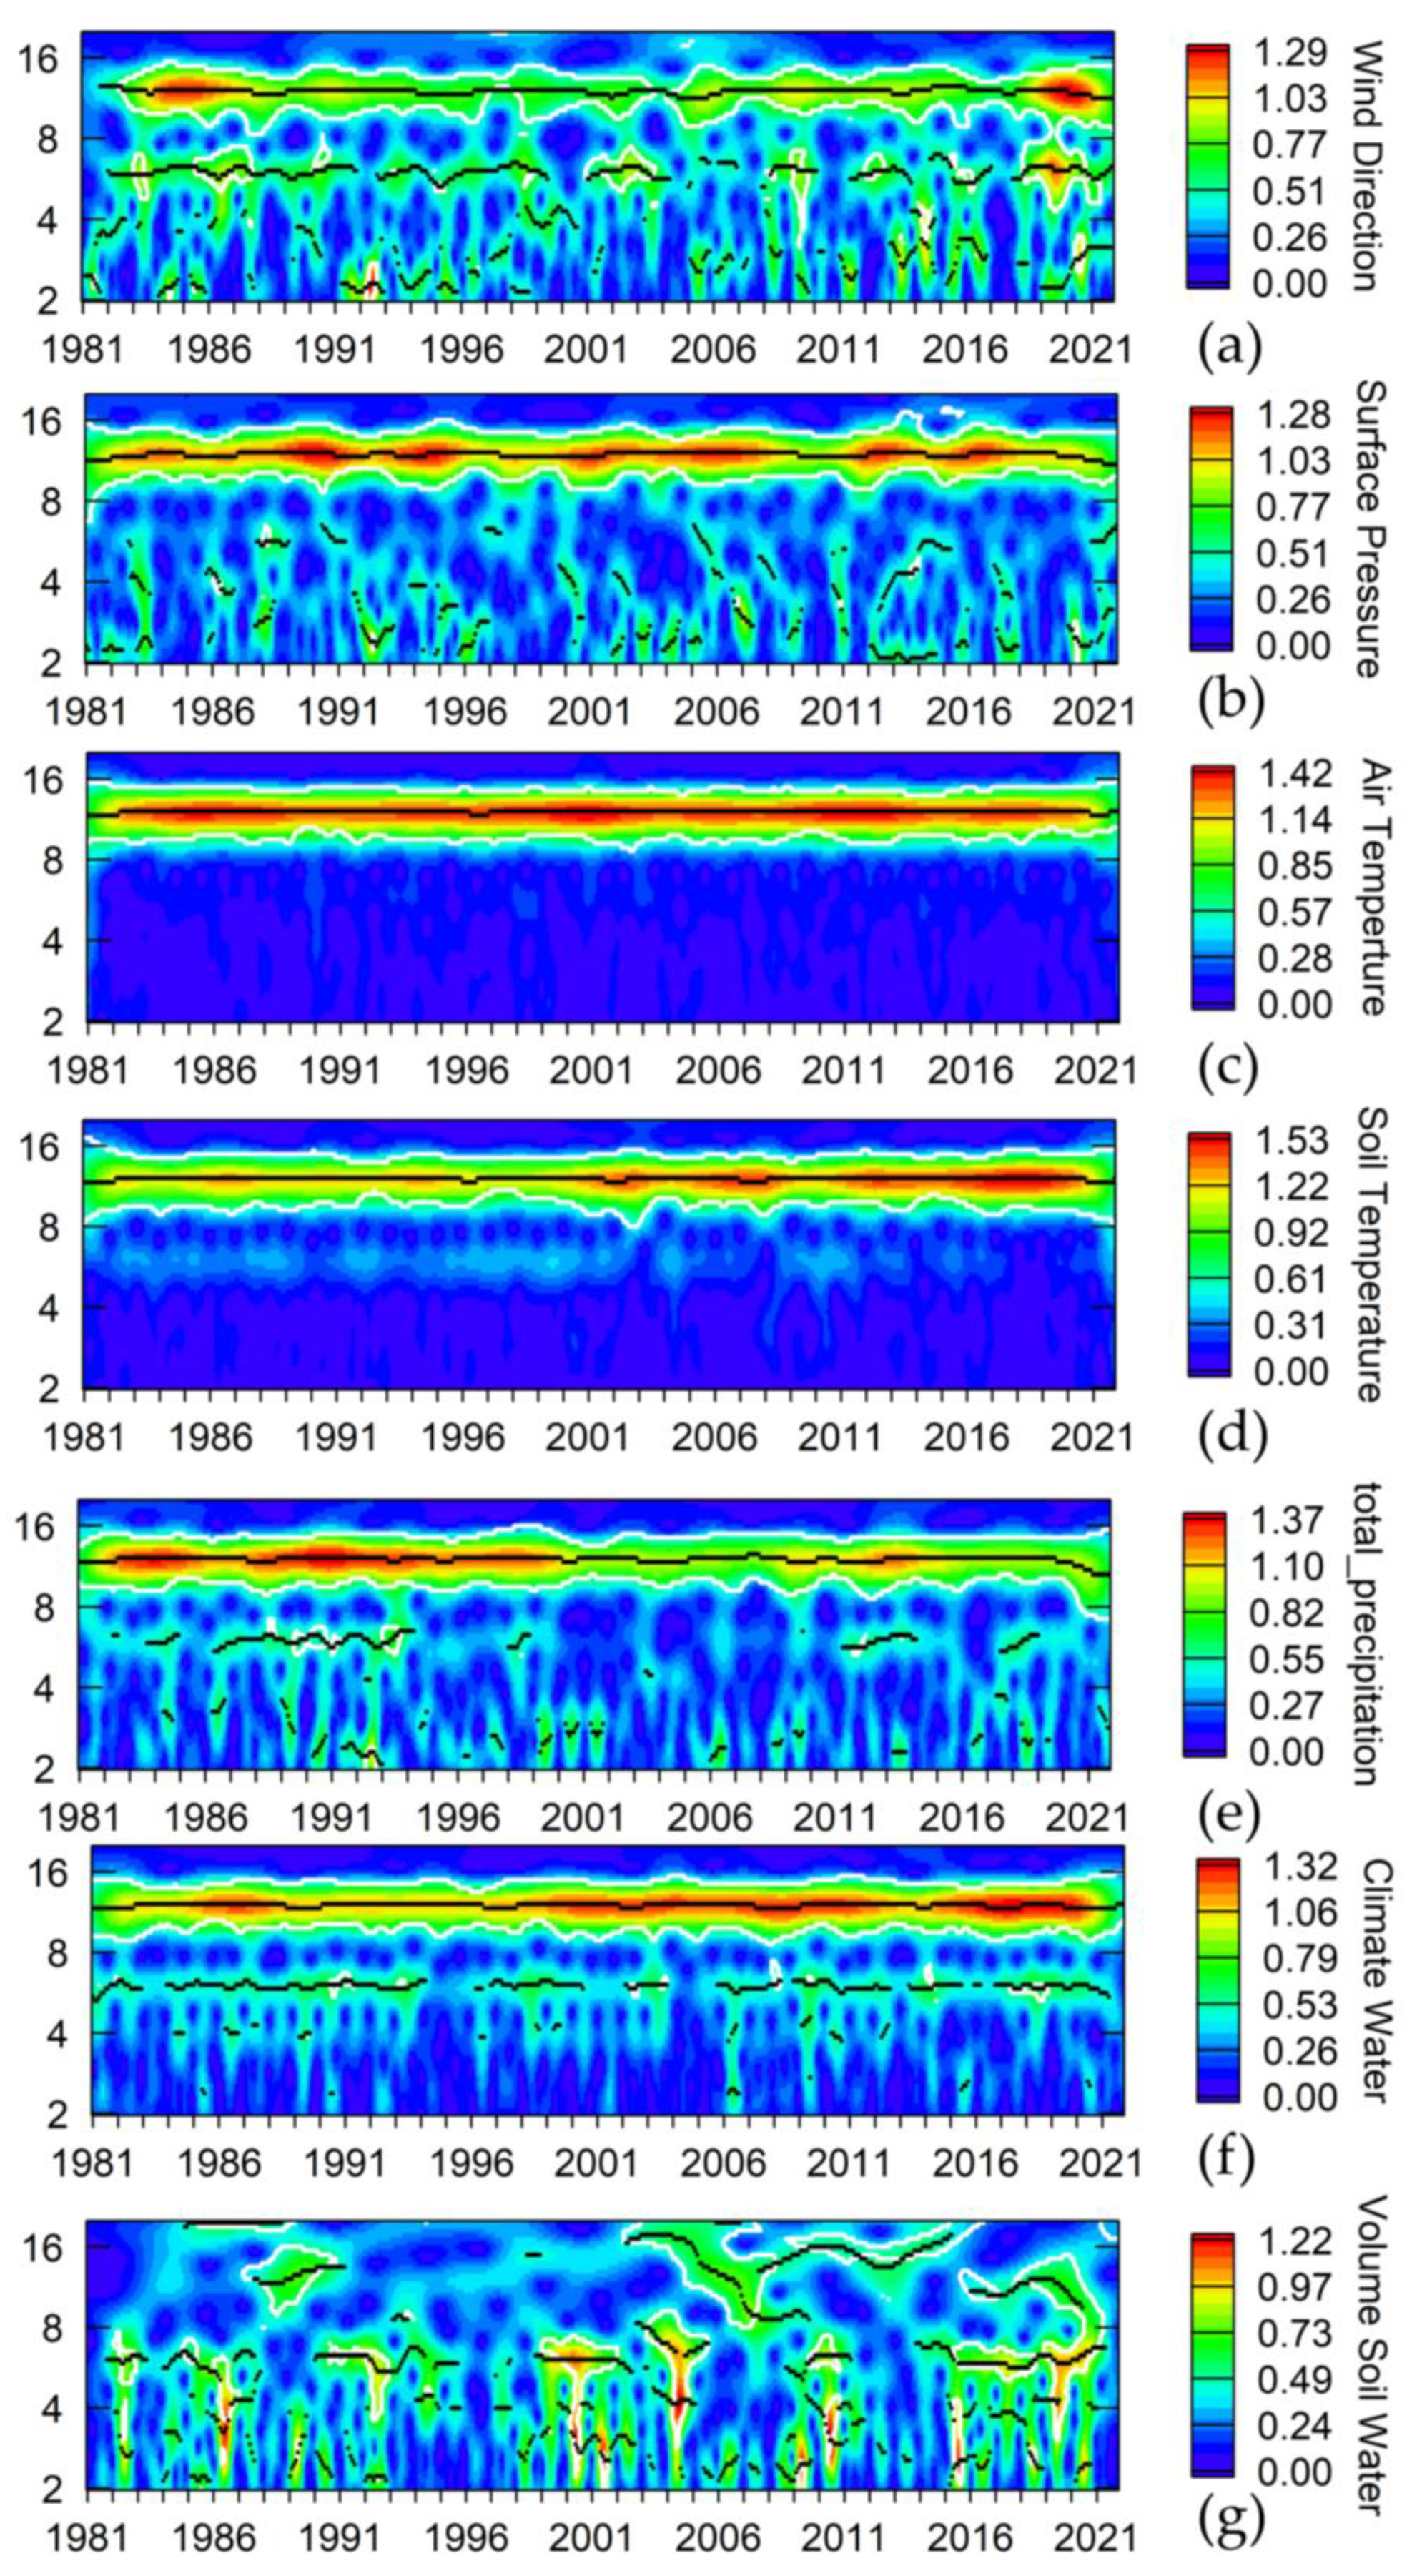
3.2.3. Wavelet Transformation for Fire Occurrence and Climatic Conditions

We applied a wavelet analysis to the climatic conditions to further study the temporal change. We drew Morlet wavelet transformations to analyze the lightning-fire occurrence and the periodic changes of fire-related climatic indices. The Morlet wavelet transformation diagram shows that the concentrated event of lightning fires is from 3 years to 7 years (Figure 12). Lightning-fire occurrence has temporally local characteristics. The occurrence of lightning fires has increased sharply in the last decade. There is an increasing trend after 2000, and, especially, the most recent 10 years show an excessively increasing trend.
For the cyclical variability of fire-related climate conditions, the wind direction had a 15-year primary cycle and a 7-year subcycle (Figure 13a). The surface pressure had a strong interannual periodicity of 15 years (Figure 13b). The surface air temperature (Figure 13c) and soil temperature (Figure 13d) are significant in a 15-year cycle. In contrast to surface air temperature, surface soil temperature periodicity varies a lot over time, showing a gradually increasing trend over the whole study period. The total precipitation (Figure 13e) and climate water deficit (Figure 13f) had a primary interdecadal cycle of 15 years and a subcycle of 7 years. On the contrary, the surface soil water content (Figure 13g) had a different quasiperiodic variation of 7 years, with a sub-cycle of 4 years.
The relationship between lightning-fire occurrence and climatic conditions showed that the most recent outbreak of lightning fires in 2019 was associated with a change in wind direction, while three high fire-frequency years (2003, 2010, and 2019) are associated with the lagging phenomenon of surface pressure. It can also be found that an increase in soil temperature accompanies the increased frequency of lightning fires in the study area. Fires come after the precipitation interdecadal. Moreover, all years of high fire-frequency show cyclical soil water fluctuations.

3.3. Lightning Fire Regression and Prediction

The GTWR model was used to regress and predict lightning-fire-affected areas and forest fire risk. Based on the results of the exploratory regression in Section 3.2.1, we used the combination of the 7d_pre factors to establish the model. The GTWR model allows us to consider lightning fire simultaneously in terms of temporal and spatial variations. The difference between the normal linear regression model and the GTWR model is that GTWR does not merely regress and make predictions for a particular point but is integrated on a regional scale.
Typically, before using a GTWR model, we should run the same variables in OLS (ordinary least squares), TWR (temporally weighted regression), and GWR, to see if the GTWR model has improved [41]. Thus, we applied the selected factors that have passed the spatial autocorrelation test to the different regression models for comparison.
The OLS model has the lowest R2 at 0.04 and adjusted R2 at 0.031, while the GTWR model has the highest R2 at 0.161 and adjusted R2 at 0.153 (Table 3). Interestingly, a decreasing trend in AIC value changes was found from OLS to GWR, yet the R2 and adjusted R2 prove that the GWR model is better than the OLS model. Usually, under an AIC difference > 3, the lower AIC values have more accuracy than the AIC values [40,41,82,83]. Thus, among all four models, the GTWR model has the lowest AIC value, highest R2, and adjusted R2, proving that compared with other models that only consider spatial or temporal distribution, the GTWR model has better performance. It should be noticed that the TWR model has lower AIC values than the GWR model, which proves that, in our region, the lightning-fire occurrence has a certain time heterogeneity. Moreover, the fire-affected areas have more temporal heterogeneity than spatial heterogeneity. All models show a relatively low R2. The GTWR model has the best fitness among the four models.
We tried a large affected-area prediction based on the regression result of the GTWR model result. Referring to previous experience [84], we used the kriging method [85] to rasterize the large-scale lightning-fire-occurrence probability. The predictions are shown in Figure 14. The images show the large-scale lightning-fire risk areas. The fire-prone areas tend to increase from south to north and from west to east. In the future, lightning fires will likely occur in the middle northern and eastern parts, as shown in Figure 14.

4. Discussion

Since this region is low in population and has been experiencing population loss in recent years [86], we can consider this region as a relatively natural region. The most fire-prone area in our study region is located in the northern and eastern parts. The northern forest conservation bureau governs the northern part, and the eastern part is governed by the Hanma nature reserve bureau. Both are forest reserve regions far from human settlements [87,88]. Chang, et al. [89] already discussed the probability of fire occurrence in the northern part of the Great Xing’an Range.
Moreover, high fire frequency in the eastern part proves that lightning fires are more likely to occur alongside the ridge of the Great Xing’an Range, which matches the research by Liu, Yang, Chang, Weisberg and He [75] and Chang, et al. [90]. However, the southern part in Figure 4B,C clearly shows that there exists a fire-prone region near the region’s largest settlement, Genhe. This suggests that human activities will increase the fire frequency and alter the fire-occurrence date, yet will partially decrease the affected area [75]. The fire-occurrence DOY statistic shows that the same distribution pattern with fire density can prove that the forest fire region has early DOY patterns. There is a seasonal trend/pattern of lightning fires mostly occurring between May and June, accompanied by larger burned areas and more frequent fires where fire occurs earlier, which in line with those of previous studies done by Wei, et al. [91] and Zhao, et al. [92].
The exploratory regression results show that the main factors associated with lightning-fire activities are air moisture content, ground slope, surface air temperature, wind direction, and surface pressure, as supported by former observations [2,93]. The data from seven days before a fire was more accurate in establishing the regression models, thus predicting the lightning-fire occurrence. The different factor [94] combinations for the 1d_pre, 7d_pre, 14d_pre, and 30d_pre cases indicated that the climate impacts forest-fire occurrence under a specific process. This process intensifies the loss of forest fuel water content and air dryness, resulting in a lagged moisture impact [95]. Among the four types of fire-pre length, 7d_pre shows the lowest AIC values and the second-lowest VIF values, while 1d_pre shows the highest AIC values and the lowest VIF values. It can be seen that the 1d_pre conditions are closer to the real conditions but are hard to predict, which also potentially proves that there is a time-lag effect of climate conditions on fire-affected areas. Of the four categories of influential factors, the topographical factors and climatical factors existed in all four pre-fire length types, which potentially indicates that these two categories are strongly associated with the fire-affected area. In general, therefore, it seems that in our study region, lightning-fire-affected areas are contributed to by abnormal hydrothermal cycles rather than by vegetation and cloud-top properties.
For the exploratory regression results, all the selected factors (Table 2) of the different pre-fire time lengths were non-related to vegetation conditions and lightning parameters. This result is somewhat counterintuitive.
This region is in high vegetation coverage [96]. Therefore, we cannot identify the vegetation conditions’ contribution to the fire-affected areas. One reason why the lightning parameters show a low influence on lightning-induced forest fires is that we used the fire-affected area as our independent variable; lightning is the driving factor influencing fire frequency (or fire occurrence) [92,97], but once a fire starts, the climatic conditions together with topological conditions are the main drivers to the fire-affected areas [98,99,100]. Another reason is that while we used cloud-top properties and simulated lightning-flash density, we did not differentiate cloud-to-cloud lightning flash from cloud-to-ground lightning flash, which might explain why the lightning parameters show a low correlation with the fire-affected areas.
To test whether the cloud properties correlated with the fire frequency, we also tested the correlations between the fire frequency and the influential factors (Figure 15). We chose the fire-occurrence times in each month of the year to represent the fire frequency (only count the month that occurred fire, i.e., there is no fire in December, we don’t count this month.), and their corresponding monthly mean values for each factor of the exploratory regression results were set to be the influential factors. All the factors passed the significance test (p-values < 0.01) run in a Pearson correlation test. As shown in Figure 15, the correlation between fire frequency and other factors ranked as CTT>Ta>NDVI>LAI. Since CTT represents cloud activities, cloud activities may have been an important factor in fire frequency or fire occurrence. Figure 15 also illustrates that the relation between fire frequency and other factors is not just a simple linear correlation, so there exists a threshold between the influential factors and the fire frequency. This finding is further supported by the study of Ying, Han, Du and Shen [27]. Among all the factors, temperature plays a dominant role both in the fire frequency and the fire-affected areas, and this result is in accord with recent studies [101].
A time-series study of climatic factors was conducted to investigate further how climatic factors influence lightning-fire occurrence. Following the earlier studies [94,102,103], perennial high temperatures preceded the high fire-frequency years. Moreover, there were thermal anomalies in the high fire-frequency years. Since our region is located at the eastern end of Eurasia, there exists a phenomenon that the fire-prone years have a large climatic moisture deficit in the study area due to the prevailing winter and spring westerly winds, which carry away climate moisture before the arrival of summer, thus dehydrating the study area. In contrast to the study of Lutz, et al. [104], regional snow melting supplies a higher soil moisture content in spring; combined with the higher temperatures, it promotes vegetation growth and lightning-fire occurrence. The thermal anomalies follow with the coming summer. The prevalent southeastern wind brings many humid clouds, the low pressure in spring and summer makes the surface heat exchange frequent, and the air molecules move actively.
Clouds of this kind, for warm and dry ground conditions, carry large amounts of precipitation that evaporate before falling to the ground. The hot, dry ground will raise the water vapor to reach saturation. This convective situation promotes lightning occurrences [105]. Conjointly, such weather conditions are highly susceptible to forest fires because there is insufficient precipitation across the canopy layer. Our study region is distributed with a thin soil layer [106]. The water content of the surface soil plays a crucial role in vegetation growth. The increasing soil water content in the spring allows vegetation to grow abundantly. For the topology factors, lightning fires occur more easily on sunny slopes, further supporting the topological impact of fire occurrence by Paulucci, et al. [107]. Only the surface soil water content shows a different periodic trend from the other climate data, among all the fire-related climate conditions. It is more stable than the other conditions, with a lower periodic change. This could result from high fuel coverage adjusting the surface water content [108]. The fire occurrence shows a lagged trend with surface pressure. This region is experiencing a trend of decreasing precipitation accompanied by increasing temperature, which is in line with a previous study [109]. The fluctuating trend of increasing temperature and decreasing precipitation, in recent years, also indicates that the climate stability of the study area is weakening. Compared with the global data, the study area has a higher temperature-increasing speed than in East Asia, higher by about 1 °C. At the same time, the precipitation decreasing trend is similar to the decrease in East Asia [110].
The GTWR model considers both temporal and spatial heterogeneity by comparing the regression results of different models. We think the low fitness is because our lightning fire records are purely natural (in situ survey), but the independent values are extracted from the satellite data. We used the affected area as a dependent variable, while the lightning occurrence has uncertainty. The R2 and the adjusted R2 do not fit the lightning-fire occurrence perfectly, yet our study could utilize the GTWR model to study only the lightning-fire occurrence. Our results could be a reference for other studies.
Nevertheless, we do observe that the GTWR model improved model fitness. The lightning-fire potentiality in this region is concentrated in the northern and central regions. The fire-prone area overlaps with nature reserves, indicating that lightning fires occur more frequently in areas with better vegetation coverage.
It is suggested that the local bureau of forest management should make a policy based on the spatiotemporal variation. Fuel-cleaning activities in non-fire-prone seasons may be organized to lower the fire possibility in fire-prone seasons. In those fire-prone regions, a fast-response firefighting force should be deployed in the fire-prone season. Fire-prevention measures should be taken when the local climate shows long-time fire-prone characteristics.

5. Conclusions

In this paper, by using the GEE platform to assign the historical climate and vegetation data for the 34 years of historical fire records, we analyzed the fire regime in the northern forests of the Great Xing’an Range of Inner Mongolia. We investigated the lightning fire-related climate conditions and compared different models to predict the fire-prone area in our study region. The conclusions are as follows:
(1)
The lightning-fire occurrence in our study region shows an increasing trend of fires more frequently occurring in more affected areas. The fire season is from June to August, with a slightly increasing frequency from south to north. Those regions where fires occur late are more likely to have fires occur frequently.
(2)
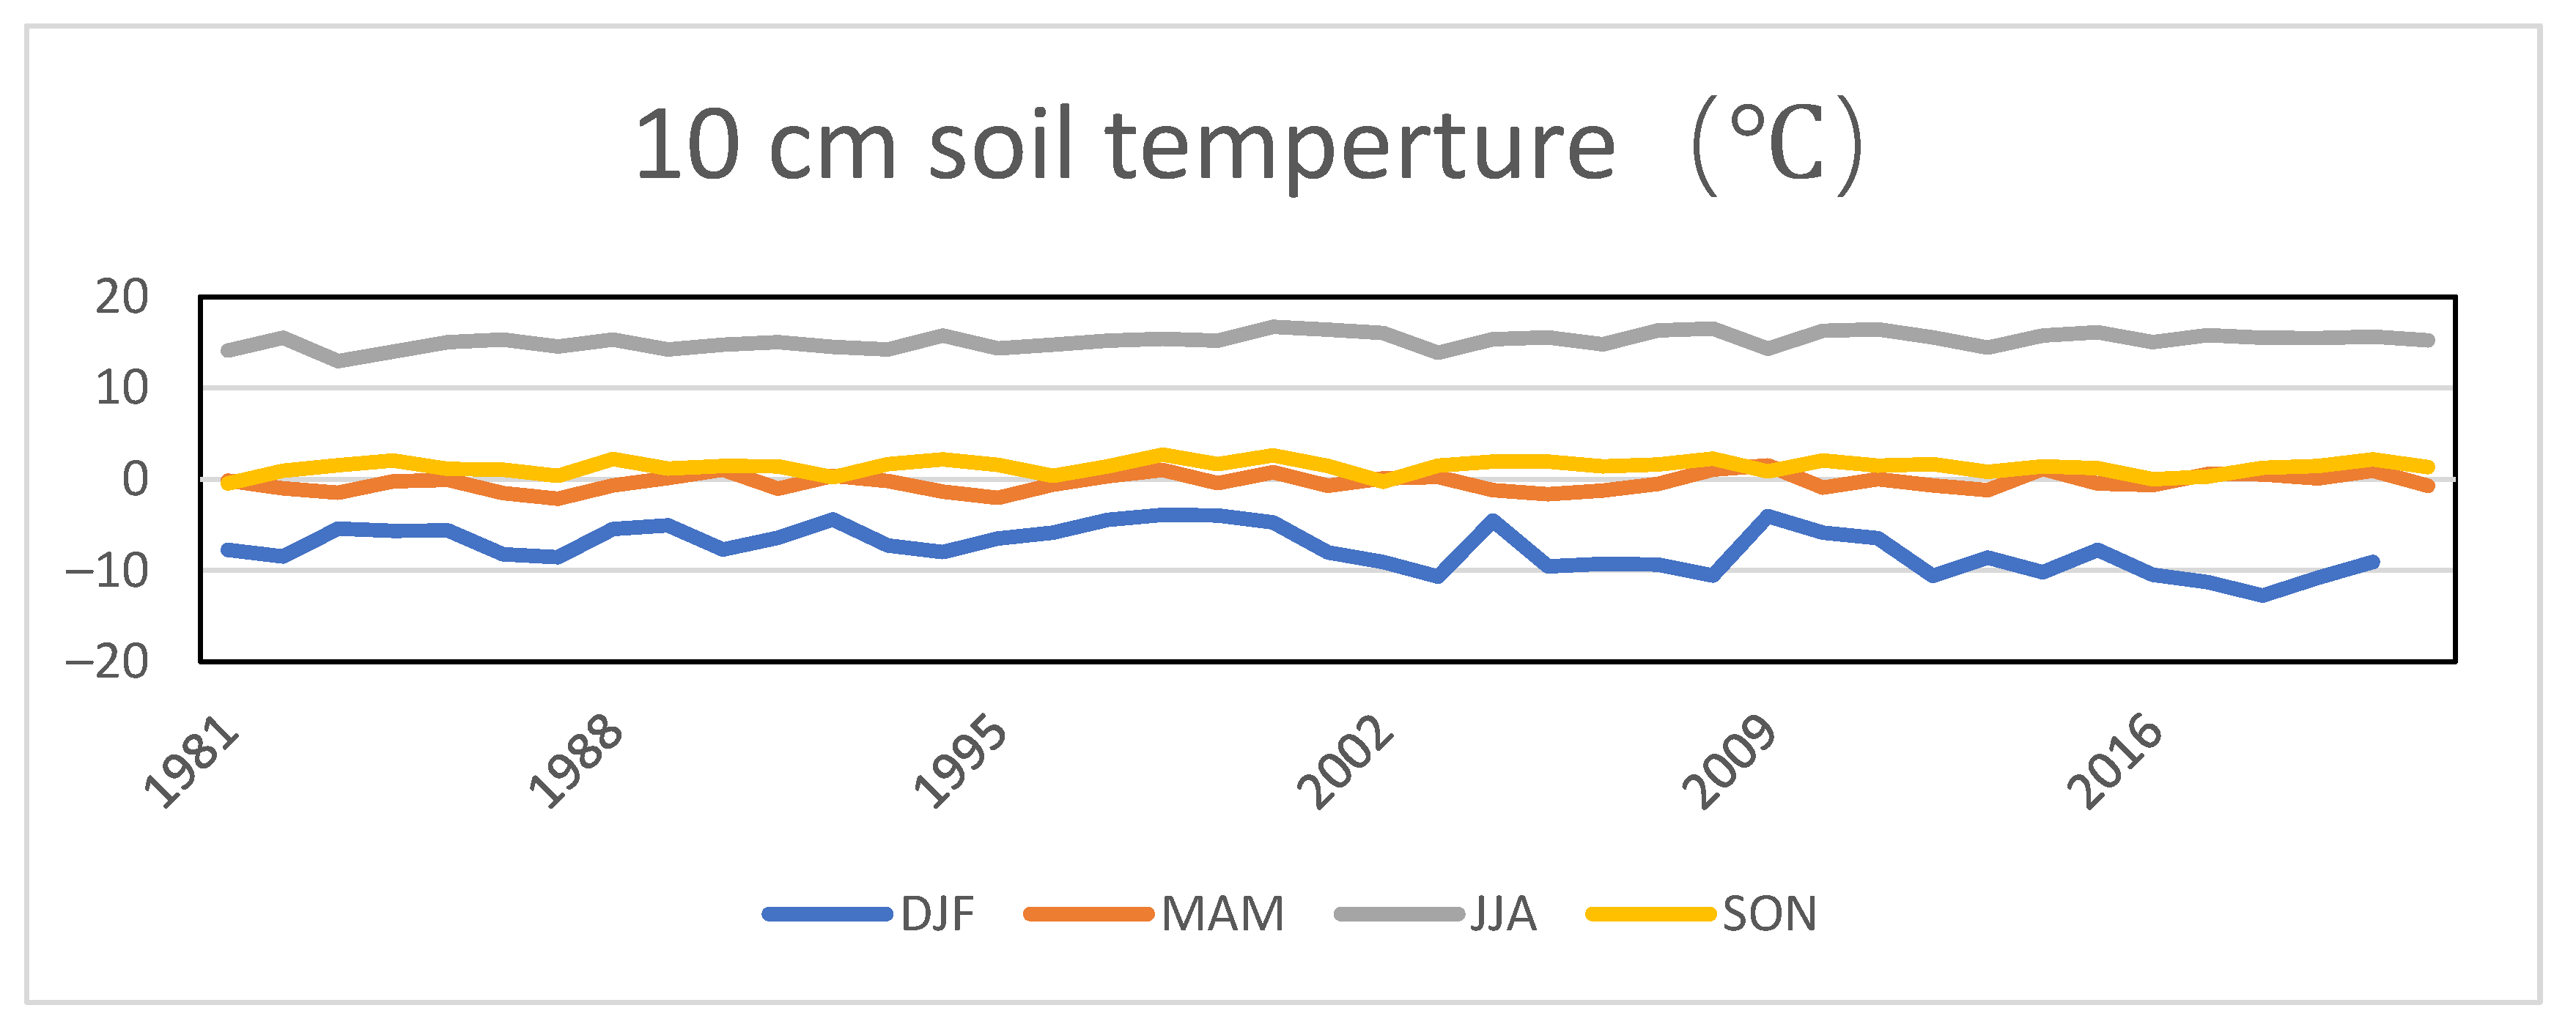
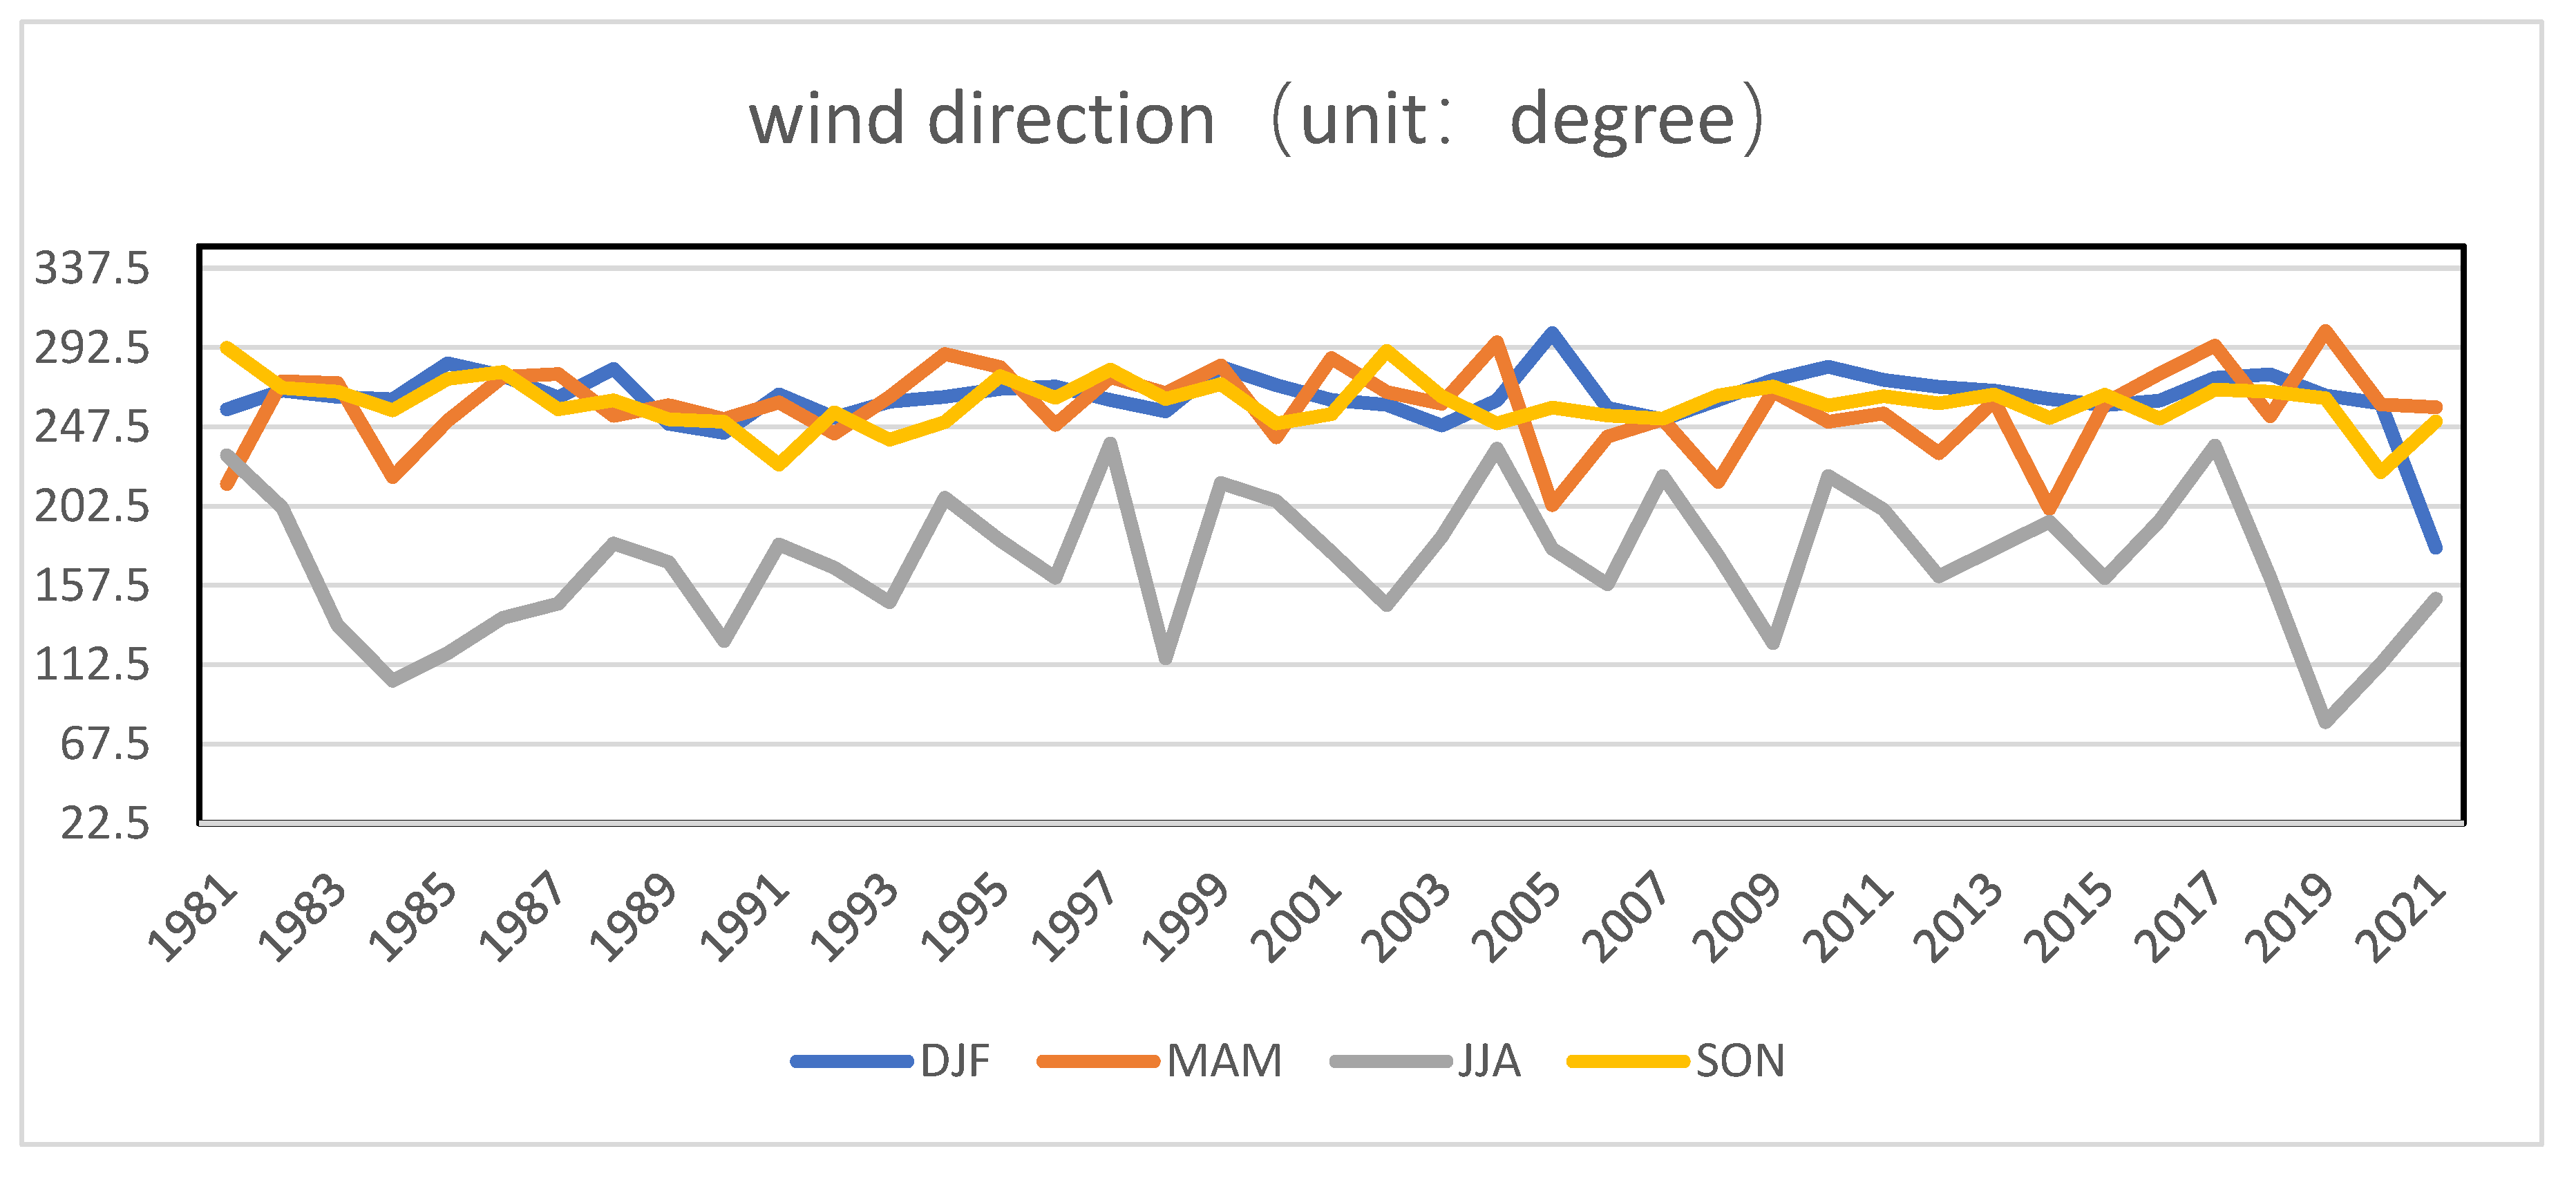
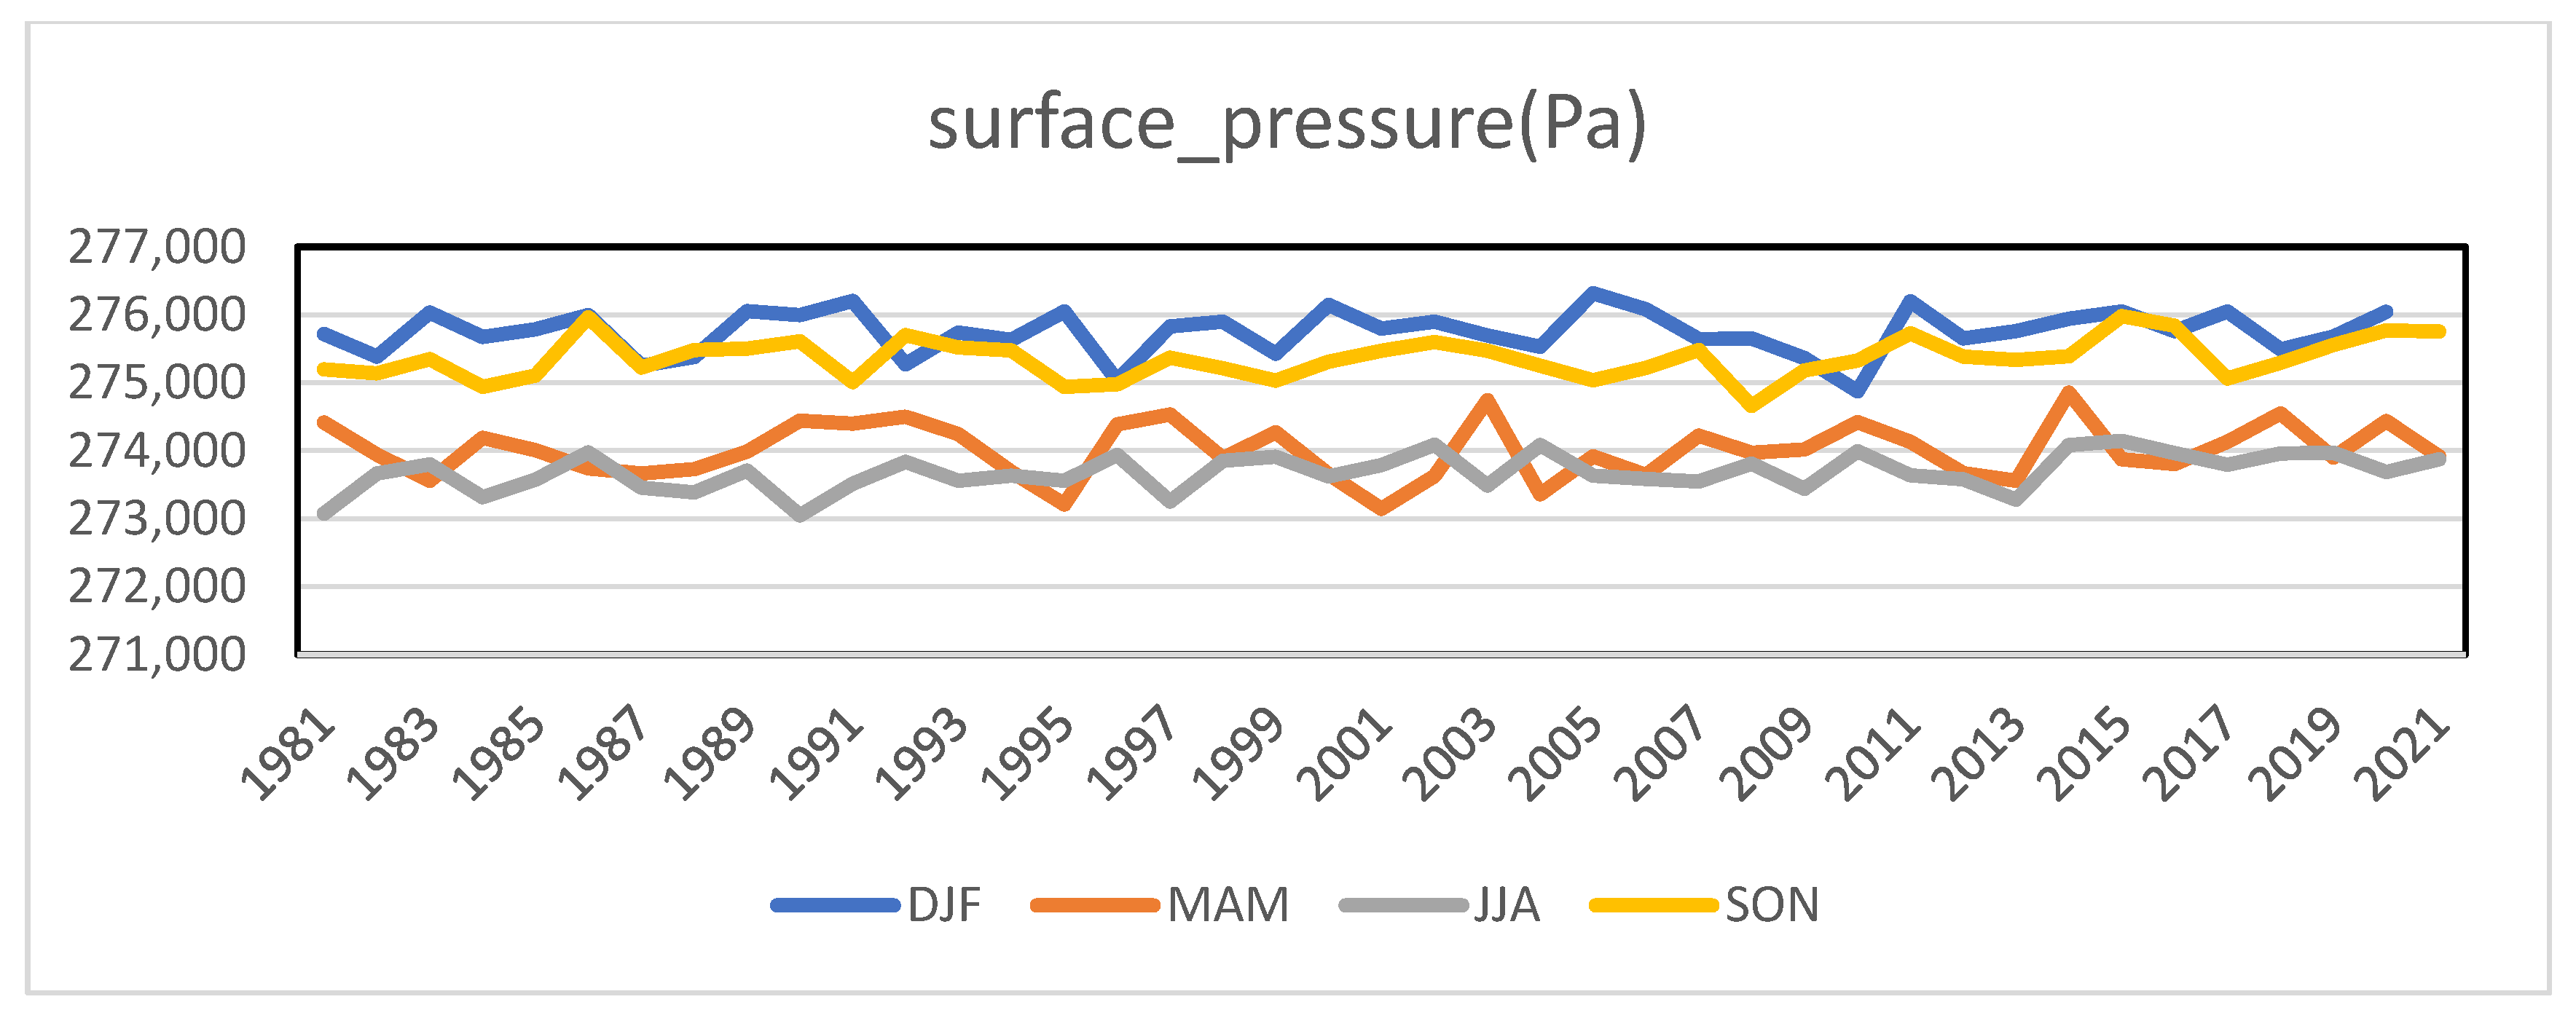
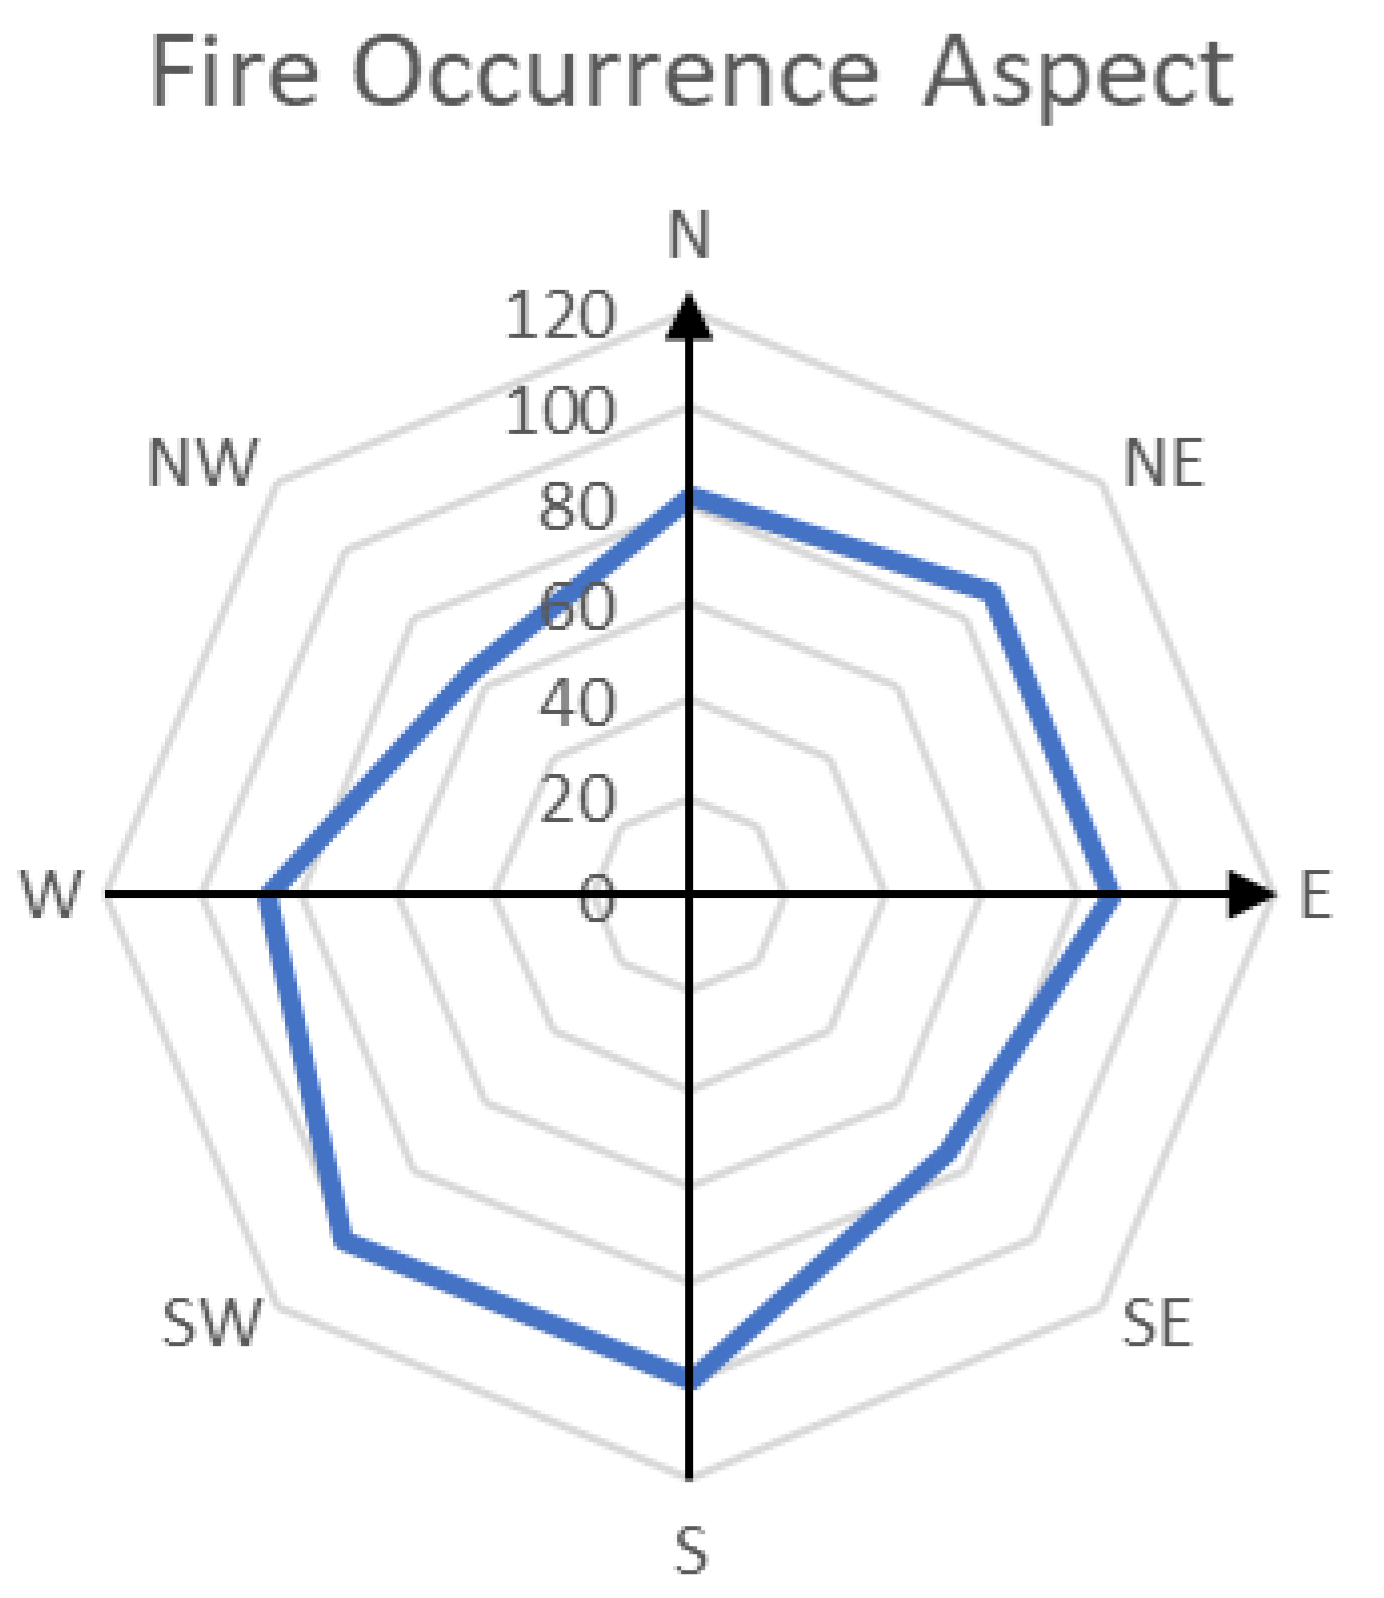
The main natural factors affecting the lightning-fire occurrence are air moisture content, slope, maximum surface air temperature, wind direction, and surface pressure. Perennial high temperatures precede the fire-prone years. Thermal anomalies exist in fire-prone years. The climate in the fire-prone years shows lightning weather: irregular high regional temperatures, the prevailing southeastern wind bringing lots of precipitation, and intense surface pressure. The abnormal soil water content in the spring led to vegetation growth and increased the storage of fuels. The low air water content caused a long-term water deficit and made the local air dry. In a lightning-induced forest fire region, climatic factors also play a dominant role in fire activities. Lightning strikes are an influential factor in fire frequency, while the climatic conditions are the shaping factors for the fire-affected area.
(3)
The seven days of pre-fire data are more accurate for studying lightning-fire occurrence. The GTWR model shows a better model fitness than the other models. Fire-prone areas show a trend of increasing from south to north. In the future, lightning fires will likely occur in this region’s middle northern and eastern parts.

Author Contributions

Conceptualization, Q.Z. and M.L.; methodology, Q.Z.; software, Q.Z.; validation, Q.Z.; formal analysis, Q.Z.; investigation, Q.Z.; resources, Q.Z., M.L. and M.Z.; data curation, Q.Z.; writing—original draft preparation, Q.Z. and M.L.; writing—review and editing, S.H. and H.Y.; visualization, Q.Z.; supervision, M.Z.; project administration, S.H.; funding acquisition, Y.S. and M.Z. All authors have read and agreed to the published version of the manuscript.

Funding

This research was funded by the Inner Mongolia Autonomous Region Science and Technology Achievement Transformation Project (2021CG0002), the National Natural Science Foundation of China (32001325), the Inner Mongolia Natural Science Foundation, China (2020MS03049), and the Inner Mongolia Autonomous Region High-end Foreign Expert Introduction Project.

Institutional Review Board Statement

Not applicable.

Informed Consent Statement

Not applicable.

Data Availability Statement

The raw data and codes used in this paper are available on request from the corresponding author.

Acknowledgments

We sincerely thank the employees of the local forest bureau who helped with the data collection for this study.

Conflicts of Interest

The authors declare no conflict of interest.

References

  1. Wang, J.; Wang, C.; Zang, S. Assessing re-composition of Xing’an larch in boreal forests after the 1987 fire, Northeast China. Remote Sens. 2017, 9, 504. [Google Scholar] [CrossRef] [Green Version]
  2. Hu, T.; Zhou, G. Drivers of lightning- and human-caused fire regimes in the Great Xing’an Mountains. For. Ecol. Manag. 2014, 329, 49–58. [Google Scholar] [CrossRef]
  3. Yang, G.; Di, X.-Y.; Zeng, T.; Shu, Z.; Wang, C.; Yu, H.-Z. Prediction of area burned under climatic change scenarios: A case study in the Great Xing’an Mountains boreal forest. J. For. Res. 2010, 21, 213–218. [Google Scholar] [CrossRef]
  4. Astrup, R.; Bernier, P.Y.; Genet, H.; Lutz, D.A.; Bright, R.M. A sensible climate solution for the boreal forest. Nat. Clim. Chang. 2018, 8, 11–12. [Google Scholar] [CrossRef] [Green Version]
  5. Stocker, T. Climate Change 2013: The Physical Science Basis: Working Group I Contribution to the Fifth Assessment Report of the Intergovernmental Panel on Climate Change; IPCC: Geneva, Switzerland, 2013. [Google Scholar]
  6. Hu, T.; Hu, H.; Li, F.; Zhao, B.; Wu, S.; Zhu, G.; Sun, L. Long-term effects of post-fire restoration types on nitrogen mineralisation in a Dahurian larch (Larix gmelinii) forest in boreal China. Sci. Total Environ. 2019, 679, 237–247. [Google Scholar] [CrossRef] [PubMed]
  7. Cahoon, D.R.; Stocks, B.J.; Levine, J.S.; Cofer, W.R.; Pierson, J.M. Satellite analysis of the severe 1987 forest fires in northern China and southeastern Siberia. J. Geophys. Res. 1994, 99, 18627–18638. [Google Scholar] [CrossRef] [Green Version]
  8. Singleton, M.P.; Thode, A.E.; Meador, A.J.S.; Iniguez, J.M. Increasing trends in high-severity fire in the southwestern USA from 1984 to 2015. For. Ecol. Manag. 2019, 433, 709–719. [Google Scholar] [CrossRef]
  9. Marlon, J.R.; Bartlein, P.J.; Daniau, A.L.; Harrison, S.P.; Maezumi, S.Y.; Power, M.J.; Tinner, W.; Vanniére, B. Global biomass burning: A synthesis and review of Holocene paleofire records and their controls. Quat. Sci. Rev. 2013, 65, 5–25. [Google Scholar] [CrossRef]
  10. Randerson, J.T.; Chen, Y.; van der Werf, G.R.; Rogers, B.M.; Morton, D.C. Global burned area and biomass burning emissions from small fires. J. Geophys. Res. Biogeosci. 2012, 117, G04012. [Google Scholar] [CrossRef] [Green Version]
  11. Gill, A.M.; Stephens, S.L.; Cary, G.J. The worldwide “wildfire” problem. Ecol. Appl. 2013, 23, 438–454. [Google Scholar] [CrossRef] [PubMed]
  12. Ruthrof, K.X.; Fontaine, J.B.; Matusick, G.; Breshears, D.D.; Law, D.J.; Powell, S.; Hardy, G. How drought-induced forest die-off alters microclimate and increases fuel loadings and fire potentials. Int. J. Wildland Fire 2016, 25, 819–830. [Google Scholar] [CrossRef] [Green Version]
  13. Matin, M.A.; Chitale, V.S.; Murthy, M.S.R.; Uddin, K.; Bajracharya, B.; Pradhan, S. Understanding forest fire patterns and risk in Nepal using remote sensing, geographic information system and historical fire data. Int. J. Wildland Fire 2017, 26, 276–286. [Google Scholar] [CrossRef] [Green Version]
  14. Veraverbeke, S.; Rogers, B.M.; Goulden, M.L.; Jandt, R.R.; Miller, C.E.; Wiggins, E.B.; Randerson, J.T. Lightning as a major driver of recent large fire years in North American boreal forests. Nat. Clim. Chang. 2017, 7, 529–534. [Google Scholar] [CrossRef]
  15. Eskelson, B.N.I.; Monleon, V.J. Post-fire surface fuel dynamics in California forests across three burn severity classes. Int. J. Wildland Fire 2018, 27, 114–124. [Google Scholar] [CrossRef]
  16. Artés, T.; Oom, D.; de Rigo, D.; Durrant, T.H.; Maianti, P.; Libertà, G.; San-Miguel-Ayanz, J. A global wildfire dataset for the analysis of fire regimes and fire behaviour. Sci. Data 2019, 6, 296. [Google Scholar] [CrossRef] [Green Version]
  17. Senici, D.; Chen, H.Y.H.; Bergeron, Y.; Cyr, D. Spatiotemporal Variations of Fire Frequency in Central Boreal Forest. Ecosystems 2010, 13, 1227–1238. [Google Scholar] [CrossRef]
  18. Krasnow, K.D.; Fry, D.L.; Stephens, S.L. Spatial, temporal and latitudinal components of historical fire regimes in mixed conifer forests, California. J. Biogeogr. 2017, 44, 1239–1253. [Google Scholar] [CrossRef]
  19. Ager, A.A.; Barros, A.M.G.; Day, M.A.; Preisler, H.K.; Spies, T.A.; Bolte, J. Analyzing fine-scale spatiotemporal drivers of wildfire in a forest landscape model. Ecol. Model. 2018, 384, 87–102. [Google Scholar] [CrossRef]
  20. Azpeleta Tarancón, A.; Fulé, P.Z.; Sánchez Meador, A.J.; Kim, Y.-S.; Padilla, T. Spatiotemporal variability of fire regimes in adjacent Native American and public forests, New Mexico, USA. Ecosphere 2018, 9, e02492. [Google Scholar] [CrossRef] [Green Version]
  21. Rodrigues, M.; San-Miguel-Ayanz, J.; Oliveira, S.; Moreira, F.; Camia, A. An insight into Spatial-Temporal Trends of Fire Ignitions and Burned Areas in the European Mediterranean Countries. Earth Sci. Eng. 2013, 3, 497–505. [Google Scholar]
  22. Fréjaville, T.; Curt, T. Spatiotemporal patterns of changes in fire regime and climate: Defining the pyroclimates of south-eastern France (Mediterranean Basin). Clim. Chang. 2015, 129, 239–251. [Google Scholar] [CrossRef]
  23. Cardil, A.; Vega-García, C.; Ascoli, D.; Molina-Terrén, D.M.; Silva, C.A.; Rodrigues, M. How does drought impact burned area in Mediterranean vegetation communities? Sci. Total Environ. 2019, 693, 133603. [Google Scholar] [CrossRef] [PubMed]
  24. Adámek, M.; Jankovská, Z.; Hadincová, V.; Kula, E.; Wild, J. Drivers of forest fire occurrence in the cultural landscape of Central Europe. Landsc. Ecol. 2018, 33, 2031–2045. [Google Scholar] [CrossRef]
  25. Yi, K.; Bao, Y.; Zhang, J. Spatial distribution and temporal variability of open fire in China. Int. J. Wildland Fire 2017, 26, 122–135. [Google Scholar] [CrossRef] [Green Version]
  26. Jain, P.; Wang, X.; Flannigan, M.D. Trend analysis of fire season length and extreme fire weather in North America between 1979 and 2015. Int. J. Wildland Fire 2017, 26, 1009–1020. [Google Scholar] [CrossRef]
  27. Ying, L.; Han, J.; Du, Y.; Shen, Z. Forest fire characteristics in China: Spatial patterns and determinants with thresholds. For. Ecol. Manag. 2018, 424, 345–354. [Google Scholar] [CrossRef]
  28. Liu, Q.; Shan, Y.; Shu, L.; Sun, P.; Du, S. Spatial and temporal distribution of forest fire frequency and forest area burnt in Jilin Province, Northeast China. J. For. Res. 2018, 29, 1233–1239. [Google Scholar] [CrossRef]
  29. Fang, L.; Yang, J.; White, M.; Liu, Z. Predicting Potential Fire Severity Using Vegetation, Topography and Surface Moisture Availability in a Eurasian Boreal Forest Landscape. Forests 2018, 9, 130. [Google Scholar] [CrossRef] [Green Version]
  30. Hanes, C.C.; Jain, P.; Flannigan, M.D.; Fortin, V.; Roy, G. Evaluation of the Canadian Precipitation Analysis (CaPA) to improve forest fire danger rating. Int. J. Wildland Fire 2017, 26, 509–522. [Google Scholar] [CrossRef]
  31. Nadeem, K.; Taylor, S.W.; Woolford, D.G.; Dean, C.B. Mesoscale spatiotemporal predictive models of daily human- and lightning-caused wildland fire occurrence in British Columbia. Int. J. Wildland Fire 2020, 29, 11–27. [Google Scholar] [CrossRef]
  32. Chowdary, V.; Gupta, M.K.; Singh, R. A Review on Forest Fire Detection Techniques: A Decadal Perspective. Int. J. Eng. Technol. 2018, 7, 12. [Google Scholar] [CrossRef]
  33. Chuvieco, E.; Mouillot, F.; van der Werf, G.R.; San Miguel, J.; Tanase, M.; Koutsias, N.; García, M.; Yebra, M.; Padilla, M.; Gitas, I.; et al. Historical background and current developments for mapping burned area from satellite Earth observation. Remote Sens. Environ. 2019, 225, 45–64. [Google Scholar] [CrossRef]
  34. Gao, C.; He, J.; Zhang, Y.; Cong, J.; Han, D.; Wang, G. Fire history and climate characteristics during the last millennium of the Great Hinggan Mountains at the monsoon margin in northeastern China. Glob. Planet. Chang. 2018, 162, 313–320. [Google Scholar] [CrossRef]
  35. Shekhar, S.; Jiang, Z.; Ali, R.Y.; Eftelioglu, E.; Tang, X.; Gunturi, V.M.; Zhou, X. Spatiotemporal data mining: A computational perspective. ISPRS Int. J. Geo-Inf. 2015, 4, 2306–2338. [Google Scholar] [CrossRef] [Green Version]
  36. Martínez-Fernández, J.; Chuvieco, E.; Koutsias, N. Modelling long-term fire occurrence factors in Spain by accounting for local variations with geographically weighted regression. Nat. Hazards Earth Syst. Sci. 2013, 13, 311–327. [Google Scholar] [CrossRef]
  37. Fuller, D.O.; Fulk, M. Comparison of NOAA-AVHRR and DMSP-OLS for operational fire monitoring in Kalimantan, Indonesia. Int. J. Remote Sens. 2000, 21, 181–187. [Google Scholar] [CrossRef]
  38. Oliveira, S.; Oehler, F.; San-Miguel-Ayanz, J.; Camia, A.; Pereira, J.M.C. Modeling spatial patterns of fire occurrence in Mediterranean Europe using Multiple Regression and Random Forest. For. Ecol. Manag. 2012, 275, 117–129. [Google Scholar] [CrossRef]
  39. Oliveira, S.; Pereira, J.M.C.; San-Miguel-Ayanz, J.; Lourenço, L. Exploring the spatial patterns of fire density in Southern Europe using Geographically Weighted Regression. Appl. Geogr. 2014, 51, 143–157. [Google Scholar] [CrossRef]
  40. Song, C.; Kwan, M.-P.; Zhu, J. Modeling Fire Occurrence at the City Scale: A Comparison between Geographically Weighted Regression and Global Linear Regression. Int. J. Environ. Res. Public Health 2017, 14, 396. [Google Scholar] [CrossRef]
  41. Huang, B.; Wu, B.; Barry, M. Geographically and temporally weighted regression for modeling spatio-temporal variation in house prices. Int. J. Geogr. Inf. Sci. 2010, 24, 383–401. [Google Scholar] [CrossRef]
  42. Bai, Y.; Wu, L.; Qin, K.; Zhang, Y.; Shen, Y.; Zhou, Y. A Geographically and Temporally Weighted Regression Model for Ground-Level PM2.5 Estimation from Satellite-Derived 500 m Resolution AOD. Remote Sens. 2016, 8, 262. [Google Scholar] [CrossRef]
  43. Zhang, W.; Liu, D.; Zheng, S.; Liu, S.; Loáiciga, H.A.; Li, W. Regional Precipitation Model Based on Geographically and Temporally Weighted Regression Kriging. Remote Sens. 2020, 12, 2547. [Google Scholar] [CrossRef]
  44. Song, C.; Kwan, M.-P.; Song, W.; Zhu, J. A Comparison between Spatial Econometric Models and Random Forest for Modeling Fire Occurrence. Sustainability 2017, 9, 819. [Google Scholar] [CrossRef] [Green Version]
  45. Rodrigues, M.; Jiménez, A.; de la Riva, J. Analysis of recent spatial–temporal evolution of human driving factors of wildfires in Spain. Nat. Hazards 2016, 84, 2049–2070. [Google Scholar] [CrossRef] [Green Version]
  46. Chen, Z.; Zhang, X.; He, X.; Davi, N.K.; Cui, M.; Peng, J. Extension of summer (June–August) temperature records for northern Inner Mongolia (1715–2008), China using tree rings. Quat. Int. 2013, 283, 21–29. [Google Scholar] [CrossRef] [Green Version]
  47. Yue, Y.; Liu, H.; Xue, J.; Li, Y.; Guo, W. Ecological indicators of near-surface permafrost habitat at the southern margin of the boreal forest in China. Ecol. Indic. 2020, 108, 105714. [Google Scholar] [CrossRef]
  48. Ouyang, S.; Wang, X.; Wu, Y.; Jianxin Sun, O. Contrasting responses of net primary productivity to inter-annual variability and changes of climate among three forest types in northern China. J. Plant Ecol. 2014, 7, 309–320. [Google Scholar] [CrossRef] [Green Version]
  49. Wang, Z. The Response of Soil Respiration to Wildfire Interference and Burned Area Management in the Permafrost Region of Da xing’an Mountains, Inner Mongolia. Ph.D. Thesis, Inner Mongolia Agricultural University, Hohhot, China, 2020. (In Chinese). [Google Scholar]
  50. Cha, D.; Wang, X.; Kim, J.W. Assessing Lightning and Wildfire Hazard by Land Properties and Cloud to Ground Lightning Data with Association Rule Mining in Alberta, Canada. Sensors 2017, 17, 2413. [Google Scholar] [CrossRef] [Green Version]
  51. Claverie, M.; Vermote, E. NOAA Climate Data Record (CDR) of Leaf Area Index (LAI) and Fraction of Absorbed Photosynthetically Active Radiation (FAPAR); Version 4; NOAA National Centers for Environmental Information, U.S. Department of Commerce: Washington, DC, USA, 2014.
  52. Vermote, E.; Justice, C.; Csiszar, I.; Eidenshink, J.; Myneni, R.; Baret, F.; Masuoka, E.; Wolfe, R.; Claverie, M. NOAA Climate Data Record (CDR) of Normalized Difference Vegetation Index (NDVI); Version 4; NOAA National Centers for Environmental Information, U.S. Department of Commerce: Washington, DC, USA, 2014.
  53. NASA. NASADEM Merged DEM Global 1 Arc Second V001; NASA’s Open Data Portal: Washington, DC, USA, 2020.
  54. Farr, T.G.; Rosen, P.A.; Caro, E.; Crippen, R.; Duren, R.; Hensley, S.; Kobrick, M.; Paller, M.; Rodriguez, E.; Roth, L. The shuttle radar topography mission. Rev. Geophys. 2007, 45, RG2004. [Google Scholar] [CrossRef] [Green Version]
  55. Hersbach, H.; Bell, B.; Berrisford, P.; Hirahara, S.; Horányi, A.; Muñoz-Sabater, J.; Nicolas, J.; Peubey, C.; Radu, R.; Schepers, D. The ERA5 global reanalysis. Q. J. R. Meteorol. Soc. 2020, 146, 1999–2049. [Google Scholar] [CrossRef]
  56. Hoffmann, L.; Günther, G.; Li, D.; Stein, O.; Wu, X.; Griessbach, S.; Heng, Y.; Konopka, P.; Müller, R.; Vogel, B.; et al. From ERA-Interim to ERA5: The considerable impact of ECMWF’s next-generation reanalysis on Lagrangian transport simulations. Atmos. Chem. Phys. 2019, 19, 3097–3124. [Google Scholar] [CrossRef]
  57. Tetzner, D.; Thomas, E.; Allen, C. A Validation of ERA5 Reanalysis Data in the Southern Antarctic Peninsula—Ellsworth Land Region, and Its Implications for Ice Core Studies. Geosciences 2019, 9, 289. [Google Scholar] [CrossRef] [Green Version]
  58. Stephenson, N.L. Climatic control of vegetation distribution: The role of the water balance. Am. Nat. 1990, 135, 649–670. [Google Scholar] [CrossRef]
  59. Huo, Z.; Dai, X.; Feng, S.; Kang, S.; Huang, G. Effect of climate change on reference evapotranspiration and aridity index in arid region of China. J. Hydrol. 2013, 492, 24–34. [Google Scholar] [CrossRef]
  60. Lawrence, M.G. The relationship between relative humidity and the dewpoint temperature in moist air: A simple conversion and applications. Bull. Am. Meteorol. Soc. 2005, 86, 225–234. [Google Scholar] [CrossRef]
  61. Molinie, G.; Jacobson, A.R. Cloud-to-ground lightning and cloud top brightness temperature over the contiguous United States. J. Geophys. Res. Atmos. 2004, 109. [Google Scholar] [CrossRef]
  62. Barthe, C.; Deierling, W.; Barth, M.C. Estimation of total lightning from various storm parameters: A cloud-resolving model study. J. Geophys. Res. Atmos. 2010, 115. [Google Scholar] [CrossRef]
  63. Couto, F.T.; Iakunin, M.; Salgado, R.; Pinto, P.; Viegas, T.; Pinty, J.-P. Lightning modelling for the research of forest fire ignition in Portugal. Atmos. Res. 2020, 242, 104993. [Google Scholar] [CrossRef]
  64. Karagiannidis, A.; Lagouvardos, K.; Lykoudis, S.; Kotroni, V.; Giannaros, T.; Betz, H.-D. Modeling lightning density using cloud top parameters. Atmos. Res. 2019, 222, 163–171. [Google Scholar] [CrossRef]
  65. Heidinger, A.; Foster, M.J.; Walther, A.; Zhao, X. NOAA Climate Data Record (CDR) of Cloud Properties from AVHRR Pathfinder Atmospheres-Extended (PATMOS-x); Version 5.3; NOAA National Centers for Environmental Information, U.S. Department of Commerce: Washington, DC, USA, 2014.
  66. Heidinger, A.K.; Foster, M.J.; Walther, A.; Zhao, X. The Pathfinder Atmospheres–Extended AVHRR Climate Dataset. Bull. Am. Meteorol. Soc. 2014, 95, 909–922. [Google Scholar] [CrossRef]
  67. Heidinger, A.; Wanzong, S.; Li, Y. NOAA GOES-R AWG Cloud Height Algorithm (ACHA). In Proceedings of the 12th International Winds Workshop, Copenhagen, Denmark, 16–20 June 2014. [Google Scholar]
  68. Malcheva, K.; Bocheva, L.; Marinova, T. Mapping temperature and precipitation climate normals over Bulgaria by using ArcGIS Pro 2.4. Bulg. J. Meteorol. Hydrol. 2020, 23, 61–77. [Google Scholar]
  69. Pimpler, E. Spatial Analytics with ArcGIS; Packt Publishing Ltd.: Birmingham, UK, 2017. [Google Scholar]
  70. Feng, Y.; Tong, X. Using exploratory regression to identify optimal driving factors for cellular automaton modeling of land use change. Environ. Monit. Assess. 2017, 189, 515. [Google Scholar] [CrossRef] [PubMed]
  71. Carvalho, A.; Flannigan, M.D.; Logan, K.; Miranda, A.I.; Borrego, C. Fire activity in Portugal and its relationship to weather and the Canadian Fire Weather Index System. Int. J. Wildland Fire 2008, 17, 328–338. [Google Scholar] [CrossRef]
  72. Dimitrakopoulos, A.P.; Bemmerzouk, A.M.; Mitsopoulos, I.D. Evaluation of the Canadian fire weather index system in an eastern Mediterranean environment. Meteorol. Appl. 2011, 18, 83–93. [Google Scholar] [CrossRef]
  73. Fréjaville, T.; Curt, T. Seasonal changes in the human alteration of fire regimes beyond the climate forcing. Environ. Res. Lett. 2017, 12, 035006. [Google Scholar] [CrossRef]
  74. Daniau, A.L.; Harrison, S.P.; Bartlein, P.J. Fire regimes during the Last Glacial. Quat. Sci. Rev. 2010, 29, 2918–2930. [Google Scholar] [CrossRef]
  75. Liu, Z.; Yang, J.; Chang, Y.; Weisberg, P.J.; He, H.S. Spatial patterns and drivers of fire occurrence and its future trend under climate change in a boreal forest of Northeast China. Glob. Chang. Biol. 2012, 18, 2041–2056. [Google Scholar] [CrossRef]
  76. Crimmins, M.A.; Comrie, A.C. Interactions between antecedent climate and wildfire variability across south-eastern Arizona. Int. J. Wildland Fire 2004, 13, 455–466. [Google Scholar] [CrossRef] [Green Version]
  77. Pausas, J.G. Changes in Fire and Climate in the Eastern Iberian Peninsula (Mediterranean Basin). Clim. Chang. 2004, 63, 337–350. [Google Scholar] [CrossRef]
  78. Swetnam, T.W.; Baisan, C.H. Historical Fire Regime Patterns in the Southwestern United States Since AD 1700. In Fire Effects in Southwestern Forests, Proceedings of the Second La Mesa Fire Symposium, Los Alamos, NM, USA, 29–31 March 1994; U.S. Department of Agriculture, Rocky Mountain Forest and Range Experiment Station: Fort Collins, CO, USA, 1996; p. 11. [Google Scholar]
  79. Torrence, C.; Compo, G.P. A practical guide to wavelet analysis. Bull. Am. Meteorol. Soc. 1998, 79, 61–78. [Google Scholar] [CrossRef]
  80. Rösch, A.; Schmidbauer, H. WaveletComp 1.1: A Guided Tour through the R Package; 2016. Available online: http://www.hsstat.com/projects/WaveletComp/WaveletComp_guided_tour.pdf (accessed on 18 March 2018).
  81. Fotheringham, A.S.; Crespo, R.; Yao, J. Geographical and Temporal Weighted Regression (GTWR). Geogr. Anal. 2015, 47, 431–452. [Google Scholar] [CrossRef] [Green Version]
  82. Groemping, U. Relative Importance for Linear Regression in R: The Package relaimpo. J. Stat. Softw. 2006, 17, 1–27. [Google Scholar] [CrossRef]
  83. Grömping, U. Variable Importance Assessment in Regression: Linear Regression versus Random Forest. Am. Stat. 2009, 63, 308–319. [Google Scholar] [CrossRef]
  84. Li, W.; Xu, Q.; Yi, J.; Liu, J. Prediction and Evaluation of Forest Fire in Yunnan of China Based on Geographically Weighted Logistic Regression Model. 2021; preprint. [Google Scholar]
  85. Yilmaz, I. A research on the accuracy of landform volumes determined using different interpolation methods. Sci. Res. Essays 2009, 4, 1248–1259. [Google Scholar]
  86. Population and Races in Genhe. Available online: http://www.genhe.gov.cn/News/show/935432.html (accessed on 1 May 2022).
  87. Bai, X.P.; Chang, Y.X.; Zhang, X.L.; Ma, Y.J.; Wu, T.; Li, J.X.; Chen, Z.J. Impacts of rapid warming on radial growth of Larix gmelinii on two typical micro-topographies in the recent 30 years. Ying Yong Sheng Tai Xue Bao 2016, 27, 3853–3861. [Google Scholar]
  88. Xiao-Ying, W.; Chun-Yu, Z.; Qing-Yu, J. Impacts of Climate Change on Forest Ecosystems in Northeast China. Adv. Clim. Chang. Res. 2013, 4, 230–241. [Google Scholar] [CrossRef]
  89. Chang, Y.; He, H.S.; Hu, Y.; Bu, R.; Li, X. Historic and current fire regimes in the Great Xing’an Mountains, northeastern China: Implications for long-term forest management. For. Ecol. Manag. 2008, 254, 445–453. [Google Scholar] [CrossRef]
  90. Chang, Y.; Zhu, Z.; Bu, R.; Chen, H.; Feng, Y.; Li, Y.; Hu, Y.; Wang, Z. Predicting fire occurrence patterns with logistic regression in Heilongjiang Province, China. Landsc. Ecol. 2013, 28, 1989–2004. [Google Scholar] [CrossRef]
  91. Wei, X.; Wang, G.; Chen, T.; Hagan, D.F.T.; Ullah, W. A Spatio-Temporal Analysis of Active Fires over China during 2003–2016. Remote Sens. 2020, 12, 1787. [Google Scholar] [CrossRef]
  92. Zhao, F.; Liu, Y.; Shu, L. Change in the fire season pattern from bimodal to unimodal under climate change: The case of Daxing’anling in Northeast China. Agric. For. Meteorol. 2020, 291, 108075. [Google Scholar] [CrossRef]
  93. Dissing, D.; Verbyla, D.L. Spatial patterns of lightning strikes in interior Alaska and their relations to elevation and vegetation. Can. J. For. Res. 2003, 33, 770–782. [Google Scholar] [CrossRef]
  94. Williams, E.; Guha, A.; Boldi, R.; Christian, H.; Buechler, D. Global lightning activity and the hiatus in global warming. J. Atmos. Sol. Terr. Phys. 2019, 189, 27–34. [Google Scholar] [CrossRef]
  95. Jones, M.W.; Abatzoglou, J.T.; Veraverbeke, S.; Andela, N.; Lasslop, G.; Forkel, M.; Smith, A.J.P.; Burton, C.; Betts, R.A.; van der Werf, G.R.; et al. Global and Regional Trends and Drivers of Fire Under Climate Change. Rev. Geophys. 2022, 60, e2020RG000726. [Google Scholar] [CrossRef]
  96. Kang, Y.; Guo, E.; Wang, Y.; Bao, Y.; Bao, Y.; Mandula, N. Monitoring Vegetation Change and Its Potential Drivers in Inner Mongolia from 2000 to 2019. Remote Sens. 2021, 13, 3357. [Google Scholar] [CrossRef]
  97. Cattau, M.E.; Wessman, C.; Mahood, A.; Balch, J.K. Anthropogenic and lightning-started fires are becoming larger and more frequent over a longer season length in the U.S.A. Glob. Ecol. Biogeogr. 2020, 29, 668–681. [Google Scholar] [CrossRef]
  98. Dijkstra, J.; Durrant, T.; San-Miguel-Ayanz, J.; Veraverbeke, S. Anthropogenic and Lightning Fire Incidence and Burned Area in Europe. Land 2022, 11, 651. [Google Scholar] [CrossRef]
  99. Styger, J.; Marsden-Smedley, J.; Kirkpatrick, J. Changes in Lightning Fire Incidence in the Tasmanian Wilderness World Heritage Area, 1980–2016. Fire 2018, 1, 38. [Google Scholar] [CrossRef] [Green Version]
  100. Guo, F.; Wang, G.; Su, Z.; Liang, H.; Wang, W.; Lin, F.; Liu, A. What drives forest fire in Fujian, China? Evidence from logistic regression and Random Forests. Int. J. Wildland Fire 2016, 25, 505–519. [Google Scholar] [CrossRef]
  101. Flannigan, M.D.; Krawchuk, M.A.; de Groot, W.J.; Wotton, B.M.; Gowman, L.M. Implications of changing climate for global wildland fire. Int. J. Wildland Fire 2009, 18, 483–507. [Google Scholar] [CrossRef]
  102. Kalashnikov, D.A. A 30-Year Climatology of Meteorological Conditions Associated with Lightning Days in the Western United States. Ph.D. Dissertation, Portland State University, Portland, OR, USA, 2019. [Google Scholar]
  103. Calef, M.P.; Varvak, A.; McGuire, A.D. Differences in Human versus Lightning Fires between Urban and Rural Areas of the Boreal Forest in Interior Alaska. Forests 2017, 8, 422. [Google Scholar] [CrossRef] [Green Version]
  104. Lutz, J.A.; van Wagtendonk, J.W.; Thode, A.E.; Miller, J.D.; Franklin, J.F. Climate, lightning ignitions, and fire severity in Yosemite National Park, California, USA. Int. J. Wildland Fire 2009, 18, 765–774. [Google Scholar] [CrossRef]
  105. Fill, J.M.; Davis, C.N.; Crandall, R.M. Climate change lengthens southeastern USA lightning-ignited fire seasons. Glob. Chang. Biol. 2019, 25, 3562–3569. [Google Scholar] [CrossRef]
  106. Zhang, H.-W.; Wang, X.-Y.; Zhao, X.; Liu, P.-F. In-situ experiment investigations of hydrothermal process of highway in deep seasonal frozen soil regions of Inner Mongolia, China. J. Cent. South Univ. 2020, 27, 2082–2093. [Google Scholar] [CrossRef]
  107. Paulucci, T.B.; França, G.B.; Libonati, R.; Ramos, A.M. Long-Term Spatial–Temporal Characterization of Cloud-to-Ground Lightning in the Metropolitan Region of Rio de Janeiro. Pure Appl. Geophys. 2019, 176, 5161–5175. [Google Scholar] [CrossRef]
  108. Flannigan, M.D.; Wotton, B.M.; Marshall, G.A.; de Groot, W.J.; Johnston, J.; Jurko, N.; Cantin, A.S. Fuel moisture sensitivity to temperature and precipitation: Climate change implications. Clim. Chang. 2016, 134, 59–71. [Google Scholar] [CrossRef] [Green Version]
  109. Tian, X.; Cui, W.; Shu, L.; Zong, X. Effects of Climate Change on Burn Probability of Forests in Daxing’anling. Forests 2019, 10, 611. [Google Scholar] [CrossRef]
  110. World Meteorological Organization (WMO). State of the Global Climate 2020 (WMO-No. 1264); WMO: Geneva, Switzerland, 2021. [Google Scholar]
Figure 1. Study region maps: upper left is location of study region; lower left is historical monthly precipitation and temperature; right is lightning-induced fires and historical (2001–2021) vegetation loss (LF: lightning-caused fires, SR: study region, NB: national border, VC_loss: vegetation loss).
Forests 13 01867 g001
Figure 2. An overview of the proposed methodology.
Forests 13 01867 g002
Figure 3. Fire-occurrence monthly counts.
Forests 13 01867 g003
Figure 4. Lightning-fire distribution: (A), rasterized lightning-fire-affected area; (B), rasterized lightning-fire DOY (day of the year) distribution; (C), rasterized lightning-fire density.
Forests 13 01867 g004
Figure 5. Regional yearly air temperature and precipitation change.
Forests 13 01867 g005
Figure 6. Yearly change of seasonal surface soil temperature.
Forests 13 01867 g006
Figure 7. Seasonal wind direction.
Forests 13 01867 g007
Figure 8. Yearly change of seasonal climate water content.
Forests 13 01867 g008
Figure 9. Yearly change of surface 10 cm soil water content.
Forests 13 01867 g009
Figure 10. Yearly surface pressure.
Forests 13 01867 g010
Figure 11. Fire-occurrence aspect account.
Forests 13 01867 g011
Figure 12. Wavelet transform of lightning-fire occurrence.
Forests 13 01867 g012
Figure 13. Morlet wavelet transformations of climate conditions.
Forests 13 01867 g013
Figure 14. Prediction of large lightning fire.
Forests 13 01867 g014
Figure 15. Scatter plot matrix between fire frequency and influential factors (Fires represents fire frequency, Ta is the mean air temperature at 2 m, and other abbreviated names can be found in Table 1, number refers Pearson correlation values, ** means p-values < 0.01, *** means means p-values < 0.001).
Forests 13 01867 g015
Table 1. Exploratory factors.
AbbreviationUnitsExplainSource
LAI(0–100)Leaf Area IndexNOAA CDR AVHRR
NDVI(−1,1)Normalized Difference Vegetation Index
ELEmElevationNASA DEM
SLOPE0°–90°Slope
Aspect0°–90°Aspect
RHg/kgRelative humidityERA5-Land Hourly
WSm/sWind speed
AI%Arid index
CEgCanopy evaporation
CWDgClimatic water dificit
DTKDew point temperature
ROFFmSum of surface and subsurface runoff
STL1K0–10 cm surface soil temperature
STL2K10–20 cm surface soil temperature
SUBROFFmUnderground water runoff
SNRJ/m2Surface net solar radiation
STRJ/m2Surface net thermal radiation
SHFJ/m2Surface latent heat flux
SPPaSurface pressure
SURROFFmSurface runoff
TEMPMEAN2KMean temperature of air at 2 m above surface
TEMPMAX2KMax temperature of air at 2 m above surface
TEMPMIN2KMin temperature of air at 2 m above surface
Total_evaporgTotal evaporation
Total_precmTotal precipation
VSWATERL1m3/m30–7 cm surface soil water volume
VSWATERL2m3/m37–28 cm surface soil water volume
WD0–360°Wind direction
CTHkmCloud top heightNOAA CDR PATMOSX v53
CODCloud optical depth
CTPhPaCloud top pressure
CTTKCloud top temperture
LD_CTHfl/km2CTH-derived lightning density
LD_CODfl/km2COD-derived lightning density
LD_CTPfl/km2CTP-derived lightning density
Table 2. Exploring results of fire-affected area.
TimeFactors’ CombinationAdjust R2VIF < 7.5AIC
1d_preAspect + climate water + elevation + surface pressure + minimum air temperature + 10 cm volumetric soil water + wind direction0.052.459767.52
7d_preAspect + climate water + surface pressure + maximum air temperature + minimum air temperature + wind direction0.053.495542.69
14d_preAspect + canopy evaporation + climatic water + elevation + surface pressure + mean air temperature + maximum air temperature + 10 cm volumetric soil water + wind direction0.056.879765.01
30d_preArid index + Aspect + climatic water + elevation + surface pressure + surface runoff + mean air temperature + maximum air temperature + wind direction0.056.218382.2
Table 3. Comparison of different models.
ModelAICR2Adjusted R2
OLS9884.3120.0400.031
GWR9891.9900.1010.093
TWR9881.8100.1140.106
GTWR9858.8000.1610.153
Publisher’s Note: MDPI stays neutral with regard to jurisdictional claims in published maps and institutional affiliations.

