Review

Research Opportunity on Fractional Cover of Forest: A Bibliometric Review

by
Norzalyta Mohd Ghazali
1,
Mohd Nizam Mohd Said
1,2,
Wan Shafrina Wan Mohd Jaafar
2,*,
Aisyah Marliza Muhmad Kamarulzaman
2 and
Siti Nor Maizah Saad
2,3
1
Department of Biological Sciences and Biotechnology, Faculty of Science and Technology (FST), Universiti Kebangsaan Malaysia, Bangi 43600, Selangor, Malaysia
2
Earth Observation Centre, Institute of Climate Change (IPI), Universiti Kebangsaan Malaysia, Bangi 43600, Selangor, Malaysia
3
Department of Surveying Science and Geomatics, Faculty of Architecture, Planning & Surveying, MARA University of Technology, Perlis Branch, Arau Campus, Arau 02600, Perlis, Malaysia
*
Author to whom correspondence should be addressed.
Forests 2022, 13(10), 1664; https://doi.org/10.3390/f13101664
Submission received: 1 September 2022 / Revised: 28 September 2022 / Accepted: 6 October 2022 / Published: 10 October 2022
(This article belongs to the Special Issue Forest Vegetation Monitoring through Remote Sensing Technologies)

Abstract

:
Forests are threatened globally by deforestation. Forest restoration at the landscape scale can reduce these threats. Ground-based and remote sensing inventories are needed to assess restoration success. Fractional canopy cover estimated from forest algorithms can be used to monitor forest loss, growth, and health via remote sensing. Various studies on the fractional cover of forest have been published. However, none has yet conducted a bibliometric analysis. Bibliometrics provide a detailed examination of a topic, pointing academics to new research possibilities. To the best of the authors’ knowledge, this is the first bibliometric study screening publications to assess the incidence of studies of the fractional cover of forests in Web of Science (WoS) and Scopus databases. This research analyses WoS and Scopus publications on the fractional cover of forest dating from 1984 to 2021. The current study uses the Bibliometrix R-package for citation metrics and analysis. The first paper on the fractional cover of forest was published in 1984 and annual publication numbers have risen since 2002. USA and China were the most active countries in the study of fractional cover of forests. A total of 955 documents from 69 countries with multiple languages were retrieved. Vegetation, forestry, and remote sensing were the most discussed topics. Findings suggest more studies on the fractional cover of forests algorithms should be conducted in tropical forest from developing countries.

1. Introduction

More than a third (31%) or 4.06 billion hectares of the land area is covered by forests [1]. Forests can be viewed and valued from a variety of perspectives such as they can be a source of timber, an ecosystem made up of trees and many other types of organisms, a home for indigenous people, a place to store carbon, a source of many ecosystem services, or all of the above at the same time [2].
In recent times, forests are confronted with a wide range of threats and stressors, causing them to become increasingly at risk due to deforestation [3], drought [4], climate change [5], forest fire [6], invasive species [7], pests and pathogens attack [8] and air pollution [9]. Globally, deforestation is the most severe threat to forests [10]. The FAO data from 2015 to 2020 shows that deforestation was estimated to be 10 million hectares per year [1]. Deforestation has an impact on the provision of critical ecosystem services such as biodiversity preservation [11], climate regulation [12], carbon sequestration [13], and water supply security [14,15].
Forest Landscape Restoration (FLR) is required to mitigate deforestation and promote multifunctional and sustainable landscapes [16]. The FLR activities are in line with Sustainable Development Goals 2030 (SDGs). The FLR processes and interventions are expected to be integral components of the global climate-change programs to reduce greenhouse gas emissions and increase carbon storage and in national plans to adapt forest landscapes to changing climatic and environmental conditions [17].
These SDGs and other related policies depend on the availability of timely and reliable forest data by implementing monitoring and assessing forest loss, gain, and health [18]. Therefore, forest management requires continuous information about forest structure and resources through inventories. Field-based inventories are gathered through ground-based surveys but increasingly rely on remote sensing technologies [19]. However, the benefits of integrating field-based inventories and remote sensing technology are numerous, including lower costs due to reduced sampling intensity, visual records of the situation and changes, increased capacity in mapping, monitoring, reporting, and more harmonised information assessment [20].
Remote sensing is an important tool for monitoring in real-time and providing an accurate picture of the field with a high revisit frequency and accuracy. Remote sensing, in conjunction with other modern techniques, such as machine learning, various algorithms for modelling, global positioning systems and geographical information systems, plays a significant role in assessing and managing forest activities [21].
For this reason, remote sensing has been used in a wide range of forest ecology and management applications, from tracking land cover changes such as habitat fragmentation [22] and estimating forest biophysical [23] and chemical properties [24]. All the critical data and information gathered from remote sensing will support forest managers in forest operational planning and sustainable management and benefit the countries in developing relevant policies.
The algorithm for determining fractional cover is one of the methods used in remote sensing for monitoring and assessing forest loss, gain, and health through the forest canopy [25]. The amount of foliage (from the forest canopy) visible from the nadir is vital for land surface conditions [26,27]. Its presence also serves as a proxy for various plant functions and characteristics [28]. The fractional cover can inform various analyses involving a wide range of ecological processes from flora to fauna dynamics [29], forest growth [30], food web structure [31], vegetation studies [32], land management practices [33], hydrology [34], dynamics of soil carbon [33], disaster risk [35] and drought monitoring [36]. Additionally, these quantities capture the biophysical consequences of several disturbances caused by natural and human drivers [37,38].
The fractional cover values acts as input parameters for the biosphere for simulating the exchange between the land surface and the atmospheric boundary layer using the soil, vegetation and atmosphere transfer model [39]. The amount of fractional cover of forest devoted to photosynthesis vegetations (green leaves), non-photosynthesis vegetation (above ground dead biomass, litter and wood), and bare substrate is a key determinant of ecosystem physiology, structure, biomass, and biogeochemical stocks [37]. Therefore, estimating the fractional cover of forest in a single coarse pixel of remote sensing data is a feasible method for monitoring long-term and accurate regional forest cover changes [40].
Recently, bibliometric analysis has become an essential part of a broader ’‘toolbox’ of evaluation techniques available to R&D policymakers to assist decision-making [41]. Researchers may use bibliometrics to gain an overview of their research field and its connections with neighbouring research areas. Bibliometrics is also frequently used in research management and evaluation [42]. This method is an inferential strategy that derives the academic quality of scholarly publications from their quantification [43].
Several studies and findings on the fractional cover of forest have already been published. Nonetheless, no bibliometric study has yet been undertaken. Such studies provide a detailed overview of an issue, directing academics to new research fields and contributions. To the best of the authors’ knowledge, this is the first bibliometric screening study of publications to assess the literature on fractional forest cover algorithms in the Web of Science (WoS) and Scopus databases.
This study aims to understand the fractional cover of forests across the globe by conducting a bibliometric analysis to address the following research questions:
i.
What is the current trend and significance of publications on the fractional cover of forests studies?
ii.
Which countries and authors are the most productive and prominent in the fractional cover of forest studies?
iii.
What are the frequent topics among scholars regarding the fractional cover of forests?
This paper is divided into three sections that detail the materials and methods, results and discussion, and a conclusion with interpretation and a discussion of the various issues raised in response to the research questions.

2. Materials and Methods

2.1. Documents Searching

In this study, data were collected from two major global citation databases, Web of Science (WoS) and Scopus, to analyse collected publications on the fractional cover of the forest. This study examined all types of publications published in both databases between 1984 and 2021.
The Bibliometrix R package was used to merge extracted WoS and Scopus databases and remove duplicate documents. A total of 955 publications relating to the fractional cover of the forest were retrieved. The extracted file was uploaded into the Biblioshiny application (using the R-studio cloud) to classify and analyse the trends in research and selected publication attributes from both databases. The Bibliometrix R package is a one-of-a-kind programme written in the R programming language for statistical computing and graphics. Because it is an object-oriented and functional programming language, R is uncomplicated to automate analyses and develop new functions [44].
The search term “fractional cover forest” in all fields (WoS) and the article’s title (Scopus) were used to search relevant articles published in any language related to the fractional cover of forest research. Article titles capture the researcher’s intent and inform the reader about what to expect in the manuscript. A title is created and published to entice others to read the research [45,46].
Figure 1 shows our methodology adopted for publication searching. All the publications were subjected to bibliometric analysis. The following software was used to obtain the results:
i.
Bibliometrix 3.1 R-package for citation metrics and analysis [44].
ii.
VOSviewer version 1.6.16 (www.vosviewer.com, accessed on 15 May 2022) to create and visualise the bibliometric networks.
iii.
Microsoft Excel 365 was used to compute each publication’s citation frequency and percentage and create appropriate graphical representations.
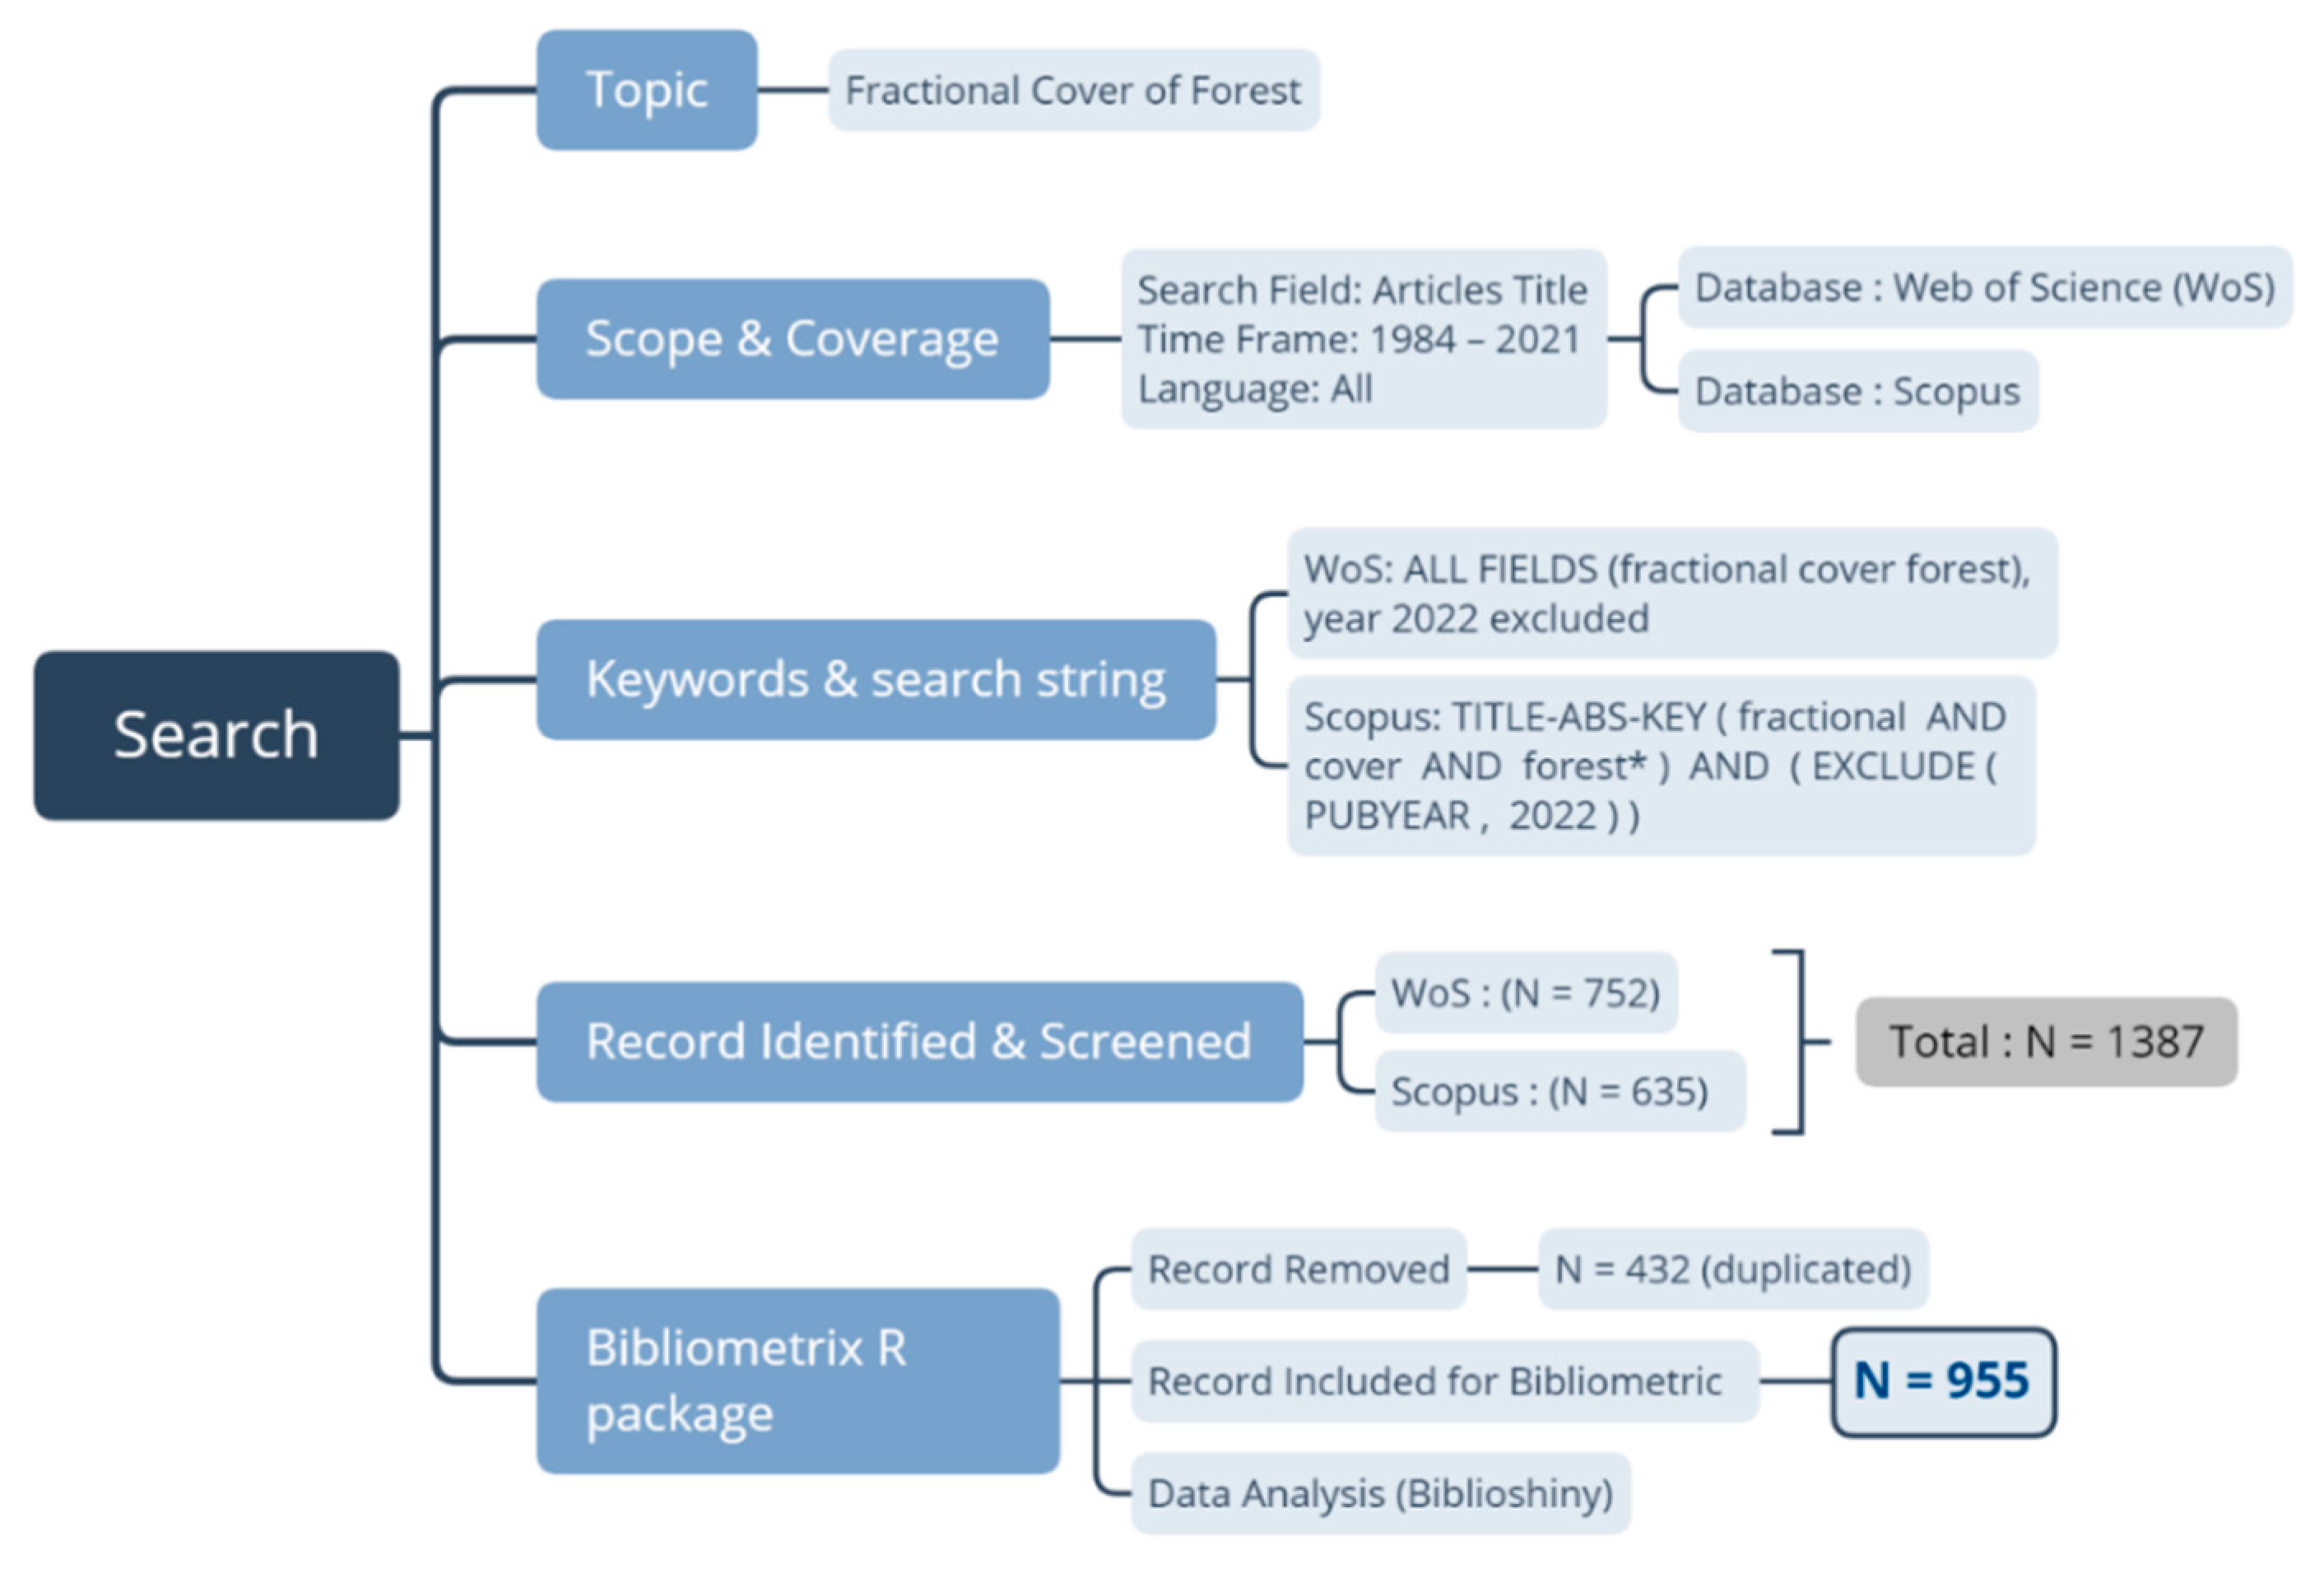
Figure 1. Flow diagram of the publications searching methodology.
Forests 13 01664 g001

2.2. Bibliometric Analysis

The following attributes were used to analyse the identified publications during the search process: annual growth of publication numbers, document and source type, document languages, keywords analysis, publication distribution by countries, authorship analysis, title and abstract analysis, and citation analysis. Bibliographic data from the merged database were used to calculate the data for this analysis.

2.2.1. Publication Current Trends

The findings included annual publication data from 1984 to 2021 and their frequency and percentage. In order to understand the current trends and significance of publications in the fractional cover of forest research, the total of publications divided by year, country, journal, author, and organisation were used to analyse publication trends in the forest fractional cover.
Document and source types were evaluated based on languages and the type and source of the document. Document type identifies documents based on their type, such as conference paper, article, book chapter, and proceeding paper. In contrast, source type represents the publication’s source type: in a journal, conference proceedings, book series, book, or trade publication.

2.2.2. Most Productive Countries and Authors

The most productive authors and countries in these titles were found through Biblioshiny Application. Apart from that, VOSviewer was used to analyse co-authorship collaboration based on authors and countries.

2.2.3. Most Citations

For keyword analysis, a Word Cloud was used. The Word Cloud was created using the Biblioshiny Application. Author keywords were chosen using graphical parameters. The primary benefit of author keyword selection is that it provides insight into current research topics and trends. A maximum of 50 keywords were allowed. The text was chosen randomly from a dark tone. Analysis for citation and publication by source title using Biblioshiny. VOSviewer use for the frequency and simultaneity of occurrences in the titles and abstracts were examined. The co-occurrence network was constructed using the full counting method. This function counts each occurrence of a term in the document.

3. Results and Discussion

The bibliometric analysis was conducted to resolve the issues raised in the study. The study sought to determine the current publication trend and the significance of studies on the fractional cover of forests algorithms. Second, it aimed to identify the most productive countries and authors in fractional cover of forest studies, and finally, to recognise the most prominent articles on the fractional cover of forest studies.

3.1. Publication Current Trends

3.1.1. Publication Growth

Figure 2 shows the growth in the total number of publications (TP) and total citations (TC) obtained from merging records from the WoS and Scopus databases. This study found 955 publications using a predefined search query with a total of 27,629 citations. Springer Link (1984) published the first research for fractional cover of forest research, that by Padberg and Wosley [47] entitled Fractional Covers for Forests and Matchings in the journal Mathematical Programming.
There were no relevant publications found for the period 1985 to 1989. There were probably no researchers aware of this algorithm in those years, resulting in no studies on fractional cover of forest being undertaken. However, in 1990, one publication was published. The number of publications increased slightly between then till 2002. Since then, publication numbers on the fractional cover of forests have gradually increased. The highest number of citations was in 2009 with 2701, while the highest number of publications annually was in 2021 with 120.

3.1.2. Document and Source Type

The documents published on the fractional cover of forests were classified into 12 types of documents, as summarised in Table 1. The highest proportion of publications were classified as articles (82.41%), followed by proceedings papers (6.81%) and conference papers (5.86%). The publications listed as the document type conference papers were not the same as those listed as conference papers under source type [48]. They were presented at conferences and then published as full journal articles, so they could not be republished. Limiting source data to journal publications reduces false positives, especially for those originating from conference proceedings.
While other types of documents (article: proceedings paper, review, article: book chapter, article: early access, article: data paper, erratum, and short survey) comprise less than 2% of the overall publications. Besides, 80% of the documents are published as articles (a combination of all article types).

3.1.3. Languages of Documents

According to the summary of publications in Table 2, the majority (96.63%) of the 955 publications were written in English, with 924 publications originating from 69 countries. Next most frequent were Chinese (2.62%), then Polish and Spanish (0.21%), and least number were French and Russian (0.10%).

3.2. Most Productive Countries and Authors

3.2.1. Publication by Countries

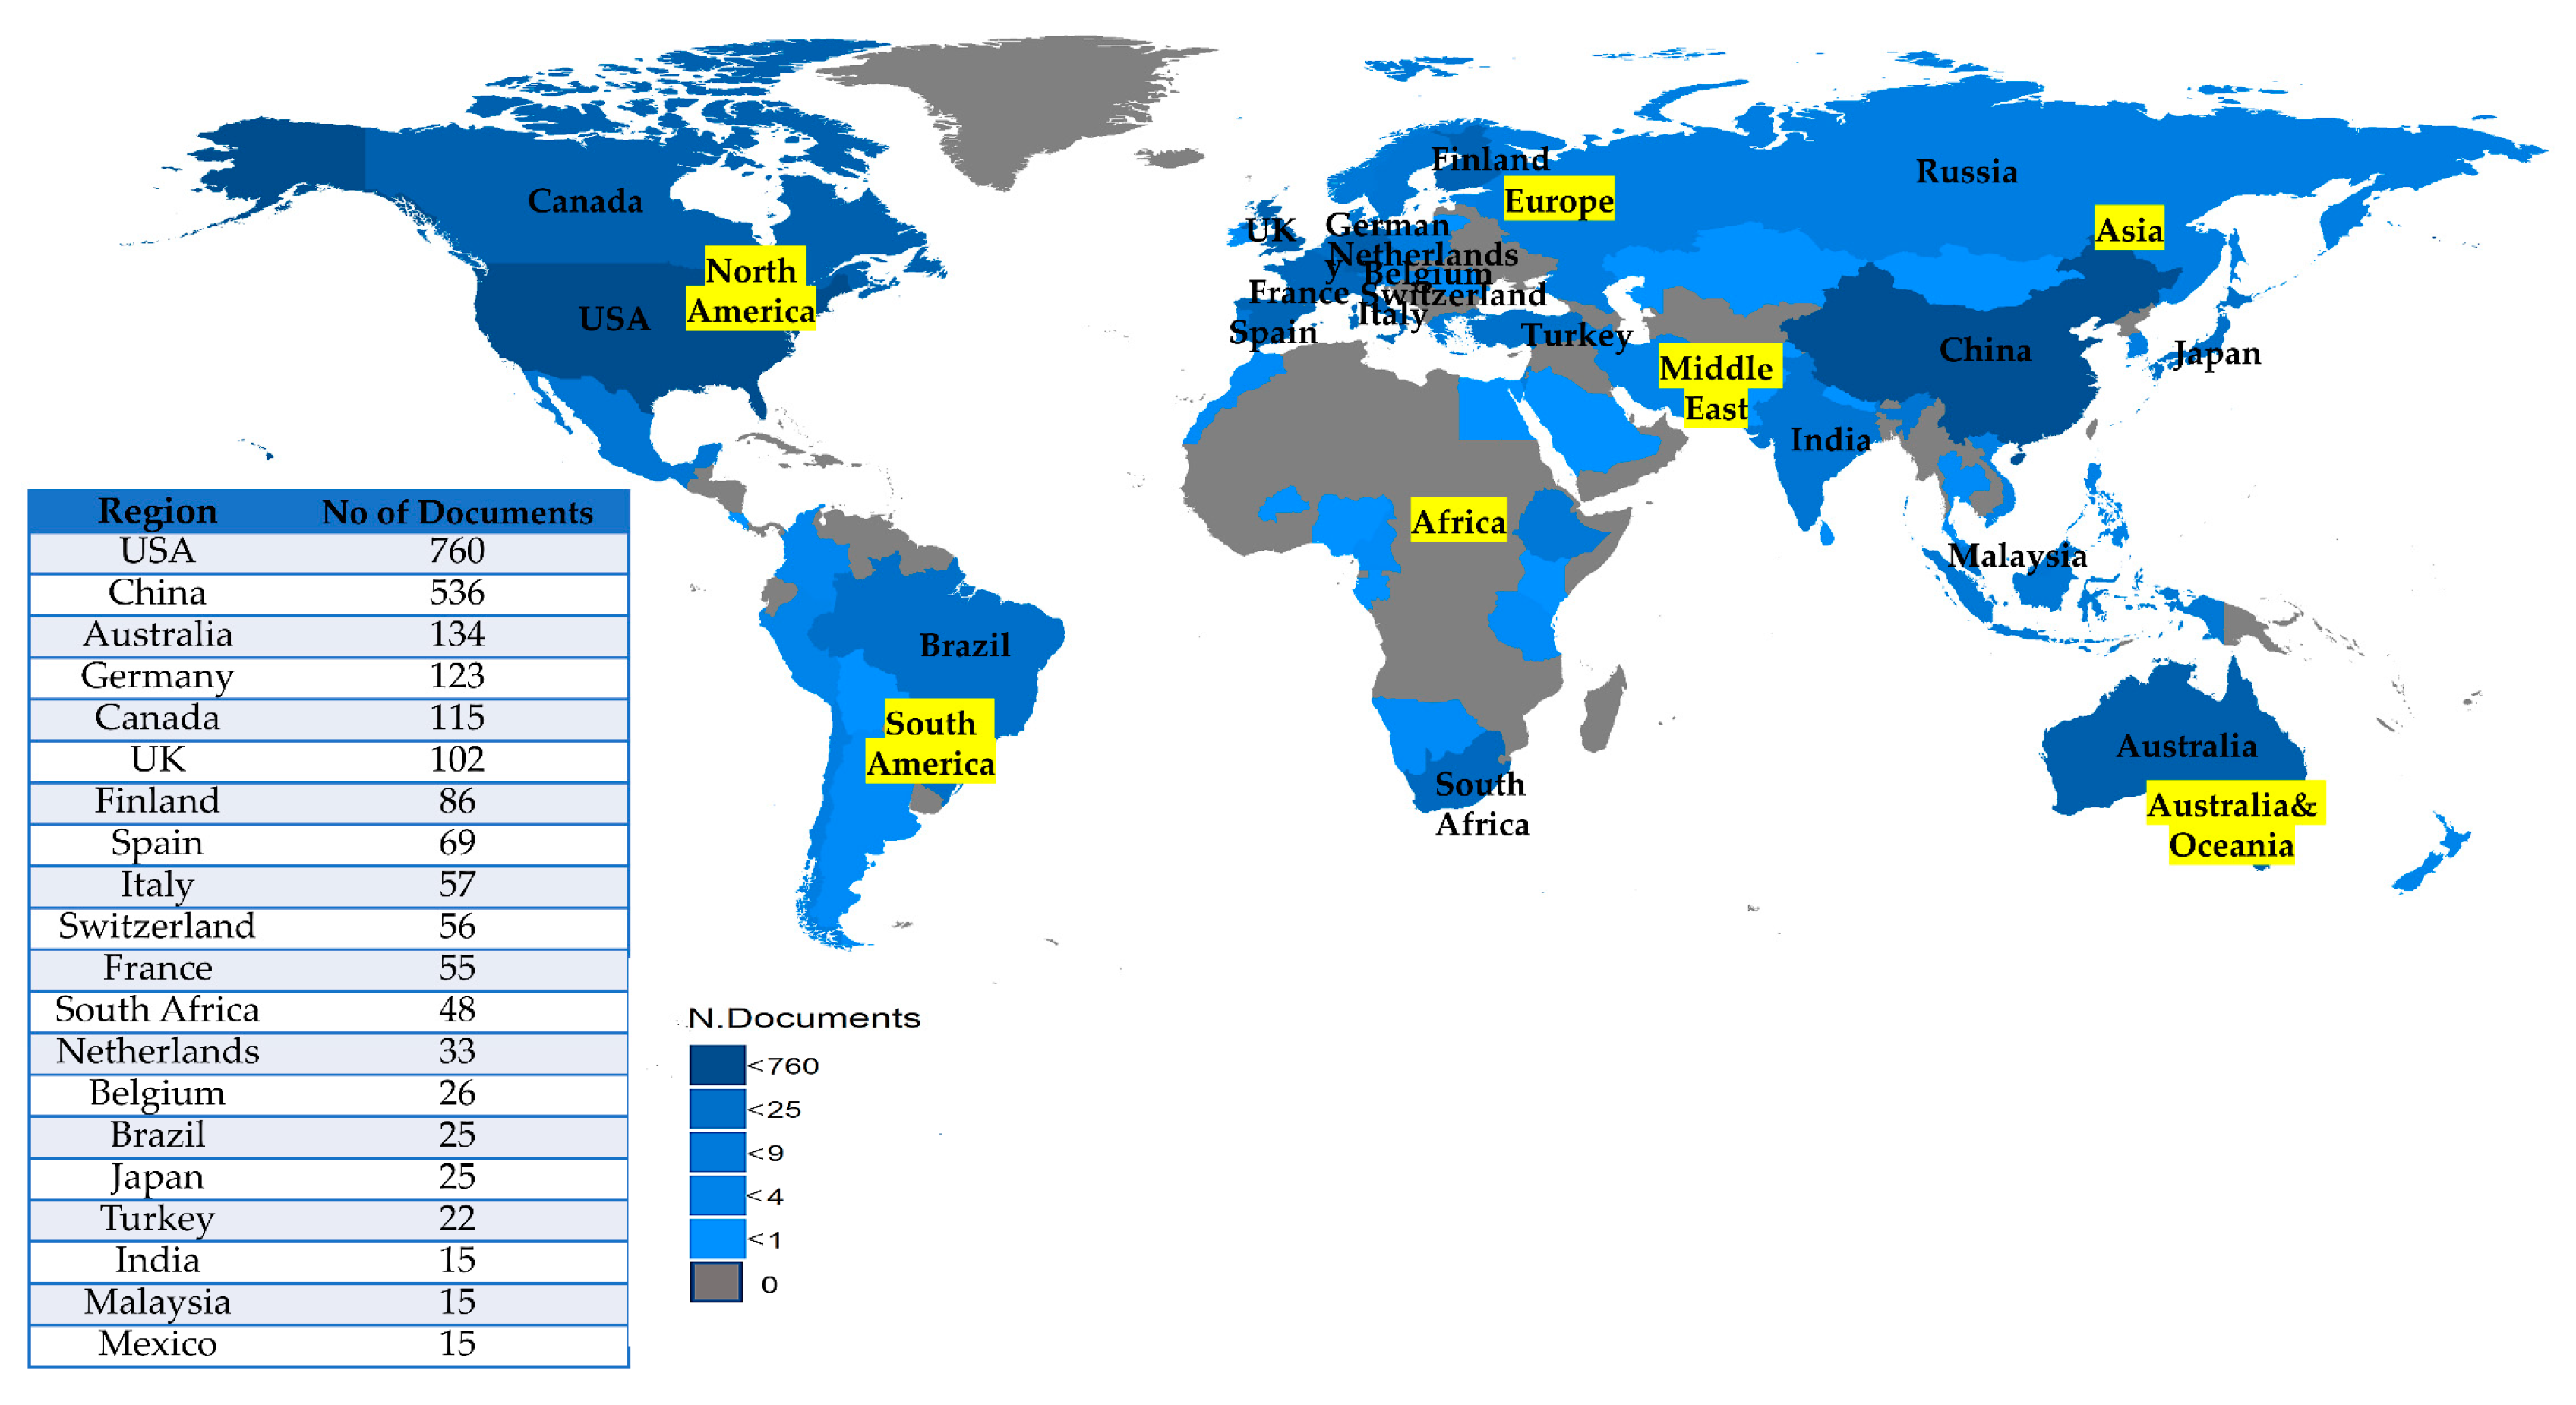
Figure 3 shows the top 20 most productive countries in terms of fractional cover of the forest studies. Researchers from 69 countries who had published were identified in the publications listed in both databases. The USA led the ranking of the most productive countries with 760 publications, followed by China with 536, Australia with 134, and Germany with 123, the fourth highest number of publications. The remaining countries constituted less than 30 publications dispersed worldwide, including Belgium, Brazil, Japan, Turkey, India, Malaysia, and Mexico. Most publications were from the North American continent, followed by Asia and Europe.
This figure could also be used to determine the terrestrial biomes studies based on productive countries. For instance, the terrestrial biomes of USA include temperate forest, temperate grassland, boreal forest, mountain, desert, chaparral, and polar ice; China: temperate forest, temperate grassland, boreal forest, mountain, and desert; Australia: temperate forest, savannah, desert, chaparral, and tropical forest; Germany: temperate forest; Canada: boreal forest and tundra; United Kingdom: temperate forest; and Finland: boreal forest and desert [49]. Thus, most studies are from regions with temperate and boreal forests.
As illustrated in Figure 4, the USA also ranks for the highest total number of citations with 13,107, followed by China with 2364, Italy in third with 1632, and Germany in fourth with 1205.

3.2.2. Authorship Analysis

Table 3 shows the top 10 list of most prolific authors of studies on the fractional cover of forest algorithms. The most active authors were Xiao-Yan Li from the Beijing Normal University (China), Gregory P. Asner from the Carnegie Institution (USA), and Jouni Pulliainen from the Finnish Meteorological Institute (Finland). However, in terms of the total number of articles fractionalised by authors, Gregory P. Asner came in first with 5.2, followed by Xiao-Yan Li (4.33) and Jinfei Wang (4.27). Most of the top 10 listed authors were from China.
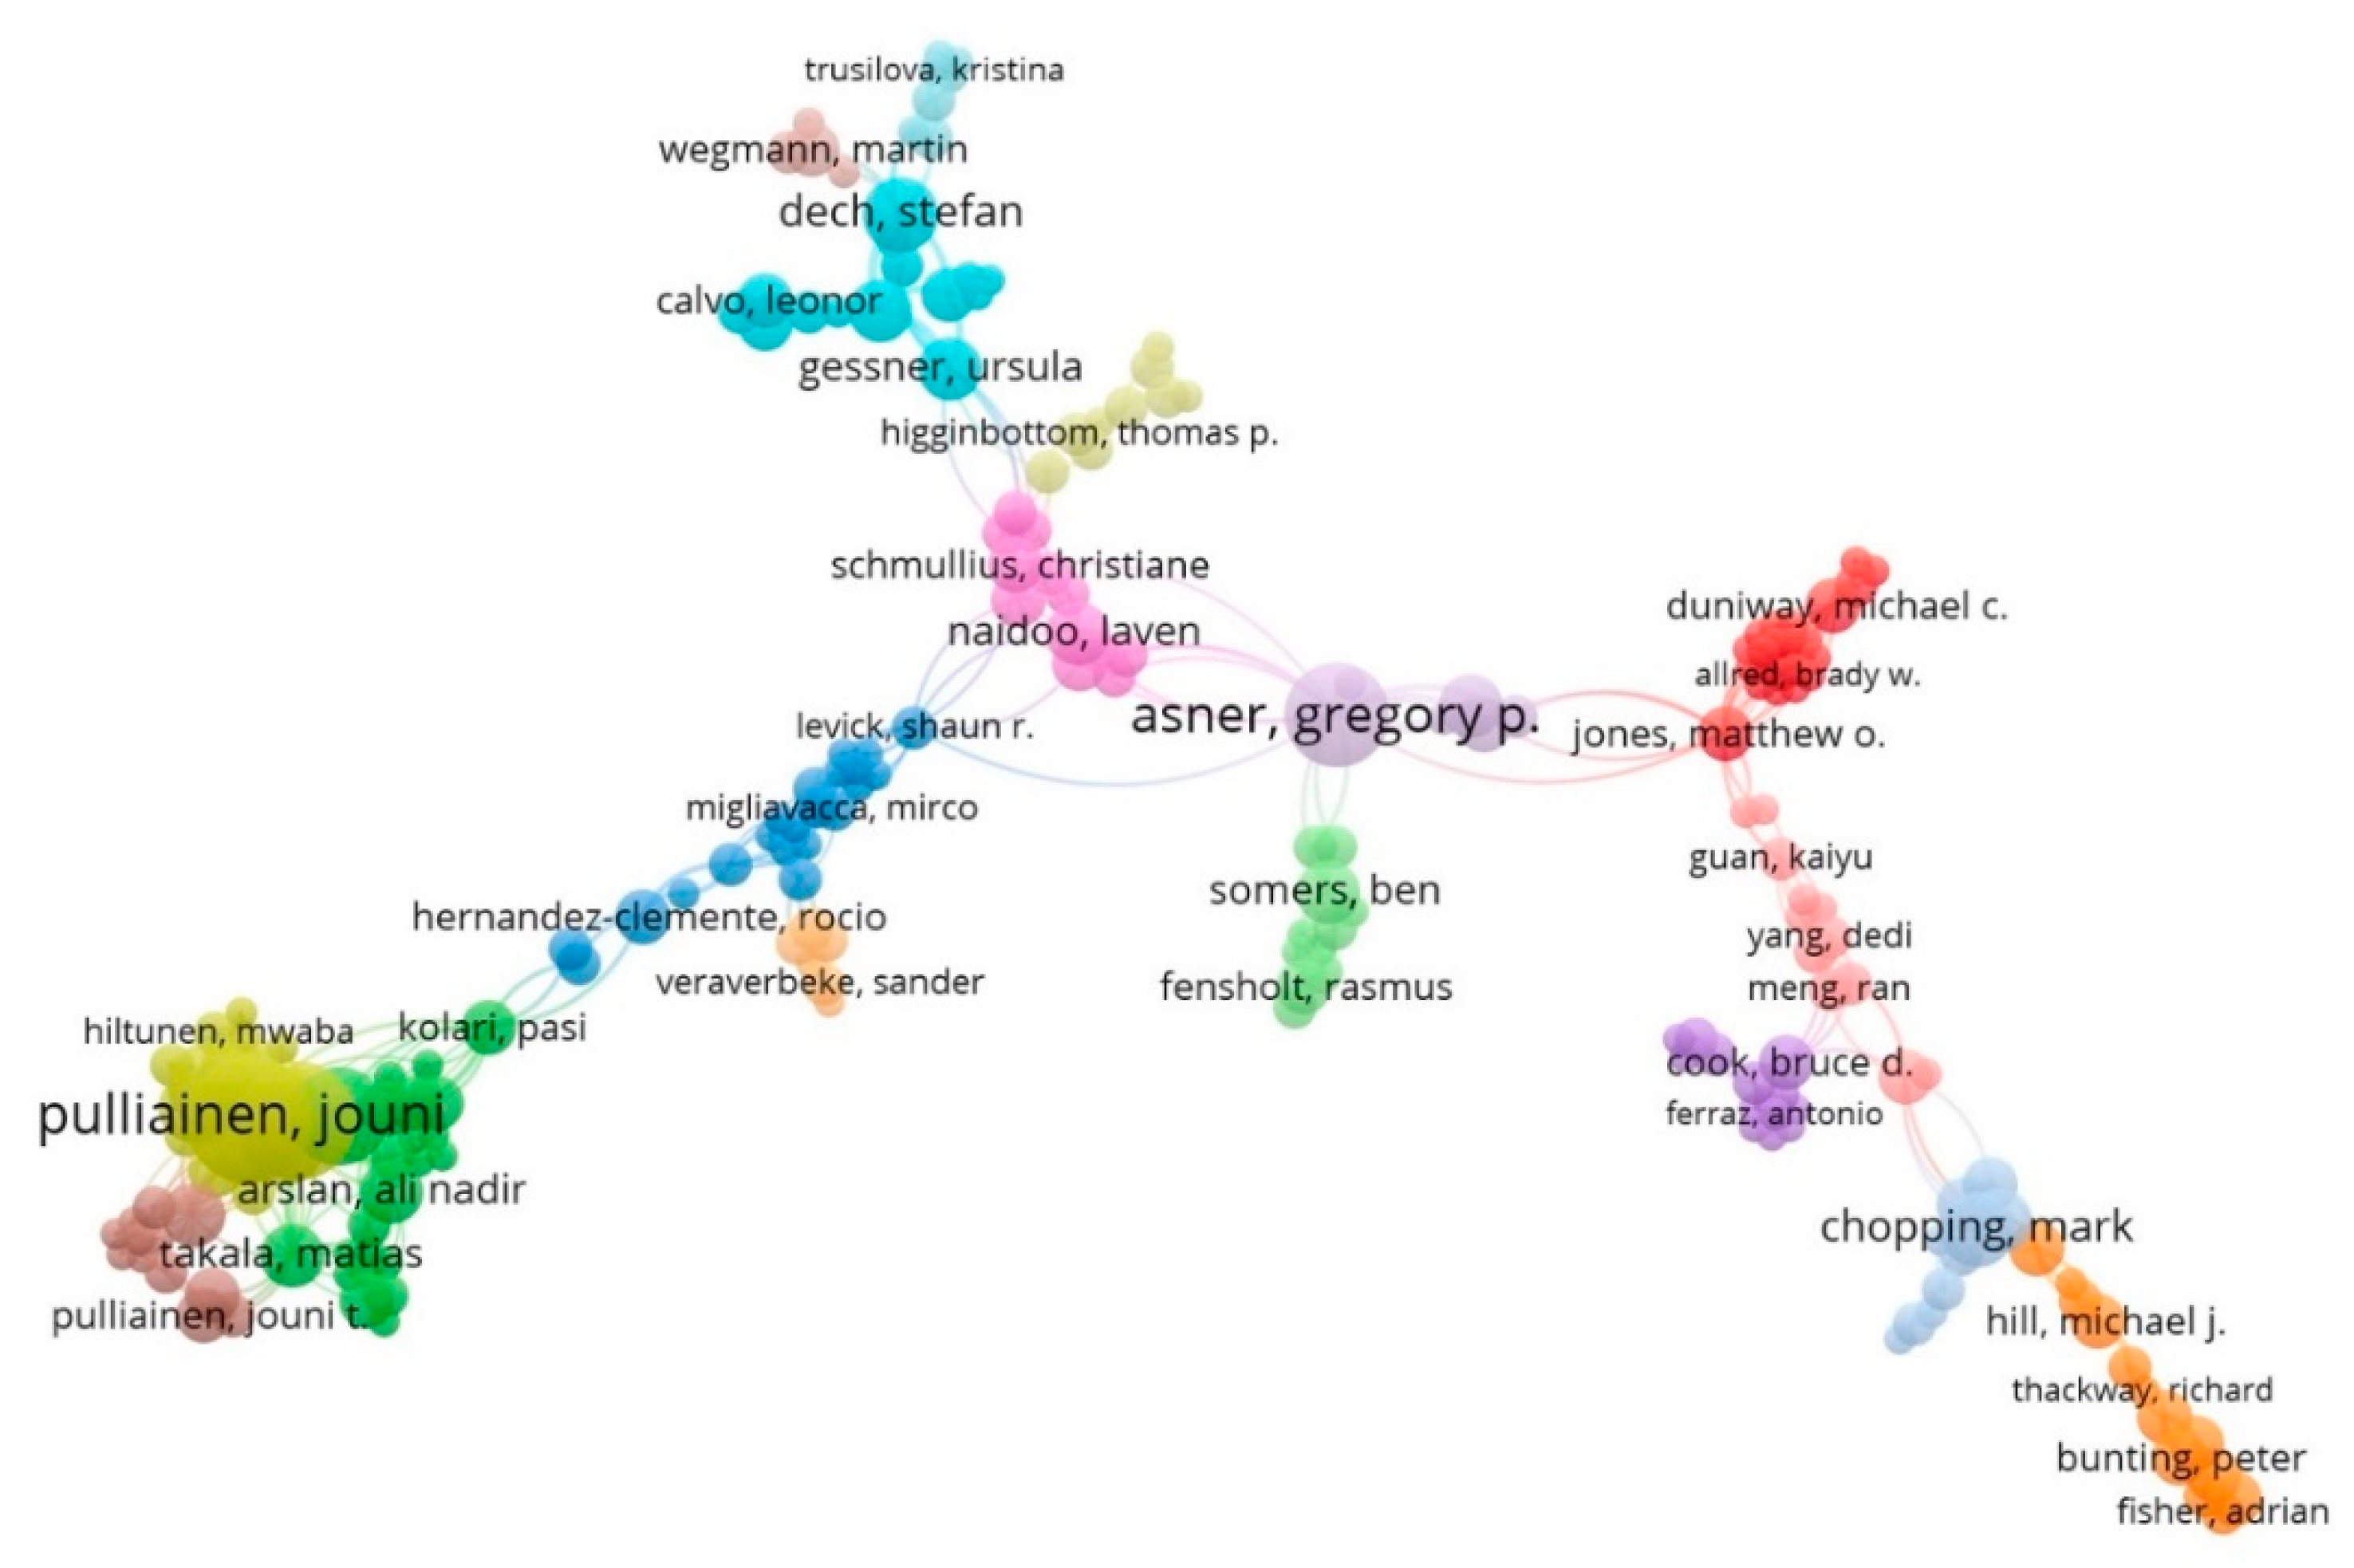
Figure 5 shows the network visualisation map (WoS database) of the co-authorship based on authors with a minimum number of one citations (fractional counting). The analysis is because prominent writers have been cited at least once in one publication on fractional cover of forest. The colour of the connecting line, the size of the circle, the font size, and the font weight emphasised the direction of the author’s connection.
As indicated by using the same colour, associated authors were frequently listed consecutively. Jouni Pulliainen (prominent author), Ali Nadir Arslan, and Matlas Takala, for example, worked closely together according to the graph (green colour). Additionally, the map depicts (in orange) a group of authors such as Michael J. Hill, Richard Thackway, Peter Bunting, and Adrian Fisher have collaborated with Mark Chopping (prominent author). The finding suggested that most publications on the fractional cover of the forest have at least one citation to publications by the author Gregory P. Asner.
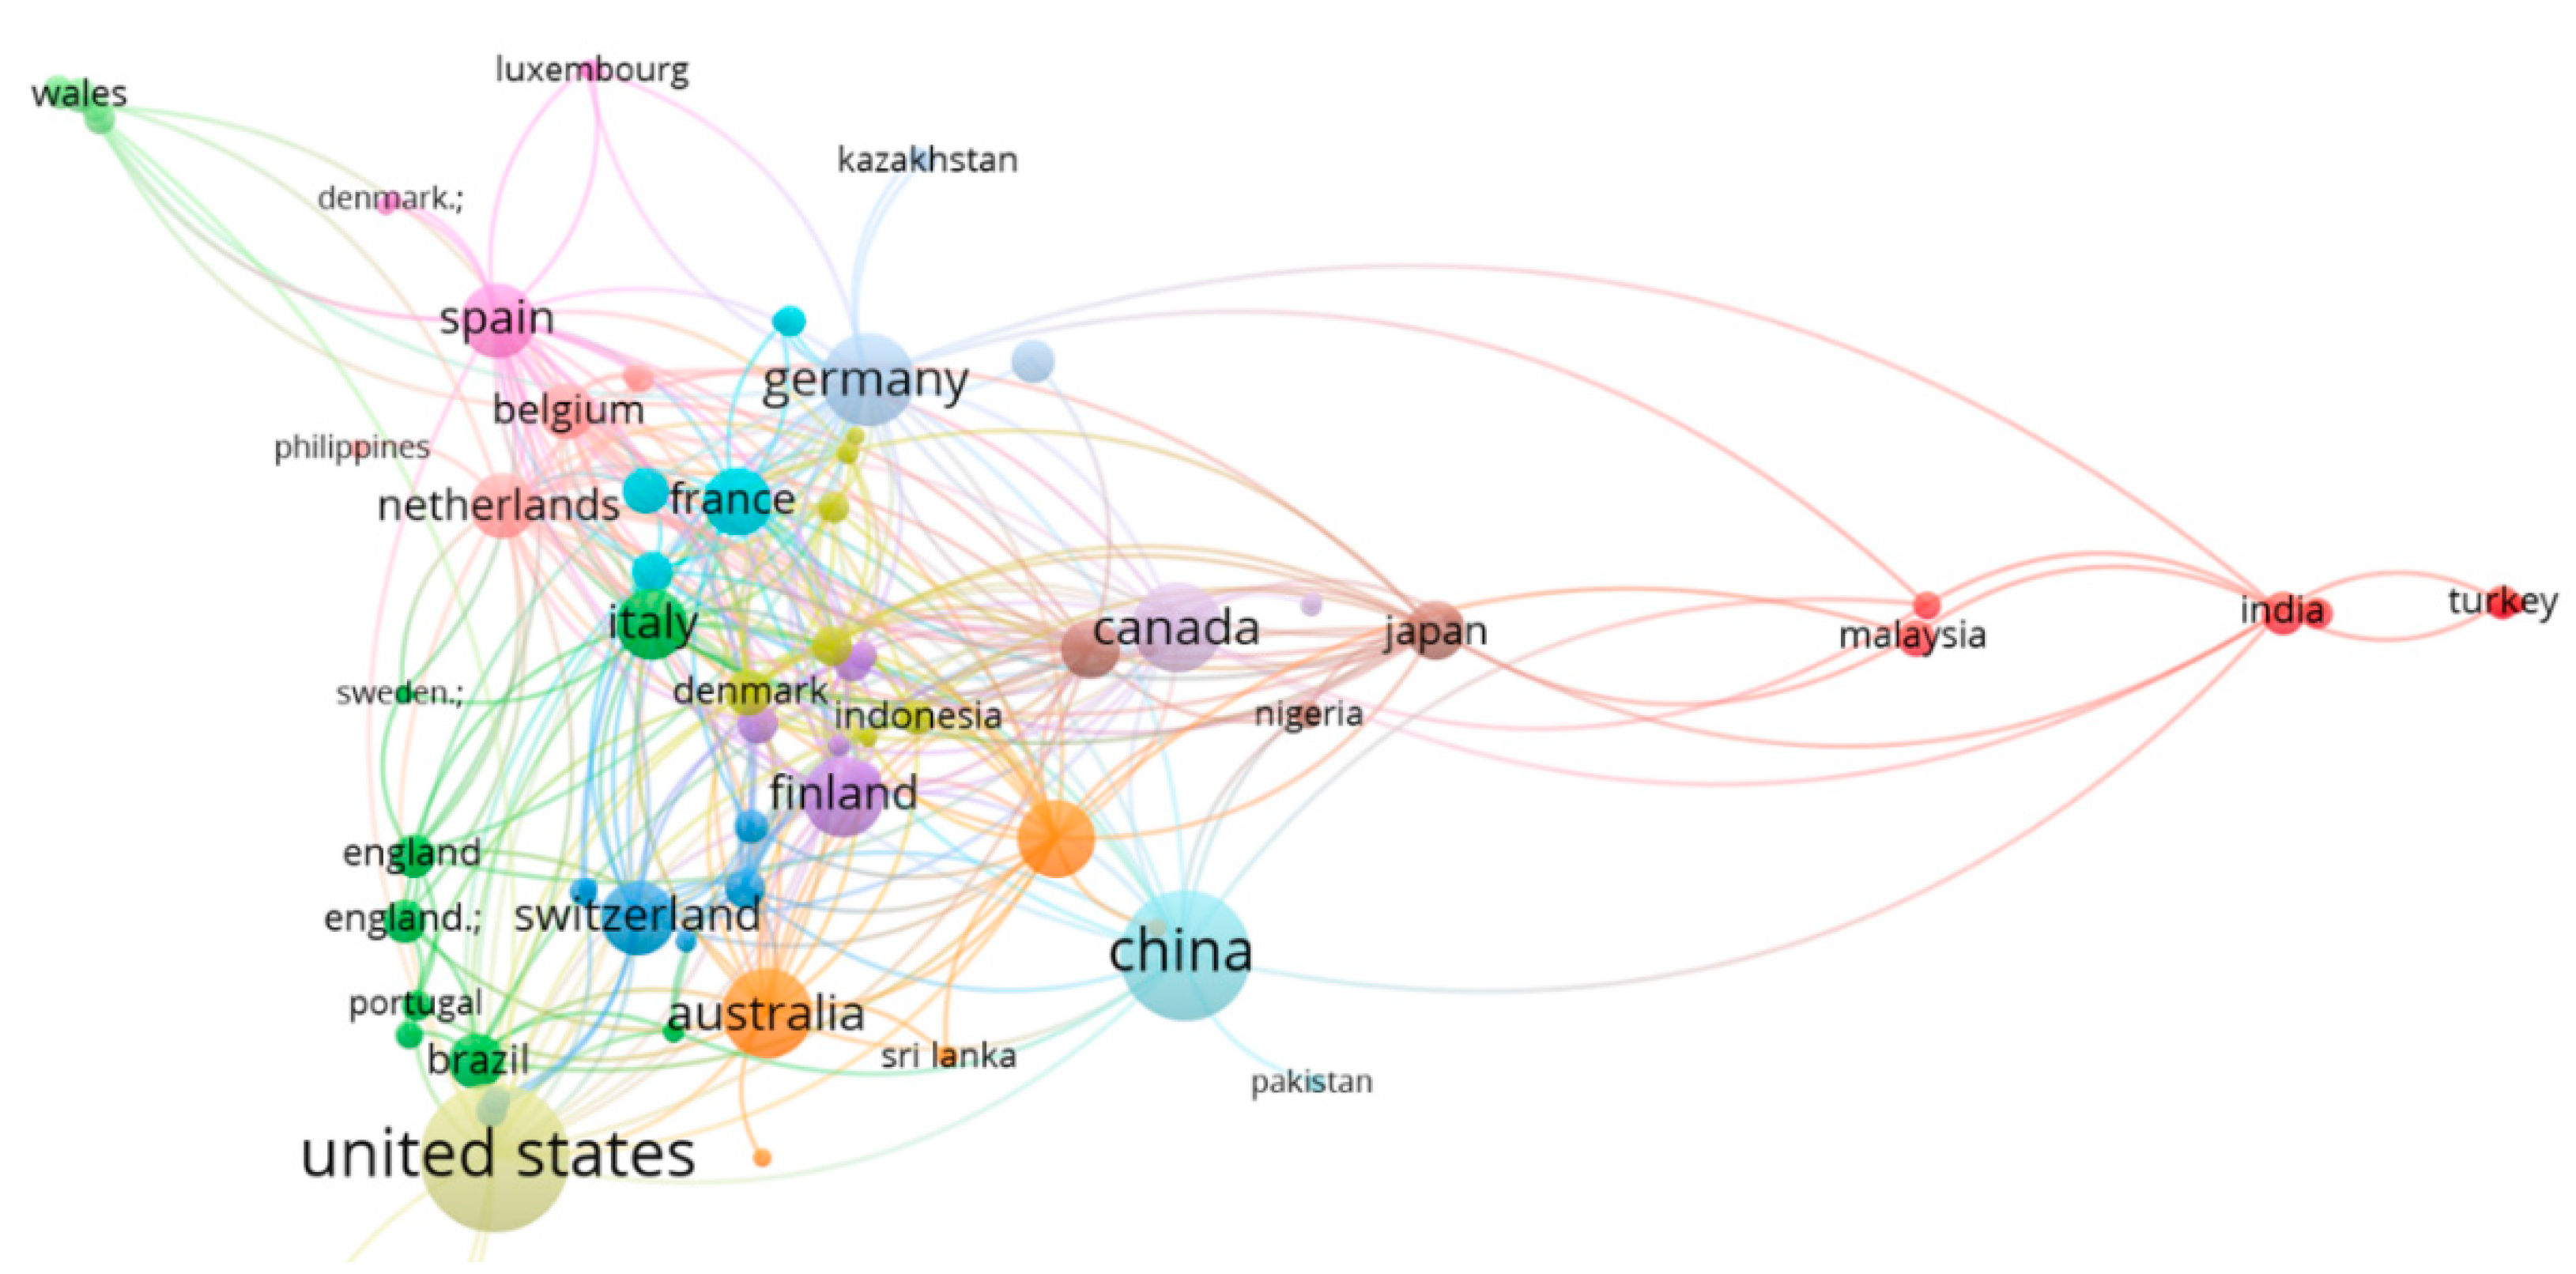
Figure 6 displays the network visualisation map of the authors’ affiliated countries. Research from countries that have cited more than one article and have more than one citation is included in the analysis. Based on font size, the results indicate that the USA plays an essential role in international collaboration. The USA collaborates with Brazil, England, Portugal, Italy, and Puerto Rico. Next was China, which most collaborates with USA, Switzerland, France, and Pakistan.

3.3. Most Citation

3.3.1. Keywords Analysis

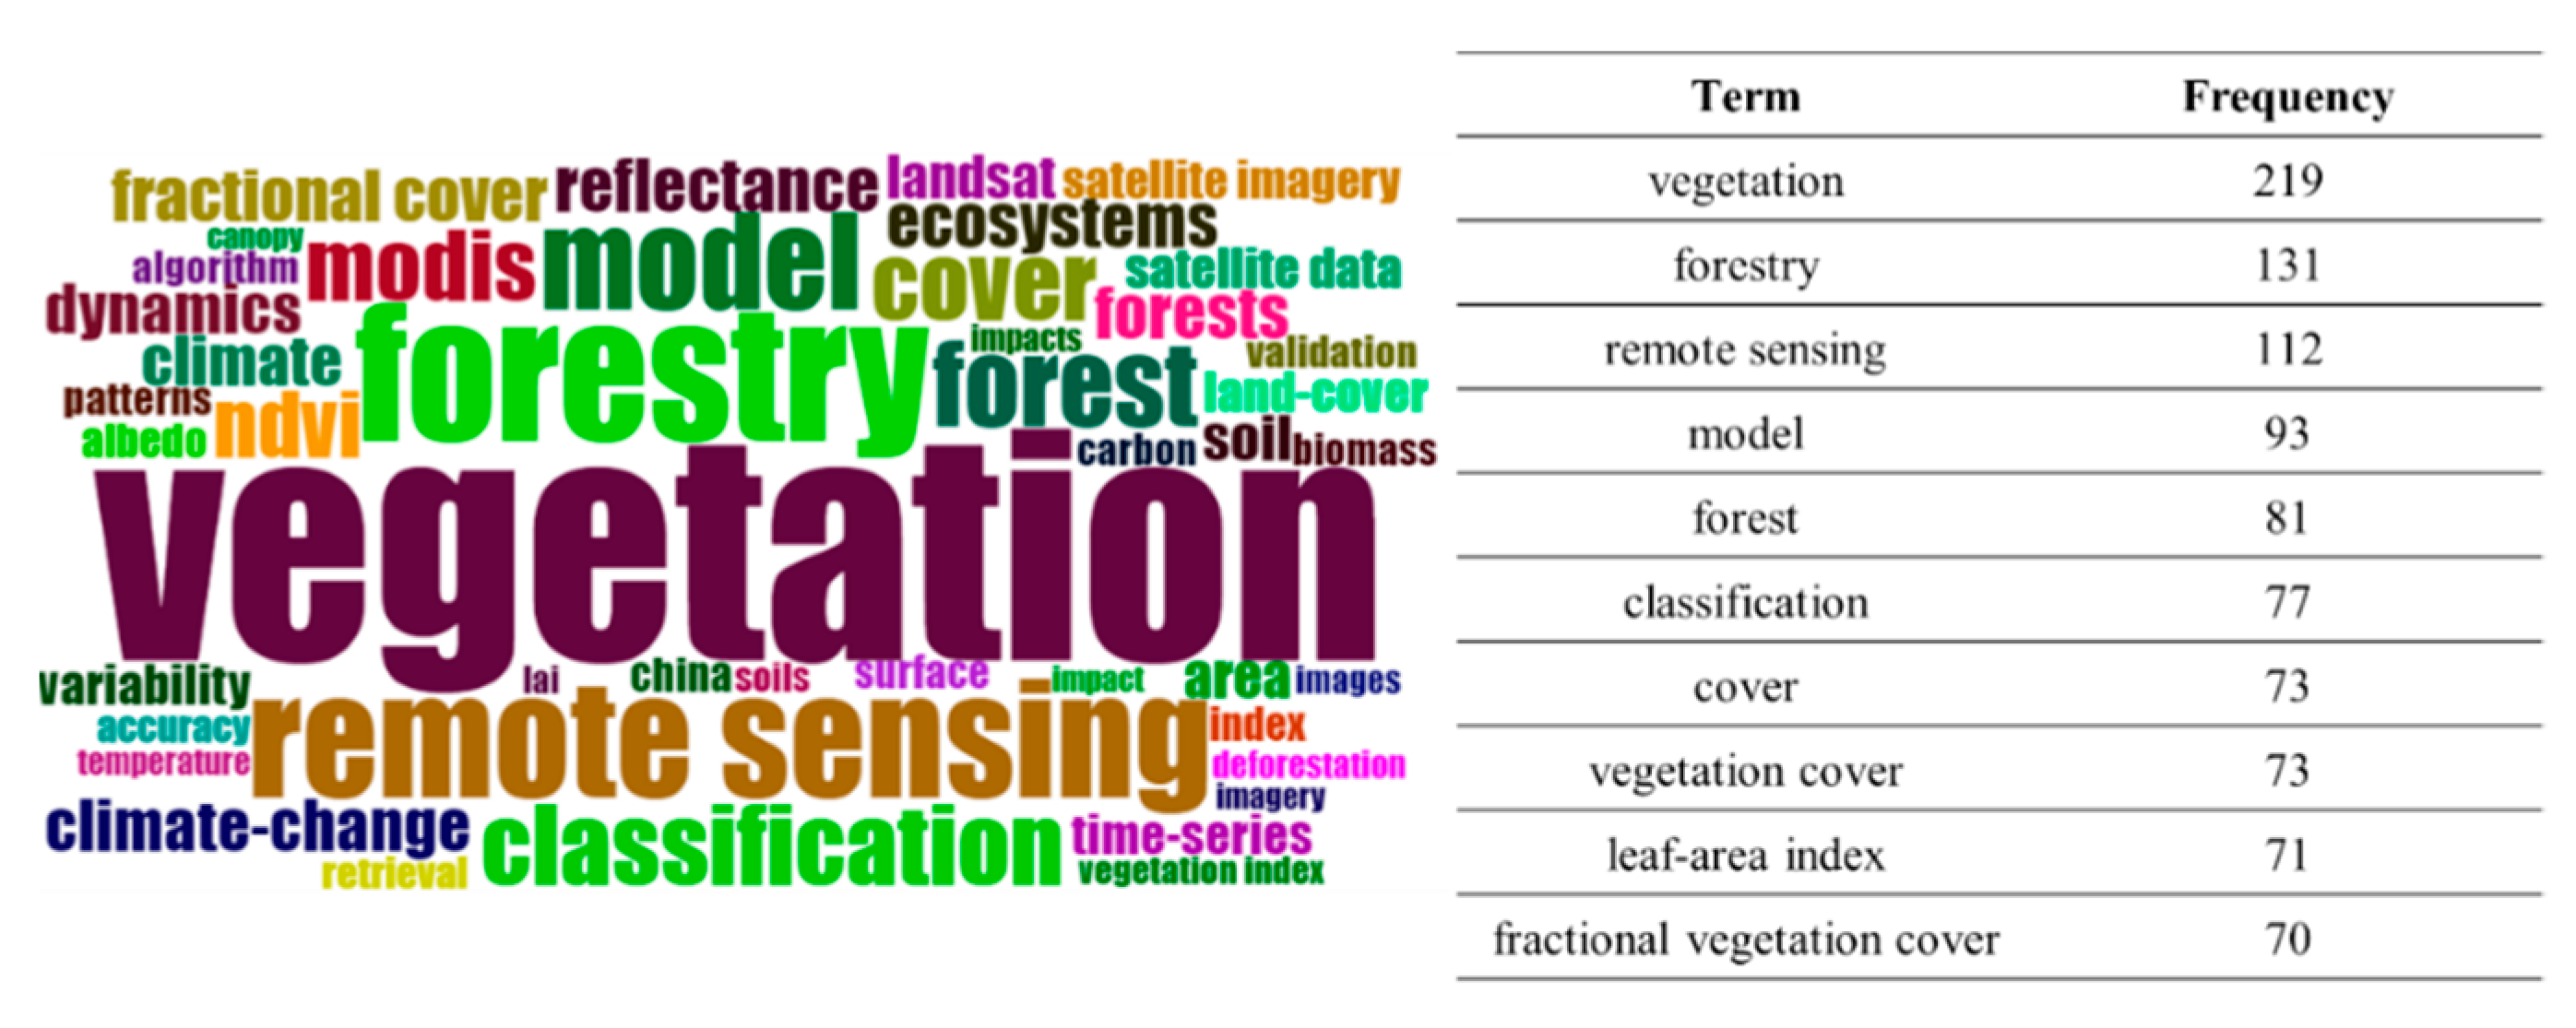
Keyword analysis revealed emerging trends in the field [50]. A keyword in a central or hub position in a keyword network is typically connected to a large number of neighbouring keywords as a result of the network’s preferential attachment process [51]. The key points for this field can be seen in the results of a Word Cloud (Figure 7) where it was discovered that the keywords “vegetation” with a frequency of 219 times, following “forestry” (131), “and “Remote Sensing” (112) were among the top ten most frequently used terms in the collected publications.

3.3.2. Citation Analysis

Citations that are consistent with the content are a vital part of scientific integrity in any academic discipline [52]. Table 4 summarises the citation metrics for publications on the fractional cover of forest. There were 955 publications published over a 37-year period (1984–2021), the average number of citations per year per document was 2.898, while the average number of citations per document was 28.93. More than 36,000 references were counted. For author collaborations, the count for documents per author was 0.328, while the average number of authors per document were 3.05.
Table 5 displays the most cited articles according to the WoS and Scopus databases (depending on the total number of citations for each document). Norman J.M. et al. [53] in the journal Agriculture Forest Meteorology received the most citations for the article “Source approach for estimating soil and vegetation energy fluxes in observations of directional radiometric surface temperature” with 1044 total citations and an average of 37.29 citations per year.
Next, the publication by the authors Steduto P. et al. [54] with the article “AquaCrop—The FAO crop model to simulate yield response to water: I. Concepts and underlying principles” has been cited 935 times. While the article “Wavelet analysis for geophysical applications” by Kumar P. et al. [55] has been cited 666 times. This list shows that researchers’ interest in the fractional cover of the forest algorithms was not limited to vegetation growth but included soil, geophysical, hydrologic, environmental, and methodological topics.

3.3.3. Publication by Source Title

Table 6 shows the top 10 source titles that published articles on the fractional cover of the forest, based on the total number of articles published under each source title. As seen from the table, “Remote Sensing of Environment” publisher Elsevier (133 publications) with h-index of 51 has the most sources on the fractional cover of the forest. Followed by “Remote Sensing” published by MDPI (78 publications) with an h-index of 20, and “Agriculture and Forest Meteorology” published by Elsevier (42 publications) with an h-index of 22. The h-index gauges scholarly output and citation impact. It is one of several bibliometric measures that attempts to quantify the quantity and quality of a researcher’s scholarly output. It is based on the scholar’s most referenced works and the number of publications that have mentioned them [63].
The journal “Remote Sensing of Environments” also ranks as the highest total number of citations with 7585. This is followed by the journals “Agricultural and Forest Meteorology” cited 2790, “Remote Sensing” cited 1165, and “International Journal of Applied Earth Observation and Geoinformation” cited 1068 times. Out of these top 10, eight (8) active source titles involved in remote sensing were discovered.

3.3.4. Title and Abstract Analysis

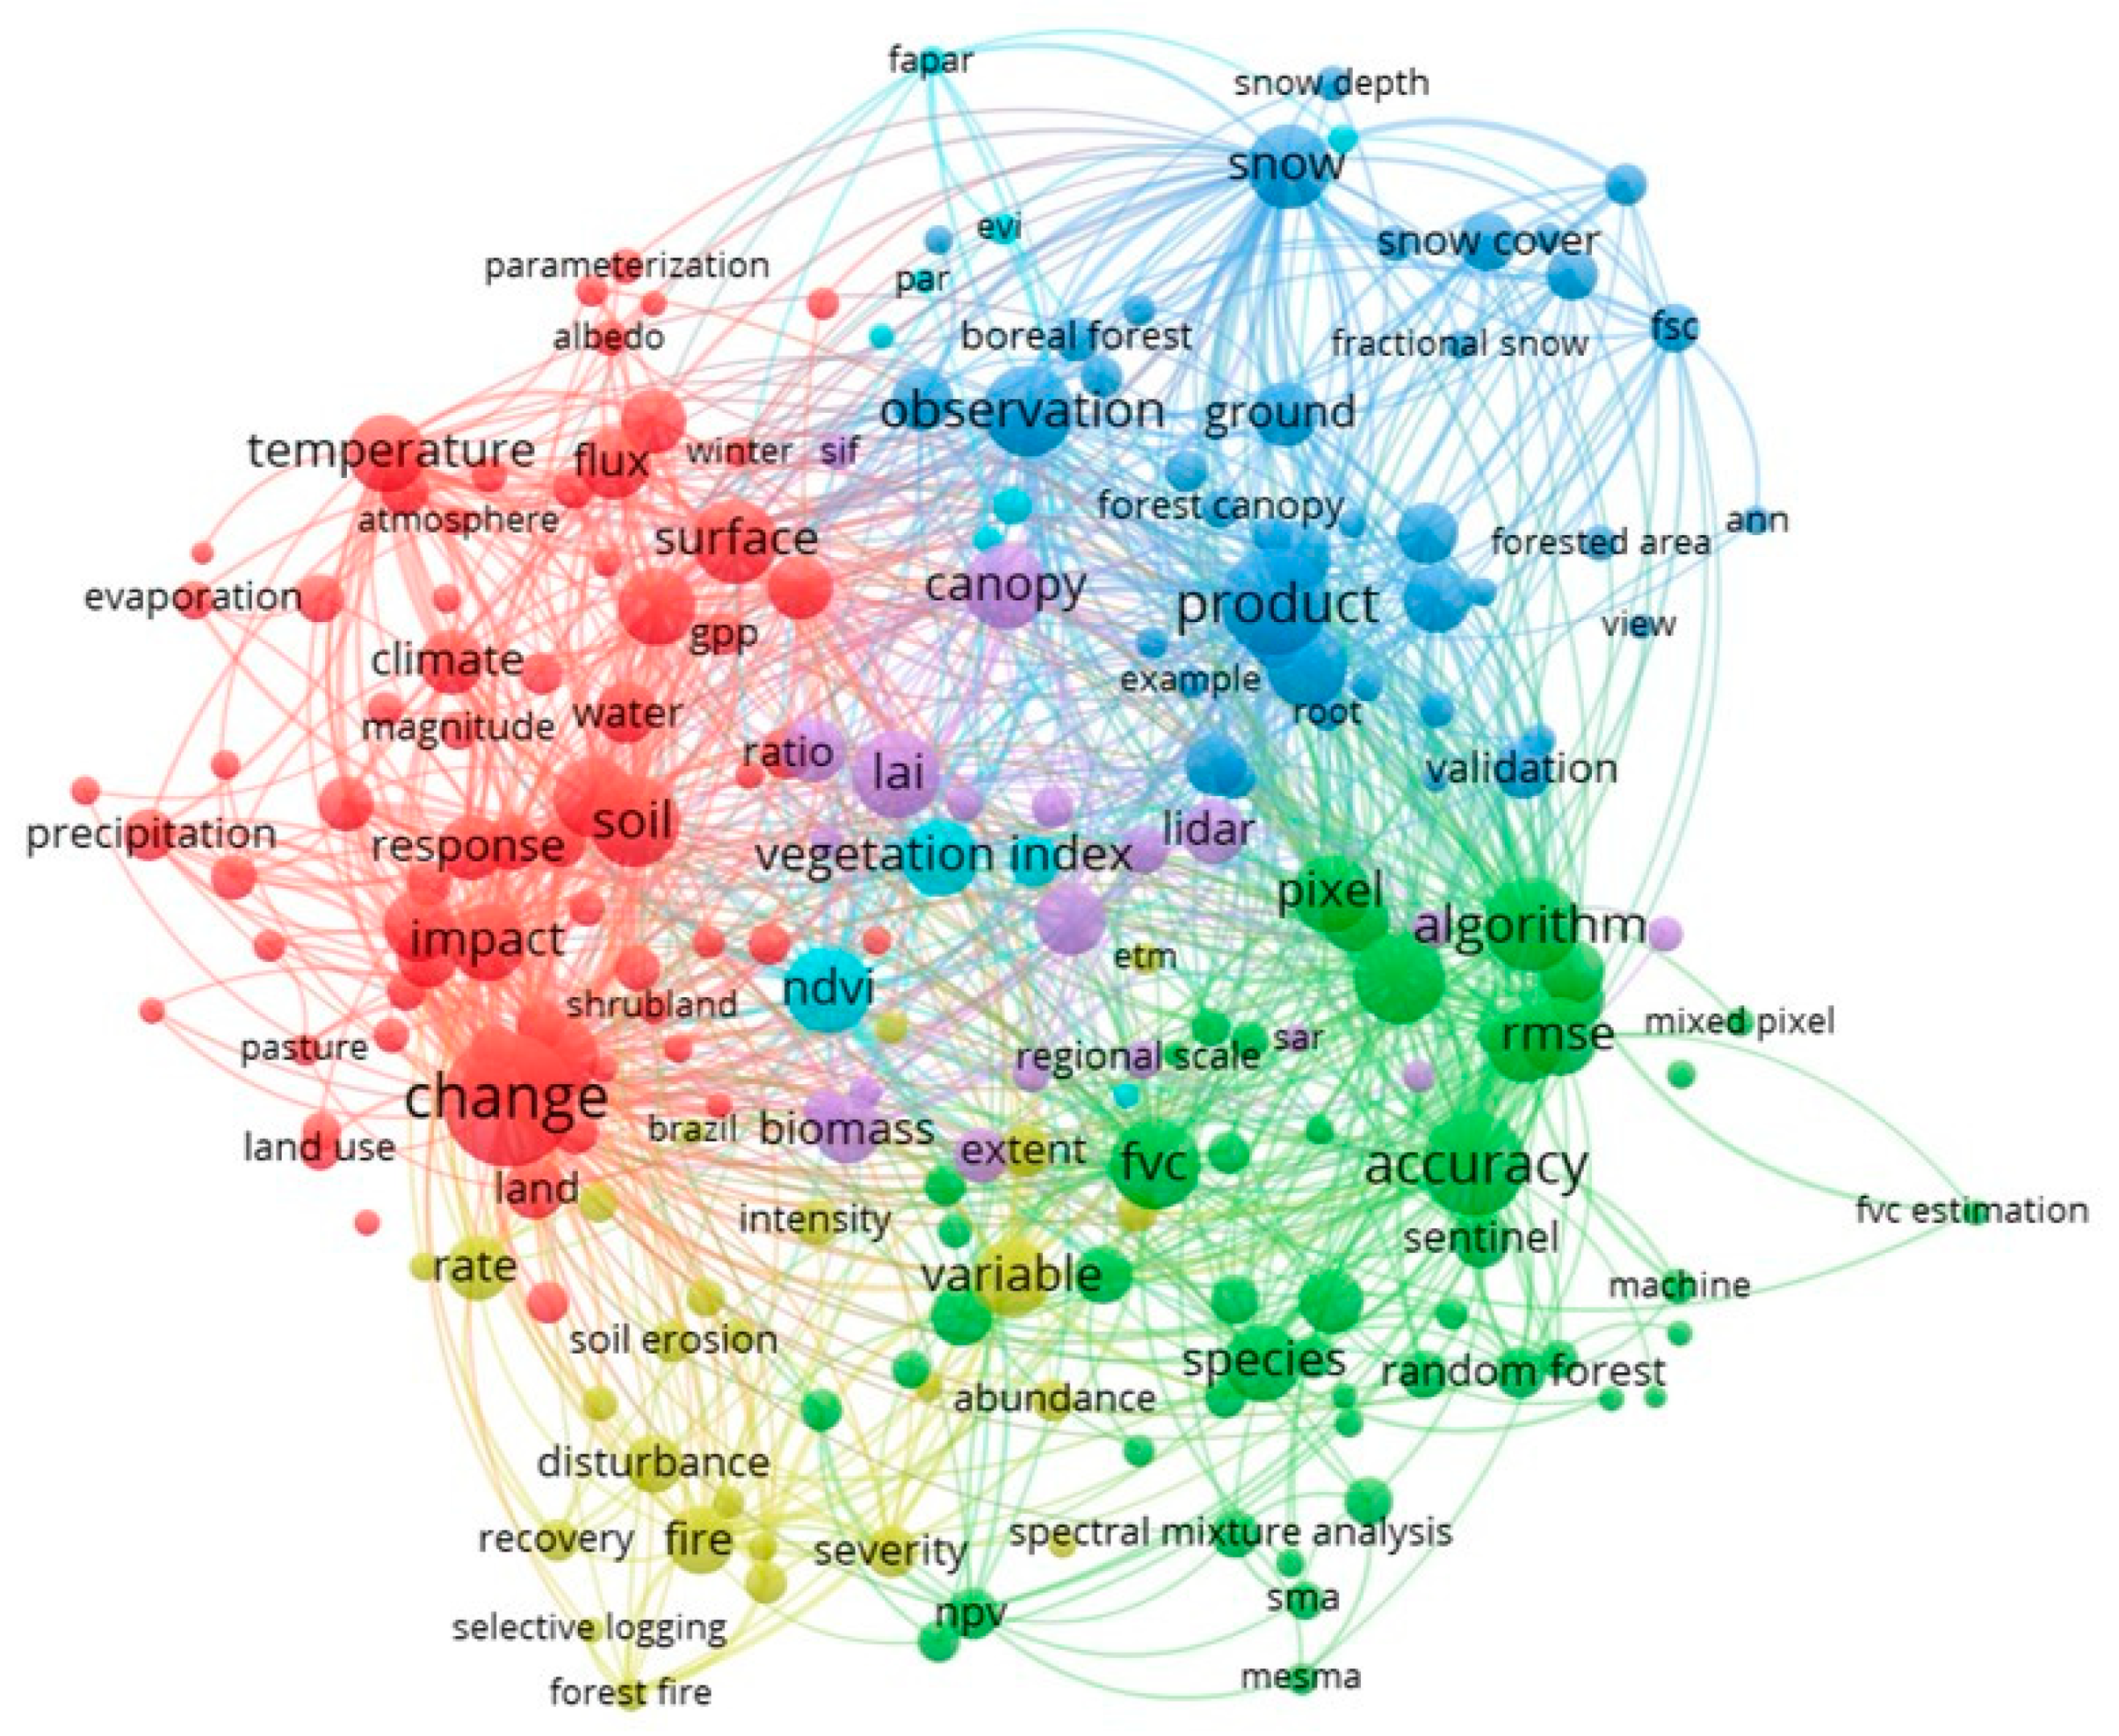
Figure 8 depicts a network of term co-occurrences that varies according to the title and abstract fields and contains at least 17 terms. Figure 8 shows that the entire network is constructed using the keyword “canopy cover” from the fractional cover of forest publications. The size of the node indicates the item’s heaviness in appearance, while the density of the connecting line indicates the item’s strength of the connection. VOSviewer generated six (6) distinct colours from the title, each representing one of the publication’s six (6) clusters of 214 terms.
Typically, words that are displayed in the same colour are all closely related and frequently appear concurrently. Such as, Cluster 1 (shown in purple): includes topics “canopy”, “LAI”, “biomass”, and “lidar”. Cluster 2 (shown in red): includes topics “change”,” impact”, “response”, “soil” and “water”. Cluster 3 (shown in dark blue): includes topics “product”, “forest canopy”, “observation”, “ground”, “snow” and “snow cover”. Cluster 4 (shown in yellow): includes topics “disturbances”, “fire”, “recovery”, “selective logging” and “soil erosion”. Cluster 5 (shown in green): includes topics “accuracy”, “algorithm”, “pixel”, “fvc” and “species”. Cluster 6 (shown in light blue): includes topics “vegetation index” and “ndvi”.
The LiDAR (active sensor) and Sentinel (passive sensor) remote sensing technologies are often mentioned in these studies based on the visualisation displayed. The LiDAR is useful for detecting fine-scale (tree level) forest structure and change with repeat measurements. The LiDAR represents the 3D biological material distribution in tree canopies and sensitive to sub-canopy alterations [64], while Sentinel is equipped with an advanced, high-resolution, wide-swath multispectral imager with 13 spectral bands to provide a new viewpoint on land and vegetation [65].
The last decade has seen the expansion of Unmanned Aerial Vehicle (UAV) applications using optical and LiDAR in the forestry sector due to sensors, platforms, and software advances. Individual tree detection may be regarded as one of the most important UAV applications since it may provide information on tree height, crown width, diameter at breast height, aboveground biomass, forest uniformity, and wood quality [66,67]. Nevertheless, the application of remote sensing technology depends on the study’s requirements, as all types of remote sensing technology have advantages and limitations.
Next, the most frequent remote sensing methods frequently used for the fractional cover of forest algorithms studies were Machine Learning Classification, such as Random Forests, in 102 documents, Support Vector Machines (16) and Artificial Neural Networks (14), followed by Spectral Mixture Analysis (52) and Multi-Endmember Spectral Mixture Analysis (17). Spectral indices were also frequently utilised in this study, particularly vegetation indices such as Leaf Area Index (174) and Normalized Difference Vegetation Index (145).
Nonetheless, this figure identified no topics associated with monitoring, deforestation, tropical forests, carbon emission, and developing countries. This indicates that there is less research related to those topics. The previous study [68] mentioned that deforestation is mostly in tropical developing countries. Monitoring deforestation in tropical forests is crucial to addressing carbon emissions and climate change [69]. The UNFCCC (2010) [70] also has prompted developing countries to assess land use, land-use change, and forestry activities, particularly those associated with the drivers of deforestation and forest degradation, to determine their potential contribution to climate change mitigation.

4. Limitation of Study

This study is limited to the Web of Science and Scopus databases. Consequently, it is possible to conduct a bibliometric review using other databases in future research. It should also be noted that no search query is perfect; thus, false positive and negative results should be expected. Despite these limitations, the current research contributes to the body of knowledge by describing current research trends on the fractional cover of the forest. Additionally, this research contributes by utilising the bibliometric method to increase our understanding of the literature for fractional cover of forest.

5. Conclusions

The finding of this review paper indicated that bibliometric analysis aids researchers in their search for publications relevant to the studies they intend to conduct by using keywords from databases. Bibliometric analysis assists researchers in determining the current and significant trends of the study, the most prolific and prominent authors and countries’ publications, and the frequency with which the fractional cover of the forest algorithms is discussed in the literature. Additionally, the Bibliometrix R package is a very user-friendly software that can be utilised when carrying out bibliometric analysis, especially in merging citation databases.
The results indicate that the USA and China are the most active countries in the study of fractional cover of forest algorithms. In 1984, the first publication on the fractional cover of forest was published. The number of publications increased slightly between then and 2002, However, the number of publications has increased in subsequent years. A total of 955 documents were retrieved related to the fractional cover of forest from 69 countries, and most publications were in English. The keywords “vegetation”, “forestry”, “remote sensing” and “model” were among the top ten most frequently used in collected publications. This study indicates there is still a shortage of research related to deforestation, tropical forest, carbon emission, and developing countries.
This analysis has identified fewer studies on tropical forests and fewer authors from developing countries engaged in studies on the fractional cover of the forest algorithms. Developing countries like Brazil, Indonesia, Peru, Colombia, Laos, and Myanmar have a plethora of tropical forests, which we are all familiar with. The tropical forest is one of the world’s largest biomes. It contains enormous amounts of biodiversity and carbon stocks and has the highest rates of ongoing habitat conversion of any forest. The findings suggest that more studies should be conducted on the fractional cover of forests algorithms in tropical forests from developing countries.

Author Contributions

All the authors have made a substantial contribution toward the successful completion of this manuscript. Conceptualization, N.M.G., M.N.M.S. and W.S.W.M.J.; methodology, N.M.G., M.N.M.S. and W.S.W.M.J.; software, N.M.G., A.M.M.K. and S.N.M.S.; validation, N.M.G., M.N.M.S. and W.S.W.M.J.; formal analysis, N.M.G., A.M.M.K. and S.N.M.S.; investigation, N.M.G., M.N.M.S. and W.S.W.M.J.; resources, N.M.G., A.M.M.K. and S.N.M.S. data curation, N.M.G.; writing—original draft preparation, N.M.G., A.M.M.K. and S.N.M.S.; writing—review and editing, N.M.G., M.N.M.S., W.S.W.M.J., A.M.M.K. and S.N.M.S.; visualisation, N.M.G. and W.S.W.M.J.; supervision, M.N.M.S. and W.S.W.M.J.; project administration, N.M.G. All authors have read and agreed to the published version of the manuscript.

Funding

The authors gratefully acknowledge the APC was funded by research grants UKM-YSD-2020-001, GP-2021-K006722 and TAP-K006722.

Acknowledgments

The authors are grateful for this work supported by Public Service Department Malaysia and Earth Observation Centre, Institute of Climate Change, and Universiti Kebangsaan Malaysia for providing the equipment and guidance. Not forgotten, Distinguished Biswajeet Pradhan of the University of Technology Sydney and the Universiti Kebangsaan Malaysia for his generous support of this work.

Conflicts of Interest

The authors declare no conflict of interest.

References

  1. FAO. Global Forest Resources Assessment 2020: Terms and Definitions. For. Resour. Assess. Work. Pap. 2020, 32. [Google Scholar]
  2. Chazdon, R.L.; Brancalion, P.H.S.; Laestadius, L.; Bennett-Curry, A.; Buckingham, K.; Kumar, C.; Moll-Rocek, J.; Vieira, I.C.G.; Wilson, S.J. When Is a Forest a Forest? Forest Concepts and Definitions in the Era of Forest and Landscape Restoration. Ambio 2016, 45, 538–550. [Google Scholar] [CrossRef] [PubMed] [Green Version]
  3. Ferretti-Gallon, K.; Busch, J. What Drives Deforestation and What Stops It? A Meta-Analysis of Spatially Explicit Econometric Studies. SSRN Electron. J. 2014, 11, 3–23. [Google Scholar] [CrossRef] [Green Version]
  4. Brodribb, T.; Powers, J.; Cochard, H.; Choat, B. Hanging by a Thread? Forests and Drought. Science 2020, 368, 261–266. [Google Scholar] [CrossRef] [PubMed]
  5. Malhi, Y.; Franklin, J.; Seddon, N.; Solan, M.; Turner, M.G.; Field, C.B.; Knowlton, N.; Solan, M.; Mg, T.; Cb, F.; et al. Climate Change and Ecosystems: Threats, Opportunities and Solutions. Trans. R. Soc. B 2020, 375, 20190104. [Google Scholar] [CrossRef] [PubMed] [Green Version]
  6. Xie, Y.; Peng, M. Forest Fire Forecasting Using Ensemble Learning Approaches. Neural Comput. Appl. 2019, 31, 4541–4550. [Google Scholar] [CrossRef]
  7. Nienhuis, S.; Wilson, R. Invasive Species in Ontario: The Threat, the Strategy, and the Law. For. Chron. 2018, 94, 97–102. [Google Scholar] [CrossRef]
  8. Linnakoski, R.; Kasanen, R.; Dounavi, A.; Forbes, K.M. Editorial: Forest Health Under Climate Change: Effects on Tree Resilience, and Pest and Pathogen Dynamics. Front. Plant Sci. 2019, 10, 1–3. [Google Scholar] [CrossRef] [Green Version]
  9. Trumbore, S.; Brando, P.; Hartmann, H. Forest Health and Global Change. Science 2015, 349, 814–818. [Google Scholar] [CrossRef] [Green Version]
  10. Steel, B.S. Deforestation and Forest Degradation. In Science and Politics: An A-to-Z Guide to Issues and Controversies; CQ Press: Washington, DC, USA, 2014. [Google Scholar] [CrossRef]
  11. World Wide Fund for Nature. Living Planet Report 2018: Aiming Higher; Grooten, M., Almond, R.E.A., WWF (Organization), Eds.; WWF—World Wide Fund for Nature: Gland, Switzerland, 2018; ISBN 978-2-940529-90-2. [Google Scholar]
  12. Zari, M.P. Utilizing Relationships between Ecosystem Services, Built Environments, and Building Materials; Elsevier Ltd.: Amsterdam, The Netherlands, 2017; ISBN 9780081007075. [Google Scholar]
  13. Li, Y.; Brando, P.M.; Randerson, J.T.; Morton, D.C.; Lawrence, D.M. Carbon Storage in Remaining Tropical Forests. Nat. Commun. 2022, 13, 1964. [Google Scholar] [CrossRef] [PubMed]
  14. Foley, J.A.; DeFries, R.; Asner, G.P.; Barford, C.; Bonan, G.; Carpenter, S.R.; Chapin, F.S.; Coe, M.T.; Daily, G.C.; Gibbs, H.K.; et al. Global Consequences of Land Use. Science 2005, 309, 570–574. [Google Scholar] [CrossRef] [PubMed] [Green Version]
  15. Gao, Y.; Skutsch, M.; Paneque-Gálvez, J.; Ghilardi, A. Remote Sensing of Forest Degradation: A Review. Environ. Res. Lett. 2020, 15, 103001. [Google Scholar] [CrossRef]
  16. Mansourian, S.; Howard, I.B.; Lake, F.K.; Parrotta, J.; Bhasme, S.; Balaji, P.; Bixler, R.P.; Sayer, J. Putting the Pieces Together: Integration for Forest Landscape Restoration Implementation. Land Degrad. Dev. 2020, 31, 419–429. [Google Scholar] [CrossRef]
  17. For, G.; Landscape, F.; In, R.; Tropics, T.H.E. Guidelines for Forest Landscape Restoration in the Tropics; International Tropical Timber Organization (ITTO): Yokohama, Japan, 2020; ISBN 9784865070644. [Google Scholar]
  18. Lausch, A.; Erasmi, S.; King, D.J.; Magdon, P.; Heurich, M. Understanding Forest Health with Remote Sensing -Part I—A Review of Spectral Traits, Processes and Remote-Sensing Characteristics. Remote Sens. 2016, 8, 1029. [Google Scholar] [CrossRef] [Green Version]
  19. Kamarulzaman, A.M.M.; Jaafar, W.S.W.M.; Maulud, K.N.A.; Saad, S.N.M.; Omar, H.; Mohan, M. Integrated Segmentation Approach with Machine Learning Classifier in Detecting and Mapping Post Selective Logging Impacts Using UAV Imagery. Forests 2022, 13, 48. [Google Scholar] [CrossRef]
  20. Koch, B. Remote Sensing Supporting National Forest Inventories NFA. In FAO Knowledge Reference for National Forest Assessments; FAO: Rome, Italy, 2013; pp. 1–18. [Google Scholar]
  21. Shanmugapriya, P.; Rathika, S.; Ramesh, T.; Janaki, P. Applications of Remote Sensing in Agriculture - A Review Applications of Remote Sensing in Agriculture—A Review. Int. J. Curr. Microbiol. App. Sci. 2019, 8, 2270–2283. [Google Scholar] [CrossRef]
  22. Lin, Y.; An, W.; Gan, M.; Shahtahmassebi, A.; Ye, Z.; Huang, L.; Zhu, C.; Huang, L.; Zhang, J.; Wang, K. Spatial Grain Effects of Urban Green Space Cover Maps on Assessing Habitat Fragmentation and Connectivity. Land 2021, 10, 1065. [Google Scholar] [CrossRef]
  23. Brown, L.A.; Ogutu, B.O.; Dash, J. Agricultural and Forest Meteorology Tracking Forest Biophysical Properties with Automated Digital Repeat Photography: A Fisheye Perspective Using Digital Hemispherical Photography from below the Canopy. Agric. For. Meteorol. 2020, 287, 107944. [Google Scholar] [CrossRef]
  24. Lechner, A.M.; Foody, G.M.; Boyd, D.S. Applications in Remote Sensing to Forest Ecology and Management. One Earth 2020, 2, 405–412. [Google Scholar] [CrossRef]
  25. Huete, A.R. Vegetation Indices, Remote Sensing and Forest Monitoring. Geogr. Compass 2012, 9, 513–532. [Google Scholar] [CrossRef]
  26. Jia, K.; Liang, S.; Liu, S.; Li, Y.; Xiao, Z.; Yao, Y. Estimation Using General Regression Neural. IEEE Trans. Geosci. Remote Sens. 2015, 53, 4787–4796. [Google Scholar] [CrossRef]
  27. Wang, X.; Jia, K.; Liang, S.; Zhang, Y. Fractional Vegetation Cover Estimation Method Through Dynamic Bayesian Network Combining Radiative Transfer Model and Crop Growth Model. IEEE Trans. Geosci. Remote Sens. 2016, 54, 7442–7450. [Google Scholar] [CrossRef]
  28. Hashim, M.; Pour, A.B.; Chong, K.W. Tropical Forest Degradation Monitoring Using ETM+ and MODIS Remote Sensing Data in the Peninsular Malaysia. IOP Conf. Ser. Earth Environ. Sci. 2014, 18, 012011. [Google Scholar] [CrossRef] [Green Version]
  29. Fisher, A.G.; Mills, C.H.; Lyons, M.; Cornwell, W.K. Remote Sensing of Trophic Cascades: Multi-Temporal Landsat Imagery Reveals Vegetation Change Driven by the Removal of an Apex Predator. Landsc. Ecol. 2021, 36, 1341–1358. [Google Scholar] [CrossRef]
  30. Pfeifer, M.; Kor, L.; Nilus, R.; Turner, E.; Cusack, J.; Lysenko, I.; Khoo, M.; Chey, V.K.; Chung, A.C.; Ewers, R.M. Remote Sensing of Environment Mapping the Structure of Borneo’s Tropical Forests across a Degradation Gradient. Remote Sens. Environ. 2016, 176, 84–97. [Google Scholar] [CrossRef] [Green Version]
  31. Forkuor, G.; Conrad, C.; Thiel, M.; Zoungrana, B.J. Multiscale Remote Sensing to Map the Spatial Distribution and Extent of Cropland in the Sudanian Savanna of West Africa. Remote Sens. 2017, 9, 839. [Google Scholar] [CrossRef] [Green Version]
  32. Gao, L.; Wang, X.; Alan, B.; Tian, Q.; Wang, Y.; Verrelst, J. ISPRS Journal of Photogrammetry and Remote Sensing Remote Sensing Algorithms for Estimation of Fractional Vegetation Cover Using Pure Vegetation Index Values: A Review. ISPRS J. Photogramm. Remote Sens. 2020, 159, 364–377. [Google Scholar] [CrossRef]
  33. Wang, B.; Waters, C.; Orgill, S.; Gray, J.; Cowie, A.; Clark, A.; Liu, D.L. Science of the Total Environment High Resolution Mapping of Soil Organic Carbon Stocks Using Remote Sensing Variables in the Semi-Arid Rangelands of Eastern Australia. Sci. Total Environ. 2018, 630, 367–378. [Google Scholar] [CrossRef]
  34. Tarigan, S.D. Land Cover Change and Its Impact on Flooding Frequency of Batanghari Watershed, Jambi Province, Indonesia. Procedia Environ. Sci. 2016, 33, 386–392. [Google Scholar] [CrossRef] [Green Version]
  35. Ghaffarian, S.; Kerle, N.; Filatova, T. Remote Sensing-Based Proxies for Urban Disaster Risk Management and Resilience: A Review. Remote Sens. 2018, 10, 1760. [Google Scholar] [CrossRef]
  36. Villarreal, M.L.; Norman, L.M.; Buckley, S.; Wallace, C.S.A.; Coe, M.A. Remote Sensing of Environment Multi-Index Time Series Monitoring of Drought and Fi Re Effects on Desert Grasslands. Remote Sens. Environ. 2016, 183, 186–197. [Google Scholar] [CrossRef] [Green Version]
  37. Asner, G.P.; Knapp, D.E.; Cooper, A.N.; Bustamante, M.M.C.; Olander, L.P. Ecosystem Structure throughout the Brazilian Amazon from Landsat Observations and Automated Spectral Unmixing. Earth Interact. 2005, 9, 1–31. [Google Scholar] [CrossRef] [Green Version]
  38. Sensing, A.R.; Edition, S. Fractional Vegetation Cover; Elsevier Ltd.: Amsterdam, The Netherlands, 2020; ISBN 9780128158265. [Google Scholar]
  39. Chen, T.H.; Henderson-Sellers, A.; Milly, P.C.D.; Pitman, A.J.; Beljaars, A.C.M.; Polcher, J.; Abramopoulos, F.; Boone, A.; Chang, S.; Chen, F.; et al. Cabauw Experimental Results from the Project for Intercomparison of Land-Surface Parameterization Schemes. J. Clim. 1997, 10, 1194–1215. [Google Scholar] [CrossRef]
  40. Jia, K.; Liang, S.; Wei, X.; Li, Q.; Du, X.; Jiang, B.; Yao, Y.; Zhao, X.; Li, Y. Fractional Forest Cover Changes in Northeast China from 1982 to 2011 and Its Relationship with Climatic Variations. IEEE J. Sel. Top. Appl. Earth Obs. Remote Sens. 2015, 8, 775–783. [Google Scholar] [CrossRef]
  41. Ismail, S.; Nason, E.; Marjanovic, S.; Grant, J. Bibliometrics as a Tool for Supporting Prospective R&D Decision-Making in the Health Sciences: Strengths, Weaknesses and Options for Future Development. Rand Health Q. 2012, 1, 11. [Google Scholar] [PubMed]
  42. Waltman, L.; Noyons, E. Bibliometrics for Research Management and Research Evaluation: A Brief Introduction. Cwts 2018, 24. [Google Scholar]
  43. Uribe-Toril, J.; Ruiz-Real, J.L.; Haba-Osca, J.; de Pablo Valenciano, J. Forests’ First Decade: A Bibliometric Analysis Overview. Forests 2019, 10, 72. [Google Scholar] [CrossRef] [Green Version]
  44. Aria, M.; Cuccurullo, C. Bibliometrix: An R-Tool for Comprehensive Science Mapping Analysis. J. Informetr. 2017, 11, 959–975. [Google Scholar] [CrossRef]
  45. Newman, I.; Covrig, D.M. Building Consistency between Title, Problem Statement, Purpose, & Research Questions to Improve the Quality of Research Plans and Reports. New Horiz. Adult Educ. Hum. Resour. Dev. 2013, 25, 70–79. [Google Scholar] [CrossRef]
  46. Dewan, P.; Gupta, P. Writing the Title, Abstract and Introduction: Looks Matter! Indian Pediatr. 2016, 53, 235–241. [Google Scholar] [CrossRef] [PubMed]
  47. Padberg, M.W.; Wolsey, L.A. Fractional Covers for Forests and Matchings. Math. Program. 1984, 29, 1–14. [Google Scholar] [CrossRef]
  48. Sweileh, W.M.; Al-Jabi, S.W.; AbuTaha, A.S.; Zyoud, S.H.; Anayah, F.M.A.; Sawalha, A.F. Bibliometric Analysis of Worldwide Scientific Literature in Mobile—Health: 2006-2016. BMC Med. Inform. Decis. Mak. 2017, 17, 1–12. [Google Scholar] [CrossRef] [PubMed] [Green Version]
  49. Godutti, D. Biology Concepts and Challenges. Available online: https://legacy.cnx.org/content/col11665/1.1 (accessed on 23 September 2022).
  50. He, D.; Cao, S.; Le, Y.; Chen, Y.; Wang, M.; Qian, B. A Bibliometric Analysis of Application of VR Technologies in Stroke Rehabilitation from 2001 to 2021 in China. In Proceedings of the 2nd International Symposium on Artificial Intelligence for Medicine Sciences, Beijing, China, 29–31 October 2021. [Google Scholar] [CrossRef]
  51. Choi, J.; Yi, S.; Lee, K.C. Analysis of Keyword Networks in MIS Research and Implications for Predicting Knowledge Evolution. Inf. Manag. 2011, 48, 371–381. [Google Scholar] [CrossRef]
  52. Lazonder, A.W.; Janssen, N. Quotation Accuracy in Educational Research Articles. Educ. Res. Rev. 2021, 35, 100430. [Google Scholar] [CrossRef]
  53. Norman, J.M.; Kustas, W.P.; Humes, K.S. Source Approach for Estimating Soil and Vegetation Energy Fluxes in Observations of Directional Radiometric Surface Temperature. Agric. For. Meteorol. 1995, 77, 263–293. [Google Scholar] [CrossRef]
  54. Steduto, P.; Hsiao, T.C.; Raes, D.; Fereres, E. Aquacrop-the FAO Crop Model to Simulate Yield Response to Water: I. Concepts and Underlying Principles. Agron. J. 2009, 101, 426–437. [Google Scholar] [CrossRef] [Green Version]
  55. Kumar, P.; Foufoula-Georgiou, E. Wavelet Analysis for Geophysical Applications. Rev. Geophys. 1997, 35, 385–412. [Google Scholar] [CrossRef] [Green Version]
  56. Glenn, E.P.; Huete, A.R.; Nagler, P.L.; Nelson, S.G. Relationship between Remotely-Sensed Vegetation Indices, Canopy Attributes and Plant Physiological Processes: What Vegetation Indices Can and Cannot Tell Us about the Landscape. Sensors 2008, 8, 2136–2160. [Google Scholar] [CrossRef] [PubMed] [Green Version]
  57. Somers, B.; Asner, G.P.; Tits, L.; Coppin, P. Endmember Variability in Spectral Mixture Analysis: A Review. Remote Sens. Environ. 2011, 115, 1603–1616. [Google Scholar] [CrossRef]
  58. Walko, R.L.; Band, L.E.; Baron, J.; Kittel, T.G.F.; Lammers, R.; Lee, T.J.; Ojima, D.; Pielke, R.A.; Taylor, C.; Tague, C.; et al. Coupled Atmosphere–Biophysics–Hydrology Models for Environmental Modeling. J. Appl. Meteorol. 2000, 39, 931–944. [Google Scholar] [CrossRef]
  59. Painter, T.H.; Rittger, K.; McKenzie, C.; Slaughter, P.; Davis, R.E.; Dozier, J. Retrieval of Subpixel Snow Covered Area, Grain Size, and Albedo from MODIS. Remote Sens. Environ. 2009, 113, 868–879. [Google Scholar] [CrossRef] [Green Version]
  60. Dennison, P.E.; Roberts, D.A. Endmember Selection for Multiple Endmember Spectral Mixture Analysis Using Endmember Average RMSE. Remote Sens. Environ. 2003, 87, 123–135. [Google Scholar] [CrossRef]
  61. Panagos, P.; Borrelli, P.; Meusburger, K.; Alewell, C.; Lugato, E.; Montanarella, L. Estimating the Soil Erosion Cover-Management Factor at the European Scale. Land Use Policy 2015, 48, 38–50. [Google Scholar] [CrossRef]
  62. Ducoudré, N.I.; Laval, K.; Perrier, A. SECHIBA, a New Set of Parameterizations of the Hydrologic Exchanges at the Land-Atmosphere Interface within the LMD Atmospheric General Circulation Model. J. Clim. 1993, 6, 248–273. [Google Scholar] [CrossRef]
  63. Pfirrman, S.J.; Yheulon, C.G.; Parziale, J.R. The Hirsch Index and Self-Citation in Academic Physiatry among Graduate Medical Education Program Directors. Am. J. Phys. Med. Rehabil. 2022, 101, 294–297. [Google Scholar] [CrossRef] [PubMed]
  64. Mitchell, A.L.; Rosenqvist, A.; Mora, B. Current Remote Sensing Approaches to Monitoring Forest Degradation in Support of Countries Measurement, Reporting and Verification (MRV) Systems for REDD+. Carbon Balance Manag. 2017, 12, 9. [Google Scholar] [CrossRef] [Green Version]
  65. Hoscilo, A.; Zagajewski, B.; Mouketou-tarazewicz, D. Assessment of Sentinel-2 Satellite Images and Random Forest Classifier for Assessment of Sentinel-2 Satellite Images and Random Forest Classifier for Rainforest Mapping in Gabon. Forests 2020, 11, 941. [Google Scholar] [CrossRef]
  66. Mohan, M.; Leite, R.V.; Broadbent, E.N.; Wan Mohd Jaafar, W.S.; Srinivasan, S.; Bajaj, S.; Dalla Corte, A.P.; do Amaral, C.H.; Gopan, G.; Saad, S.N.M.; et al. Individual Tree Detection Using UAV-Lidar and UAV-SfM Data: A Tutorial for Beginners. Open Geosci. 2021, 13, 1028–1039. [Google Scholar] [CrossRef]
  67. Ab Rahman, A.A.; Wan Mohd Jaafar, W.S.; Abdul Maulud, K.N.; Noor, N.M.; Mohan, M.; Cardil, A.; Silva, C.A.; Che’Ya, N.N.; Naba, N.I. Applications of Drones in Emerging Economies: A Case Study of Malaysia. In Proceedings of the 2019 6th International Conference on Space Science and Communication (IconSpace), Johor Bahru, Malaysia, 28–30 July 2019; pp. 35–40. [Google Scholar]
  68. Indarto, J.; Mutaqin, D.J. An Overview of Theoretical and Empirical Studies on Deforestation. J. Int. Dev. Coop. 2016, 22, 107–120. [Google Scholar] [CrossRef]
  69. Siti-Nor-Maizah, S.; Wan-Shafrina, W.; Khairul-Nizam, A.; Aisyah-Marliza, M.; Hamdan, O. Determination of Emission Factor from Logging Operations in Ulu Jelai Forest Reserve, Pahang Using the Integration of UAV and High Resolution Imageries. JTFS 2022, 34, 247–257. [Google Scholar] [CrossRef]
  70. UNFCCC. Report of the Conference of the Parties on Its Fifteenth Session, Held in Copenhagen from 7 to 19 December 2009. Available online: https://unfccc.int/resource/docs/2009/cop15/eng/11a01.pdf (accessed on 15 May 2022).
Figure 2. Growth of publication by year.
Forests 13 01664 g002
Figure 3. Most productive countries study on the fractional cover of forest algorithms.
Forests 13 01664 g003
Figure 4. Most cited countries study the fractional cover of forest algorithms.
Forests 13 01664 g004
Figure 5. Network visualisation map (WoS database) of the co-authorship based on authors that have a minimum of one number of citations (fractional counting).
Forests 13 01664 g005
Figure 6. Network visualisation map (WoS database) of the co-authorship based on research from countries that have a minimum of one citation and one number of documents (fractional counting).
Forests 13 01664 g006
Figure 7. Frequently author’s keywords from Word Cloud.
Forests 13 01664 g007
Figure 8. VOSviewer visualisation (WoS database) of a term co-occurrence network based on title and abstract fields.
Forests 13 01664 g008
Table 1. Type of documents.
Document TypesTotal Publications%
article78782.41
article: book chapter40.42
article: data paper30.31
article: early access40.42
article: proceedings paper131.36
book chapter60.63
conference paper565.86
conference review40.42
erratum10.10
proceedings paper656.81
review111.15
short survey10.10
Total955100.00
Table 2. Source type.
LanguageTotal Publications(%)
English92496.75
Chinese252.62
French10.10
Polish20.21
Russian10.10
Spanish20.21
Total955100.00
Table 3. Most active authors.
AuthorsArticlesArticles Fractionalized *AffiliationCountry
Xiao-Yan Li224.33Beijing Normal UniversityChina
Gregory P. Asner215.20Carnegie InstitutionThe USA
Jouni Pulliainen213.62Finnish Meteorological InstituteFinland
Jinfei Wang214.27Beijing Normal UniversityChina
Sari Metsämäki173.17Finnish Meteorological InstituteFinland
Yongguang Zhang162.62Nanjing UniversityChina
Kari Luojus132.38Finnish Meteorological InstituteFinland
Dar A. Roberts122.99University of CaliforniaThe USA
Yunjun Yao121.71Beijing Normal UniversityChina
Kun Jia111.30Beijing Normal UniversityChina
* Note: Fractional authorship quantifies individual author’s contributions to a published set of papers (following hypothesis of uniform contribution of all co-authors at each document.
Table 4. Citations metrics.
ItemDescriptionResults
Main Information About DataTimespan1984–2021
Sources (Journals, Books, etc.)325
Documents955
Average years from publication8.53
Average citations per document28.93
Average citations per year per document2.898
References3.6374
Authors CollaborationSingle-authored documents44
Documents per Author0.328
Authors per Document3.05
Co-Authors per Documents4.77
Collaboration Index3.15
Table 5. Most Global Cited Documents.
No.PaperArticleTCTC per YearNormalised TC
1Norman J.M. et al. [53]Source approach for estimating soil and vegetation energy fluxes in observations of directional radiometric surface temperature104437.295.49
2Steduto P. et al. [54]AquaCrop—The FAO crop model to simulate yield response to water: I. concepts and underlying principles93566.7911.42
3Kumar P. and Foufoula-Georgiou [55]Wavelet analysis for geophysical applications66625.625.69
4Glenn E.P. et al. [56]Relationship between remotely-sensed vegetation indices, canopy attributes and plant physiological processes: What vegetation indices can and cannot tell us about the landscape44529.678.74
5Somers B. et al. [57] Endmember variability in Spectral Mixture Analysis: A review44036.6710.54
6Walko R.L. et al. [58]Coupled atmosphere–biophysics–hydrology models for environmental modelling42018.265.19
7Painter T.H. et al. [59]Retrieval of subpixel snow-covered area, grain size, and albedo from MODIS36125.794.41
8Dennison P.E. and Roberts D.A. [60] Endmember selection for multiple endmember spectral mixture analysis using endmember average RMSE 32316.154.29
9Panagos P. et al. [61]Estimating the soil erosion cover-management factor at the European scale31439.2510.10
10Ducoudre N.I. et al. [62]SECHIBA, a new set of parameterizations of the hydrologic exchanges at the land-atmosphere interface within the LMD. Atmospheric General Circulation Model30610.202.92
Table 6. Most active source (journal) titles.
Sources TitlePublisherTPTCh-Index
Remote Sensing of EnvironmentElsevier133758551
Remote SensingMDPI78116520
Agricultural and Forest MeteorologyElsevier42279022
International Journal of Remote SensingTaylor & Francis Ltd3885518
International Journal of Applied Earth Observation and GeoinformationElsevier36106819
ISPRS Journal of Photogrammetry and Remote SensingElsevier2372414
IEEE Journal of Selected Topics In Applied Earth Observations And Remote SensingIEEE-Inst Electrical and Electronics Engineers Inc.141368
IEEE Transactions on Geoscience and Remote SensingIEEE-Inst Electrical Electronics Engineers Inc.1432010
Water Resources ResearchAmerican Geophysical Union101858
Ecological IndicatorsElsevier92095
Publisher’s Note: MDPI stays neutral with regard to jurisdictional claims in published maps and institutional affiliations.