Abstract
Identification of forest burn severity is essential for fire assessments and a necessary procedure in modern forest management. Due to the low efficiency and labor intensity of the current post-fire field survey in China’s Forestry Standards, the limitation of temporal resolution of satellite imagery, and poor objectivity of manual interpretations, a new method for automatic extraction of forest burn severity based on small visible unmanned aerial vehicle (UAV) images is proposed. Taking the forest fires which occurred in Anning city of Yunnan Province in 2019 as the study objects, post-fire imagery was obtained by a small, multi-rotor near-ground UAV. Some image recognition indices reflecting the variations in chlorophyll loss effects in different damaged forests were developed with spectral characteristics customized in A and C, and the texture features such as the mean, standard deviation, homogeneity, and shape index of the length–width ratio. An object-oriented method is used to determine the optimal segmentation scale for forest burn severity and a multilevel rule classification and extraction model is established to achieve the automatic identification and mapping. The results show that the method mentioned above can recognize different types of forest burn severity: unburned, damaged, dead, and burnt. The overall accuracy is 87.76%, and the Kappa coefficient is 0.8402, which implies that the small visible UAV can be used as a substitution for the current forest burn severity survey standards. This research is of great practical significance for improving the efficiency and precision of forest fire investigation, expanding applications of small UAVs in forestry, and developing an alternative for forest fire loss assessments in the forestry industry.
1. Introduction
As an essential ecological factor in forest ecosystems, forest fires play a crucial role in promoting the succession and renewal of fire-dependent ecosystems and maintaining biodiversity. Nonetheless, uncontrolled forest fires can become disasters, causing significant loss of forest vegetation and the ecological environment and even casualties. Consequently, the prevention and control of forest and grassland fires have been cause for worldwide concern [1,2]. The heterogeneous forest patches consisting of various trees with various amounts of damage (e.g., burnt, dead, damaged, and unburned) will be shaped post-fire. According to the extent of fire damage, the burned areas can be divided, sampled, surveyed, and mapped, which is an essential part of fire investigations and assessments but is also vital in modern forest management. Prompt and accurate acquisition of forest burn severity is necessary to provide scientific assessments of the direct economic losses, which are of great practical significance to effectively establish fire archives, addressing firefighting emergencies, fire containment infrastructure planning, and construction. It is also meaningful for forestry judicial appraisals and insurance compensation [3,4,5]. The current forest burn severity investigations mainly involve field work and mapping, sample plots, boundary inventories at the tree scale, trunk and crown damage identification, satellite remote sensing-assisted interpretations and mapping, and disaster damage patches division [6,7]. In particular, the state forestry department issued the forestry industry standards for the forest burn severity investigation [8]. Due to the labor-intensive and time-consuming procedures, low efficiency, and high cost, these methods lead to problems such as the intense subjectivity of damage identification and the difficulty of map patch division. With the emergence of MODIS, NOAA, and Landsat satellite remote sensing data, researchers have tried to map the forest burn severity by spectral indices, such as the burned area index (BAI), global environment monitoring index (GEMI), normalized difference vegetation index (NDVI) and enhanced vegetation index (EVI), which mainly focus on extracting large-scale burned areas from satellite remote sensing images [9,10,11,12,13]. However, the resolution limitation and data availability lead to the burn intensities and grades failing to meet the requirements of determining forest damage effectively. Small UAVs have the advantages of light, portability, and easy operation, strong adaptability to field environments, flexible data acquisition, high spatial resolution, and economic efficiency. They have been gradually applied in forest mapping, dominant species classification, gap extraction, and disaster monitoring, which show the power to conduct precise forestry measurements [14,15,16,17]. For example, UAVs can be utilized to measure tree parameters and establish optimal DBH-crown widths for detailed forest resource inventory [18], identify the forest community’s health [19], obtain the degree of pest and disease infection [20,21,22], and monitor forest fires [23]. Using light and small UAVs to obtain high-resolution images of fire sites quickly provides a prospect reflecting the forest health and damage degree objectively. It has significant application potential for forest regions with poor transportation conditions, complex mountainous environments, and high risk during field work.
Due to the unique image rules for remote sensing, forests are devastated by fires and contain burnt, dead, damaged, and unburned areas with heterogeneous spectral and textural features. At the same time, the rich texture information of high-resolution images can compensate for the lack of spectral information [24], which will also be conducive to addressing the phenomena of the same objects with different spectra or identical spectra from different objects. With high resolution and rich spatial information, UAV imagery is suitable for monitoring forest fires [25]. Some researchers attempt to identify forest burn area or severity from UAV images based on pixel classification, such as the Maximum Likelihood (MLH), Spectral Angle Map (SAM), and Normalized Difference Vegetation Index (NDVI) threshold method [26,27,28]. However, due to the disadvantages of the mixed pixel characteristics of damaged tree pixels and the salt and pepper phenomenon resulting from pixel spectral features, the results continue to be of low precision and unreliable [29]. The object-oriented classification method uses a set of pixels similar to the object and has the advantage of integrating multiple image recognition features such as texture, spatial relations, and spectral features of the object [30,31,32]. It is extensively applied in object identification using satellite and UAV images, which makes it possible to extract forest fire damage severity from high-resolution UAV images [33,34,35,36]. However, the existing forest burn severity studies seldom take advantage of the object-oriented approach. Additionally, the forest burn severity is often extracted to light, medium, and heavy classes [37,38] rather than substantive grades corresponding to the national forestry industrial fire assessment standards, which are more practical in forest management. Moreover, light and small UAVs are generally equipped with red (R), green (G), and blue (B) visible light band sensors, which makes it a significant challenge to obtain the various characteristics of different fire loss levels from only three bands. Thus, the feature definition of forest damaged levels from fire and recognition algorithms deserves further work. A small UAV image-based methodology is proposed to identify forest burn severity. Taking the forest fire in Anning city of Yunnan Province in 2019 as the study area, a small, multi-rotor near-ground UAV DJI Pro4 was used to collect remote sensing images. Based on spectral analysis of the main land cover, some remotes sensing indices that reflect the variations in chlorophyll loss effects in burnt, dead, damaged, and unburned forests were developed with a customized spectrum, particularly A, C, texture feature mean, standard deviation, homogeneous and shape index of the length-width ratio. Then, an object-oriented method is presented to extract different types of forest burn severity based on optimal segmentation and a multilevel rule classification recognition model. Finally, the performance of small visible UAVs based on objected-oriented methods to identify the forest burn severity alternatively to the field survey in National Forestry Standards is evaluated and discussed by precision validation and comparison with the recently widely used SVM.
2. Materials and Methods
2.1. Study Area
The fires are located in Wuyue Village Bajie Town, Anning City (24°33′28.026″–24°33′25.624″ N, 102°19′37.154″–102°21′43.812″ E), Yunnan Province and occurred on 13 May 2019, (Figure 1). The study area is part of the fire region representing all forest burn severity types in forestry standards mentioned [8]. Over 2500 people fought hard for nearly 72 h to suppress all the wildfires. According to the local forestry bureau on-site survey, this forest fire was a crown fire accompanied by surface fire, and the total woodland fire acreage of approximately 386.7 hm2. The primary vegetation type at the research site consists of coniferous and broad-leaved mixed forest, and the main dominant tree species are Pinus yunnanensis, Pinus armandi, and Cyclobalanopsis glaucoides. Furthermore, adjacent to Kunming, the dense population and frequent human activities give rise to high ignition rates, and the monsoon climate provides a warm, dry winter and moderately hot, humid summer in the study region. The mountainous and rugged topography causes climate change for this region’s elevations, and there is underdeveloped transportation, which causes this location to experience frequent fire occurrences that are difficult to suppress. The local fire prohibited period is from December to the next year before the rainy season, usually at the end of May. Once the rainy season arrives, the vegetation in the burned area will quickly renew and be in succession.
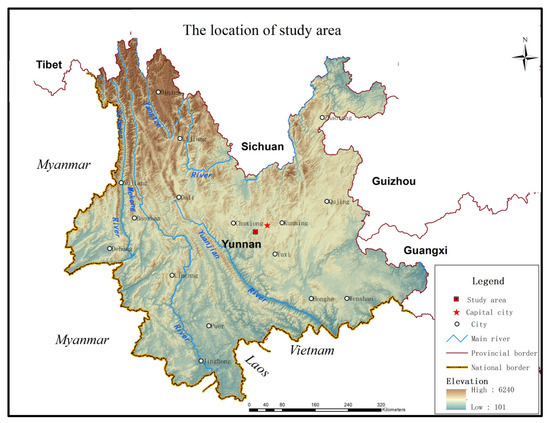
Figure 1.
Location of the study area.
2.2. Data Acquisition and Processing
Using DJI Phantom 4 Pro-quad-rotor light and small UAV and images of burned areas were acquired. This type of UAV has high-precision positioning, and the aircraft can autonomously return during flight [39], which is suitable for operation under complex terrain conditions in the field. UAV images were captured in July 2019 with a flying altitude of 270 m, and the lateral overlap and longitudinal overlap were set to 60% and 75%, respectively. A total of 430 single photos are taken. Image data processing was conducted by Pix4DMapper3.2 software stitching. First, the single-image and corresponding POS (position and orientation system) data after color correction and screening are imported into Pix4DMapper 3.2 software to generate an orthophoto of the post-disaster forest fire using image stitching. Then, several processes are as follows: complete spatial triangulation calculations automatically, densify point cloud, mosaic, output a visible-light orthophoto image (DOM). Finally, the stitched image is in ArcGIS10.5 software. We obtained the most typical sample image in the interior of the experimental forest fire area (Figure 2).
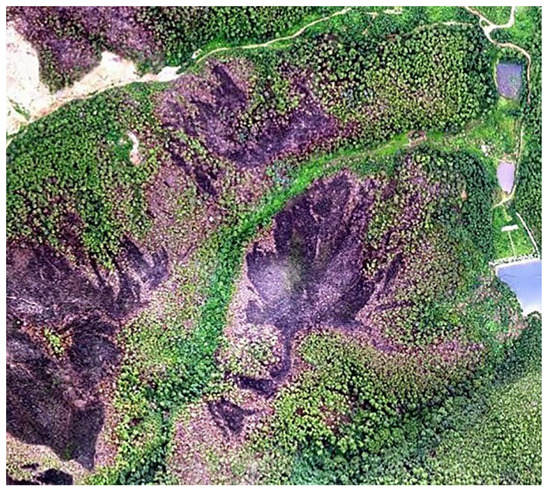
Figure 2.
UAV remote sensing image of forest fire area.
2.3. Analysis of Image Characteristics of Forest Fire Damage
After forest fires occur, tree death results from a long process that is affected by the comprehensive effects of the canopy, cambium, root burns, climate, and pests. The amount of canopies burnt is the most crucial indicator for predicting the survival of trees after a disaster and can be categorized by the number of canopies burnt. According to forest burn severity of field survey standards issued by the Chinese State Forestry Bureau [8], the image segmentation types are defined in four categories burnt, dead, damaged, and unburned. The burnt forest refers that tree crowns being entirely burnt, and the trunk being burned heavily, which cannot be used as timber after logging. The reflection spectrum characteristics of the burnt forest take on the disappearance of the small green reflection peak and minor rising in the red band, which shows a gray tone in the RGB color image. The appearance of the dead forest is that over 2/3 of crowns are burned, which cannot be renewed but can be used as timber. The dead forest spectral reflectance is enhanced in both red and blue bands, the overall color is mainly light brown, and the crown shapes are relatively complete. However, the chlorophyll reflection effect is significantly weakened and only occasionally green. The damaged forest means half or 1/4 of crowns are damaged with branches and leaves burned. The spectral reflectance presents a decrease in the green band and shows green crowns with brown. The unburned forest is those crowns, trunks, and bases of trees are not burned, and the spectral characteristics are the same as those of conventional wood. The image interpretation symbol and characteristics are shown in (Table 1). According to the image coverage of the study area, four auxiliary segmentation categories are added to the image categories: reservoir, bared land, cement building surfaces, and shallow water.

Table 1.
Descriptions of UAV image features.
2.4. Forest Fire Loss Recognition Model
The characteristics reflected by the image objects are the key element for identifying ground objects in remote sensing images, and the images’ spectral, geometric, and texture features are generally used as the basis for identification. There are spectral differences in chlorophyll loss processes in the visible light RGB band of trees with different degrees of damage, and the customized classification spectral characteristics were established based on spectral specificity. Then, the geometric characteristics are described by the object’s length-width ratio, area, and compactness. Texture characteristics are analyzed by mean, standard deviation, homogeneity, contrast, dissimilarity, entropy, angular second moment and correlation of the Grey Level Concurrence Matrix (GLCM). At the same time, in order to highlight the target features in the image and increase the distinguishability of different ground objects, the vegetation index and HIS transform component of the UAV remote sensing visible light image are introduced. Among them, H (Hue), I (Intensity), and S (Saturation) represent the classification to which the color of the ground objects belongs, the brightness degree and the saturation degree of the color, respectively, which can be used as a basis for classifying ground objects with apparent color differences [40].
The RGB spectral characteristics of unburned forest, damaged forest, dead forest, burnt forest, bared land, cement surfaces, and water bodies observed in UAV images after a forest fire in the study area were analyzed. With the help of the remote sensing software ENVI 5.3, more than 30 sample areas of each type of ground object were collected, and the spectral mean and luminance mean values of each class were statistically explored. The pop curve relationship of all types of ground objects is shown in Figure 3.
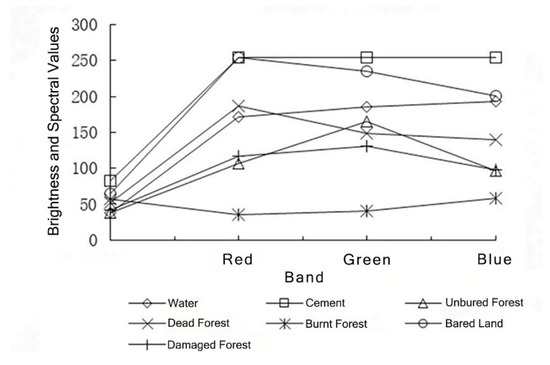
Figure 3.
Responses of the average spectrum and brightness for various land cover.
After determining the feature categories based on the UAV visible light remote sensing images, we then specifically analyzed the correlation of the distribution of the three characteristic parameters in RGB for each type of ground object. Based on the spectral statistics results, the spectral diversity characteristics of the specific RGB three characteristic parameters of various types of ground objects in the images were studied, and the spectral statistics results are shown in Figure 4. From the figure, we can obtain that the image element distribution of burned and dead forest in the R-band has a significant difference, and the image element distribution of unburned forest is more different from that of burned and dead forest in the G-band and R-band. Therefore, the vegetation index can be constructed by combining the G-band and the R-band to distinguish the corresponding ground object types. Comparing bared land and concrete surfaces, the vegetation index can be constructed based on a combination of G-band and B-band differences to differentiate.
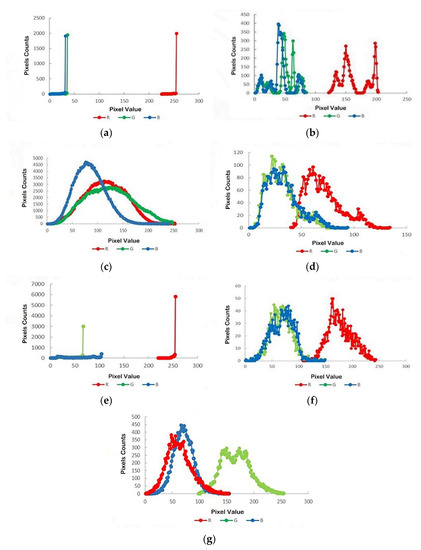
Figure 4.
Examples of RGB pixel distribution map: (a) RGB band pixel value distribution map on cement surface; (b) RGB band pixel value distribution map of water body; (c) RGB band pixel value distribution map of damaged forest; (d) RGB band pixel value distribution map of burnt forest; (e) RGB band pixel value distribution map of bared land; (f) RGB band pixel value distribution map of dead forest; (g) RGB band pixel value distribution map of unburned forest.
2.5. Object-Oriented Extraction of Forest Fire Damage Information
2.5.1. Determine the Optimal Segmentation Scale
This research uses the ESP (estimation of scale parameter) method proposed and applied by Drǎguţ [41] to calculate the optimal segmentation scale. ESP introduces the local variance (LV) to represent the standard deviation within the segmentation results and uses the ROC (rate of change) to obtain the LV change rates. The peak point with obvious change represents the best possible scale. The ROC formula is as follows:
where is the average standard deviation of the target object levels, and is the average standard deviation corresponding to the n-1 object levels below the target level in the formula.
Through continuous segmentation experiments, the optimal segmentation scales for various features in the original image are determined, as shown in (Figure 5a). Considering that the spectral information of undamaged forest tree canopy edges is not uniform, there are many small pixel spots and large amounts of forest seam gaps. The image object segmentation process is easily affected by irrelevant information, which results in fragmentation. The research adopts mathematical morphology filter processing with a structural element of 3 × 3 to simplify the processing of UAV images to remove noise and eliminate some redundancy [42]. Subsequently, the peak value of the LV-ROC broken line (Figure 5b) was obtained to determine the first-rank segmentation scale.

Figure 5.
Optimal segmentation scale obtained by ESP under different images: (a) original image ESP optimal segmentation scale; (b) mathematical morphology filter image ESP optimal segmentation scale.
2.5.2. Object-Oriented Feature Information Extraction
Referring to the excess green index (EXG) and visible band differential vegetation index (VDVI) [43] proposed by predecessors, the vegetation index extraction was performed using visible UAV remote sensing images. The formulas are as follows:
where , , and represent the average values of the red, green and blue three-band pixels, respectively.
Figure 3 shows the characteristics and differences of the spectral response curves of various types of ground objects. Unburned forest shows stronger reflection in the green light band and stronger absorption in the blue light band. Dead forest areas and bared land exhibit vital reflection in the red light band and substantial absorption in the blue light band. Burnt forest and water bodies exhibit stronger reflection in the blue light band and stronger absorption in the red light band. To highlight the characteristics of various types of ground objects and the customized spectral features are further constructed.
where A and C represent the customized spectral features A and C, respectively, and , , and represent the average values of the red, green and blue three-band pixels, respectively.
To distinguish ground objects with significant color differences and the F and N spectral characteristics [44] proposed by predecessors were referred to identify unburned forest areas, burnt forest areas, dead forest areas, and reservoirs.
where F and N represent the customized spectral features F and N, respectively, , , and represent the average values of the red, green, and blue three-band pixels, respectively.
2.6. Support Vector Machine Extraction of Forest Fire Damage Information
Forest burn severity is also extracted by the support vector machine method to verify the performance of the object-oriented method. The support vector machine method is based on statistical theory. For the multi-classification situation involved in this study, a combined model containing multiple binary classifiers can usually be constructed for classification. Commonly used modeling algorithms are one-to-one modeling and one-to-many modeling [45]. The one-to-one method constructs N (N-1)/2 classifiers for N-class classification problems. This method has a large number of classifiers and a large number of calculations, and there is a problem with sample mixing [46]. The one-to-many method constructs N classifiers for N-class classification problems. This method has a relatively small number of classifiers, has a simple structure, and can achieve the same classification effect [47]. Therefore, this study used a one-to-many approach for forest burn severity information extraction.
3. Results
3.1. Multiscale Segmentation Classification Hierarchy
Through continuous segmentation experiments, eCognition 9.1 (Definiens Imaging GmbH, Munich, Germany) tools were used and combined with the ESP evaluation model to obtain the optimal segmentation scales for different ground feature types. According to the principle of segmentation scale from large to small [48], a multi-scale segmentation classification hierarchy table for different ground features was established separately (Table 2). Table 2 shows that the optimal segmentation parameters are different for each type of ground feature. The distribution area of burned forest is large and relatively concentrated with good homogeneity; thus, it is suitable for using large-scale segmentation and the best segmented effect with parameters 368, 0.3, and 0.6. Dead forests are mostly tan patches compared to damaged forests, which are easily segmented and extracted, and are best segmentation at intermediate scale 335, shape and compactness factors of 0.3 and 0.7. As damaged forest patches contain tan, green, and black areas, their composition is complex, and they are not easy to divide compared to the bare land, cement surface, and shallow water within a small area. The optimal segmentation scales of unburned forest are 452 with 0.4 and 0.6 shape and compactness factors, respectively. When damaged forest areas and other small areas’ ground features are segmented together, priority should be given to small-scale ground features, and the experimental results show that when the segmentation parameters are 260, 0.4, and 0.7, the ground features of small areas show good distributions, and there is no over-segmentation phenomenon. In contrast, the physical compositions of the reservoirs are relatively uniform, and their boundaries are clear with a shape factor of 0.7, a compactness factor of 0.6, and a segmentation scale of 438, which is the optimal parameter.

Table 2.
Classification levels of different features.
3.2. Extraction of Forest Fire Loss Information
Based on optimal segmentation scales, the spectral and texture characteristic parameters are selected according to different ground features, and the thresholds of each ground object are determined by the eCognition software platform and human-computer interaction. The hierarchical extraction of forest fire damage areas is proposed according to different classification rules.
Through a continuous information extraction test, we first focus on large-scale unburned forest areas in the first-layer mathematical morphology filter image. The unburned forest contains shrubs and grass, various forest species, forest gaps, and a canopy of edge shadows. Although it presents spectral discrimination from other ground features, the distributions of unburned forest are complex so that the undamaged trees can be extracted into three types. Unburned forest 1 mainly includes shrubs and grass, and the tree crowns are bright green areas. Unburned forest 2 consists of dark green forest and grass areas. Unburned forest 3 consists of a wide variety of forest gap distribution areas. Additionally, the spectral response curves of unburned forest and damaged forest are similar, and there is a misclassification phenomenon when only depending on the spectral characteristics. Therefore, the GLCM correlation components and HIS components of the texture features can be used as momentous specialties to distinguish. The band and aspect ratios and the band mean can be considered auxiliary attributes. The specific classification rules are shown in Table 2 LEVEL 1.
The first layer is followed by other ground feature information extraction in the original UAV image, and the first layer object classification results are merged and inherited on the LEVEL 2 layer. According to the segmentation scale results, the second layer mainly acquires the reservoir information. From Figure 3, it can be seen that the reflectivity of the water body is highest in band 3, preliminary extraction using the customized A spectral features, with the help of feature F and component I, based on the differences in color and brightness, and to separate the reservoir from other objects. Simultaneously, the results of LEVEL 2 segmentation are merged and inherited to the LEVEL 3 layer.
LEVEL 3 principally extracts information from burnt forest areas. The value range of wholly burnt forest and other ground objects does not overlap in bands 1, 2, and 3, and the information is easily differentiated, and the reflection is more robust in the blue band and significant absorption in the red band, which can be combined with A, C and F features for large area extraction. The information extraction results were confounded to some extent with between the shadows of forest gaps and damaged forest tree crowns. However, most forest gap shadows still have green tones, distinguished using the G and R, B band ratios, and VDVI, and the rest of the confusion part can be combined with the texture feature mean and contrast components to distinguish other misclassification ground objects. The segmentation results are further combined and inherited to the lower layer.
LEVEL 4 is mainly designed for forest areas that burnt after the disaster. Dead forest areas have strong reflections on the red band and strong absorption in the blue band. Hence, extensive area extraction can be performed by combining A, C, and N features. Figure 3 shows that the spectral curve of dead forest is similar to that of bared land and performs a partial mis-extraction phenomenon. Due to the high brightness and homogeneity of the bared land part, used homogeneity component of texture features removes the misrepresented bare ground. In addition, a small amount of sporadic green canopy existed in some burned forest areas, and combination of luminance mean, component H, and feature N was used to supplement the omitted part. Similarly, the segmentation results are combined and inherited in the lower layer.
The remaining features include bared land, cement surfaces, shallow water, and damaged forest areas. Because LEVEL 5 is the smallest layer of scale segmentation, there is a partial over-segmentation phenomenon in damaged forest areas. Regarding the appearance, we can first extract the other three feature types with better segmentation. Afterward, comprehensive analysis demonstrated that there is favorable texture separability for bared land, cement surfaces, and shallow water water, and it is easy to distinguish these three types of ground objects by combining features N and A. Finally, the unclassified area is defined as the damaged forest area.
Based on the above analysis, the classification rules for different levels and features are established (Table 3). The results for ground feature types that were extracted by each segmentation layer are synchronized to the same segmentation layer, and a thematic map of the damage types due to forest fire is obtained (Figure 6), can extract shallow water areas, and the effect of the ground objects classification is significantly better than the thematic map of forest fire damage types obtained by using the support vector machine method (Figure 7). Figure 6 illustrates that the entire burned area shows a flowery face-like spatial pattern of forest damage. According to the topography and combustible distribution, the burnt forest is distributed over the middle and upper parts of the mountain slope. The transition to the downslope area consists of the dead forest, and the low-humidity gully bottom is the damaged forest area, which reveals a ring structure, while irregular unburned forest areas appear in the valleys and ridges that are chiefly related to the dampness of the valleys, strong winds on the ridges, scarcity of combustible materials and other factors.

Table 3.
Classification feature rules for different levels.
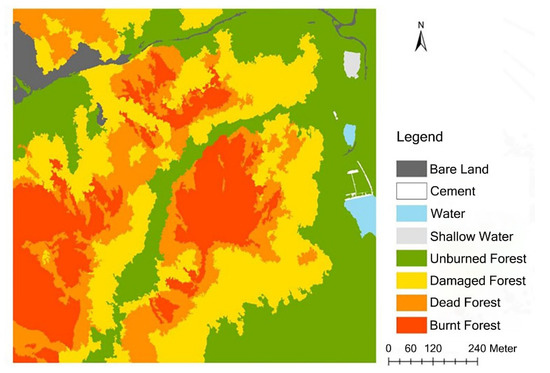
Figure 6.
The classification of forest burn severity based on the object-oriented method.
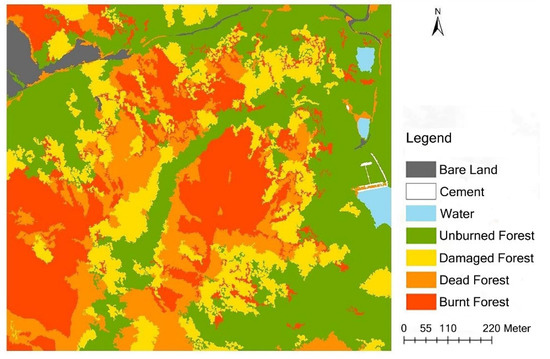
Figure 7.
The classification of forest burn severity based on the support vector machine.
3.3. Forest Burn Severity Information Extraction Accuracy
Object-oriented multi-scale and multi-level classification methods and the support vector machine method were used to obtain information about forest damage in the research area. We combined 515 randomly selected image points and field survey samples to acquire the two-method classification error matrices and accuracies, respectively (Table 4 and Table 5). The table demonstrates that the overall accuracy of the object-oriented multi-scale and multi-level classification method is 87.76% with a Kappa coefficient of 0.8402, and the overall accuracy of the support vector machine method is 76.69% with a Kappa coefficient of 0.6964. The object-oriented multi-scale and multi-level classification method in this research is better than the support vector machine method, and the information extraction accuracy is high. The results show that light and small UAVs can be used to identify the impact of fire on forests. Judging from the various types of forest damage information, the user accuracy for burnt forest is as high as 97.87%, which is significantly different from other damaged types of forest in terms of the spectral characteristic and is why there are no crowns on the burned forest. Second, the user accuracy for the unburned forest is 93.54%, which is in the most marginal position of the image and is only linked together with the damaged forest. It is separate from the state of dead forest and burnt forest so that there is no interlaced area. Meanwhile, both the damaged and unburned forest show green features, resulting in spectral specificity close to each other.

Table 4.
Accuracy evaluation of the object-oriented classification.

Table 5.
Accuracy evaluation of the support vector machine classification.
The information for unburned forest by burning was inevitably omitted when extracting the information for unburned forest. On the other hand, the accuracy for damaged forest is close to that of dead forest, which is approximately 79.5%, the low classification accuracy relative to other feature types is related to the fact that there are some differences in spectral characteristics between dead and damaged forest, but less differences in texture and shape characteristics. The yellowish-green and tan feature distributions of the damaged forest are seen in the image. Thus, the differences in internal characteristics of local patches and unburned forest, dead forest are relatively insignificant. Furthermore, calculating characteristic values such as color and texture will also have an impact on the distinction between disaster types. At the same time, damaged forest are located adjacent to unburned forest, dead forest from burning, and dead forest and burnt forest are close to each other. Due to the different degrees of the burning of various types of objects in forest fires, the types of patches are broken and crisscrossed with each other, and the connectivity is poor. Therefore, both damaged forest and dead fore will cause misclassifications and there are many adjacent patches in the extraction. Furthermore, it is difficult to completely separate these in image segmentation, and there will be erroneous classifications of spots in zones, which result in low classification accuracy.
According to the statistics, the total area where damaged forest, dead forest, and burnt forest is 54.4 hm2. The total acreage of lacerated vegetation is 55.24 hm2, as determined from the visual interpretation. The error rate is 1.52% compared to the visual interpretation, which indicates that the extraction accuracy of the overall area of damage from forest fires is higher than that provided by predecessors UAV surveys. In addition, it can meet the forestry industry accuracy of special surveys and design of 95%. The conclusion reveals that visible UAV images can be appropriate for investigating forest fires.
4. Discussion
Visible light high-resolution remote sensing images obtained by the UAV contain three single RGB bands. Thus, the limited amount of spectral information in the RGB band relies on the spectrographic characteristics, which are not conducive to distinguishing damaged forest, unburned forest, dead forest and bare land areas with similar spectral characteristics. However, object-oriented multi-scale and multi-level rule classification methods can integrate the geometric, textural, and spectral characteristics of objects to extract ground features, which is beneficial for forest burn severity identification. At the same time, the feature rules of corresponding ground objects are established in the fire area to realize information extraction of different forest burn severity degrees, which can be used as the alternative to forest damage level assessment in the national forestry industry standards. However, there remains a practical problem of complexity of the rules for efficient application. The multispectral UAV images or integration of multi-remote sensing image data can be used to introduce near-infrared bands or red-edge bands, which are sensitive to vegetation and strengthen the investigation and efficiency of forest resource loss for crown fires. For instance, UAV multispectral images are used to classify the severity of forest fires, and the results show that the method can achieve high accuracy [28]. As to the method, the machine learning has become a vital driving force in the development of artificial intelligence. Meanwhile, it provides an algorithm that analyzes and accesses rules derived from data and uses these to predict unknown data automatically. Compared with traditional classification methods, machine learning algorithms are optimal and precise for classifying large datasets that exceed the processing ability of one person and the combined processing ability of several people [49,50,51]. For example, Bui D T et al. applied multiple adaptive regression splines and machine learning methods for differential flower pollination optimization to predict the spatial patterns of forest fires in Lao CAI, Vietnam [52]. A forest fire detection method based on unmanned aerial vehicles was proposed by Chen Y et al. [53] and the convolutional neural network method made use of flame simulations on an indoor laboratory bench to verify the effectiveness of the fire detection algorithm. Therefore, machine learning algorithms are the primary prospect for acquiring highly accurate forest damage categories on fire, which is of great significance to the sustainable development of forests.
Determining the optimal segmentation scale is crucial to obtaining high-precision classifications in multi-scale segmentation. The overcutting and insufficient segmentation lead to classification errors [54]. However, the optimum scale is a relative range, which is usually determined by actual repeated segmentation experiments. In addition, it is time-consuming to judge the first-rank segmentation scale based merely on a group of experiments. Thus, we adopt the model of scale parameter segmentation ESP in which peak points with noticeable changes are obtained, and optimal parameters for the segmentation scale are confirmed as effective as possible [55,56]. During the image classification process, the classifier needs to participate in the selection of scale parameters and establishment of feature rules. This means more significant demands for the manipulator, who must determine the segmentation parameters and establish feature rules according to their empirical knowledge to segment the target clearly.
Evaluating the accuracy of damage information related to forest fires primarily uses visual interpretations of remote sensing images and random selections of verification sample points. This approach inevitably has some subjective and uncertain factors. Therefore, future work should increase the number of investigations of sample verification spots or authoritative sites collected in the field and assess and verify classification accuracies. Additionally, high-resolution UAV images have a strong ability to recognize ground features. When images are affected by cloudy climates and the sun’s illumination angle, they contain areas that are obscured by clouds and hilltops. The specific spectral features of visible-light images in shady areas are similar to those regions with burnt forest. The influence of information extraction on shadow areas is a way to further improve the accuracy of terrain spectrum restorations of images used in research.
Despite high resolution and maneuverability, small, light UAVs are more suitable for investigating forest damage in small areas. Low- and medium-resolution remote sensing images can monitor large-scale fires in real time. Due to the low spatial resolution, it is impossible to extract information on tree damage in fire-stricken areas [57,58]. With the characteristics of high definition and abundant spatial information, high-resolution satellite images can compensate the shortcomings of pixel mixing in low- and medium-resolution images in the classification of tree resource damage levels, but they are expensive, not suitable for direct processing, and difficult to obtain [59,60]. Therefore, for large damaged areas, fire investigations can combine UAV and low- and medium-resolution satellite remote sensing data and take advantage of the high spatial and temporal resolution of UAV images as point-scale surveys and use low- and medium-resolution satellite remote sensing images as inspections of large areas. Merging point and surface data is essential to achieve efficient acquisition of large-area forest fire damage severity.
5. Conclusions
This research adopts the object-oriented multilevel rule classification approach. This approach combines the features of spectral, geometric and texture indicators, visible light band comprehensive indices, A, C, and other parameters of image features. UAV remote sensing visible-light images were used to extract the degree of damage information due to forest fires. The precise analysis shows that the overall accuracy reaches 87.76%, and the Kappa coefficient is 0.8402. This indicates that UAV remote sensing is suitable for investigating forest damage signs due to fire and can replace traditional satellite remote sensing visual interpretations or field survey methods.
(1) The burnt and dead forests can be extracted effectively from UAV visible light remote sensing images by customized comprehensive spectral indices, A and C, which can better reflect the weakness or decline of the chlorophyll effect in fire areas.
(2) The object-oriented multilevel rule classification method of forest burn severity combined with morphological filtering image, improves the image segmentation effect and classification accuracy. Meanwhile, the results are represented in objects or patch level, which has more practical significance.
(3) Compared with traditional survey methods, UAV remote sensing is more efficient in extracting forest burn severity, which provides a vital supplement for large-area satel-lite remote sensing and takes an alternative to the forest loss assessment in national industry standards.
In brief, this research is of great practical significance for improving the efficiency and precision of forest fire investigation, expanding applications of small UAVs in for-estry, and developing an alternative for forest fire loss assessments in the forestry in-dustry. However, much effort should be made for large-scale forest burn severity identification by combing satellite remote sensing with UAVs, and more machine learning based extraction methods should be taken concern.
6. Patents
Invention Title: Extraction method of forest fire damage degree based on light and small UAV; Patent Number: 202010015720.0.
Author Contributions
Conceptualization, methodology, software, investigation and writing—original draft preparation, J.Y. and Z.C.; validation, visualization, writing—review and editing, J.Y. and Q.L.; supervision, project administration and funding acquisition, J.Y. and F.Z. All authors have read and agreed to the published version of the manuscript.
Funding
This study was supported by grants from the National Key R&D Program Project of the 13th Five-Year Plan (2020YFC1511601) and the National Natural Science Foundation of China (32071778).
Institutional Review Board Statement
Not applicable.
Informed Consent Statement
Not applicable.
Data Availability Statement
Not available.
Acknowledgments
This publication was supported by Southwest Forestry University and the Institute of Ecology and Nature Conservation, Chinese Academy of Forestry.
Conflicts of Interest
The authors declare no conflict of interest.
References
- Ye, J.; Wu, M.; Deng, Z.; Xu, S.; Zhou, R.; Clarke, K.C. Modeling the spatial patterns of human wildfire ignition in Yunnan province, China. Appl. Geogr. 2017, 89, 150–162. [Google Scholar] [CrossRef]
- Zhao, F.; Liu, Y. Atmospheric Circulation Patterns Associated with Wildfires in the Monsoon Regions of China. Geophys. Res. Lett. 2019, 46, 4873–4882. [Google Scholar] [CrossRef]
- Di, X.Y.; Liu, C.; Sun, J.; Yang, G.; Yu, H.Z. Technology Study on Forest Fire Loss Assessment. For. Eng. 2015, 31, 42–45. [Google Scholar]
- Eo, A.; Fs, B. Evaluation of forest fire risk in the Mediterranean Turkish forests: A case study of Menderes region, Izmir. Int. J. Disast. Risk. Re. 2020, 45, 101479–101489. [Google Scholar]
- Liao, Y.; Li, X.; Liu, Y.; Huang, L.F.; Tian, P.J.; Gu, X.P. Burnt land retrieval from GAOFEN-1 satellite image based on vegetation index. J. Nat. Disasters 2021, 30, 199–206. [Google Scholar]
- Prakash, A.; Schaefer, K.; Witte, W.K.; Collins, K.; Gens, R.; Goyette, M.P. A remote sensing and GIS based investigation of a boreal forest coal fire. Int. J. Coal. Geol. 2011, 86, 79–86. [Google Scholar] [CrossRef]
- Lei, Q.X. Methods of Tree Burning Statistic in Forest Fire. For. Inventory Plan. 2017, 42, 48–50. [Google Scholar]
- LY/T 1846-2009; Survey Method for the Causes of Forest Fire and the Damage of Forest Resources. State Forestry Administration: Nanjing, China, 2009.
- Palandjian, D.; Gitas, I.Z.; Wright, R. Burned area mapping and post-fire impact assessment in the Kassandra peninsula (Greece) using Landsat TM and Quickbird data. Geocarto Int. 2009, 24, 193–205. [Google Scholar] [CrossRef]
- Gouveia, C.; DaCamara, C.C.; Trigo, R.M. Post-fire vegetation recovery in Portugal based/vegetation data. Nat. Hazard. Earth Syst. 2010, 10, 4559–4601. [Google Scholar] [CrossRef]
- Wang, Q.K.; Yu, X.F.; Shu, Q.T. Forest burned scars area extraction using time series remote sensing data. J. Nat. Disasters 2017, 26, 1–10. [Google Scholar]
- Li, M.Z.; Kang, X.R.; Fan, W.Y. Burned Area Extraction in Huzhong Forests Based on Remote Sensing and the Spatial Analysis of the Burned Severity. For. Sci. 2017, 53, 163–174. [Google Scholar]
- Li, Y.Y.; Yu, H.Y.; Wang, Y.; Li, C.L.; Jiang, Y.F. Extraction method of forest fire burning ground by fusing red-edge waveband. Remote Sens. Inf. 2019, 34, 63–68. [Google Scholar]
- Zhang, J.G.; Yan, H.; Hu, C.H.; Li, T.T.; Yu, M. Application and future development of unmanned aerial vehicle in Forestry. Chin. J. For. Eng. 2019, 4, 8–16. [Google Scholar]
- Witze, A. Scientists to set a massive forest fire. Nature 2019, 569, 610. [Google Scholar] [CrossRef]
- Getzin, S.; Nuske, R.S.; Wiegand, K. Using Unmanned Aerial Vehicles (UAV) to Quantify Spatial Gap Patterns in Forests. Remote Sens. 2014, 6, 6988–7004. [Google Scholar] [CrossRef]
- Ren, Y.Z.; Wang, D.; Li, Y.T.; Wang, X.J. Applications of Unmanned Aerial Vehicle-based Remote Sensing in Forest Resources Monitoring: A Review. China Agric. Sci. Bull. 2020, 36, 111–118. [Google Scholar]
- Fan, Z.G.; Zhou, C.J.; Zhou, X.N.; Wu, N.S.; Zhang, S.J.; Lan, T.H. Application of unmanned aerial vehicle aerial survey technology in forest inventory. J. For. Environ. 2018, 38, 297–301. [Google Scholar]
- Sun, Z.Y.; Huang, Y.H.; Yang, L.; Wang, C.Y.; Zhang, W.Q.; Gan, X.H. Rapid Diagnosis of Ancient Heritiera littoralis Community Health Using UAV Remote Sensing. Trop. Geogr. 2019, 39, 538–545. [Google Scholar]
- Calderón, R.; Navas-Cortés, J.A.; Lucena, C.; Zarco-Tejada, P.J. High-resolution airborne hyperspectral and thermal imagery for early detection of verticillium wilt of olive using fluorescence, temperature and narrow-band spectralindices. Remote Sens. Environ. 2013, 139, 231–245. [Google Scholar] [CrossRef]
- Zarco-Tejada, P.J.; Camino, C.; Beck, P.S.A.; Calderon, R.; Hornero, A.; Hernández-Clemente, R.; Kattenborn, T.; Montes-Borrego, M.; Susca, L.; Morelli, M. Previsual symptoms of Xylella fastidiosa infection revealed in spectral plant-trait alterations. Nat. Plants 2018, 4, 432–439. [Google Scholar] [CrossRef]
- Ma, S.Y.; Guo, Z.Z.; Wang, S.T.; Zhang, K. Hyperspectral Remote Sensing Monitoring of Chinese Chestnut Red Mite Insect Pests in UAV. Trans. Chin. Soc. Agric. Mach. 2021, 52, 171–180. [Google Scholar]
- Cruz, H.; Eckert, M.; Meneses, J.; Martínez, J.F. Efficient forest fire detection index for application in unmanned aerial systems (UASs). Sensors 2016, 16, 893. [Google Scholar] [CrossRef] [PubMed]
- Han, W.T.; Guo, C.C.; Zhang, L.Y.; Yang, J.T.; Lei, Y.; Wang, Z.J. Classification Method of Land Cover and Irrigated Farm Land Use Based on UAV Remote Sensing in Irrigation. Trans. Chin. Soc. Agric. Mach. 2016, 47, 270–277. [Google Scholar]
- Ma, H.R.; Zhao, T.Z.; Zeng, Y. Object-based Multi-level Classification of Forest Vegetation on Optimal Segmentation Scale. J. Northeast. For. Univ. 2014, 42, 52–57. [Google Scholar]
- Woo, H.; Acuna, M.; Madurapperuma, B.; Jung, G.; Woo, C.; Park, J. Application of Maximum Likelihood and Spectral Angle Mapping Classification Techniques to Evaluate Forest Fire Severity from UAV Multi-spectral Images in South Korea. Sens. Mater. 2021, 33, 3745–3760. [Google Scholar] [CrossRef]
- Zidane, I.E.; Lhissou, R.; Ismaili, M.; Manyari, Y.; Mabrouki, M. Characterization of Fire Severity in the Moroccan Rif Using Landsat-8 and Sentinel-2 Satellite Images. Int. J. Adv. Sci. Eng. Inf. Technol. 2021, 11, 71–83. [Google Scholar] [CrossRef]
- Shin, J.-I.; Seo, W.-W.; Kim, T.; Park, J.; Woo, C.-S. Using UAV Multispectral Images for Classification of Forest Burn Severity—A Case Study of the 2019 Gangneung Forest Fire. Forests 2019, 10, 1025. [Google Scholar] [CrossRef]
- Dong, X.Y.; Fan, W.Y.; Tian, T. Object-based forest type classification with ZY-3 remote sensing data. J. Zhejiang AF Univ. 2016, 33, 816–825. [Google Scholar]
- Frohn, R.C.; Chaudhary, N. Multi-scale Image Segmentation and Object-Oriented Processing for Land Cover Classification. Gisci. Remote Sens. 2008, 45, 377–391. [Google Scholar] [CrossRef]
- Wang, W.Q.; Chen, Y.F.; Li, Z.C.; Hong, X.J.; Li, X.C.; Han, W.T. Object-oriented classification of tropical forest. J. Nanjing For. Univ. 2017, 41, 117–123. [Google Scholar]
- Li, F.F.; Liu, Z.J.; Xu, Q.Q.; Ren, H.C. Application of object-oriented random forest method in wetland vegetation classification. Remote Sens. Inf. 2018, 33, 111–116. [Google Scholar]
- Torres-Sánchez, J.; López-Granados, F.; PeA, J.M. An automatic object-based method for optimal thresholding in UAV images: Application for vegetation detection in herbaceous crops. Comput. Electron. Agr. 2015, 114, 43–52. [Google Scholar] [CrossRef]
- Li, L.M.; Guo, P.; Zhang, G.S.; Zhou, Q.; Wu, S.Z. Research on Area Information Extraction of Cotton Field Based on UAV Visible Light Remote Sensing. Xinjiang Agric. Sci. 2018, 55, 548–555. [Google Scholar]
- He, S.L.; Xu, J.H.; Zhang, S.Y. Land use classification of object-oriented multi-scale by UAV image. Remote Sens. Land Resour. 2013, 25, 107–112. [Google Scholar]
- Chen, T.B.; Hu, Z.W.; Wei, L.; Hu, S.Q. Data processing and landslide Information Extraction Based on UAV Remote Sensing. J. Geo-Inf. Sci. 2017, 19, 692–701. [Google Scholar]
- Llorens, R.; Sobrino, J.A.; Fernández, C.; Fernández-Alonso, J.M.; Vega, J.A. A methodology to estimate forest fires burned areas and burn severity degrees using Sentinel-2 data. Application to the October 2017 fires in the Iberian Peninsula. Int. J. Appl Earth Obs. 2021, 95, 102243. [Google Scholar] [CrossRef]
- Zheng, Z.; Zeng, Y.; Li, S.; Huang, W. Mapping burn severity of forest fires in small sample size scenarios. Forests 2018, 9, 608. [Google Scholar] [CrossRef]
- Liu, Q.F.; Long, X.M.; Deng, Z.J.; Ye, J.X. Application of Unmanned Aerial Vehicle in Quick Construction of Visual Scenes for National Forest Parks. For. Resour. Manag. 2019, 2, 116–122. [Google Scholar]
- Dong, S.G.; Qin, J.X.; Guo, Y.K. A method of shadow compensation for high resolution remote sensing images. Sci. Surv. Mapp. 2018, 43, 118–124. [Google Scholar]
- Drǎgut, L.; Tiede, D.; Levick, S.R. ESP: A tool to estimate scale parameter for multiresolution image segmentation of remotely sensed data. Int. J. Geogr. Inf. Sci. 2010, 24, 859–871. [Google Scholar] [CrossRef]
- Tao, D.; Qi, S.; Liu, Y.; Xu, A.J.; Xu, B.; Zhang, H.G. Extraction of Buildings in remote sensing imagery based on multi-level segmentation and classification hierarchical model and feature space optimization. Remote Sens. Land Resour. 2019, 31, 111–122. [Google Scholar]
- Wang, X.Q.; Wang, M.M.; Wang, S.Q.; Wu, Y.D. Extraction of vegetation information from visible unmanned aerial vehicle images. Trans. Chin. Soc. Agric. Eng. (Trans. CSAE) 2015, 31, 152–159. [Google Scholar]
- Lu, H.; Li, Y.S.; Lin, X.C. Classification of high resolution imagery by unmanned aerial vehicle. Sci. Surv. Mapp. 2011, 36, 106–108. [Google Scholar]
- HSU, C.W.; LIN, C.J. A comparison of methods for multiclass support vector machines. IEEE Trans. Neural Netw. 2002, 13, 415–425. [Google Scholar]
- Chaudhuri, A.; Kajal, D.; Chatterjee, D. A Comparative Study of Kernels for the Multi-class Support Vector Machine. In Proceedings of the 2008 Fourth International Conference on Natural Computation, Jinan, China, 18–20 October 2008. [Google Scholar]
- Polat, K.; Gunes, S. A novel hybrid intelligent method based on C4.5 decision tree classifier and one-against-all approach for multi-class classification problems. Expert Syst. Appl. 2009, 36, 1587–1592. [Google Scholar] [CrossRef]
- Chen, C.; Fu, J.Q.; Sui, X.X.; Lu, X.; Tan, A.H. Construction and application of knowledge decision tree after a disaster for water body information extraction from remote sensing images. J. Remote Sens. 2018, 22, 792–801. [Google Scholar]
- Jordan, M.I.; Mitchell, T.M. Machine learning: Trends, perspectives, and prospects. Science 2015, 349, 255–260. [Google Scholar] [CrossRef] [PubMed]
- Zhou, Z.H. Machine learning: Recent progress in China and beyond. Natl. Sci. Rev. 2018, 5, 20. [Google Scholar] [CrossRef]
- Nguyen, H.T.; Caceres, M.L.L.; Moritake, K.; Kentsch, S.; Shu, H.; Diez, Y. Individual Sick Fir Tree (Abies mariesii) Identification in Insect Infested Forests by Means of UAV Images and Deep Learning. Remote Sens. 2021, 13, 2100. [Google Scholar] [CrossRef]
- Bui, D.T.; Hoang, N.D.; Samui, P. Spatial pattern analysis and prediction of forest fire using new machine learning approach of Multivariate Adaptive Regression Splines and Differential Flower Pollination optimization: A case study at Lao Cai province (Viet Nam). J. Environ. Manag. 2019, 237, 476–487. [Google Scholar]
- Chen, Y.; Zhang, Y.; Jing, X.; Yi, Y.; Han, L. A UAV-Based Forest Fire Detection Algorithm Using Convolutional Neural Network. In Proceedings of the 2018 37th Chinese Control Conference (CCC), Wuhan, China, 25–27 July 2018. [Google Scholar]
- He, Y.; Zhou, X.C.; Huang, H.Y.; Xu, X.Q. Counting Tree Number in Subtropical Forest Districts based on UAV Remote Sensing Images. Remote Sens. Technol. Appl. 2018, 33, 168–176. [Google Scholar]
- Zhang, G.H.; Wang, X.J.; Xu, X.L.; Yan, L.; Chang, M.D.; Li, Y.K. Desert Vegetation Classification Based on Object-Oriented UAV Remote Sensing Images. China Agric. Sci. Technol. Rev. 2021, 23, 69–77. [Google Scholar]
- Zhang, N.N.; Zhang, K.; Li, Y.P.; Li, X.; Liu, T. Study on Machine Learning Methods for Vegetation Classification in Typical Humid Mountainous Areas of South China based on the UAV Multispectral Remote Sensing. Remote Sens. Technol. Appl. 2022, 37, 816–825. [Google Scholar]
- Bisquert, M.; Caselles, E.; Sánchez, J.M.; Caselles, V. Application of artificial neural networks and logistic regression to the prediction of forest fire danger in Galicia using MODIS data. Int. J. Wildland Fire 2012, 21, 1025–1029. [Google Scholar] [CrossRef]
- Yankovich, K.S.; Yankovich, E.P.; Baranovskiy, N.V. Classification of vegetation to estimate forest fire danger using Landsat 8 images: Case study. Math. Probl. Eng. 2019, 2019, 6296417. [Google Scholar] [CrossRef]
- Song, Q.; Hu, Q.; Zhou, Q.; Hovis, C.; Xiang, M.; Tang, H.; Wu, W. In-season crop mapping with GF-1/WFV data by combining object-based image analysis and random forest. Remote Sens. 2017, 9, 1184. [Google Scholar] [CrossRef]
- Lv, Z.; Liu, T.; Wan, Y.; Benediktsson, J.A.; Zhang, X. Post-processing approach for refining raw land cover change detection of very high-resolution remote sensing images. Remote Sens. 2018, 10, 472. [Google Scholar] [CrossRef]
Publisher’s Note: MDPI stays neutral with regard to jurisdictional claims in published maps and institutional affiliations. |
© 2022 by the authors. Licensee MDPI, Basel, Switzerland. This article is an open access article distributed under the terms and conditions of the Creative Commons Attribution (CC BY) license (https://creativecommons.org/licenses/by/4.0/).


