Article

Analytical Model for the Load-Bearing Capacity Analysis of Winter Forest Roads: Experiment and Estimation

1
Institute of Forestry, Mining and Construction Sciences, Petrozavodsk State University, Lenin Pr., 33, 185910 Petrozavodsk, Russia
2
Petrozavodsk State University, Lenin Pr., 33, 185910 Petrozavodsk, Russia
*
Author to whom correspondence should be addressed.
Forests 2022, 13(10), 1538; https://doi.org/10.3390/f13101538
Submission received: 14 August 2022 / Revised: 16 September 2022 / Accepted: 19 September 2022 / Published: 21 September 2022

Abstract

:
In northern forests, winter is the preferred time for logging operations, since, when wet soils freeze, their strength increases, which ensures a high load-bearing capacity of winter forest roads and reduces the cost of forestry work by increasing the load on forestry equipment, including when driving through frozen lowlands. The present article analyzes frozen loamy–sandy soil, which, at subzero temperatures, behaves like a brittle material with a sufficiently high, but limited, strength. Well-known models commonly use empirical parameters, correlations, and numerical methods to estimate the strength of such materials. An analytical model of the full load–displacement curve would reduce the number of necessary calculations and increase the ability to predict the bearing capacity of winter forest roads. However, there are few of these models. Such models were developed, as a rule, to study stress–strain in concrete and rocks, meaning that researchers have to recalculate the load into stress and displacement into deformation, which is not always simple. This work aimed at theoretically justifying a new analytical model for quantifying the bearing capacity of winter forest roads and assessing the adequacy of the model by comparing it with experimental data. To achieve this purpose, the concepts of fracture mechanics and methods of mathematical modeling were used. The model was verified using experimental data, and model examples for determining the peak load were provided. Prospects for development of the research topic were also considered, taking into account new developments in forest road monitoring for logging management.

1. Introduction

In northern forests, winter is the preferred time for logging operations [1], which, from a technical perspective, can be explained by the freezing of wet soils and, as a consequence, an increase in the bearing capacity of forest roads, since water in the ice phase, in this case, can be considered an analogue of cement in concrete structures. Even soils with a very small bearing capacity at a positive temperature become structural materials after freezing. For example, the compressive strength of frozen soil samples can reach 24.7 MPa, which corresponds to the strength level of concrete [2]. The mechanical properties of ice and snow were reviewed in [3]. The tensile strength of ice varies from 0.7 to 3.1 MPa, and the strength under compression varies from 5 to 25 MPa over a temperature range of −10 to −20 °C. The compressive strength of ice increases if the temperature decreases or the rate of deformation increases. However, the tensile strength of ice is relatively insensitive to these influences [3]. The high strength of winter forest roads makes it possible to safely increase the load on forest vehicles, including the possibility of their movement through frozen swampy low-lying areas (Figure 1).
The use of winter forest roads reduces the cost of forestry work. For example, depending on a number of conditions, the cost of building a winter road is at least two times lower than the cost of building a non-freezing road [1]. However, an increase in the average winter temperature and more frequent winter thaws [4] reduces the possibilities of the winter removal of wood. To adapt to shorter periods of winter road use, forest companies may have to not only consider weather forecasts but also monitor the bearing capacity of forest roads [5,6].
The bearing capacity of the pavement correlates with the pavement’s stiffness, which is usually estimated using deflection measurements. Such measurements can be carried out, for example, using a falling weight deflectometer (FWD), which transmits a pulse load to the road surface [7]. During the measurement process, such a deflectometer must be stationary, so there are restrictions in the movement of vehicles over the period of deflection measurements. Restrictions in the duration of movement and the cost of measurements can be reduced if portable modifications of the deflectometer are used [8].
The use of devices for continuous measurements of deflections with laser technologies can eliminate traffic interference and reduce the time spent on measuring deflections of the road surface [5]. Such devices are placed in a special car, and the displacements of points on the surface of the road surface are then measured from the action of a wheel moving on the road surface (Figure 2).
Devices for continuous deflection measurements overcome the limitations of FWD, because they operate at a normal vehicle speed and do not require breaks in traffic [5].
The results of pavement deflection measurements at a known vehicle axle load are important for road services and pavement-design engineers, since the data on deflections serve as the basis for maintenance decisions. Given the importance of this issue, attention should be given to the fact that in some cases, different deflection determination methods can lead to significantly different results. Thus, research in this area is ongoing. Madsen and Pedersen (2022) proposed numerical models to determine the relationship between the load from a moving wheel and the vertical displacements of pavement points under and near the wheel [5].
According to a study by Martin et al. (1999), the condition of a forest road can be classified into one of three groups, depending on rut depth and cracking characteristics: acceptable condition, critical condition, and failure [6].
The upper layer of the road structure mainly resists bending and transfers the load to the underlying soil layers, which primarily resist compression [7,8]. Bending is dangerous because it is accompanied by the appearance of tensile stresses in the lower zone of the upper layer of the frozen forest road; in the upper zone of the same layer, compressive stresses appear. Since the tensile strength of frozen soil is significantly lower than compressive strength, cracks appear in the lower zone and grow with an increasing load, so the structure gradually degrades [9]. Accordingly, sufficiently reliable experimental methods are needed to determine the physical and mechanical properties of materials as well as mathematical models to predict the bending and compressive strength of the materials for forest road layers.
A recently published study on the mechanical behavior of frozen sandy soil under three-point bending [10] showed that the stress state of fractured frozen soil can be very complex. The authors, therefore, recommended further studies to investigate the failure characteristics of frozen sandy soil. Experimental studies on the compressive strength of frozen sandy soil reached similar conclusions [11]. The results of experimental studies suggest the need to develop a general, universal approach for modeling the mechanical state of winter forest road pavement. We suggest that such an approach could be used for modeling both the bending and compression of the frozen sandy soil of forest road pavement.
Taking into account the brittleness of frozen ground, it should be noted that relatively new approaches for studying the fracture mechanics of brittle materials [12] are promising for solving the abovementioned problem of predicting the bearing capacity of winter forest roads, as such methods allow one to model the damageability of materials under both force and temperature changes [13,14,15,16]. Within the framework of the present work, using a fracture mechanics methodology offers the possibility to analyze the stiffness and strength of a road structure without prior information on the stresses in the ground, which greatly simplifies the analysis and prediction of the bearing capacity of winter forest roads.
The purpose of the present work is to use the basic approaches of fracture mechanics, theoretically substantiate a new analytical model for predicting the bearing capacity of winter forest roads, and verify the adequacy of the model using experimental data for sandy loam soil.

2. Methodology

2.1. Degrading Material as a Macro-Object Consisting of Mesoscale Elements

In publications directly or indirectly related to materials science, one can find many technical photographs obtained via electron microscopy. These photographs show that a deformable brittle material, in many cases, can be considered as a mechanical system formed by interactions between mesoscale elements or conglomerates of such elements. The structures of brittle materials are characterized by micro- and mesoscale pores and cracks that develop with increasing load leads to gradually destroy the conglomerate of material particles [17]. This phenomenon manifests in the nonlinearity of the load–deformation diagram. It is known that the process of destruction of solids is ordered and that “the hierarchy of the scale of destruction begins with the size of the crystal lattice and continues up to the size of tectonic plates in geospheres” [18]. Taking these circumstances into account, an array (or sample) of brittle material can be considered as a structure with a mechanical state and properties that depend on the impacts exerted upon it [19,20,21].
Such a structure (construction) can be considered as a macro-object consisting of mesoscale elements with mechanical states and interactions with each that other determine the strength and stiffness of the degrading brittle material. As the load on the structure increases, the “weakest” mesoscale elements or their conglomerates collapse, causing the load to redistribute to other elements that remain undestroyed. As a consequence, mechanical stresses in these elements increase, which lead to destruction of the next “weak” link. Consequently, the average stress values in such a process continuously increase until the brittle material fracture stage is complete. For a mathematical description of this process, a phenomenological model was developed in this study, in which two parameters corresponding to the point of extremum in the load–displacement diagram are used as input data, namely the value of force external to the specimen and the displacement caused by this force. These parameters are determined during standard tests as a result of measurements and are key data for calculations of the load-bearing capacity and stiffness. An algorithm for predicting the values of these parameters using loads that are significantly less than the maximum load is also proposed. Next, we provide a mathematical description of the outlined methodology.
In a certain experiment, let load F correspond to the displacement u . A concrete example can be, for example, a fragment of the road surface (Figure 2), a point of which is displaced vertically under the action of the load from the car wheel. Let us consider a general case where the load–displacement relation is nonlinear (Figure 3). In this case, the instantaneous stiffness S of the pavement is determined by relation (1):
S = d F d u .  
The service life of pavement is limited because, even if load F does not exceed the allowable values, the pavement material deforms, and its “weak” links are gradually turned off. As a consequence, stiffness S (1) gradually decreases with respect to initial stiffness S 0 . To model and predict these changes, we introduce a dimensionless parameter θ :
θ = S S 0   ;   d θ = d S S 0   .
Using θ (2) and relation (1), we obtain
d F = S d u = S 0 θ d u .  
The law of the change in stiffness S depending on displacement u is a priori unknown. Therefore, based on the experience of our research and taking into account the literature data, we formulate a working hypothesis with validity that we will assess by comparing the results of the modeling and experiments.

2.2. Hypothesis about the Law of Stiffness Degradation

In the hypothesis of the current study, it can be assumed that the change in stiffness from the value d S due to gradual damage to the material is proportional to the current value of stiffness S and an increase in displacement d u , i.e., the product of S d u . Then, taking into account (2), we can write
d S = S d u u p e a k = S 0 θ d u u p e a k   .
The minus sign in ratio (4) means that the stiffness of S decreases if the value of F increases. The u p e a k displacement is a constant value within the framework for solving a specific problem; this value is determined experimentally, directly, or indirectly, as described in Section 3.2.

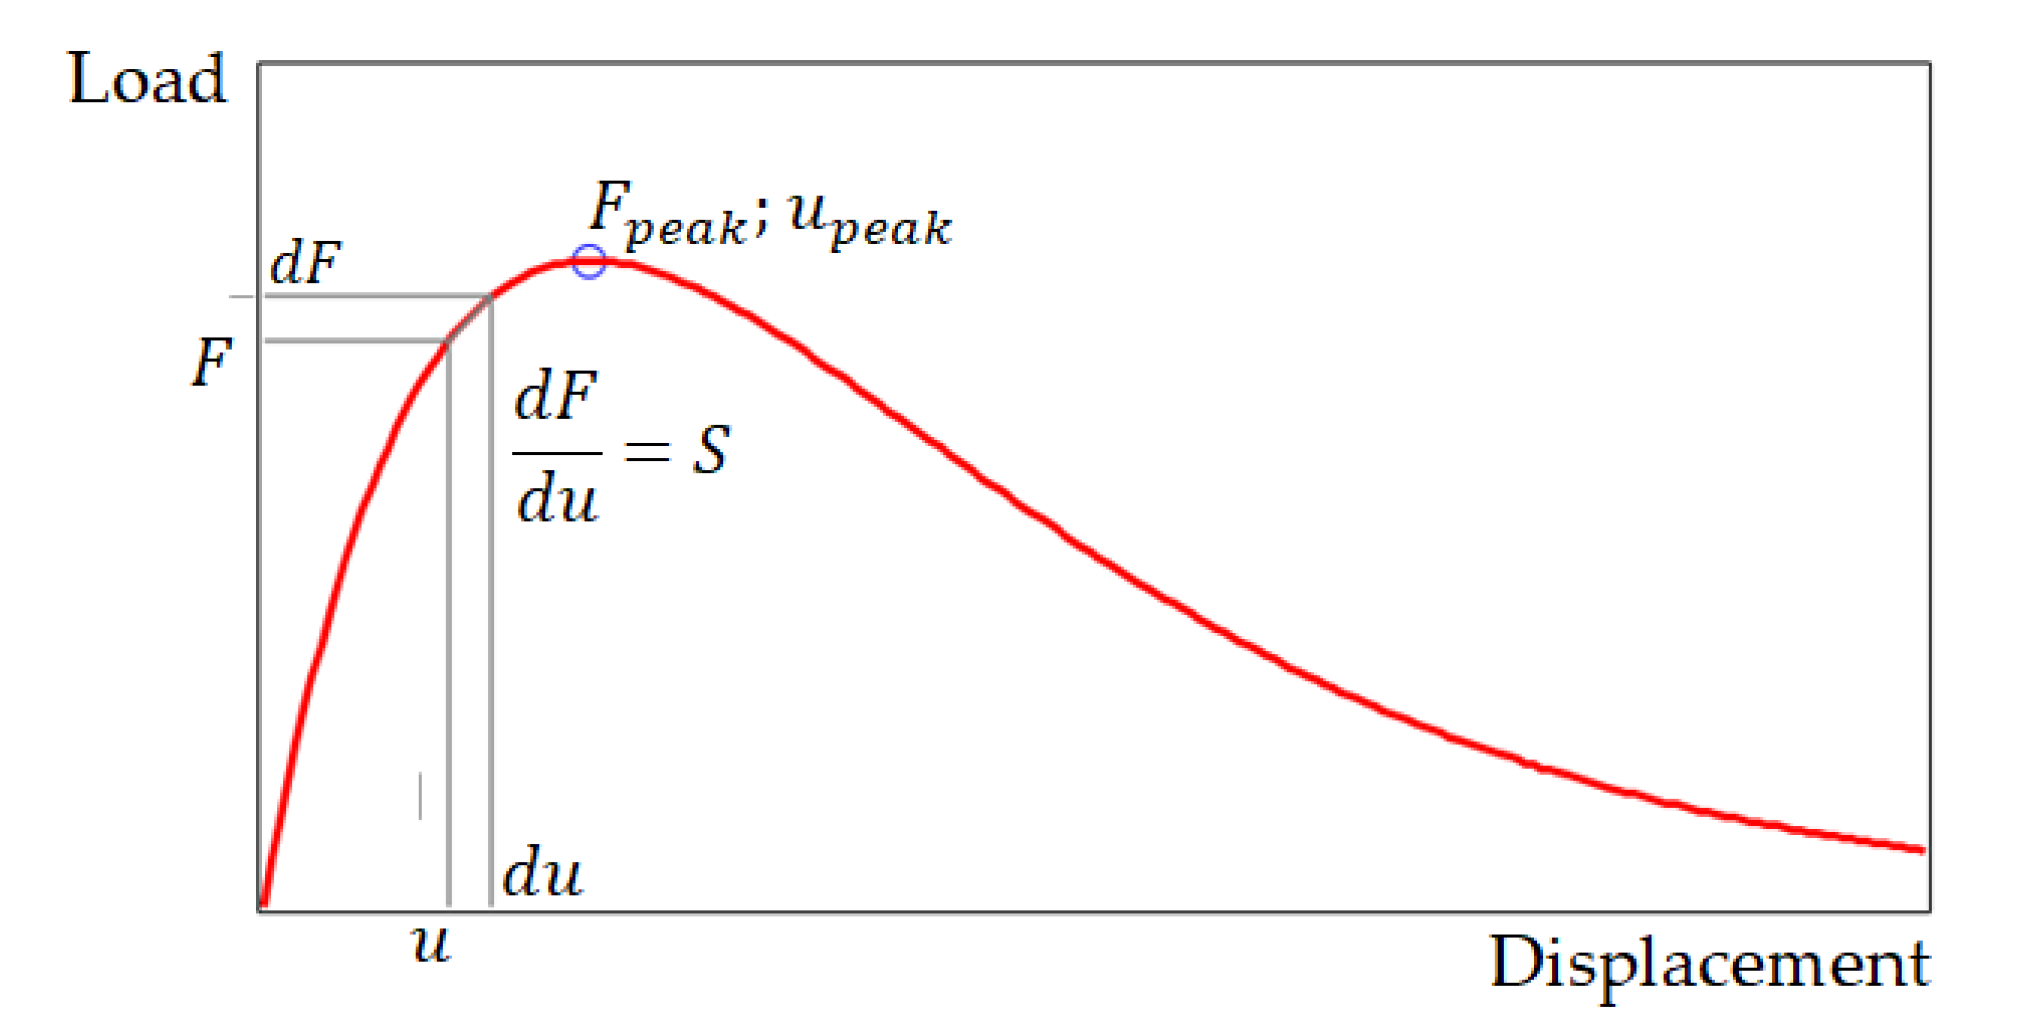
2.3. Substantiation of the Analytical Relationship between Load F and Displacement u

We next transform ratio (4) taking into account (2):
d S S 0 = θ d u u p e a k   or   d θ θ = d u u p e a k   .  
The solution of Equation (5) has the following form:
ln θ = u u p e a k + C 1 .  
The integration constant C 1 can be found from the following condition: if u = 0 , then S = S 0 , and θ = 1 . Thus, we obtain C 1 = 0 . Then,
θ = e u u p e a k   .  
In its physical meaning, the value of the function θ can also be considered as an estimation of material damage during loading, i.e., as a damage function D = θ .
Using (2) and (7), we can find stiffness S as a function of S u (8):
S = S 0 e u u p e a k   .  
Next, we introduce the value S s e c a n t , which is realized if u = u p e a k , and F = F p e a k :
S s e c a n t = F p e a k u p e a k   .  
If u = u p e a k , then S = S s e c a n t . Taking into account (8) and (9), we can write
S s e c a n t = S 0 e 1   or   S 0 = S s e c a n t e   .  
Using S 0 from (10), we transform ratio (8) into the following form (11):
S = S s e c a n t e 1 u u p e a k .  
Taking into account expression (9), we rewrite relation (11) as
S = F p e a k u p e a k e 1 u u p e a k .  
To find the dependence of force F on displacement u , we define stiffness S of the degrading structure by the ratio of functions F and u :
S = F u   .  
Combining (13) and (12), we find
F = F p e a k u u p e a k e 1 u u p e a k .  
In summary, due to the way the model is built, the model itself (14) and all its components have clear physical meanings (Figure 3). Ultimately, it was necessary and sufficient to use only one hypothesis (4). Formally, model (14) is similar to the well-known Furamura model, which is described in terms of stress–strain and was also considered in [20,22,23]. In our new approach, models (1)–(14) are justified in terms of load–displacement, so there are no questions about internal stresses and strains or their correspondence with external forces (loads) and displacements during loading of the upper layer of the winter forest road (Figure 2). At the same time, model (14) is not completely universal and is designed to predict the mechanical state of the frozen soil (sandy loam) of a winter forest road in addition to, possibly, some fragile materials, which can be verified by comparing the simulation results and experimental data.

3. Results and Comments

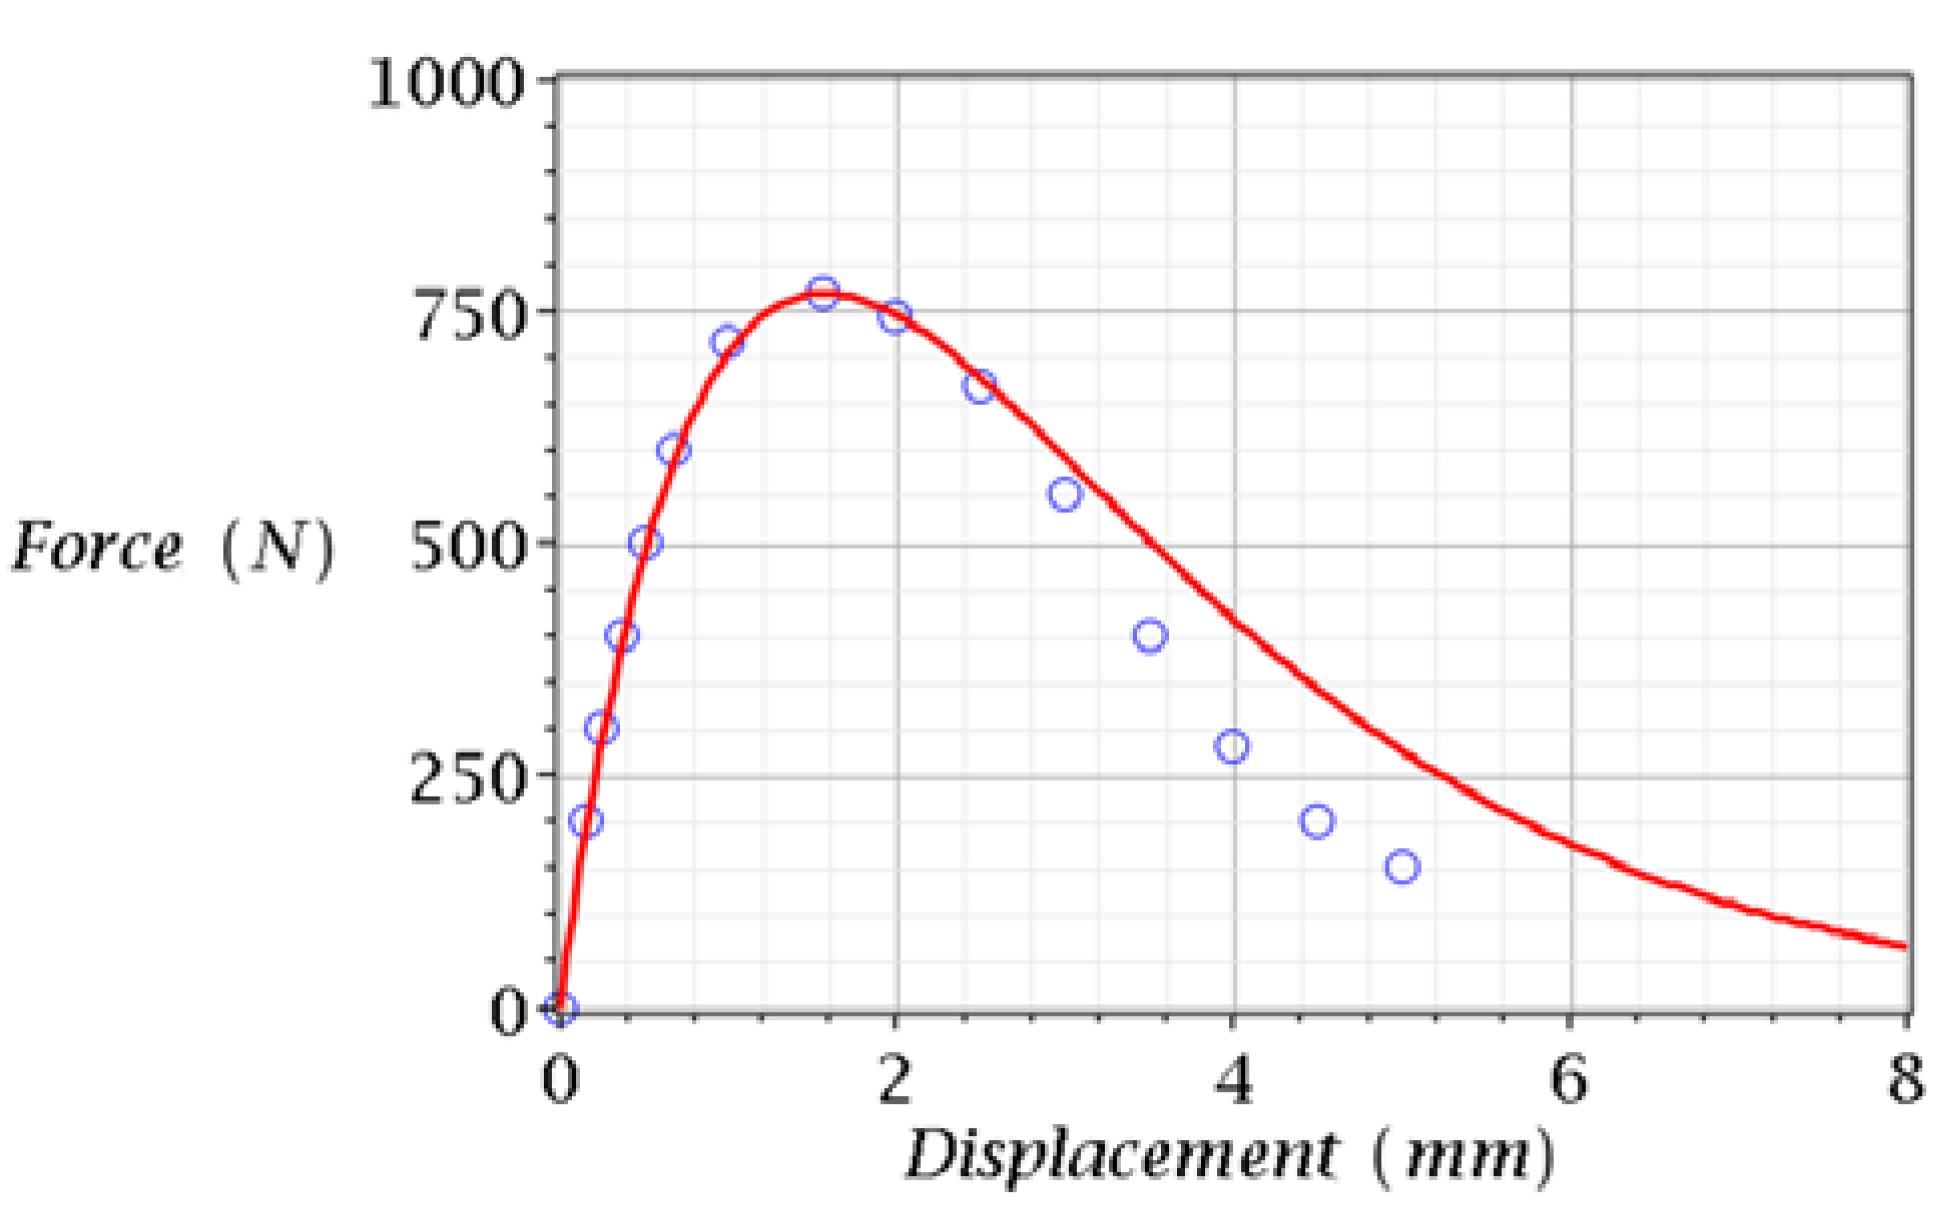
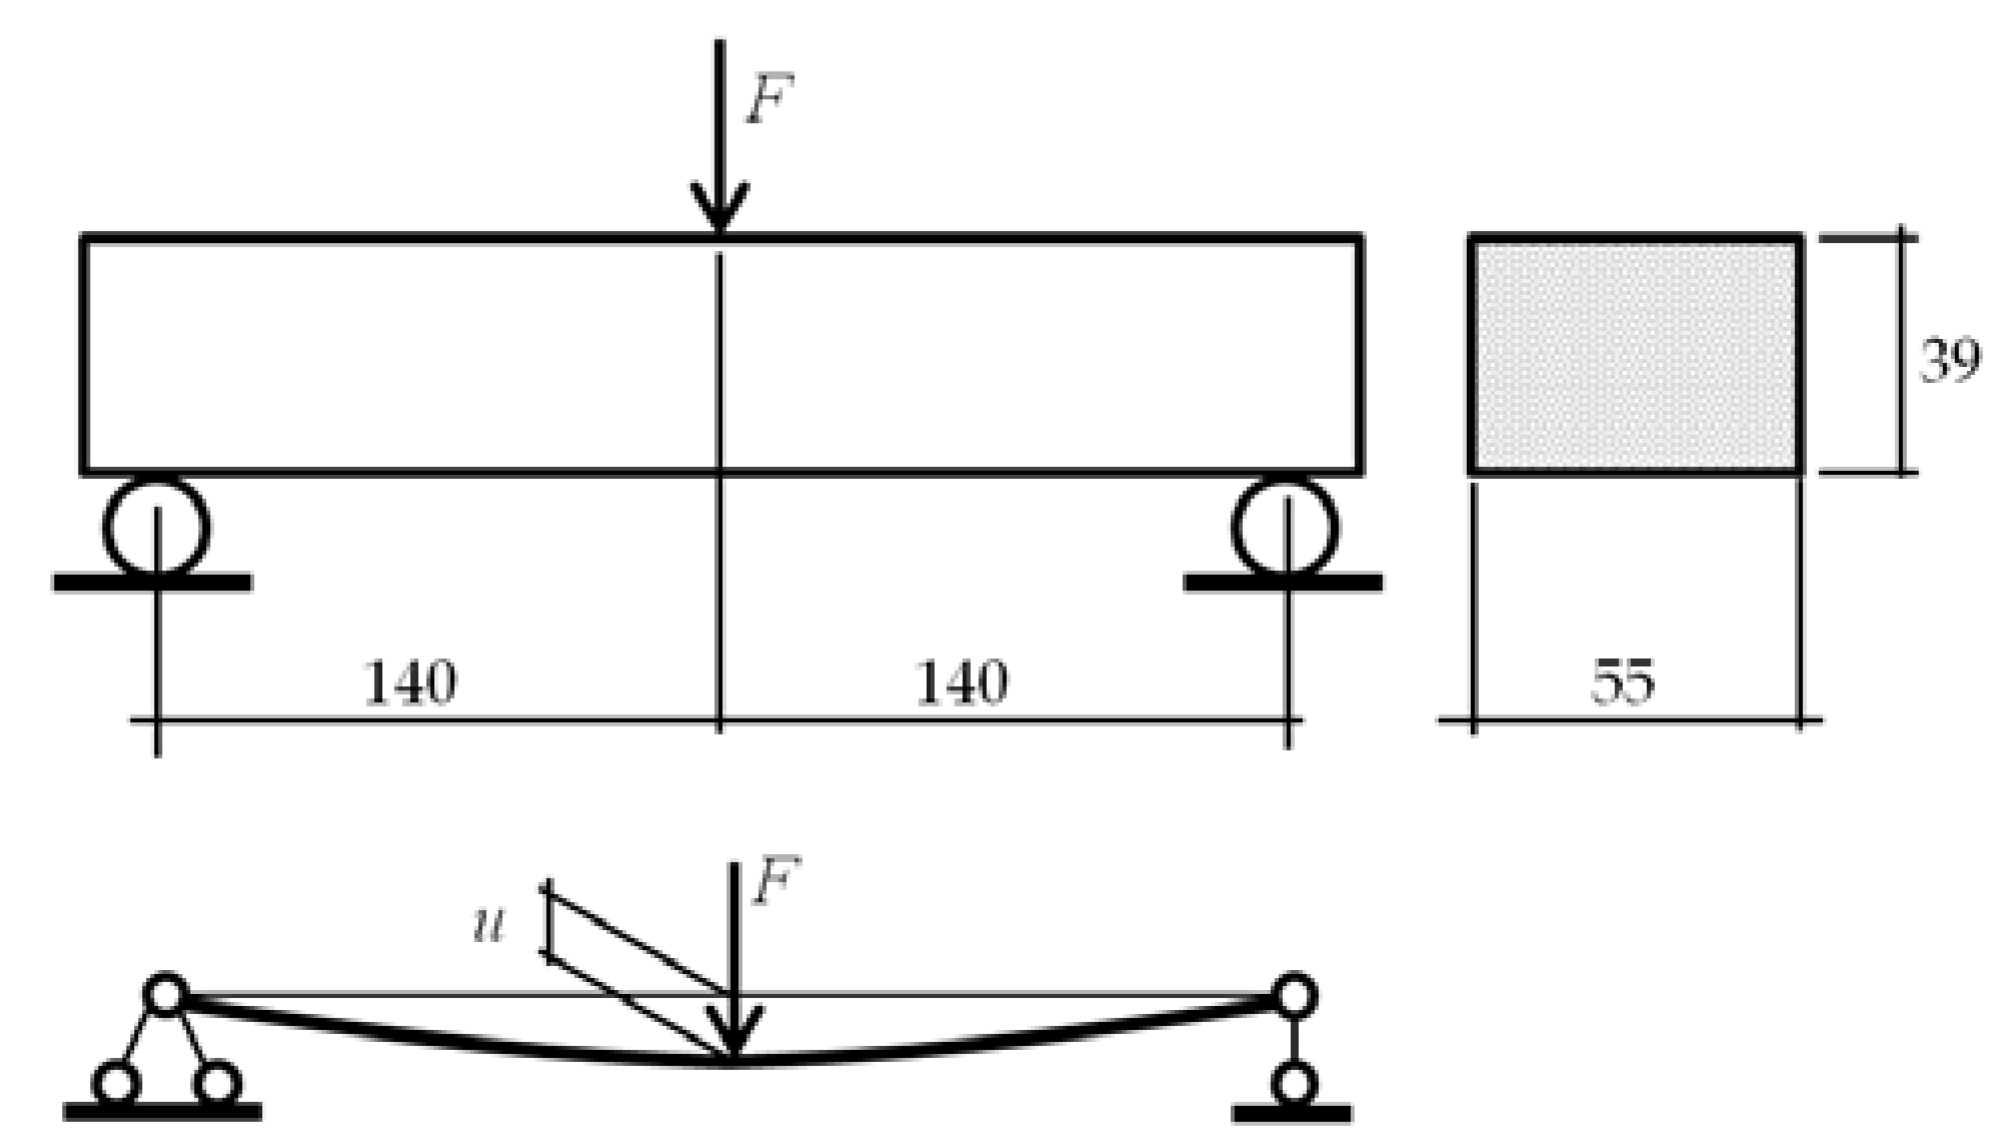
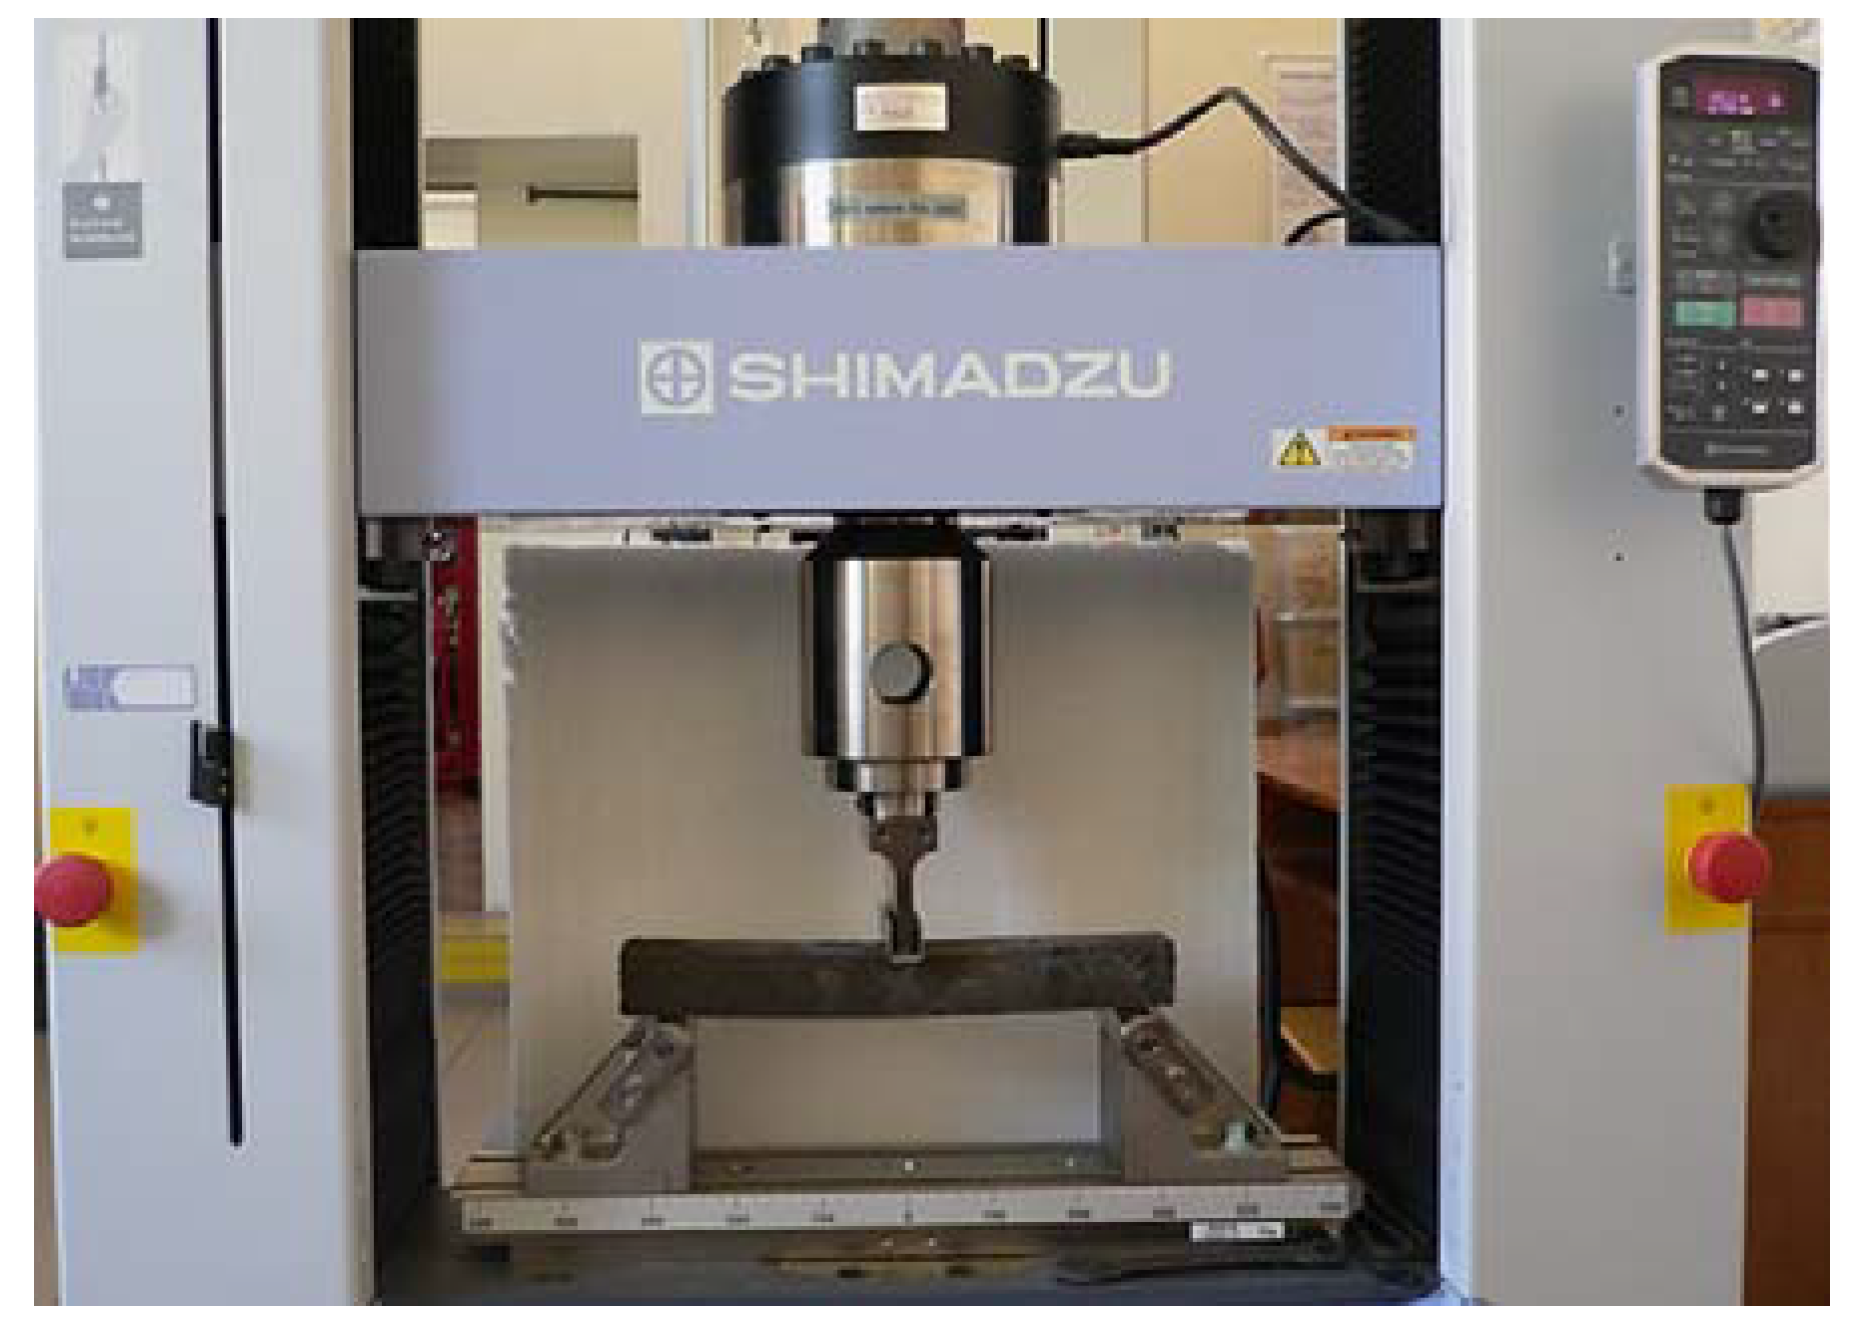
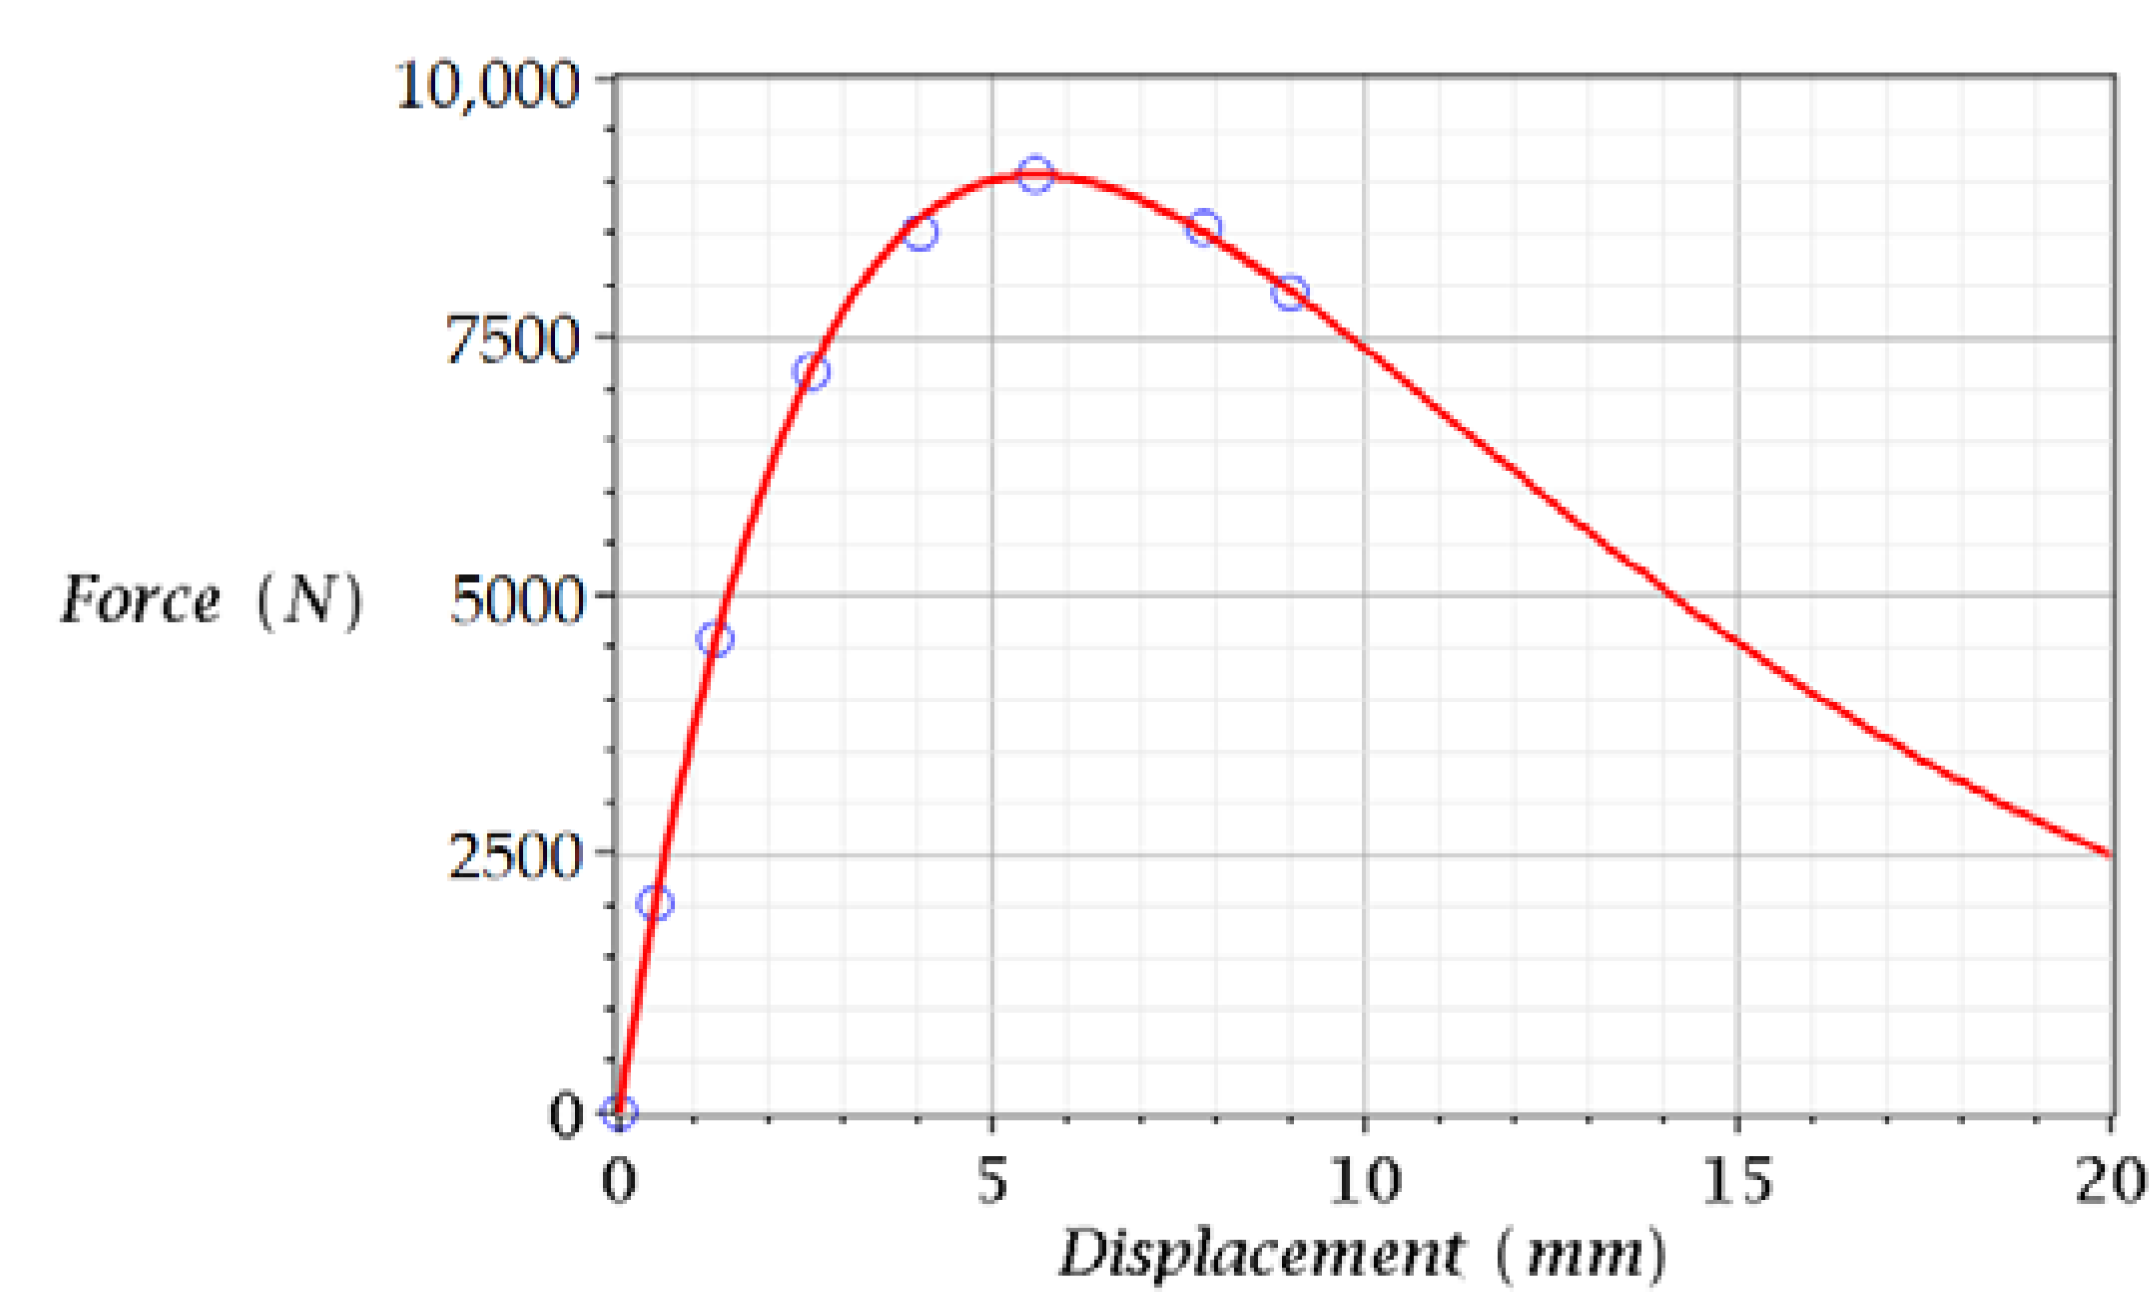
3.1. Comparison of Model and Experimental Data: Bending of a Beam from Frozen Sandy Loam

The object of research in this part of the work is a beam with a rectangular cross-section featuring a width of 55 mm and a height of 39 mm; the span of the beam is 280 mm (Figure 4).
Specimen (frozen sandy loam from a forest road [9]) preparation for testing was carried out by analogy with the method used in [24]. The speed of the boot device of the testing machine was selected as equal to 5 mm/min. The temperature of the material on the fracture surface of the samples (−4.6 °C) was measured in a non-contact way, using a pyrometer immediately after testing. The temperature in the laboratory was +18 °C, and the test lasted about two minutes. Thus, the sample was tested under conditions of weak short-term thawing. Therefore, a decrease in the load-bearing capacity of the sample compared to the forecast (14) was expected in the final stage of testing (since the possibility of temperature changes was not considered in model (14)). The experiments were released on a SHIMADZU AGS-X test machine (Figure 5), for which the permissible limits of relative deviation range up to 1%. The tests were carried out in the laboratory of Petrozavodsk State University.
After testing and thawing, the moisture content in the sample material was measured using a SHIMADZU MOC-120H humidity analyzer, with the analyzer’s drying chamber set to a temperature of 105 °C. The decrease in moisture content in the sample during drying was controlled automatically, with an accuracy of 0.01% (by weight) every 30 s. The water content in the material of the sample considered below was equal to 12.53%, corresponding to an absolute humidity level of 14.32%.
Tests have shown that, in the process of destruction, a primary crack appears in the middle of the span; the length and width of such a crack increase with an increase in the load. With an increase in the load, signs of bifurcation of the primary crack and the formation of secondary cracks appear [9]. From a physical perspective, the appearance of cracks means that the stiffness of the beam decreases with an increasing load.
In the model considered earlier [9], it is necessary to know the characteristics of the crack in advance, which makes a simulation difficult. In the present work, there is no need for such information, since the effect of growing cracks is modeled using an automatic nonlinear decrease in stiffness (2), depending on displacement u (12). In addition, the present model (1)–(14) does not postulate a damage function (or variable), which is usually denoted as D . Instead, damage ( D ) is quantitatively predicted using relation (12).
The adequacy of the model and the reliability of the simulation results were tested experimentally. The predicted curve (14) and experimental data are shown in Figure 6 ( F p e a k = 769   N , and u p e a k = 1.574   mm ).
Figure 6 shows that, for the pre-peak condition, the simulation results almost coincide with the experimental data. In the post-peak condition, the discrepancy between the model and test data increases with an increase in displacement. Nevertheless, in general, model (14) is physically adequate, since it correctly reflects the relationship between load and displacement. The decrease in the bearing capacity of the specimen compared to prediction of (14) in the final stage of the test can be explained by the influence of weak short thawing, which, as noted above, was not considered in model (14) and may be the subject of further research. However, it is more likely that the observed decrease in bearing capacity was contributed by the influence of clay particles in the specimen material [9], which should also be explored in future research.

3.2. Prediction of F p e a k and u p e a k Values in Case of Bending

This subsection deals with the following circumstance, which is important from a practical perspective. To carry out calculations according to Formula (14), it is necessary to know F p e a k and u p e a k . These values can be determined directly from the test machine (Figure 3). Since F p e a k corresponds to the maximum load, direct experimental determination of the F p e a k and u p e a k values can result in damage to the test object. Therefore, a nondestructive or nearly nondestructive method for determining these values is desirable. Nondestructive methods for determining the properties of materials and structures belong to the class of indirect measurement methods. Sufficiently reliable methods for the indirect determination of F p e a k and u p e a k can be realized, if Equation (14) provides high approximation accuracy of the experimental data. A variant of such a method (an algorithm) is proposed in the following section. Suppose that only two values, u = u 1 and u = u 2 , are found experimentally and correspond to F = F 1 and F = F 2 . In order to reduce the damageability of the research object, tests should be carried out in the pre-peak stage, i.e., when u 1 < u 2 < u p e a k , and, accordingly, F 1 < F 2 < F p e a k . Let us substitute u = u 1 and F = F 1 into Equation (14) and express F p e a k from the obtained equality:
F p e a k = F 1 u p e a k u 1 e 1 u 1 u p e a k   .  
Substitute (15), u = u 2 and F = F 2 into (14). From the resulting equality, we can find u p e a k :
u p e a k = u 2 u 1 l n F 1 u 2 F 2 u 1   .  
Using (16), we calculate F p e a k (15). The obtained values of F p e a k and u p e a k are substituted into (14) to obtain the equation of the full load–displacement curve.
Note that if the dependence F u is linear, then F 1 u 2 = F 2 u 1 , and, theoretically, u p e a k = , and F p e a k = , which is not implemented in practice.
Any pair of points in the pre-peak stage of deformation can be selected as points 1 and 2 (Figure 3 and Figure 6), i.e., there are infinitely many choices for selecting these points. The following example using Equations (15) and (16) shows three choices for points 1 and 2. Experimentally obtained initial data ( u 1 , u 2 , F 1 , and F 2 ) and calculation results ( u p e a k and   F p e a k ) for the example in Figure 6 are shown in Table 1.
The simulation results presented in Table 1 show that the average values of the highest load ( F p e a k ) and the corresponding displacement ( u p e a k ) can be determined indirectly without destroying the test object. For this purpose, the results of experiments are used only in the pre-peak stage. It is important to note that Equations (15) and (16) should be used with caution, because the results of the calculations are sensitive not only to inaccuracies of approximation (14) but also to variations in the initial data, which are the experimental values u 1 , u 2 , F 1 , and F 2 . Nevertheless, it is hoped that the application of sufficiently accurate measurements and new mathematical models in future research will lead to better results. With regard to the problem of assessing the bearing capacity of winter forest roads, the displacements u 1 and u 2 and forces F 1 and F 2 specified in Formulas (15) and (16) can be determined by using or adapting the RAPTOR measurement technology mentioned above [5].

3.3. Comparison of Model and Experimental Data: Uniaxial Compression of Frozen Sandy Soil

As noted above, the top layer of the road structure resists bending and transfers the load to the underlying soil layers that resist compression. Accordingly, sufficiently reliable experimental methods are needed to determine the physical and mechanical properties of road structure materials, as well as mathematical models to predict the strength and material stiffness of forest road layers under bending and compression. Model (14) considered above is justified using a general approach in terms of “load”, “displacement”, and “stiffness”, which implies that the model is adequate not only for bending (Section 3.1) but also for compression. Next, we consider an example of the application of model (14) to the analysis of the load–displacement relationship in compression. The purpose of this subsection is to assess the adequacy of the simulation results by comparing them with experimental data known from the literature for the uniaxial compression of frozen (−10 °C) medium-coarse sand [11]. Displacement and force were calculated with values of u = ε H and F = σ A , where = π D 2 / 4 , H = 100 mm, and D = 50 . The values of ε and σ were determined for the sample “D2: Medium coarse sand” from the tables and plots in [11]. As a result, the adapted initial data ( u p e a k = 5.6   mm, F p e a k = 9061 N) for model (14) and the results of using this model were obtained (Figure 7).
A comparison of Figure 6 and Figure 7 shows that satisfactory results were obtained using model (14) for both frozen sandy and sandy loam soils. However, better results were obtained for sandy soil compared to sandy loam, which can be explained by the influence of clay particles in sandy loam, which presumably reduced the resistance of sand particles to their mutual interdisplacements.

3.4. Prediction of F p e a k and u p e a k Values under Uniaxial Compression of Frozen Sandy Soil

As noted above, the experimental methods of direct and indirect measurements can be used to determine the values of u p e a k and   u p e a k . The indirect method is implemented in the following example using Equations (15) and (16), and three options for choosing points 1 and 2 are given. The initial data ( u 1 , u 2 , F 1 , and F 2 ) were determined based on experiments in [11] (Figure 7). The values of u p e a k and u p e a k predicted by Formulas (15) and (16) are given in Table 2.
The simulation results presented in Table 2 show that the average values of the highest load ( F p e a k ) and the corresponding displacement ( u p e a k ) can be determined indirectly without bringing the test object to failure. For this purpose, the results of experiments only in the pre-peak stage are used. As in the example considered above (Table 1), it is important to note that Equations (15) and (16) should be applied with caution since the calculation results are sensitive not only to inaccuracies in the approximation (14) but also to variations in the initial data, which are the experimental values u 1 , u 2 , F 1 , and F 2 .

4. Discussion

The strength of frozen ground depends on temperature, porosity, water content, loading rate, and other factors, as shown in [11,25,26,27,28]. All these factors inevitably affected the values of F p e a k and u p e a k in our model (14), so this model can be applied or adapted to other mechanical systems. This result is confirmed, in particular, by the applications of the model for analyzing both the bending (Section 3.1) and uniaxial compression (Section 3.3) of frozen soil. In this model, the values F p e a k and u p e a k (14) are determined experimentally and serve as the primary data from which stresses, relative strains, and strain energy can be calculated.
If necessary, the values of F p e a k and u p e a k can be determined indirectly using the algorithm from Section 3.2. The carrying capacity of frozen ground correlates to temperature [2,3], which allowed recently developed sensors to be efficiently used for the intelligent monitoring of forest roads [29].
The model presented above in the form of function (14) can be considered a special case of the more general function (17), which was proposed in [30]:
F = F p e a k u u p e a k e 1 u u p e a k c .  
Equation (17) defines a set of curves that satisfactorily describe the dependence of stresses and strains of concrete at different temperatures [30]. At the same time, the equations of the curves differ in the values of only one parameter (exponent c in Formula (17)). Analysis of other models of this class and their comparisons can be found in [23]. The key feature of such models is that they do not require prior information about the particle size distribution composition of the material, since these properties are taken into account integrally, given that the values of F p e a k and u p e a k   inevitably depend on such properties. The values of F p e a k and u p e a k can be found by direct or indirect measurements, as shown by the example in Section 3.2. This key feature of the model was especially valuable in our analysis of the bearing capacity of a forest road, because soils with heterogeneous components were used for the construction of such roads, and the influence of each component is almost impossible to estimate with sufficient accuracy. In the proposed model, the total estimate of the influence of all components was found to be sufficient and was determined by only two values ( F p e a k and u p e a k ). Moreover, using the same data, we were able to determine the stiffness of a forest road structure (12).
It should be noted that model (14) is too simple to be universal, so adapting this model may require additional research. Model (17), however, is more universal [23,30]; justification of the degree indicator c in this model deserves a separate study. What can be obtained from such studies? To answer this question, let us consider the following possibilities.
The proposed model allows one to directly or indirectly determine the greatest load on the axle of a vehicle F p e a k   and the corresponding displacement   u p e a k (Section 3.2).
Another possibility arises from the following circumstance: if the load on the vehicle axle is, for example, F = 0.5 F p e a k , then two points ( a and b ) on the load–displacement curve will theoretically correspond to this load (i.e., two displacement values ( u = u a and u = u b ); Figure 8).
In general terms, the behavior of frozen soil under cyclic loading (Figure 8) is similar to the known laws for other varieties of sandy soil [31,32,33,34]. Figure 8 shows that the displacements u > u b are unacceptable because the bearing capacity of the road is insufficient for the load F = 0.5 F p e a k . This result means that displacement u = u b is the limit for this load. Accordingly, it is possible to calculate the limit depth of the rut. This rut appears as a result of repeated passage of the vehicle. It should be noted that Figure 8 illustrates only the calculation methodology, but not the calculation with regard to realistic loads. A detailed analysis of the acceptability of the developed model in real situations is the subject of further research. Nevertheless, in accordance with the purpose of the work, we substantiated a new tool in the form of a model (equations (15) and (16)) to analyze the carrying capacity of winter forest roads, which is important for planning vehicle loading and guaranteed removal of harvested wood of a given volume, taking into account studies [6,35,36,37].

5. Conclusions

In this work, an analytical model for the quantitative assessment of the load-bearing capacity of winter forest roads was theoretically substantiated. To achieve this goal, we used the ideas of fracture mechanics and methods of mathematical modeling.
Taking into account the variability of the granulometric composition of forest road soils, it is important to note that the developed model does not require accurate characteristics of these soils, as these characteristics can be taken into account indirectly through deflections and corresponding external loads measured using known methods. It is only important to ensure that the model is verified for sandy and sandy loam soils.
Another distinctive feature is that this model was developed considering load–displacement, while many other well-known models were formulated in terms of stress–deformation. Thus, the conversion of a load into stress and a displacement into strain is excluded.
In addition, the novelty of the model (1)–(14), in comparison with the prototype in [9], is that the effect of growing cracks is modeled using an automatic nonlinear decrease in the stiffness (2), depending on the displacement (12). Thus, the need for prior knowledge of the crack characteristics is eliminated, which simplifies modeling and expands the possibilities for further investigations.
Lastly, the present model (1)–(14) does not postulate a damage function (or variable), usually denoted as D , although the hypothesis of the law of stiffness degradation due to material damage during loading (4) is used, which leads to a damage function in the form of D = θ (7).

Author Contributions

Conceptualization, V.K., V.S. and G.K.; methodology, V.S.; software, G.K.; validation, V.K., V.S. and G.K.; formal analysis, V.K.; investigation, V.K., V.S. and G.K.; resources, V.S.; data curation, V.K.; writing—original draft preparation, G.K.; writing—review and editing, V.S. and V.K.; visualization, G.K.; supervision, V.S.; project administration, V.S. All authors have read and agreed to the published version of the manuscript.

Funding

This research received no external funding.

Data Availability Statement

Not applicable.

Conflicts of Interest

The authors declare no conflict of interest.

References

  1. Kuloglu, T.Z.; Anderson, A.E.; Lieffers, V.J. Cost comparison of non-frozen and frozen forest road construction in changing climates. Int. J. For. Eng. 2021, 32, 103–111. [Google Scholar] [CrossRef]
  2. Evirgen, B.; Tuncan, M. A physical soil freezing model for laboratory applications. Cold Reg. Sci. Technol. 2019, 159, 29–39. [Google Scholar] [CrossRef]
  3. Petrovic, J.J. Mechanical properties of ice and snow. J. Mater. Sci. 2003, 38, 1–6. Available online: https://www.researchgate.net/publication/227158247_Review_Mechanical_properties_of_ice_and_snow (accessed on 20 September 2021). [CrossRef]
  4. Antonson, H.; Buckland, P.; Blomqvist, G. Road Salt Damage to Historical Milestones Indicates Adaptation of Winter Roads to Future Climate Change May Damage Arctic Cultural Heritage. Climate 2021, 9, 149. [Google Scholar] [CrossRef]
  5. Madsen, S.S.; Pedersen, N.L. Comparison of RAPTOR measurements with falling weight deflectometer deflections using backcalculation. In Eleventh International Conference on the Bearing Capacity of Roads, Railways and Airfields, 1st ed.; Hoff, I., Mork, H., Saba, R., Eds.; CRC Press: London, UK, 2022; Volume 3, pp. 33–44. [Google Scholar] [CrossRef]
  6. Martin, A.M.; Owende, P.M.O.; O’Mahony, M.J.; Ward, S.M. Estimation of the serviceability of forest access roads. J. For. Eng. 1999, 10, 55–61. [Google Scholar] [CrossRef]
  7. Uglova, E.V.; Tiraturyan, A.N.; Liapin, A.A. Integrated approach to studying characteristics of dynamic deformation on flexible pavement surface using nondestructive testing. PNRPU Mech. Bull. 2016, 2, 111–130. [Google Scholar] [CrossRef]
  8. Kaakkurivaara, T.; Vuorimies, N.; Kolisoja, P.; Uusitalo, J. Applicability of portable tools in assessing the bearing capacity of forest roads. Silva Fenn. 2015, 49, 1239. [Google Scholar] [CrossRef]
  9. Gavrilov, T.A.; Kolesnikov, G.N. Evolving crack influence on the strength of frozen sand soils. Mag. Civ. Eng. 2020, 2, 54–64. [Google Scholar] [CrossRef]
  10. Hwang, B.; Cho, W. The Effect of Fines and Temperature on the Mode I Fracture Characteristics of the Frozen Sand. Adv. Civ. Eng. 2022, 2022, 9917378. [Google Scholar] [CrossRef]
  11. Chen, J.; Wang, L.; Yao, Z. Physical and mechanical performance of frozen rocks and soil in different regions. Adv. Civ. Eng. 2020, 2020, 8867414. [Google Scholar] [CrossRef]
  12. Cornetti, P.; Pugno, N.; Carpinteri, A.; Taylor, D. Finite fracture mechanics: A coupled stress and energy failure criterion. Eng. Fract. Mech. 2006, 73, 2021–2033. [Google Scholar] [CrossRef]
  13. Wei, S.; Tao, Y.; Ying, G.; Zhichao, X.; Chengcheng, Z. Establishment and Experimental Verification of Stress-Temperature Coupled Damage Model of Warm Frozen Soil. Geofluids 2022, 2022, 5101425. [Google Scholar] [CrossRef]
  14. Liu, D.; He, M.; Cai, M. A damage model for modeling the complete stress–strain relations of brittle rocks under uniaxial compression. Int. J. Damage Mech. 2018, 27, 1000–1019. [Google Scholar] [CrossRef]
  15. Zhang, F.; Zhu, Z.; Fu, T.; Jia, J. Damage mechanism and dynamic constitutive model of frozen soil under uniaxial impact loading. Mech. Mater. 2020, 140, 103217. [Google Scholar] [CrossRef]
  16. Xu, J.J.; Tang, C.S.; Cheng, Q.; Xu, Q.L.; Inyang, H.I.; Lin, Z.Y.; Shi, B. Investigation on desiccation cracking behavior of clayey soils with a perspective of fracture mechanics: A review. J. Soils Sediments 2021, 22, 859–888. [Google Scholar] [CrossRef]
  17. Mohammadnejad, M.; Liu, H.; Chan, A.; Dehkhoda, S.; Fukuda, D. An overview on advances in computational fracture mechanics of rock. Geosystem Eng. 2021, 24, 206–229. [Google Scholar] [CrossRef]
  18. Makarov, P.V. Evolutionary nature of structure formation in lithospheric material: Universal principle for fractality of solids. Russ. Geol. Geophys. 2007, 48, 558–574. [Google Scholar] [CrossRef]
  19. Smolin, I.Y.; Eremin, M.O.; Makarov, P.V.; Buyakova, S.P.; Kul’kov, S.N.; Evtushenko, E.P. Numerical modelling of mechanical behaviour of model brittle porous materials at the mesoscale. Tomsk. State Univ. J. Math. Mech. 2013, 5, 78–90. Available online: http://mi.mathnet.ru/eng/vtgu/y2013/i5/p78 (accessed on 20 August 2021).
  20. Kolesnikov, G. Analysis of Concrete Failure on the Descending Branch of the Load-Displacement Curve. Crystals 2020, 10, 921. [Google Scholar] [CrossRef]
  21. Kolesnikov, G.; Gavrilov, T. Sandstone Modeling under Axial Compression and Axisymmetric Lateral Pressure. Symmetry 2022, 14, 796. [Google Scholar] [CrossRef]
  22. Baldwin, R.; North, M.A. Stress-strain curves of concrete at high temperature—A review. Fire Saf. Sci. 1969, 785, 1. Available online: http://www.iafss.org/publications/frn/785/-1/view/frn_785.pdf (accessed on 31 March 2022).
  23. Stojković, N.; Perić, D.; Stojić, D.; Marković, N. New stress-strain model for concrete at high temperatures. Teh. Vjesn. 2017, 24, 863–868. [Google Scholar] [CrossRef]
  24. Aksenov, V.I.; Gevorkyan, S.G.; Doroshin, V.V. Dependence of Strength and Physical Properties of Frozen Sands on Moisture Content. Soil Mech. Found. Eng. 2018, 54, 420–424. [Google Scholar] [CrossRef]
  25. Li, K.; Li, Q.; Liu, C. Impacts of Water Content and Temperature on the Unconfined Compressive Strength and Pore Characteristics of Frozen Saline Soils. KSCE J. Civ. Eng. 2022, 26, 1652–1661. [Google Scholar] [CrossRef]
  26. Zhao, Y.; Han, Y.; Chen, C.; Seo, H. Crack Detection in Frozen Soils Using Infrared Thermographic Camera. Sensors 2022, 22, 885. [Google Scholar] [CrossRef] [PubMed]
  27. Zuan, P.; Yang, L.; Fei, L. Particle breakage behavior in frozen sands during triaxial shear tests based on the energy principle. Cold Reg. Sci. Technol. 2022, 199, 103571. [Google Scholar] [CrossRef]
  28. Hu, F.; Li, Z.; Tian, Y.; Hu, R. Failure Patterns and Morphological Soil–Rock Interface Characteristics of Frozen Soil–Rock Mixtures under Compression and Tension. Appl. Sci. 2021, 11, 461. [Google Scholar] [CrossRef]
  29. Gaspar, G.; Dudak, J.; Behulova, M.; Stremy, M.; Budjac, R.; Sedivy, S.; Tomas, B. IoT-Ready Temperature Probe for Smart Monitoring of Forest Roads. Appl. Sci. 2022, 12, 743. [Google Scholar] [CrossRef]
  30. Blagojević, M.; Pešić, D.; Mijalković, M.; Glišović, S. Unique function for describing stress and strain behaviour of fire-affected concrete [Jedinstvena funkcija za opisivanje naprezanja i deformacije betona u požaru]. Gradjevinar 2011, 63, 19–24. Available online: https://hrcak.srce.hr/64221 (accessed on 20 August 2021).
  31. He, S.-H.; Zhang, Q.-F.; Ding, Z.; Xia, T.-D.; Gan, X.-L. Experimental and Estimation Studies of Resilient Modulus of Marine Coral Sand under Cyclic Loading. J. Mar. Sci. Eng. 2020, 8, 287. [Google Scholar] [CrossRef]
  32. Xia, P.; Shao, L.; Deng, W.; Zeng, C. Evolution Prediction of Hysteresis Behavior of Sand under Cyclic Loading. Processes 2022, 10, 879. [Google Scholar] [CrossRef]
  33. Tsuha, C.D.H.C.; Foray, P.Y.; Jardine, R.J.; Yang, Z.X.; Silva, M.; Rimoy, S. Behaviour of displacement piles in sand under cyclic axial loading. Soils Found. 2012, 52, 393–410. [Google Scholar] [CrossRef]
  34. Liu, Y.; Dai, F. A review of experimental and theoretical research on the deformation and failure behavior of rocks subjected to cyclic loading. J. Rock Mech. Geotech. Eng. 2021, 13, 1203–1230. [Google Scholar] [CrossRef]
  35. Bergman, R.; Sahoo, K.; Englund, K.; Mousavi-Avval, S.H. Lifecycle Assessment and Techno-Economic Analysis of Biochar Pellet Production from Forest Residues and Field Application. Energies 2022, 15, 1559. [Google Scholar] [CrossRef]
  36. O’Mahony, M.J.; Ueberschaer, A.; Owende, P.M.O.; Ward, S.M. Bearing capacity of forest access roads built on peat soils. J. Terramechanics 2000, 37, 127–138. [Google Scholar] [CrossRef]
  37. Ovaskainen, H.; Riekki, K. Computation of Strip Road Networks Based on Harvester Location Data. Forests 2022, 13, 782. [Google Scholar] [CrossRef]
Figure 1. Northwest area of the Russian Federation. Winter forest road in the Republic of Karelia (photo by V.K.).
Forests 13 01538 g001
Figure 2. Deflection of the road surface and rut forming under the action of a moving load. Total deformation = reversible deformation + irreversible deformation (rut depth).
Forests 13 01538 g002
Figure 3. Load–displacement pattern.
Forests 13 01538 g003
Figure 4. Beam schema. The dimensions are given in mm.
Forests 13 01538 g004
Figure 5. Bending test of the sample.
Forests 13 01538 g005
Figure 6. The predicted curve (solid line) and experimental data [9] (circles) for the sample, according to Figure 4 and Figure 5 (frozen sandy loam).
Forests 13 01538 g006
Figure 7. The full load–displacement curve (14) for frozen sandy soil. Experimental data are shown by markers (circles).
Forests 13 01538 g007
Figure 8. A schematic example of the influence of the number of transport cycles on the rut depth. One transport cycle corresponds to one passing of the vehicle (Figure 2). The stiffness of S 0 is determined by the ratio (10). Points a and b on the curve (red line) determine the rut depth depending on the load and the number of transport cycles.
Forests 13 01538 g008
Table 1. Initial data ( u 1 , u 2 , F 1 and F 2 ) and the calculation results ( u p e a k and F p e a k ).
Point Selection Options 1 and 2 u 1
(mm)
u 2
(mm)
F 1
(N)
F 2
(N)
u p e a k
(mm)
F p e a k
(N)
Indirect measurements:
10.1630.2592003001.667 (105%)829 (108%)
20.1630.3752004001.514 (96%)761 (99%)
30.2590.3753004001.407 (89%)721 (94%)
Average values:1.529 (97%)770 (100%)
Direct measurements 1:1.574 (100%)769 (100%)
1 The results of direct measurements are taken as 100%.
Table 2. Initial data ( u 1 , u 2 , F 1 and F 2 ) and the calculation results ( u p e a k and F p e a k ).
Point Selection Options 1 and 2 u 1
(mm)
u 2
(mm)
F 1
(N)
F 2
(N)
u p e a k
(mm)
F p e a k
(N)
Indirect measurements:
10.4861.292201845604.926 (114%)8313 (109%)
20.4862.609201871405.082 (110%)8549 (106%)
31.2922.609456071405.182 (108%)8631 (105%)
Average values:5.063 (111%)8498 (107%)
Direct measurements 1:5.604 (100%)9061 (100%)
1 The results of direct measurements were determined on the basis of the experiments noted above [11]; these data are taken as 100%.
Publisher’s Note: MDPI stays neutral with regard to jurisdictional claims in published maps and institutional affiliations.

