
Evaluating the Forest Road Systems Subjected to Different Loadings by Using the Finite Element Method


Abstract
1. Introduction
2. Materials and Methods
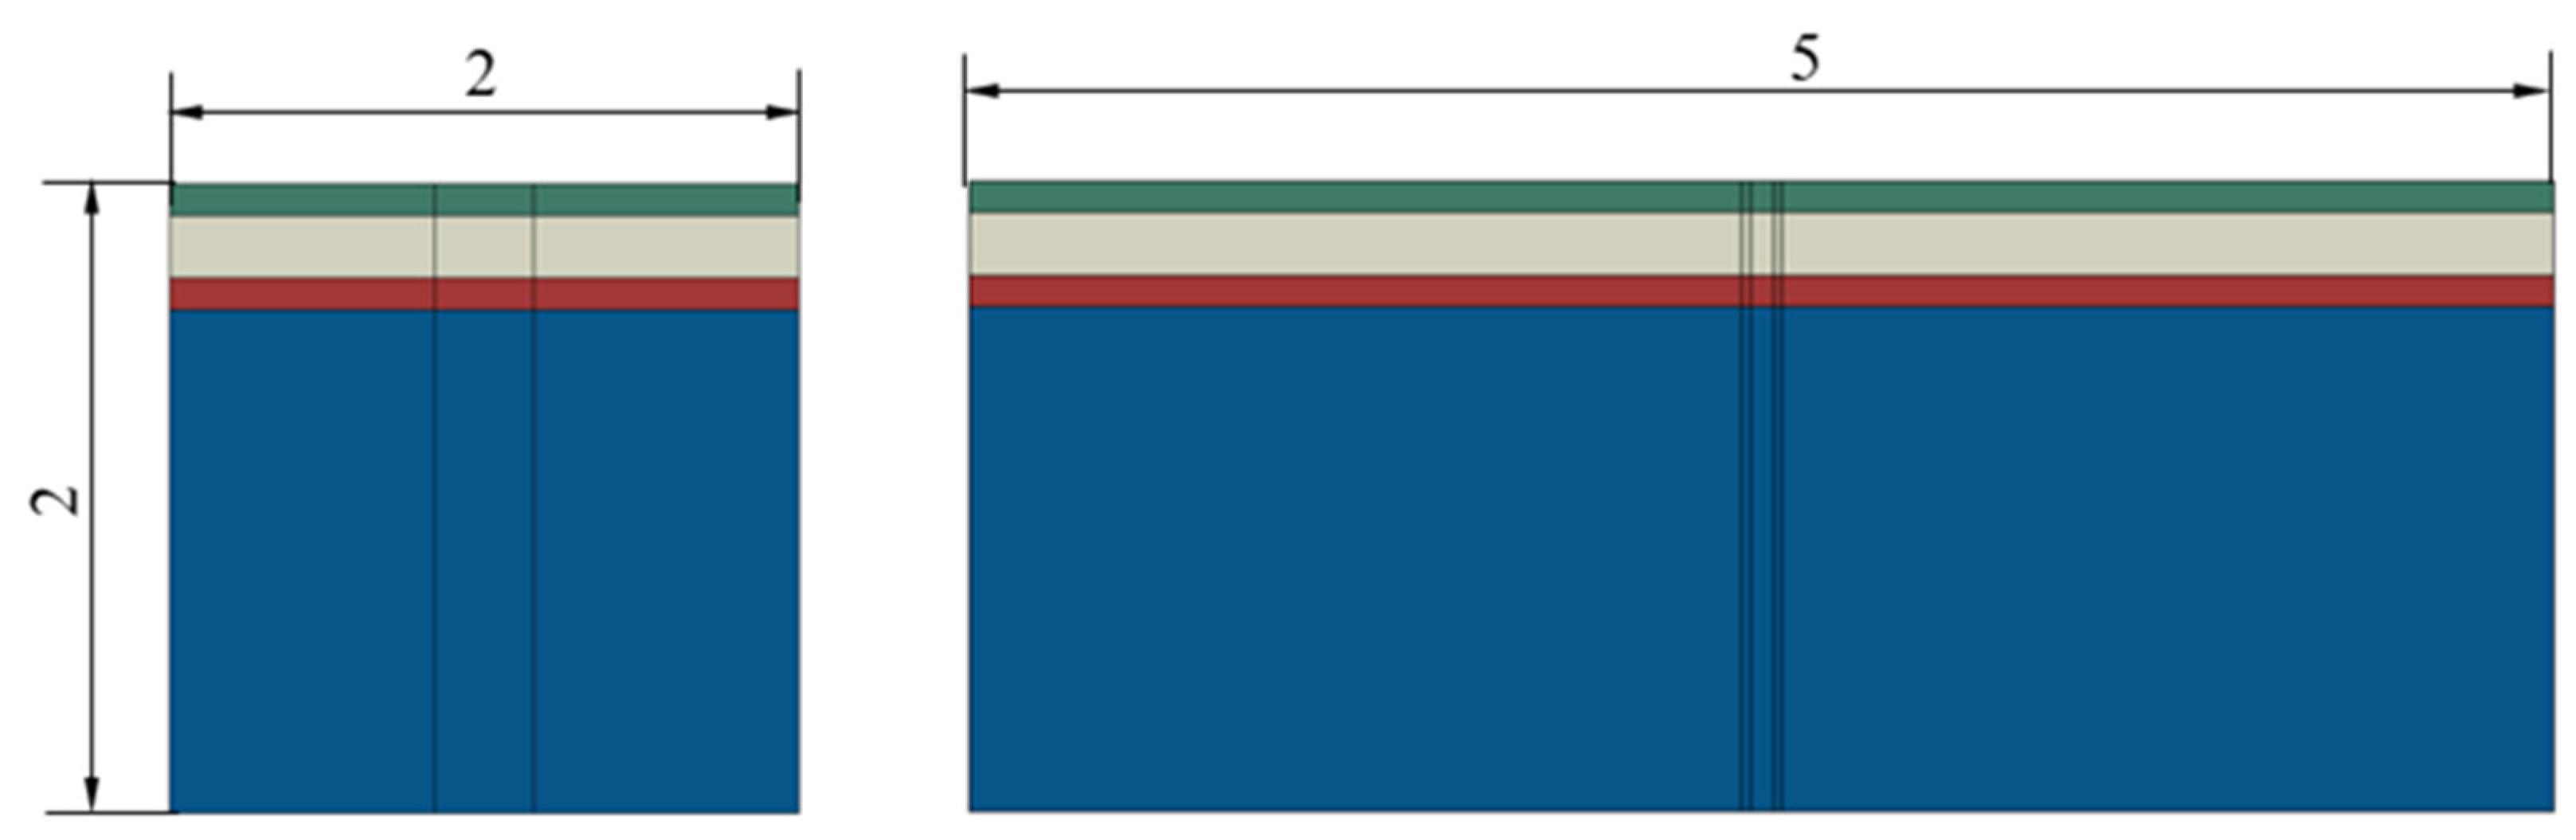
2.1. Forest Road Systems Taken into Consideration
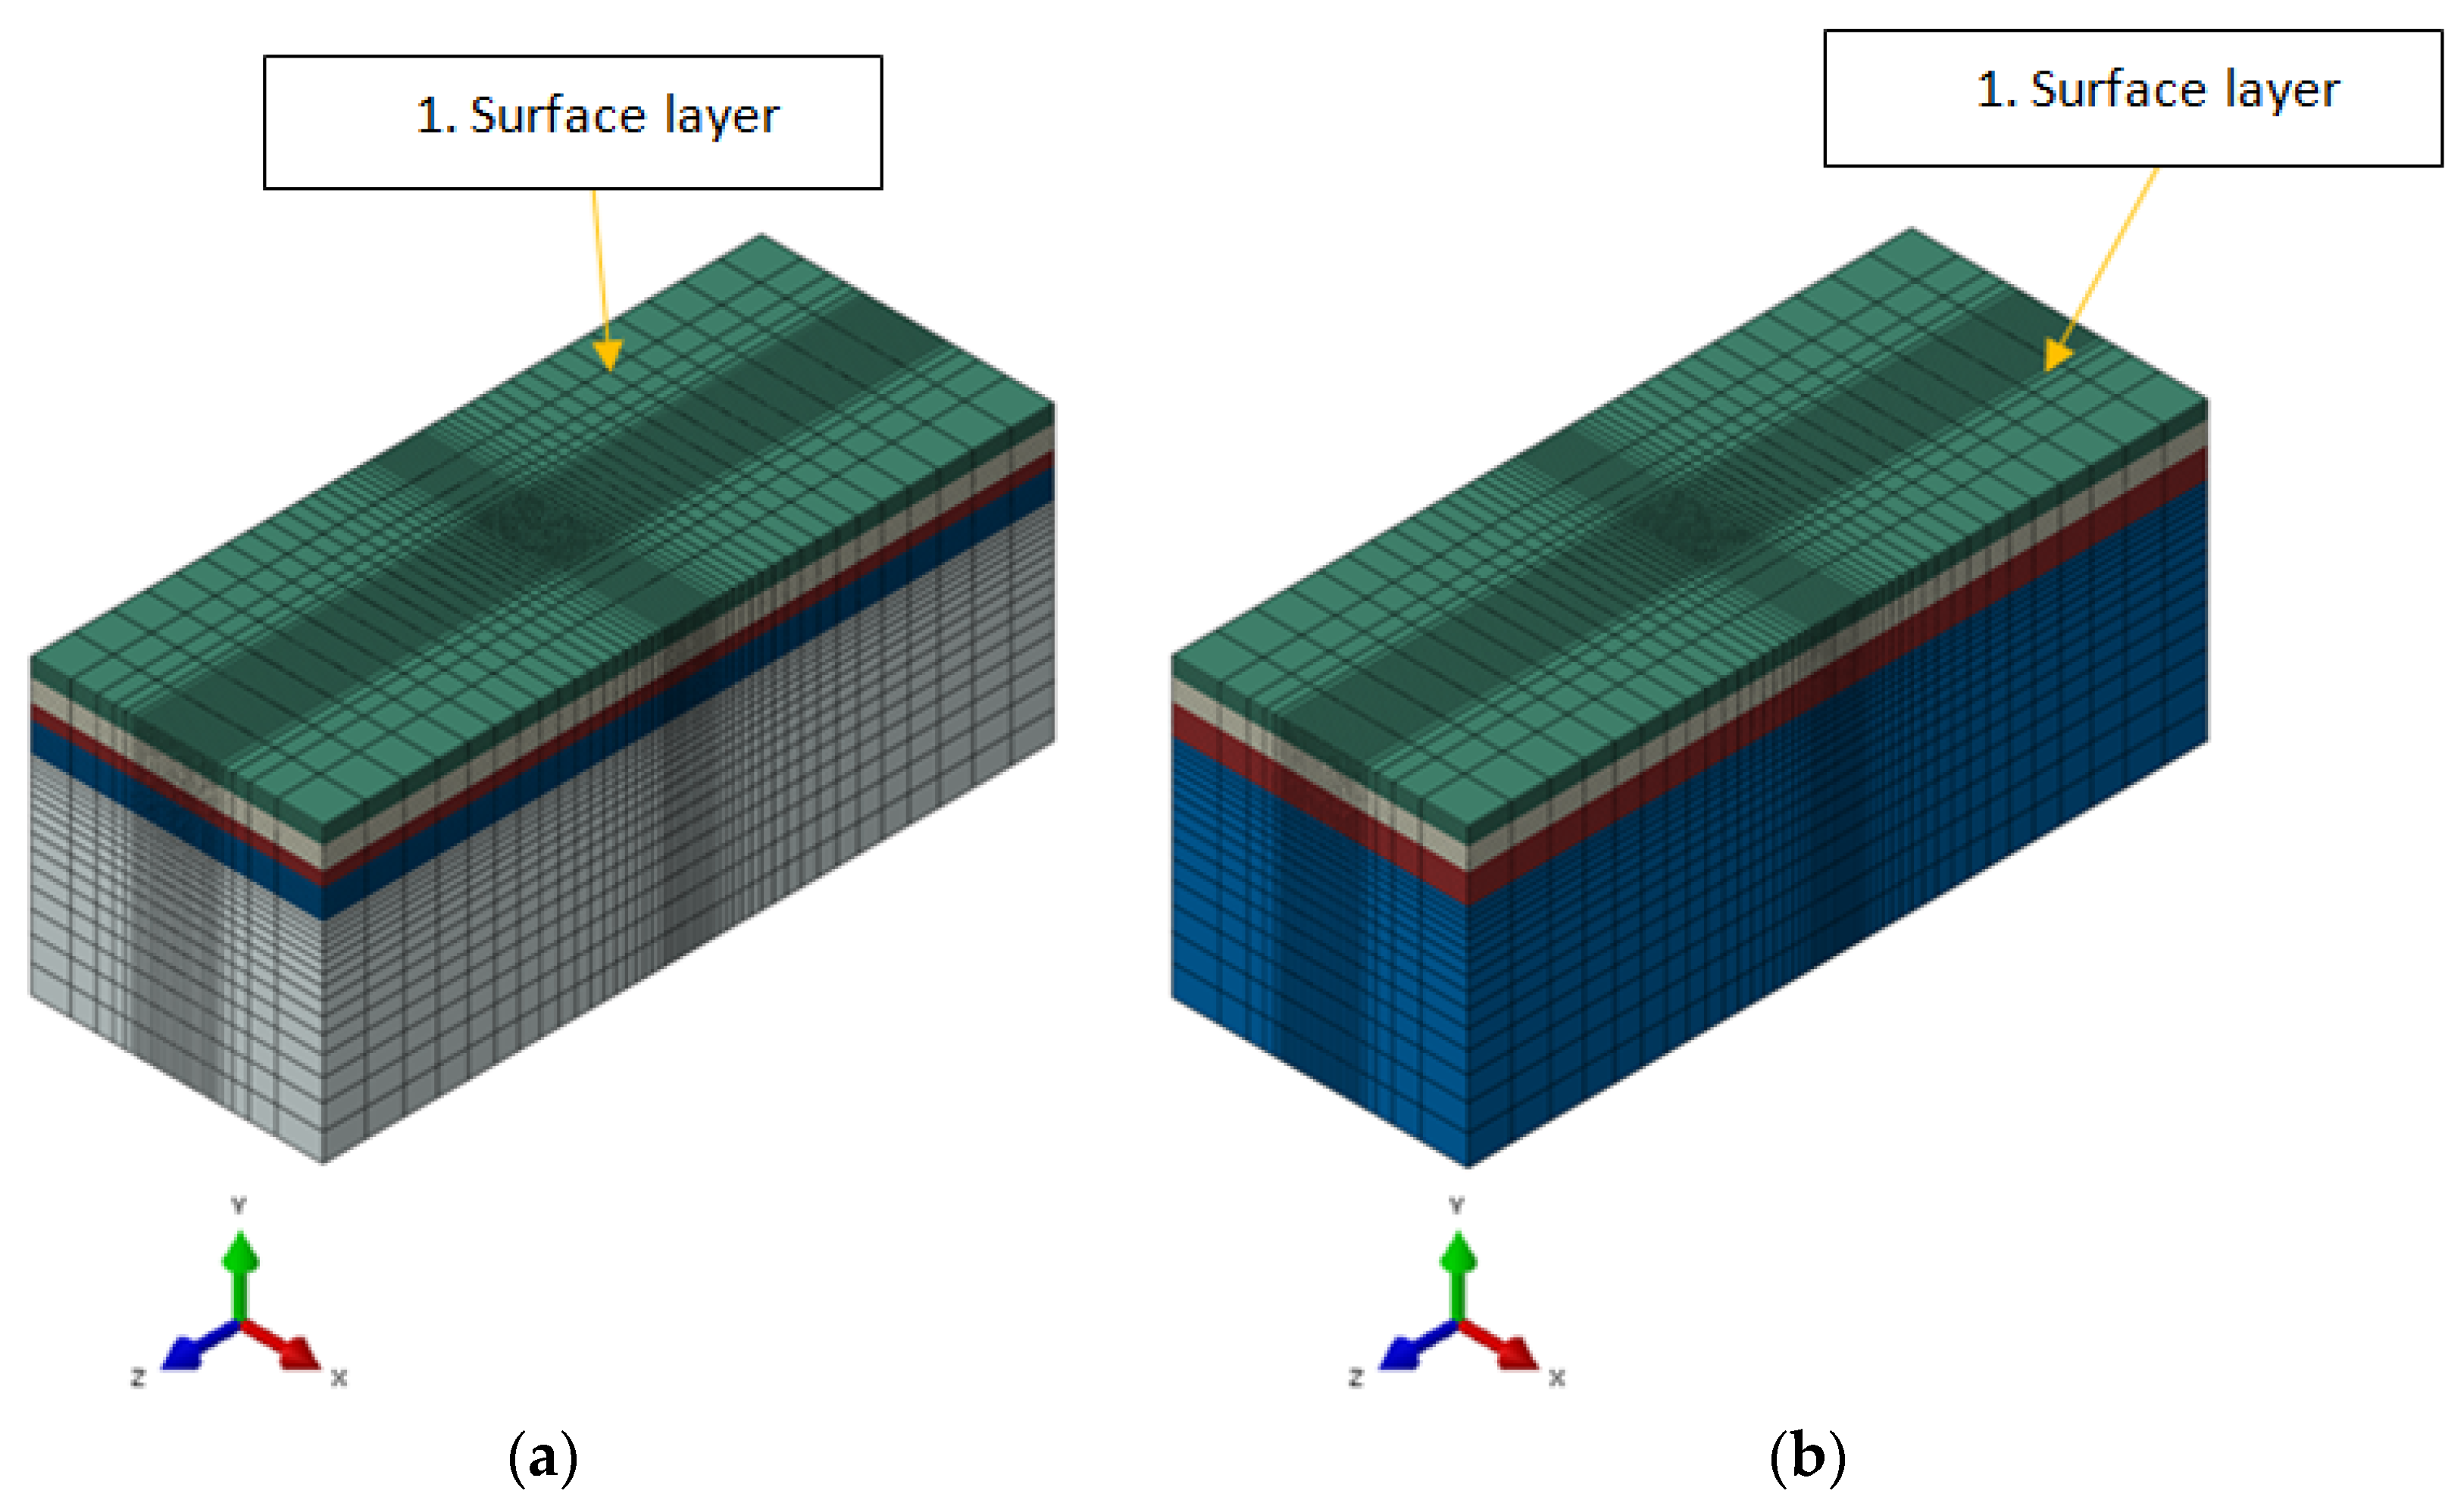
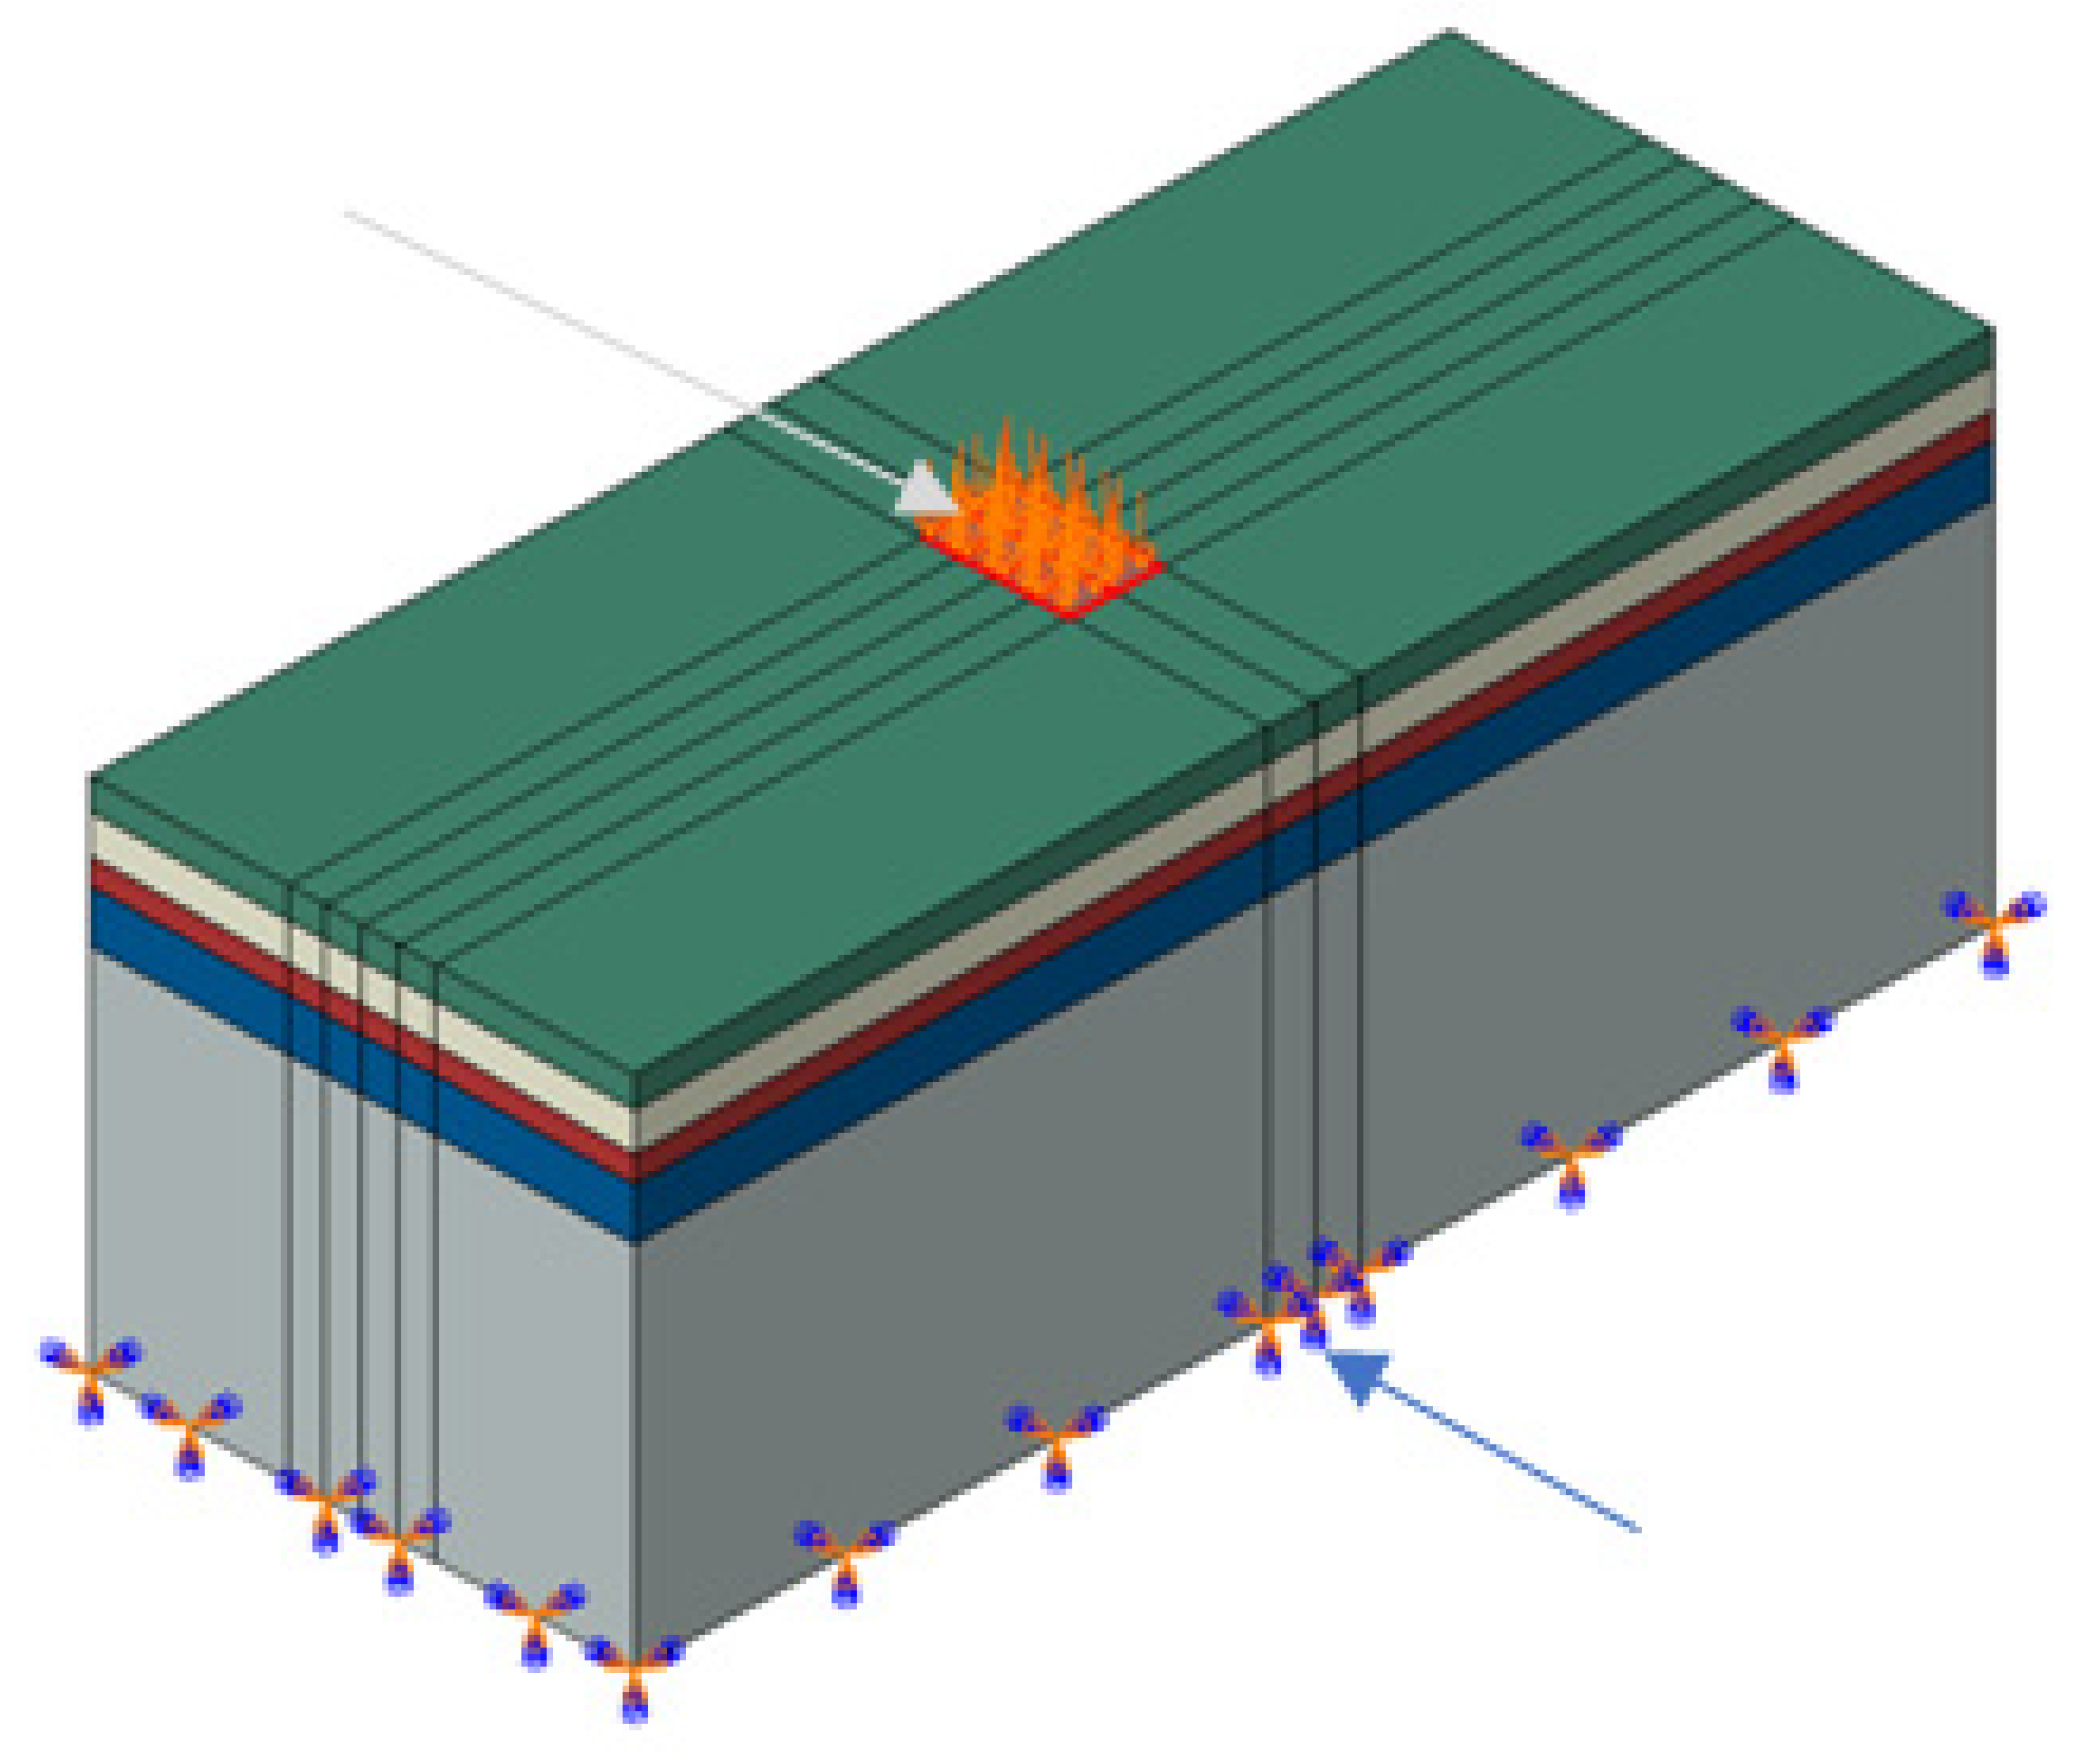
2.2. The Use of FEM in Evaluating the Behavior of Road Systems
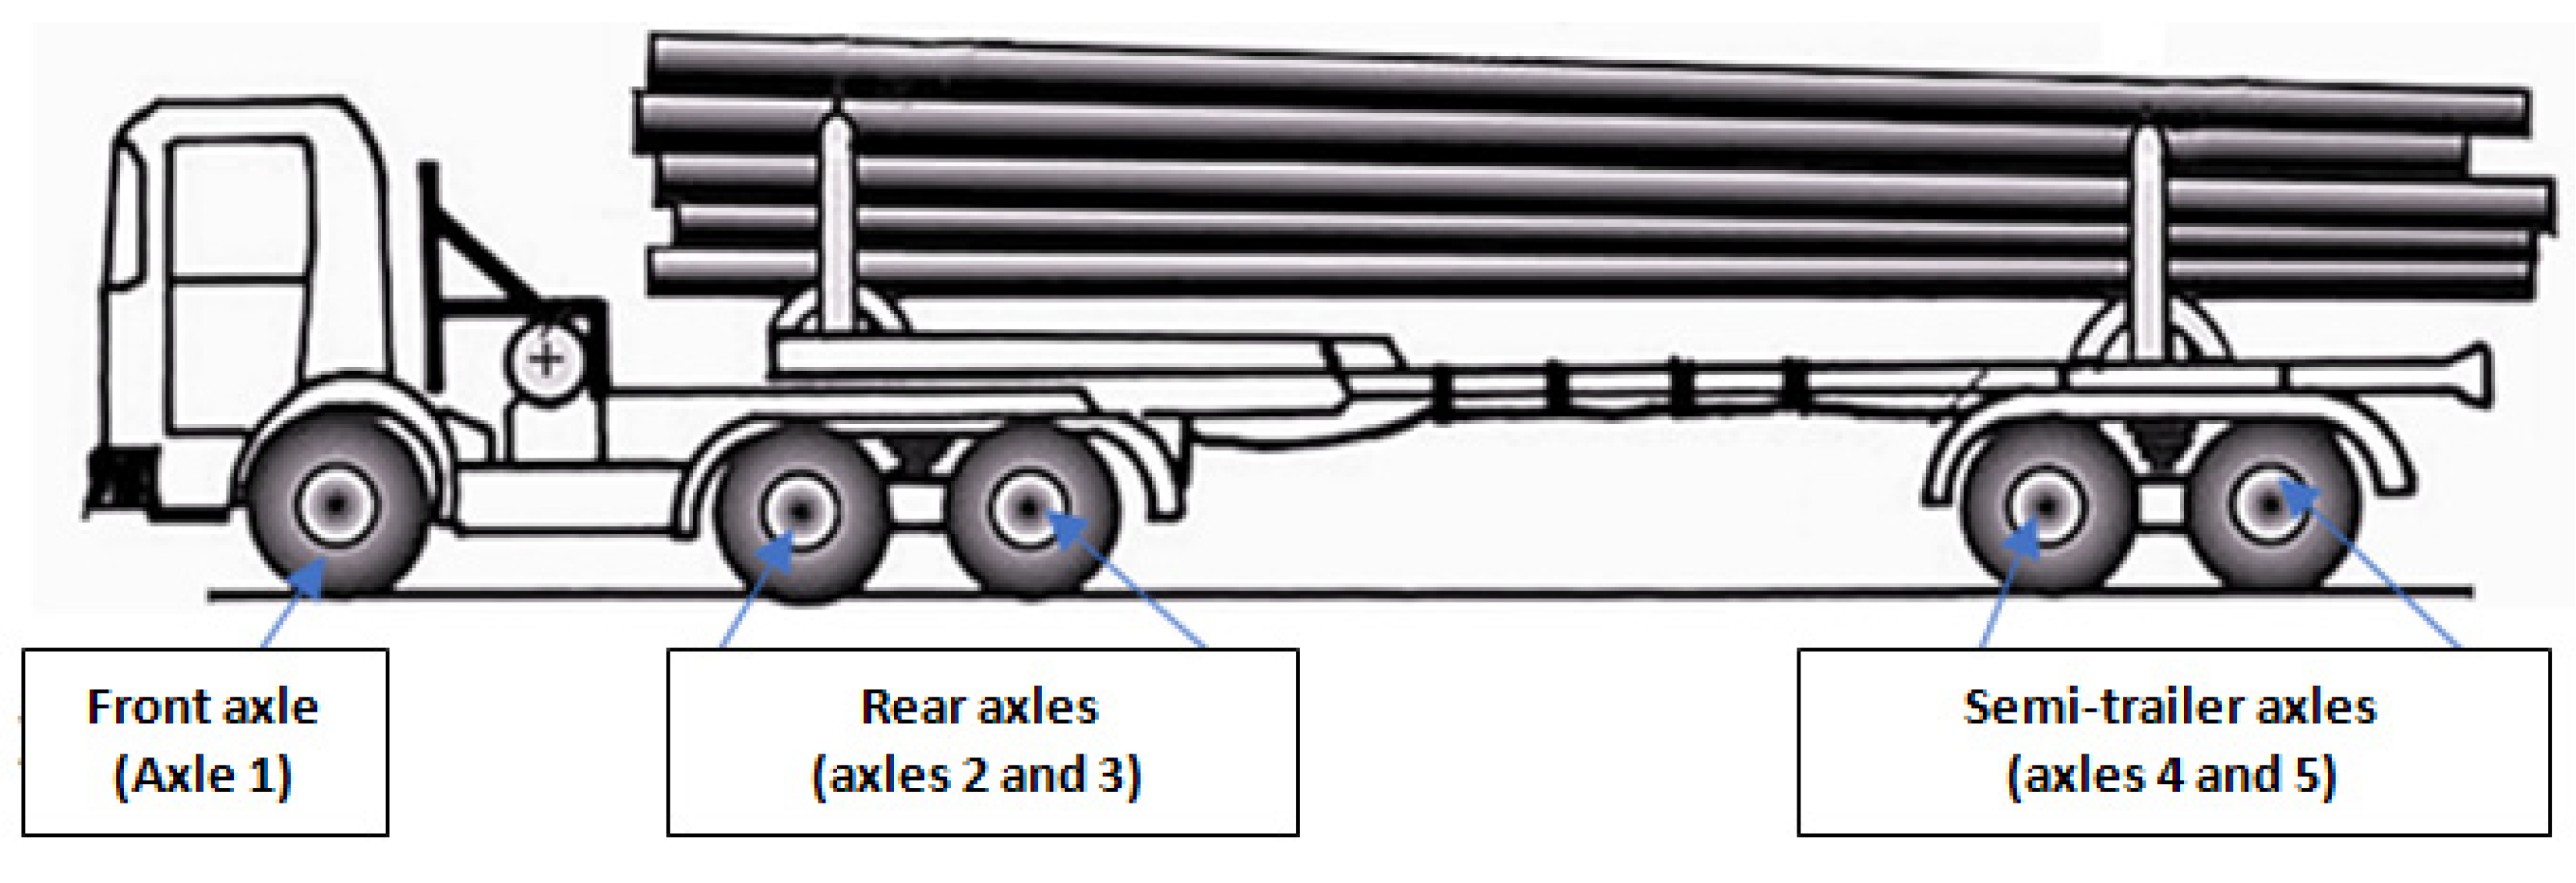
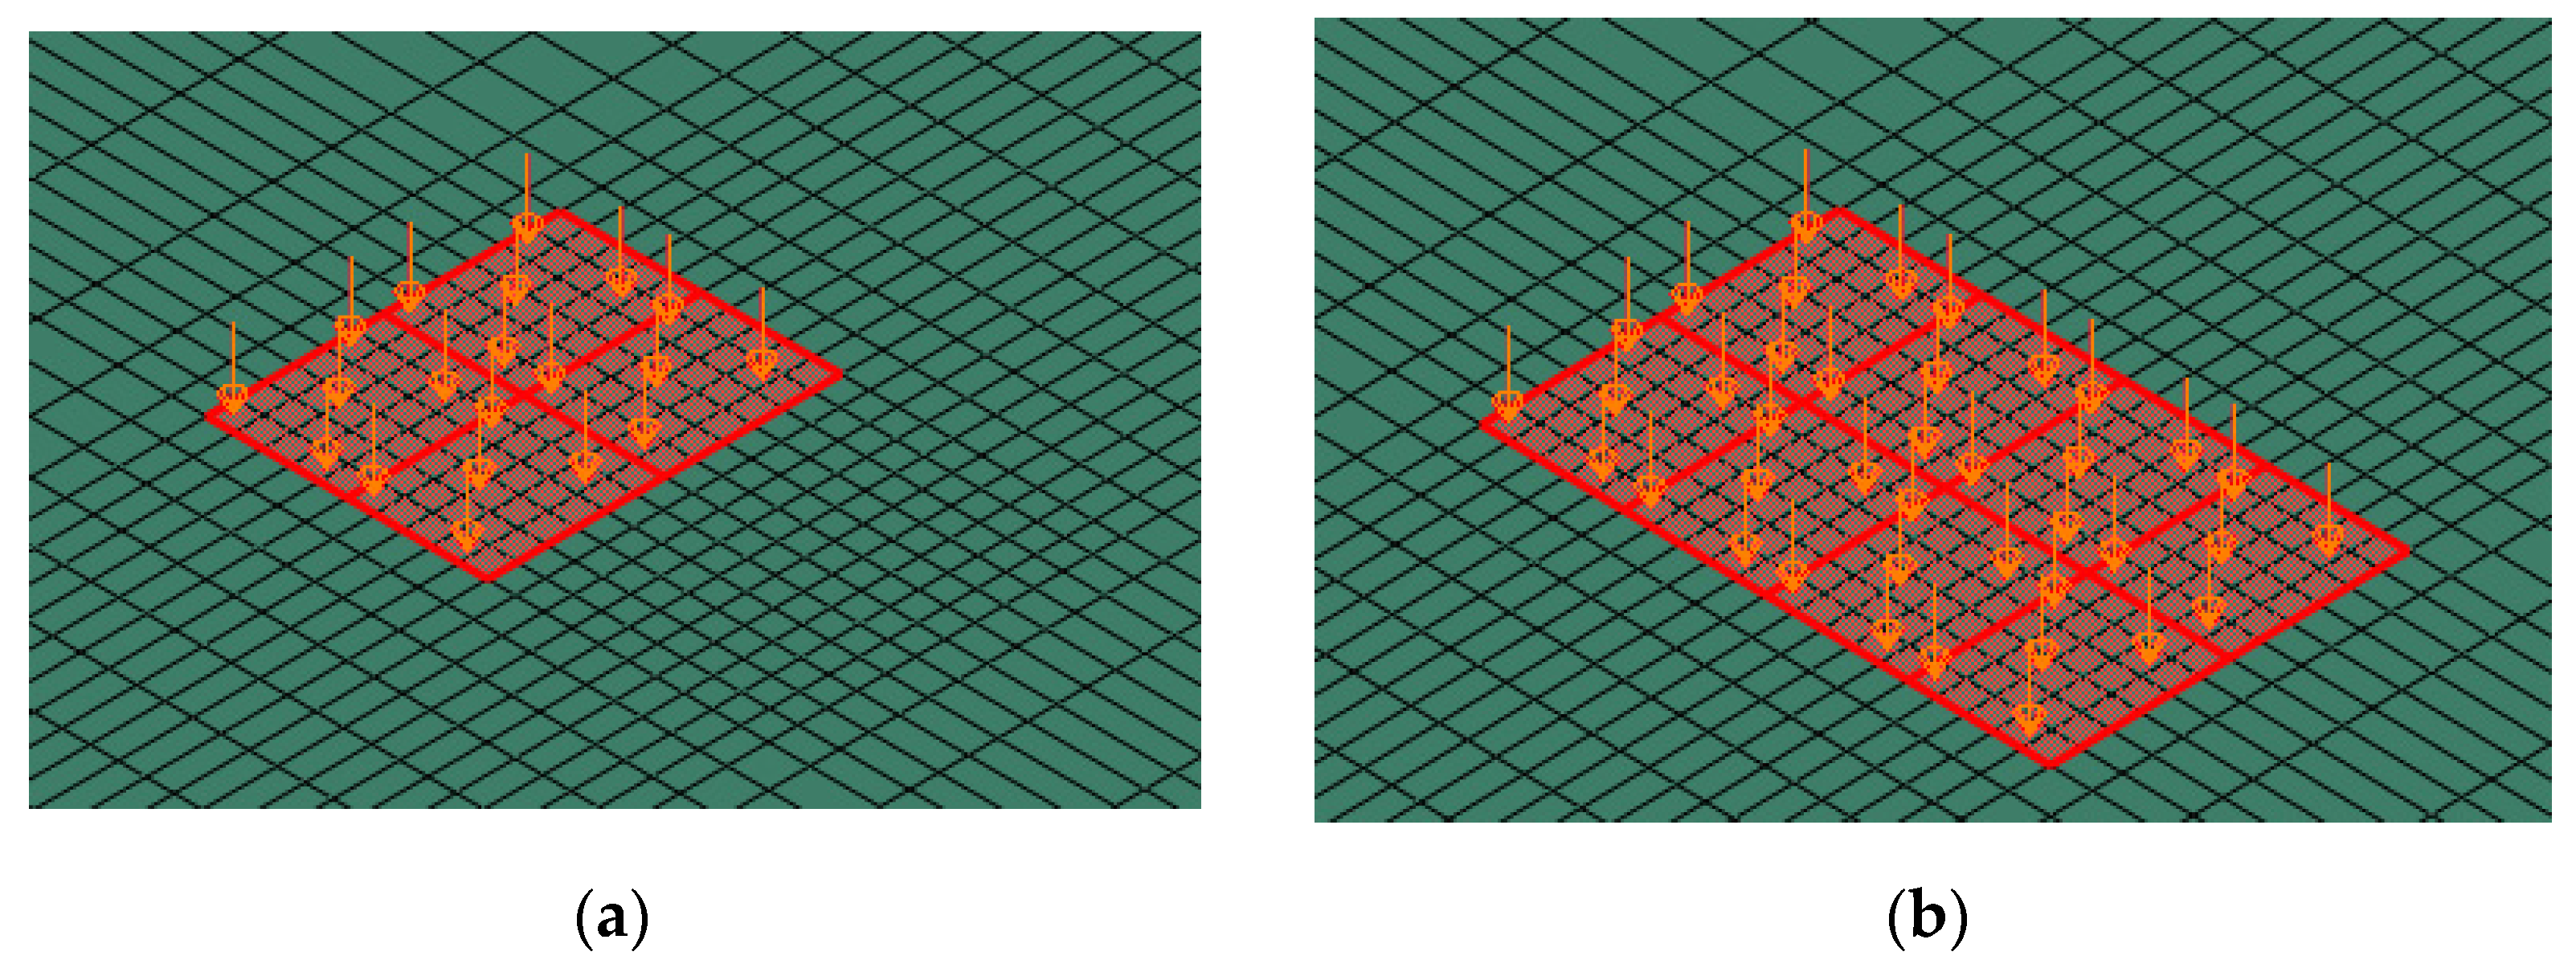
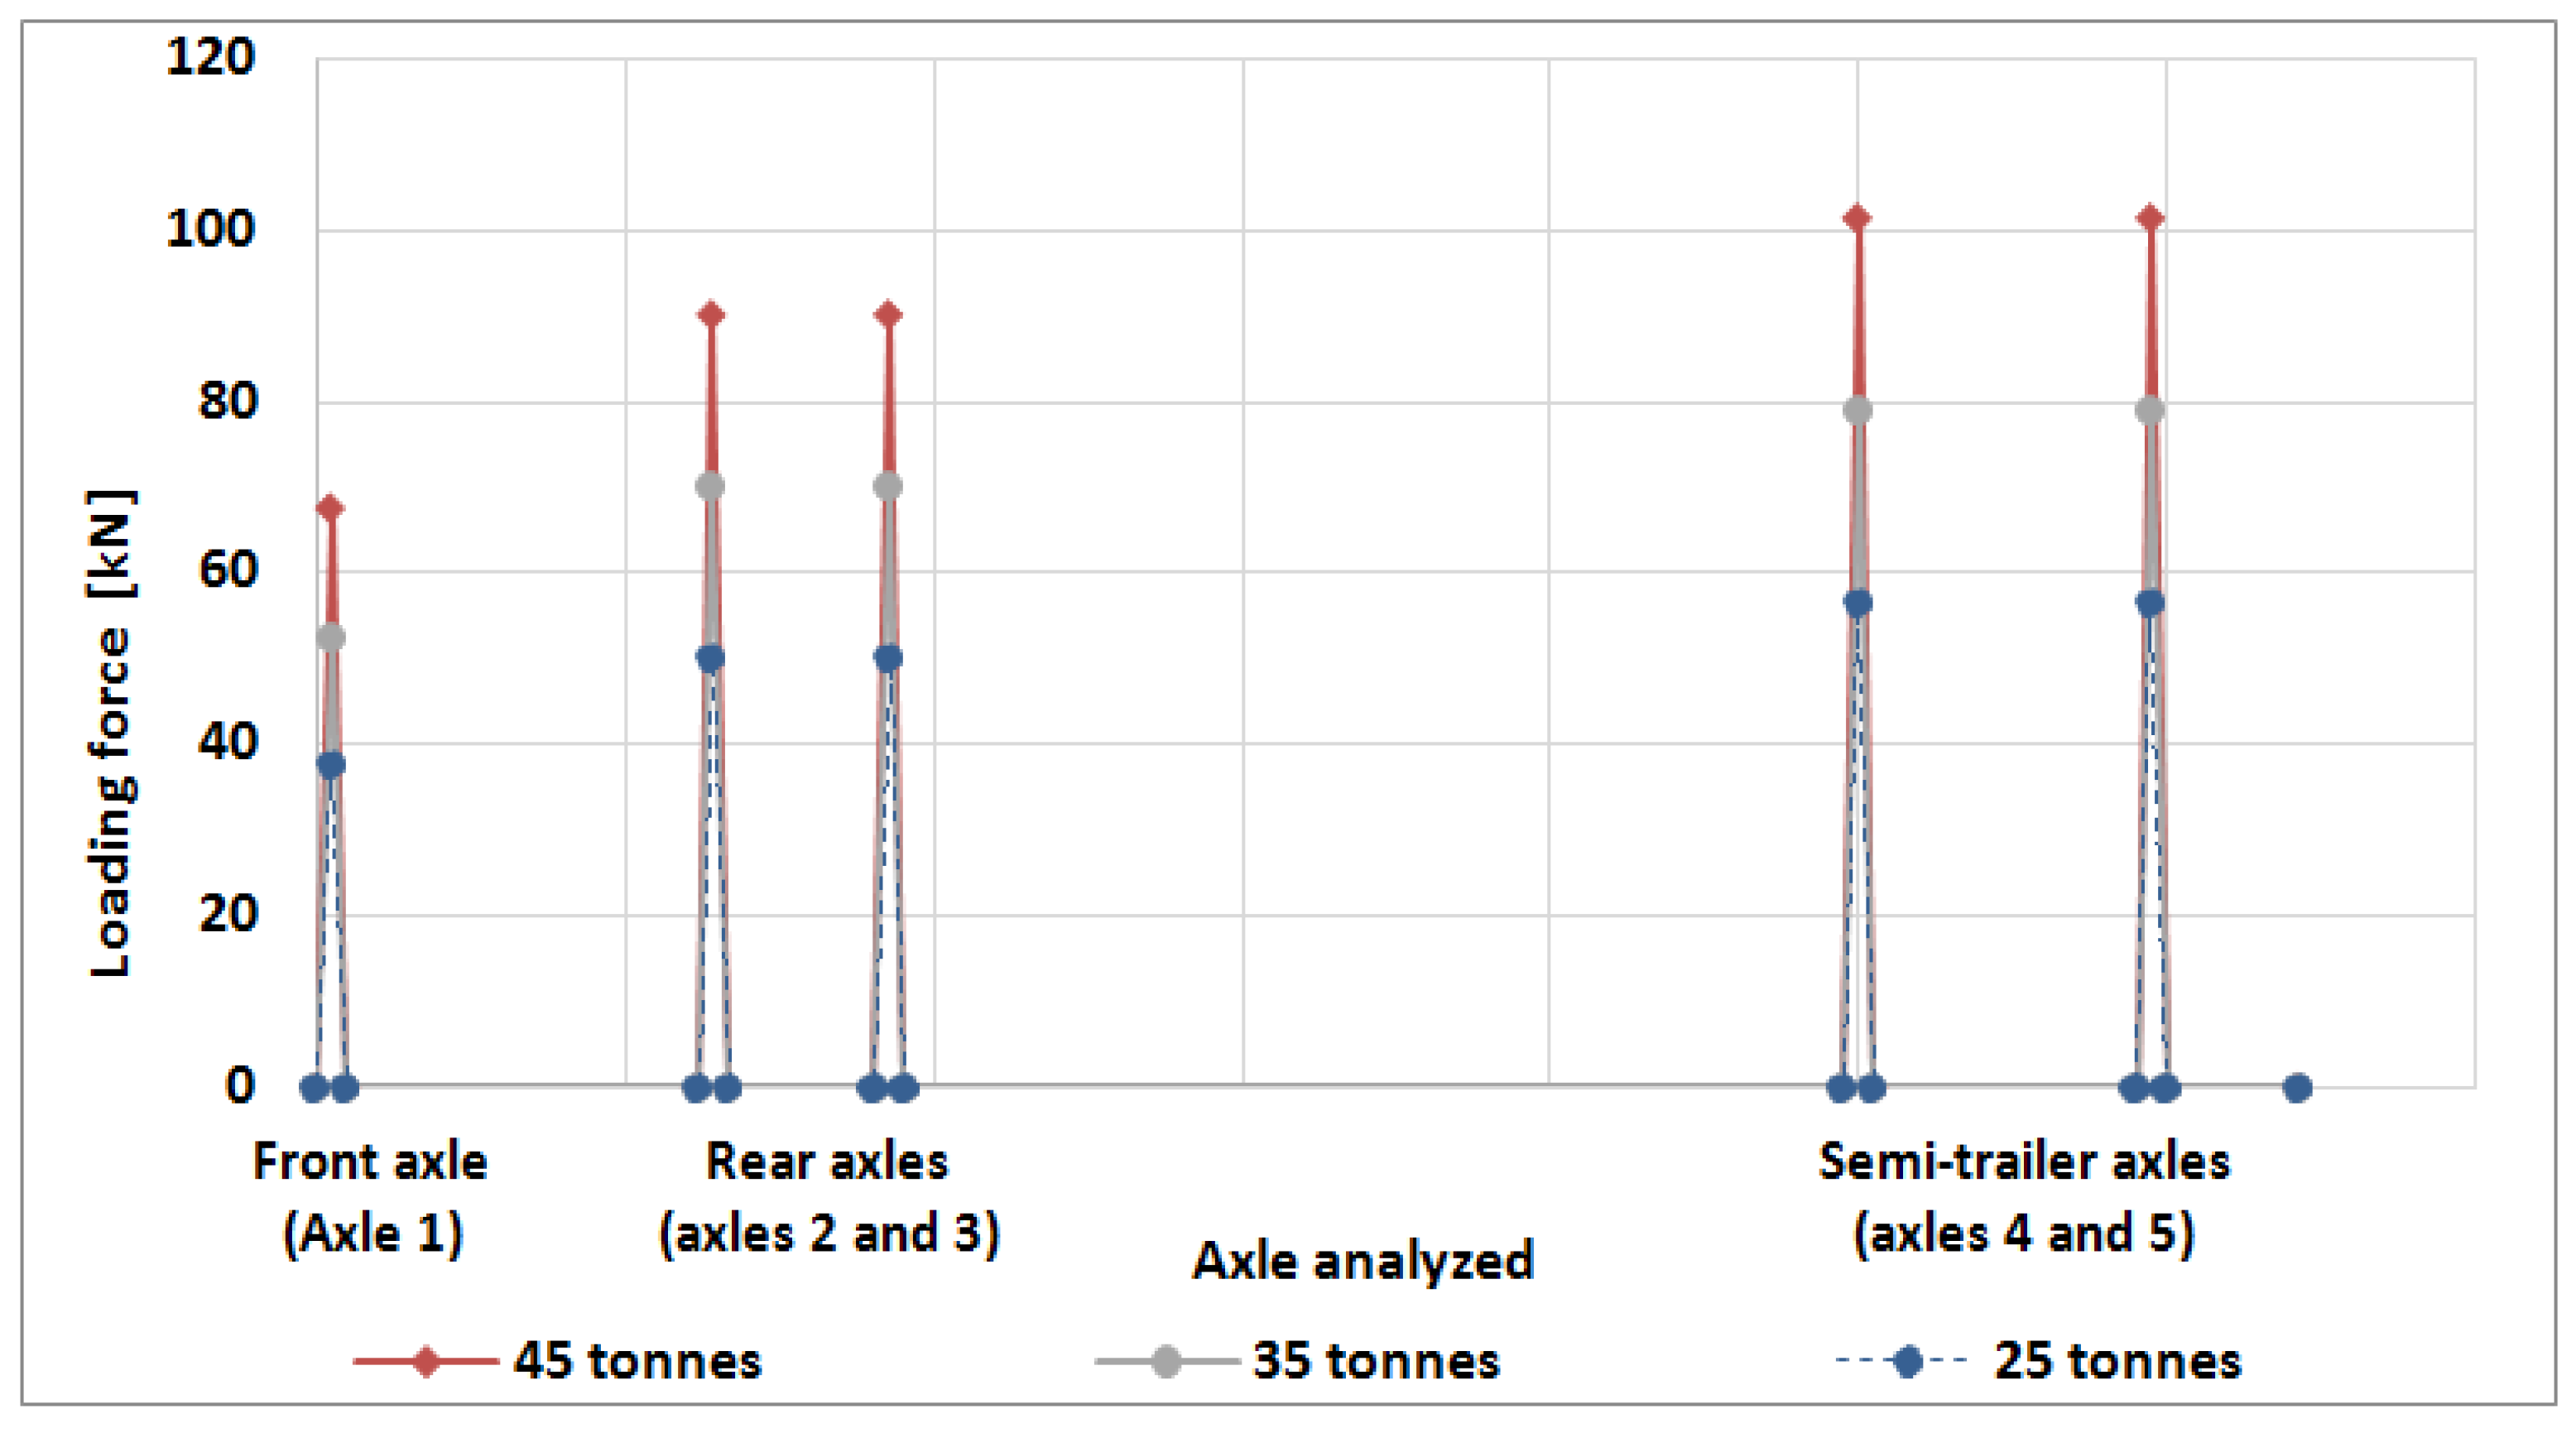
2.3. The Vehicle and Loads Characteristics
- The maximum deformation of the surfacing layer after the passage of each wheel;
- The displacement into the depth of the entire road system after passing the vehicle;
- The residual deformation after the passage of the vehicle.
3. Results
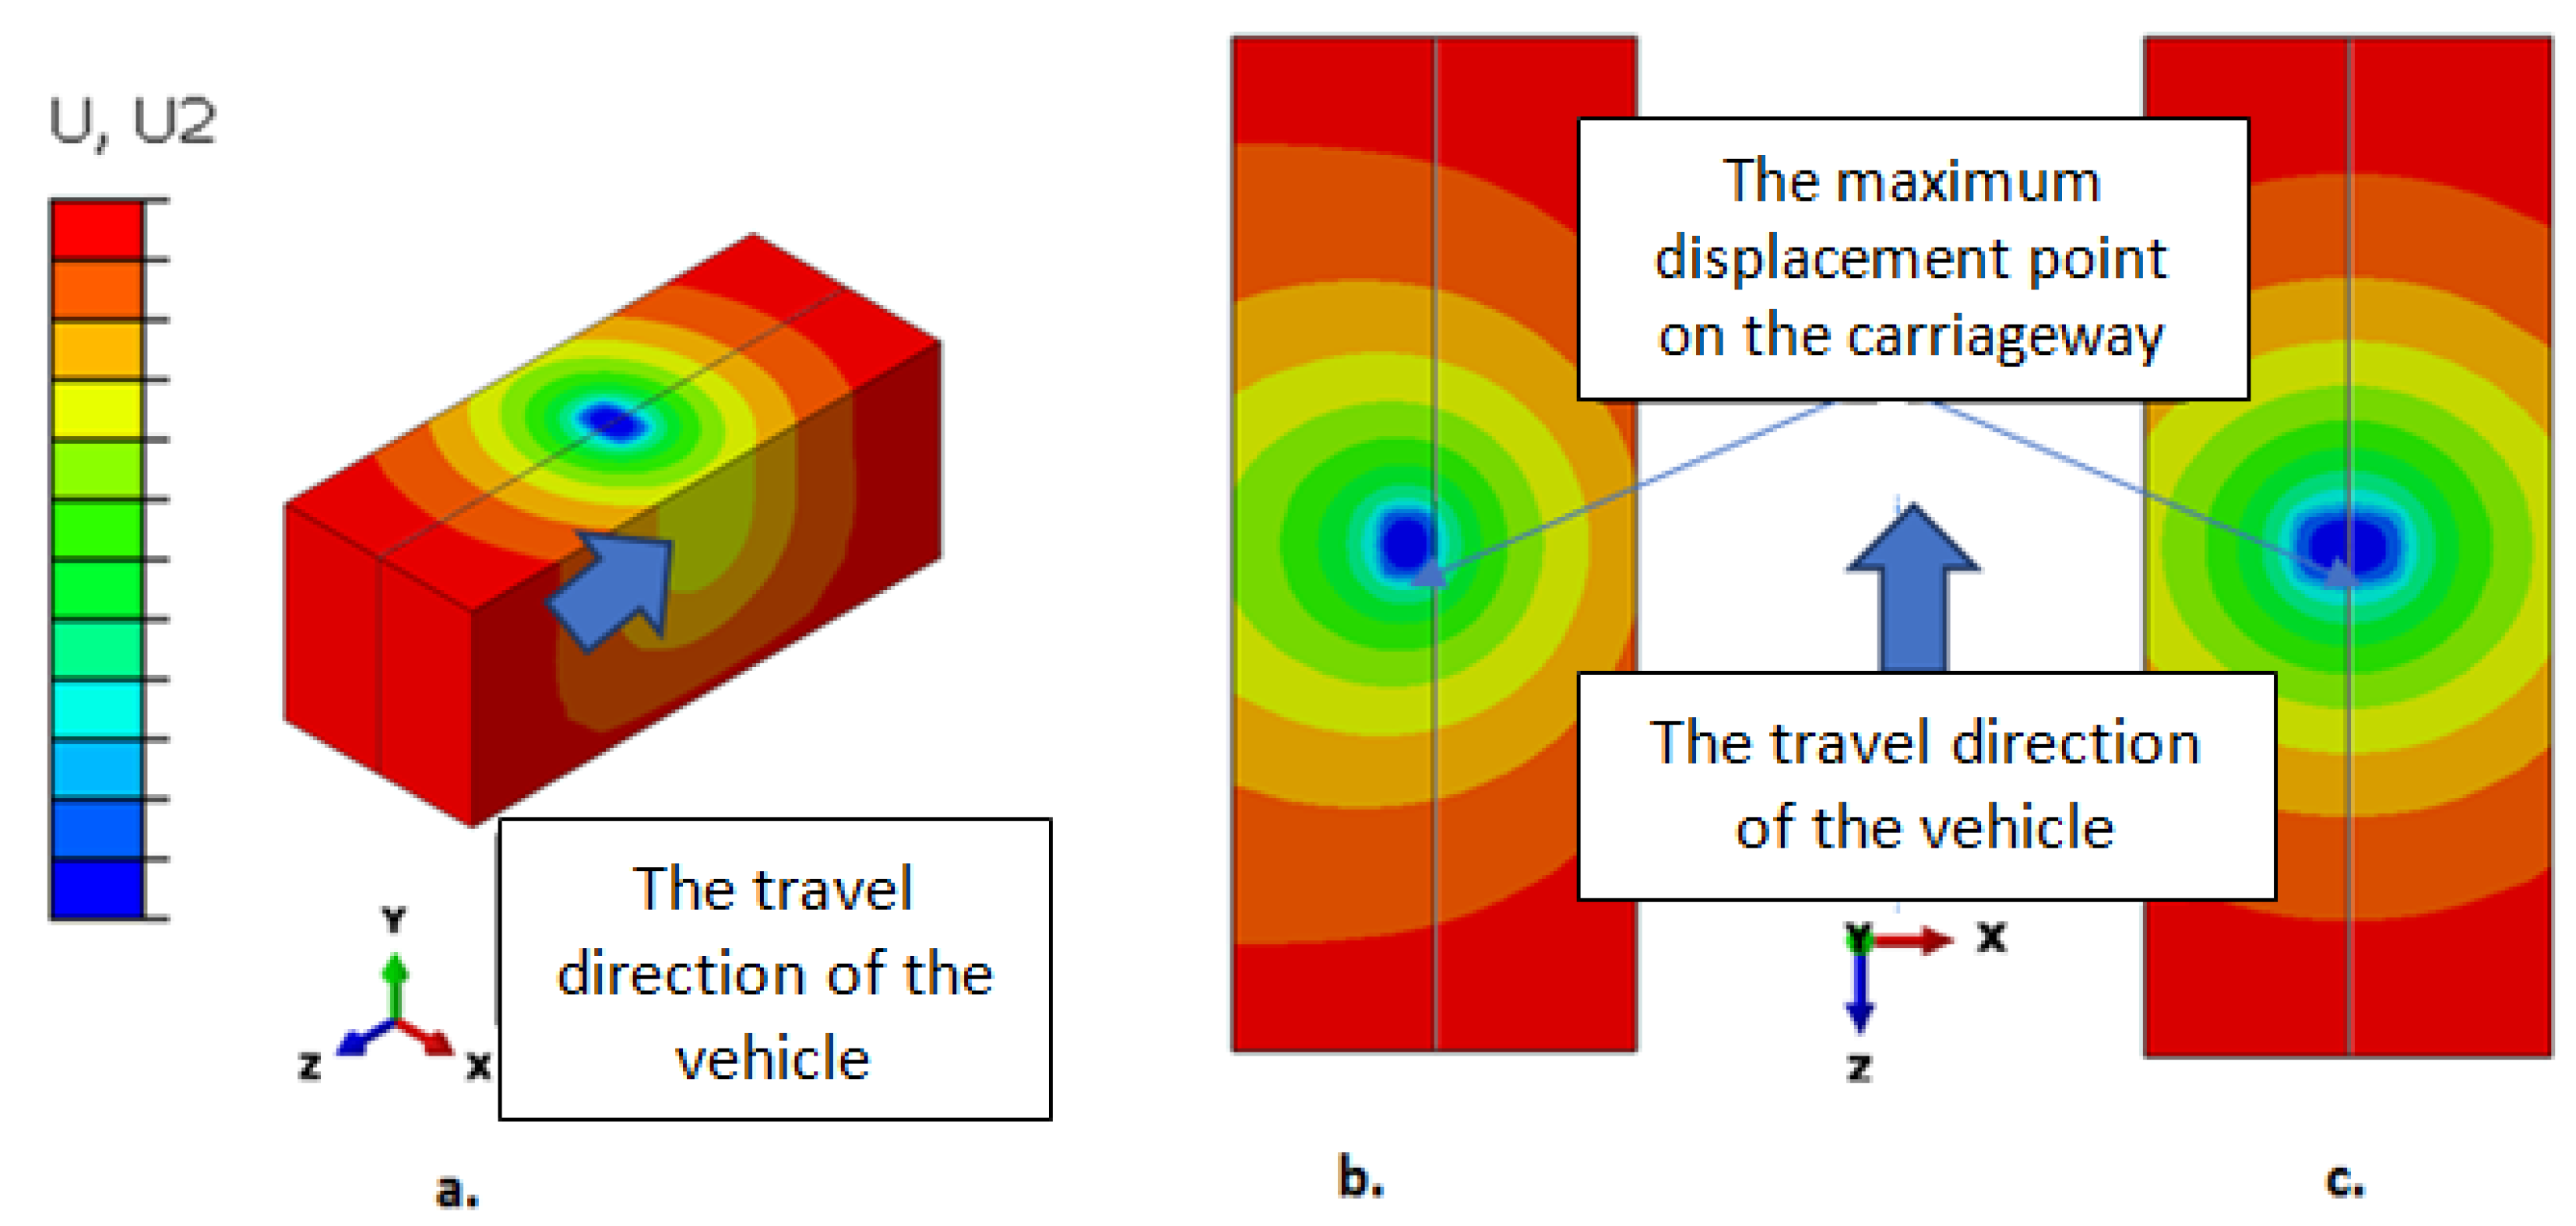
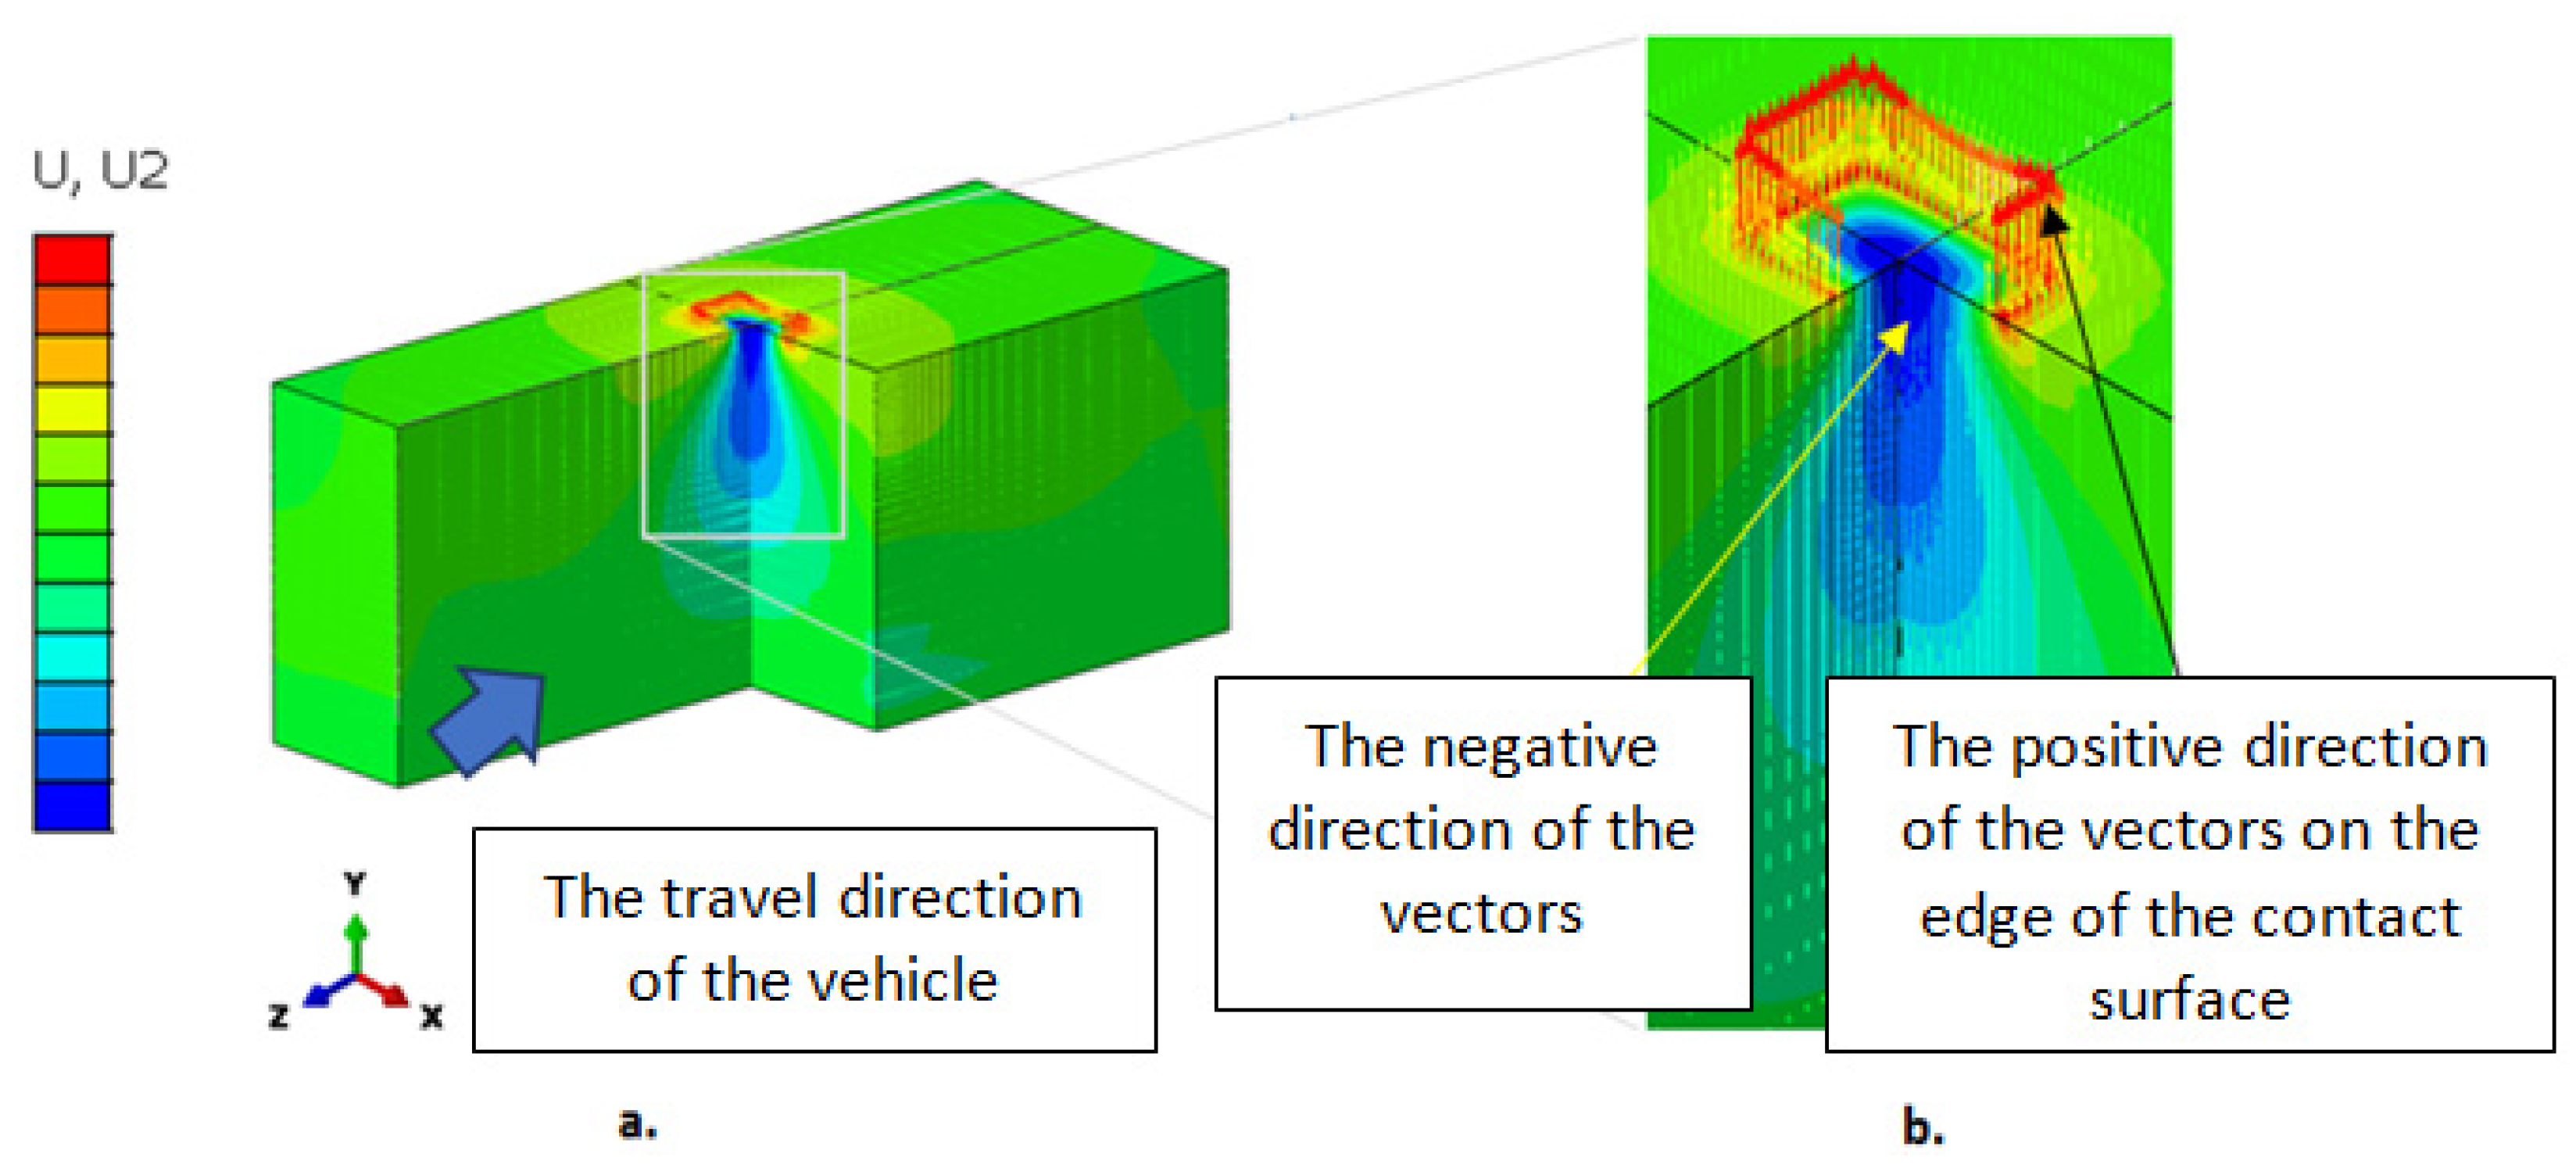
3.1. Residual Deformation Distribution and Vector Distribution of Residual Deformations
3.2. Numerical Evaluation of Deformations in the Case of Typical Road Structures
3.2.1. The Displacement of Structure’s Layers in Depth
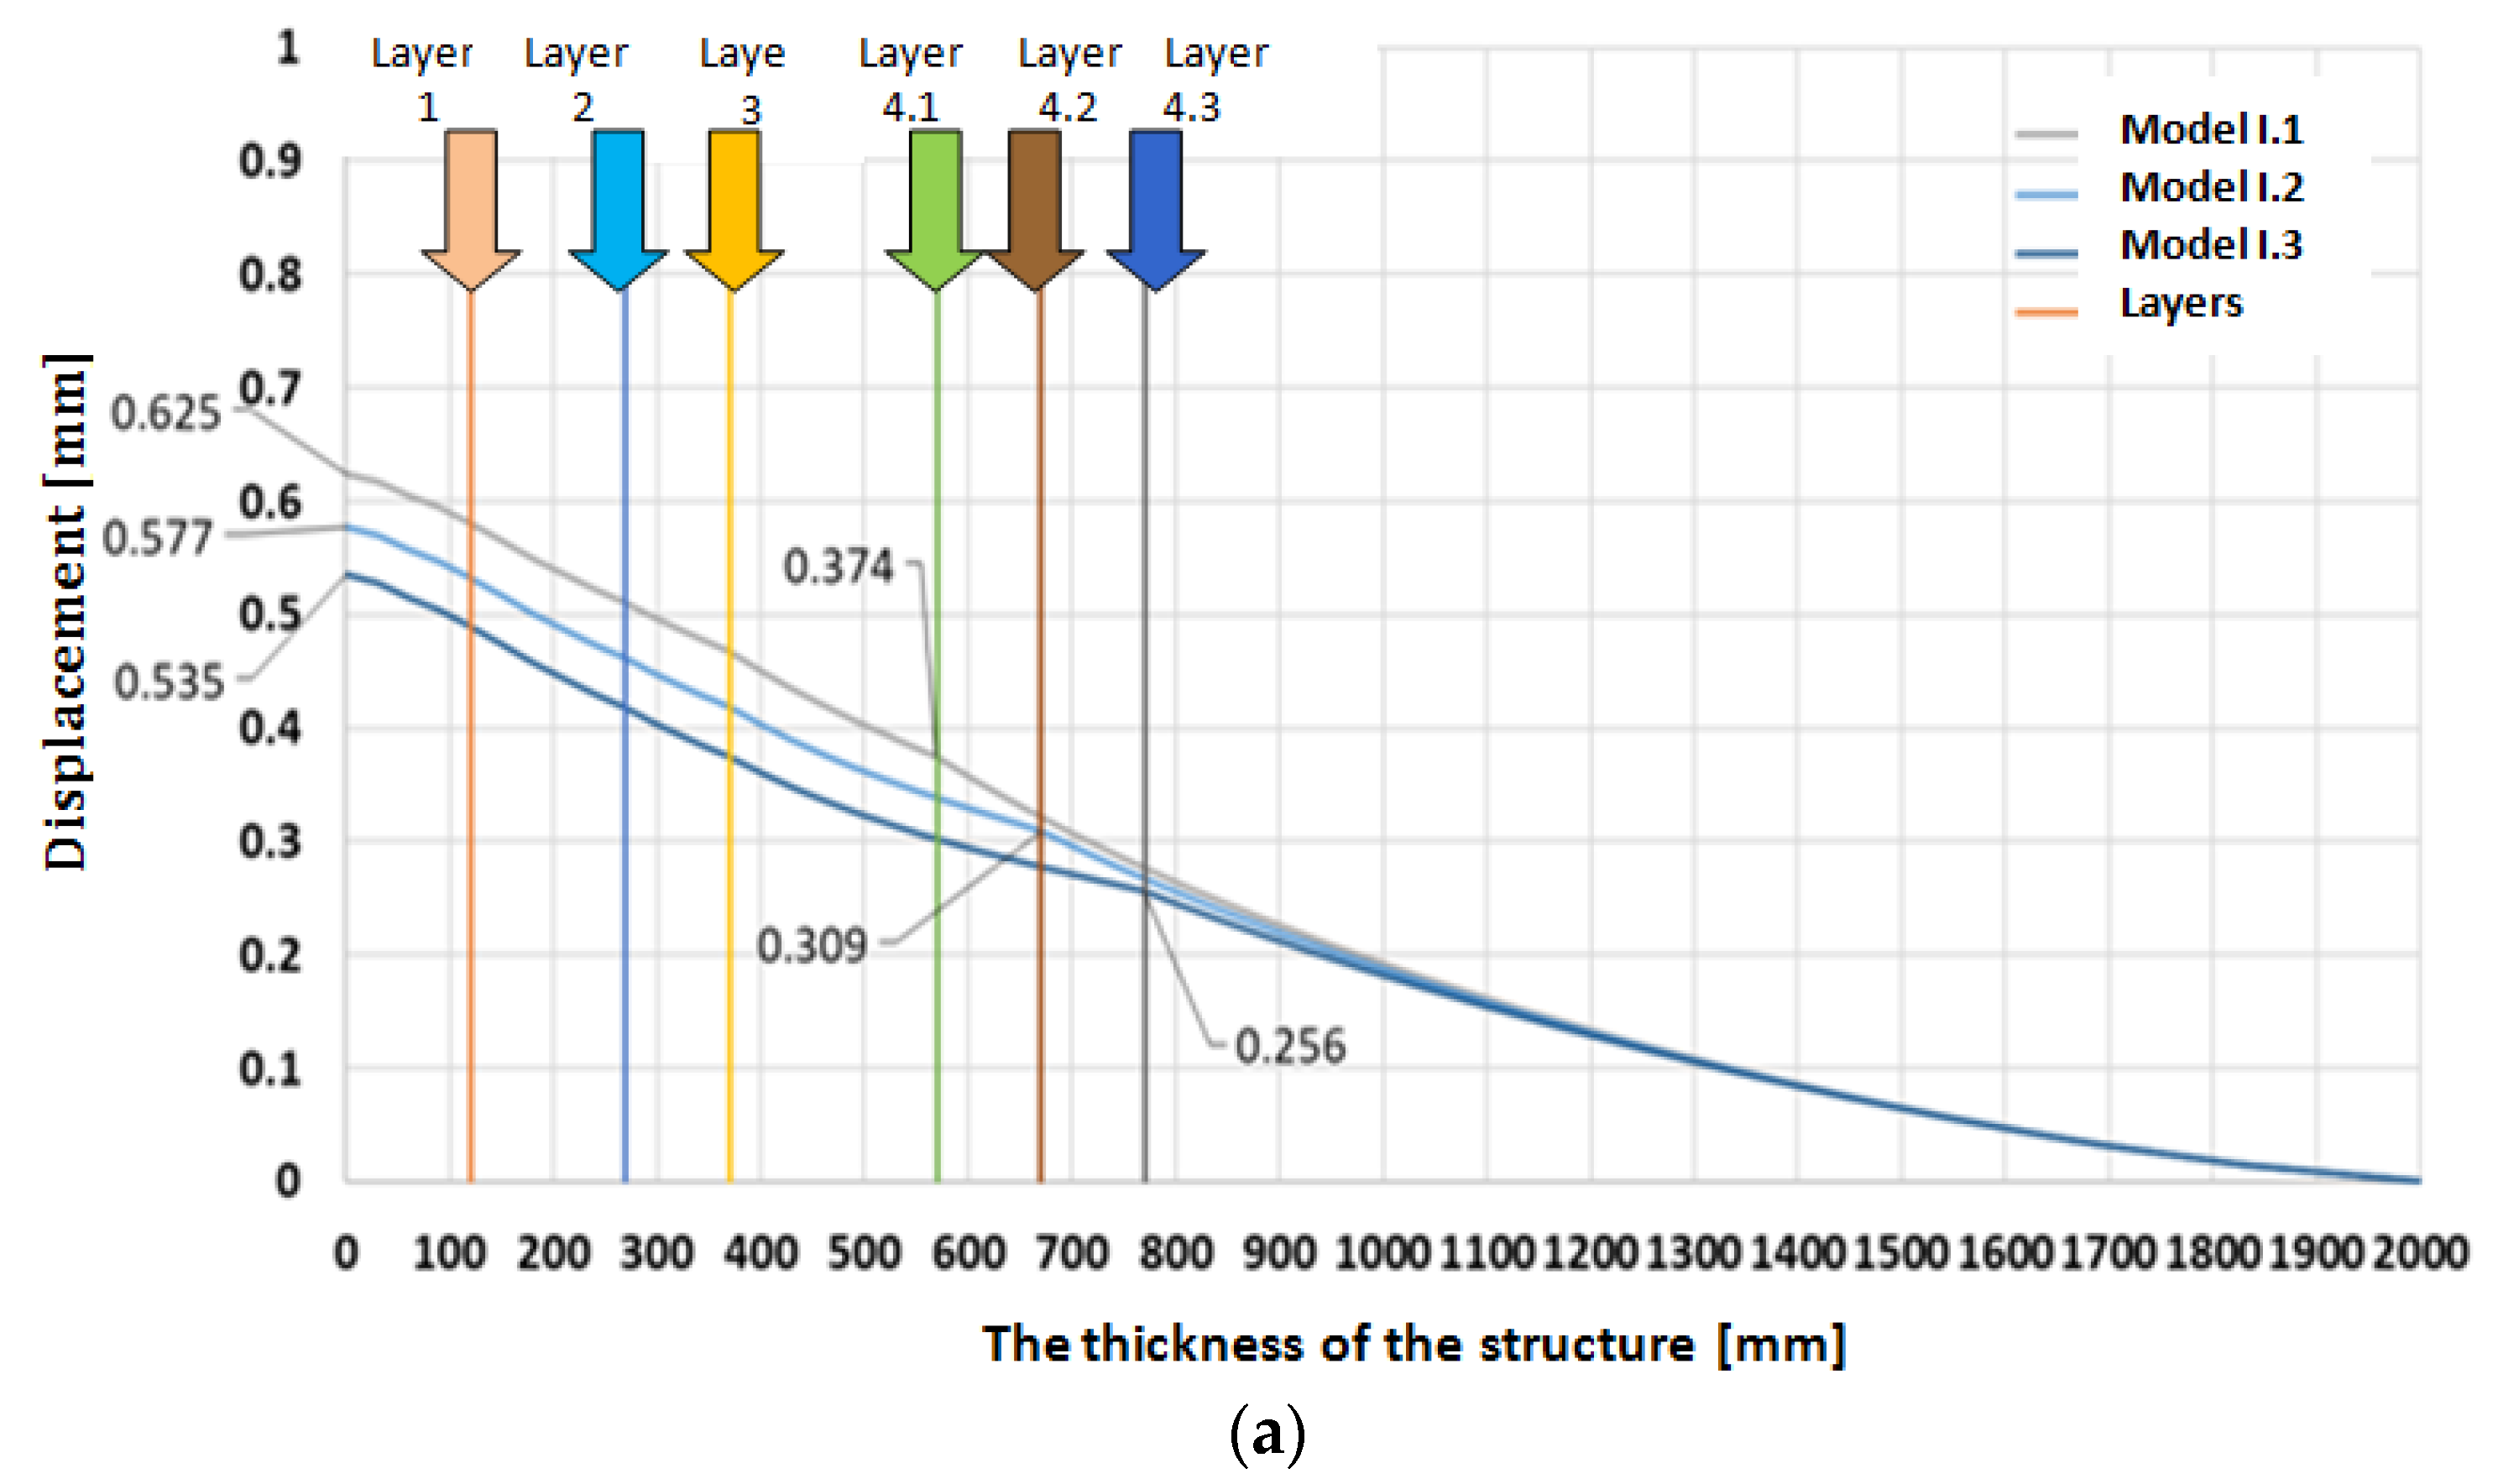
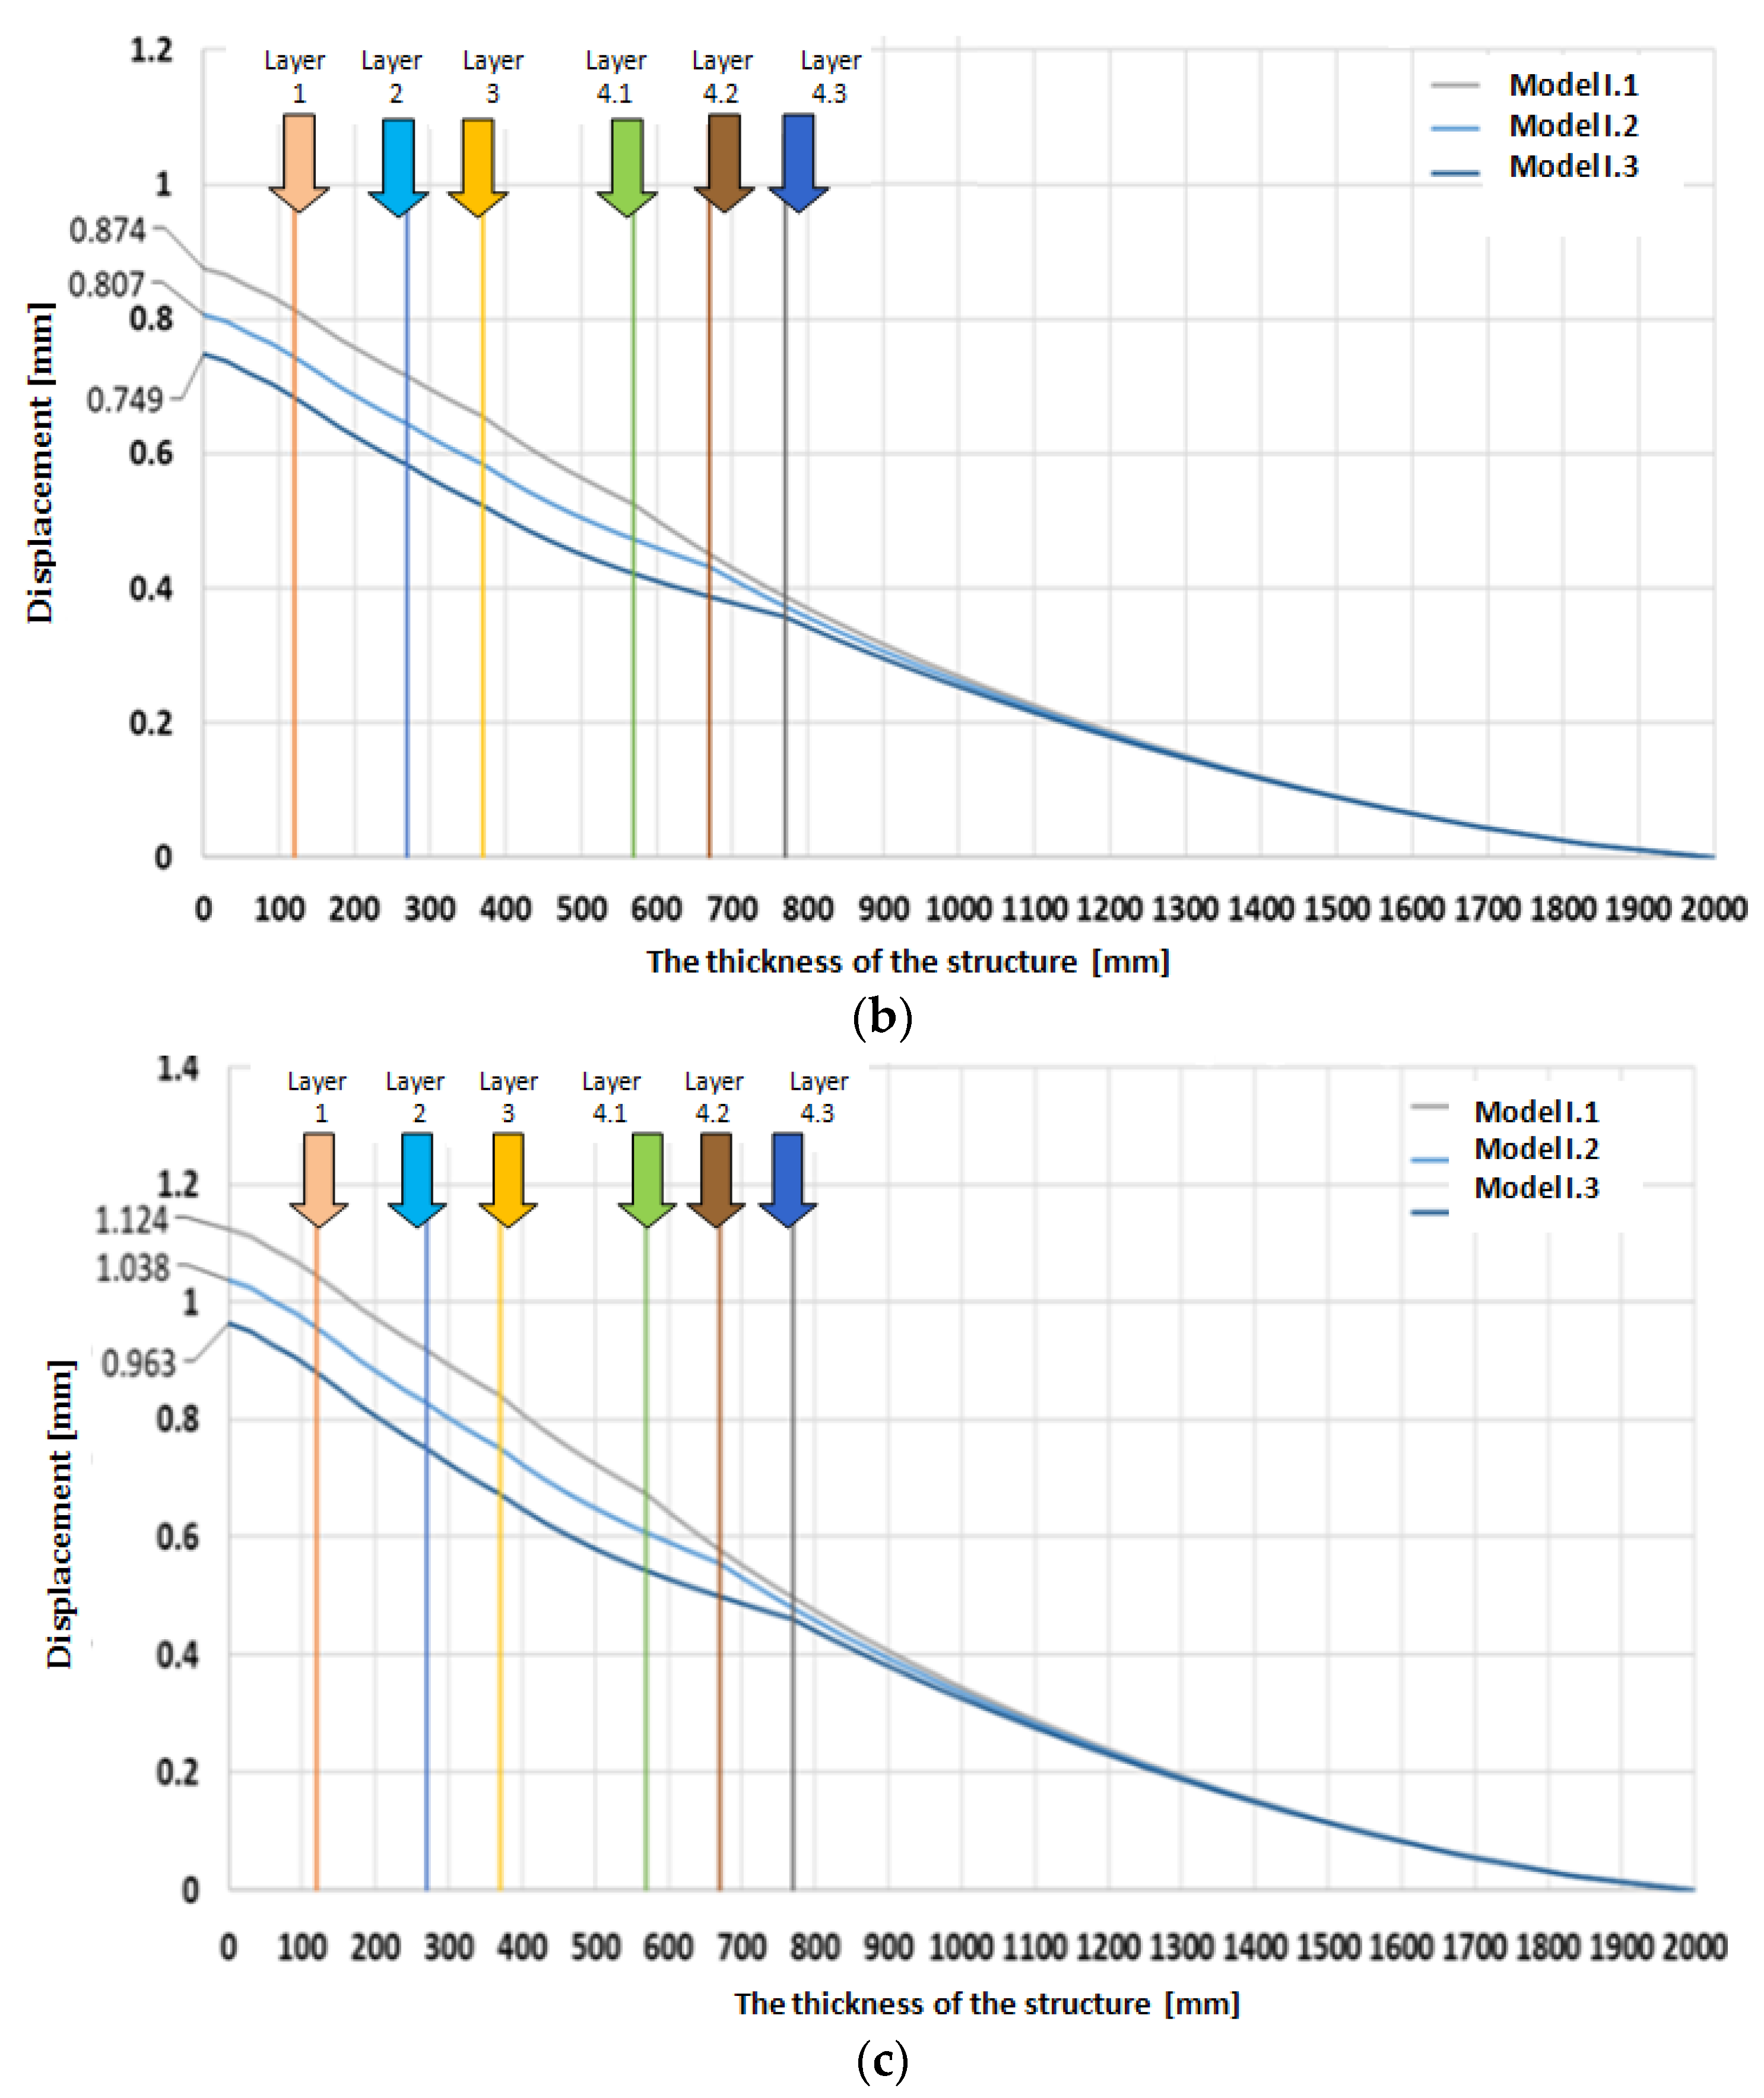
Type I of Road Systems
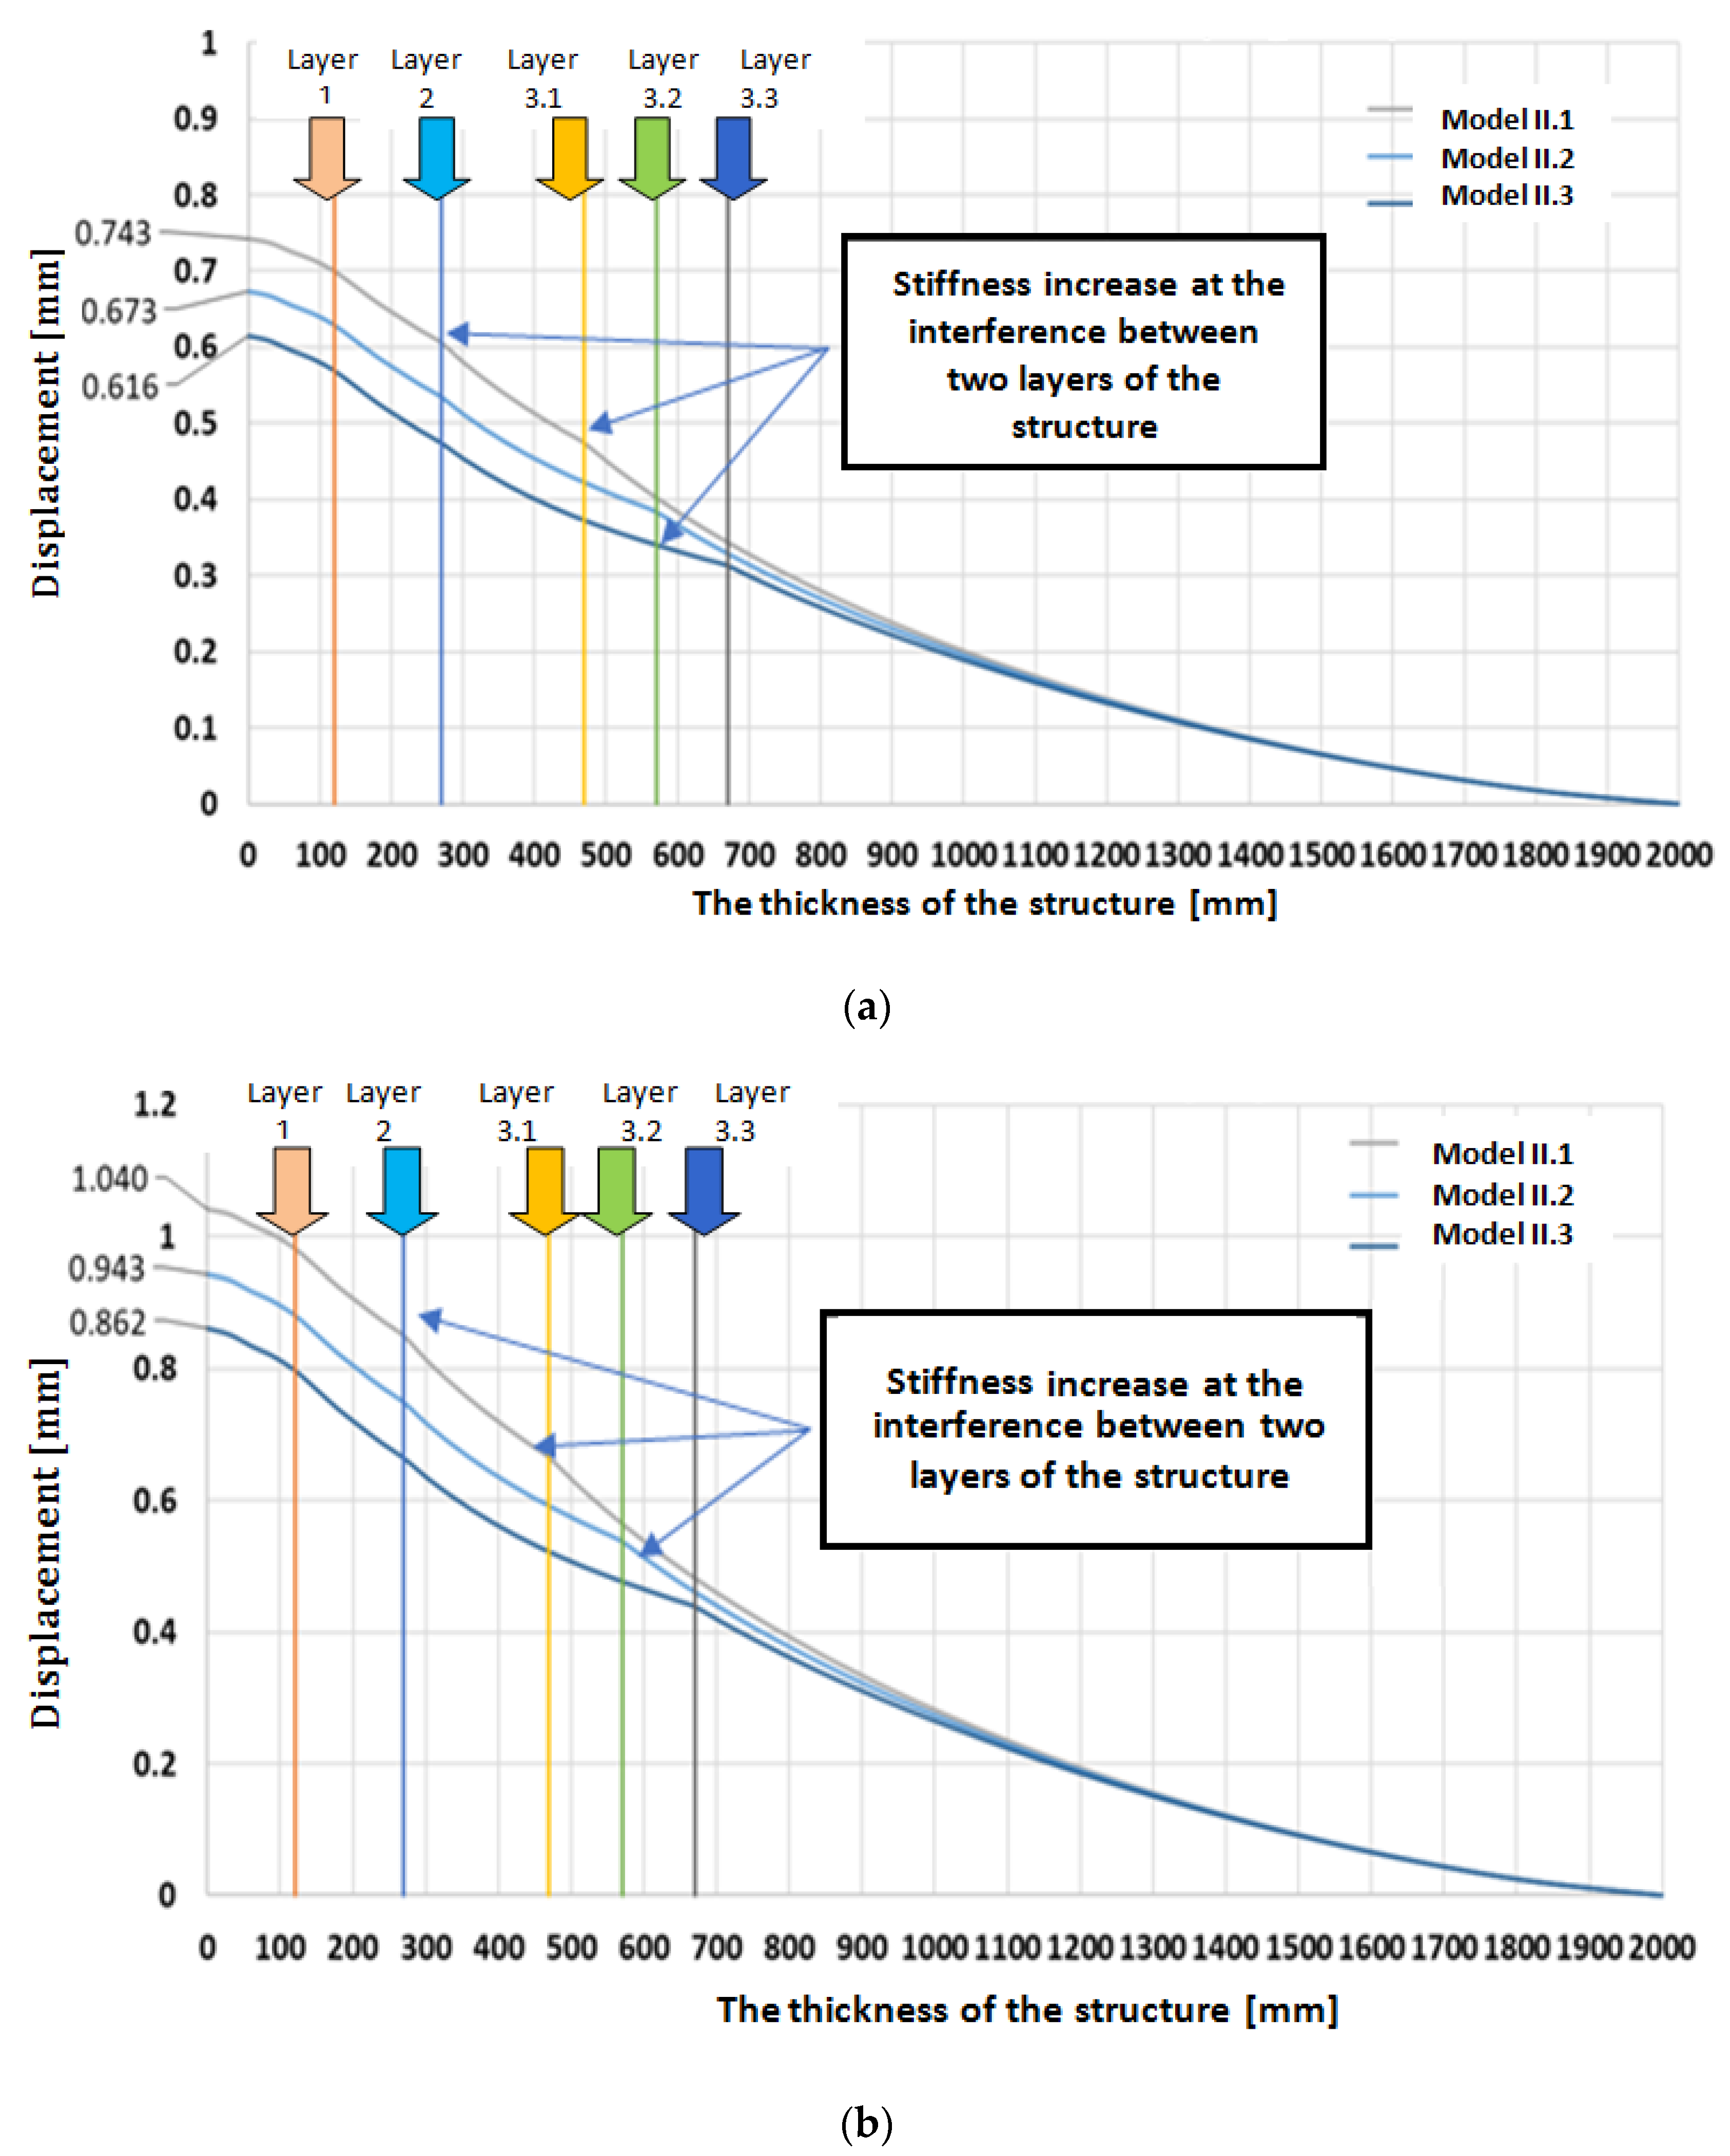
Type II of Road Systems
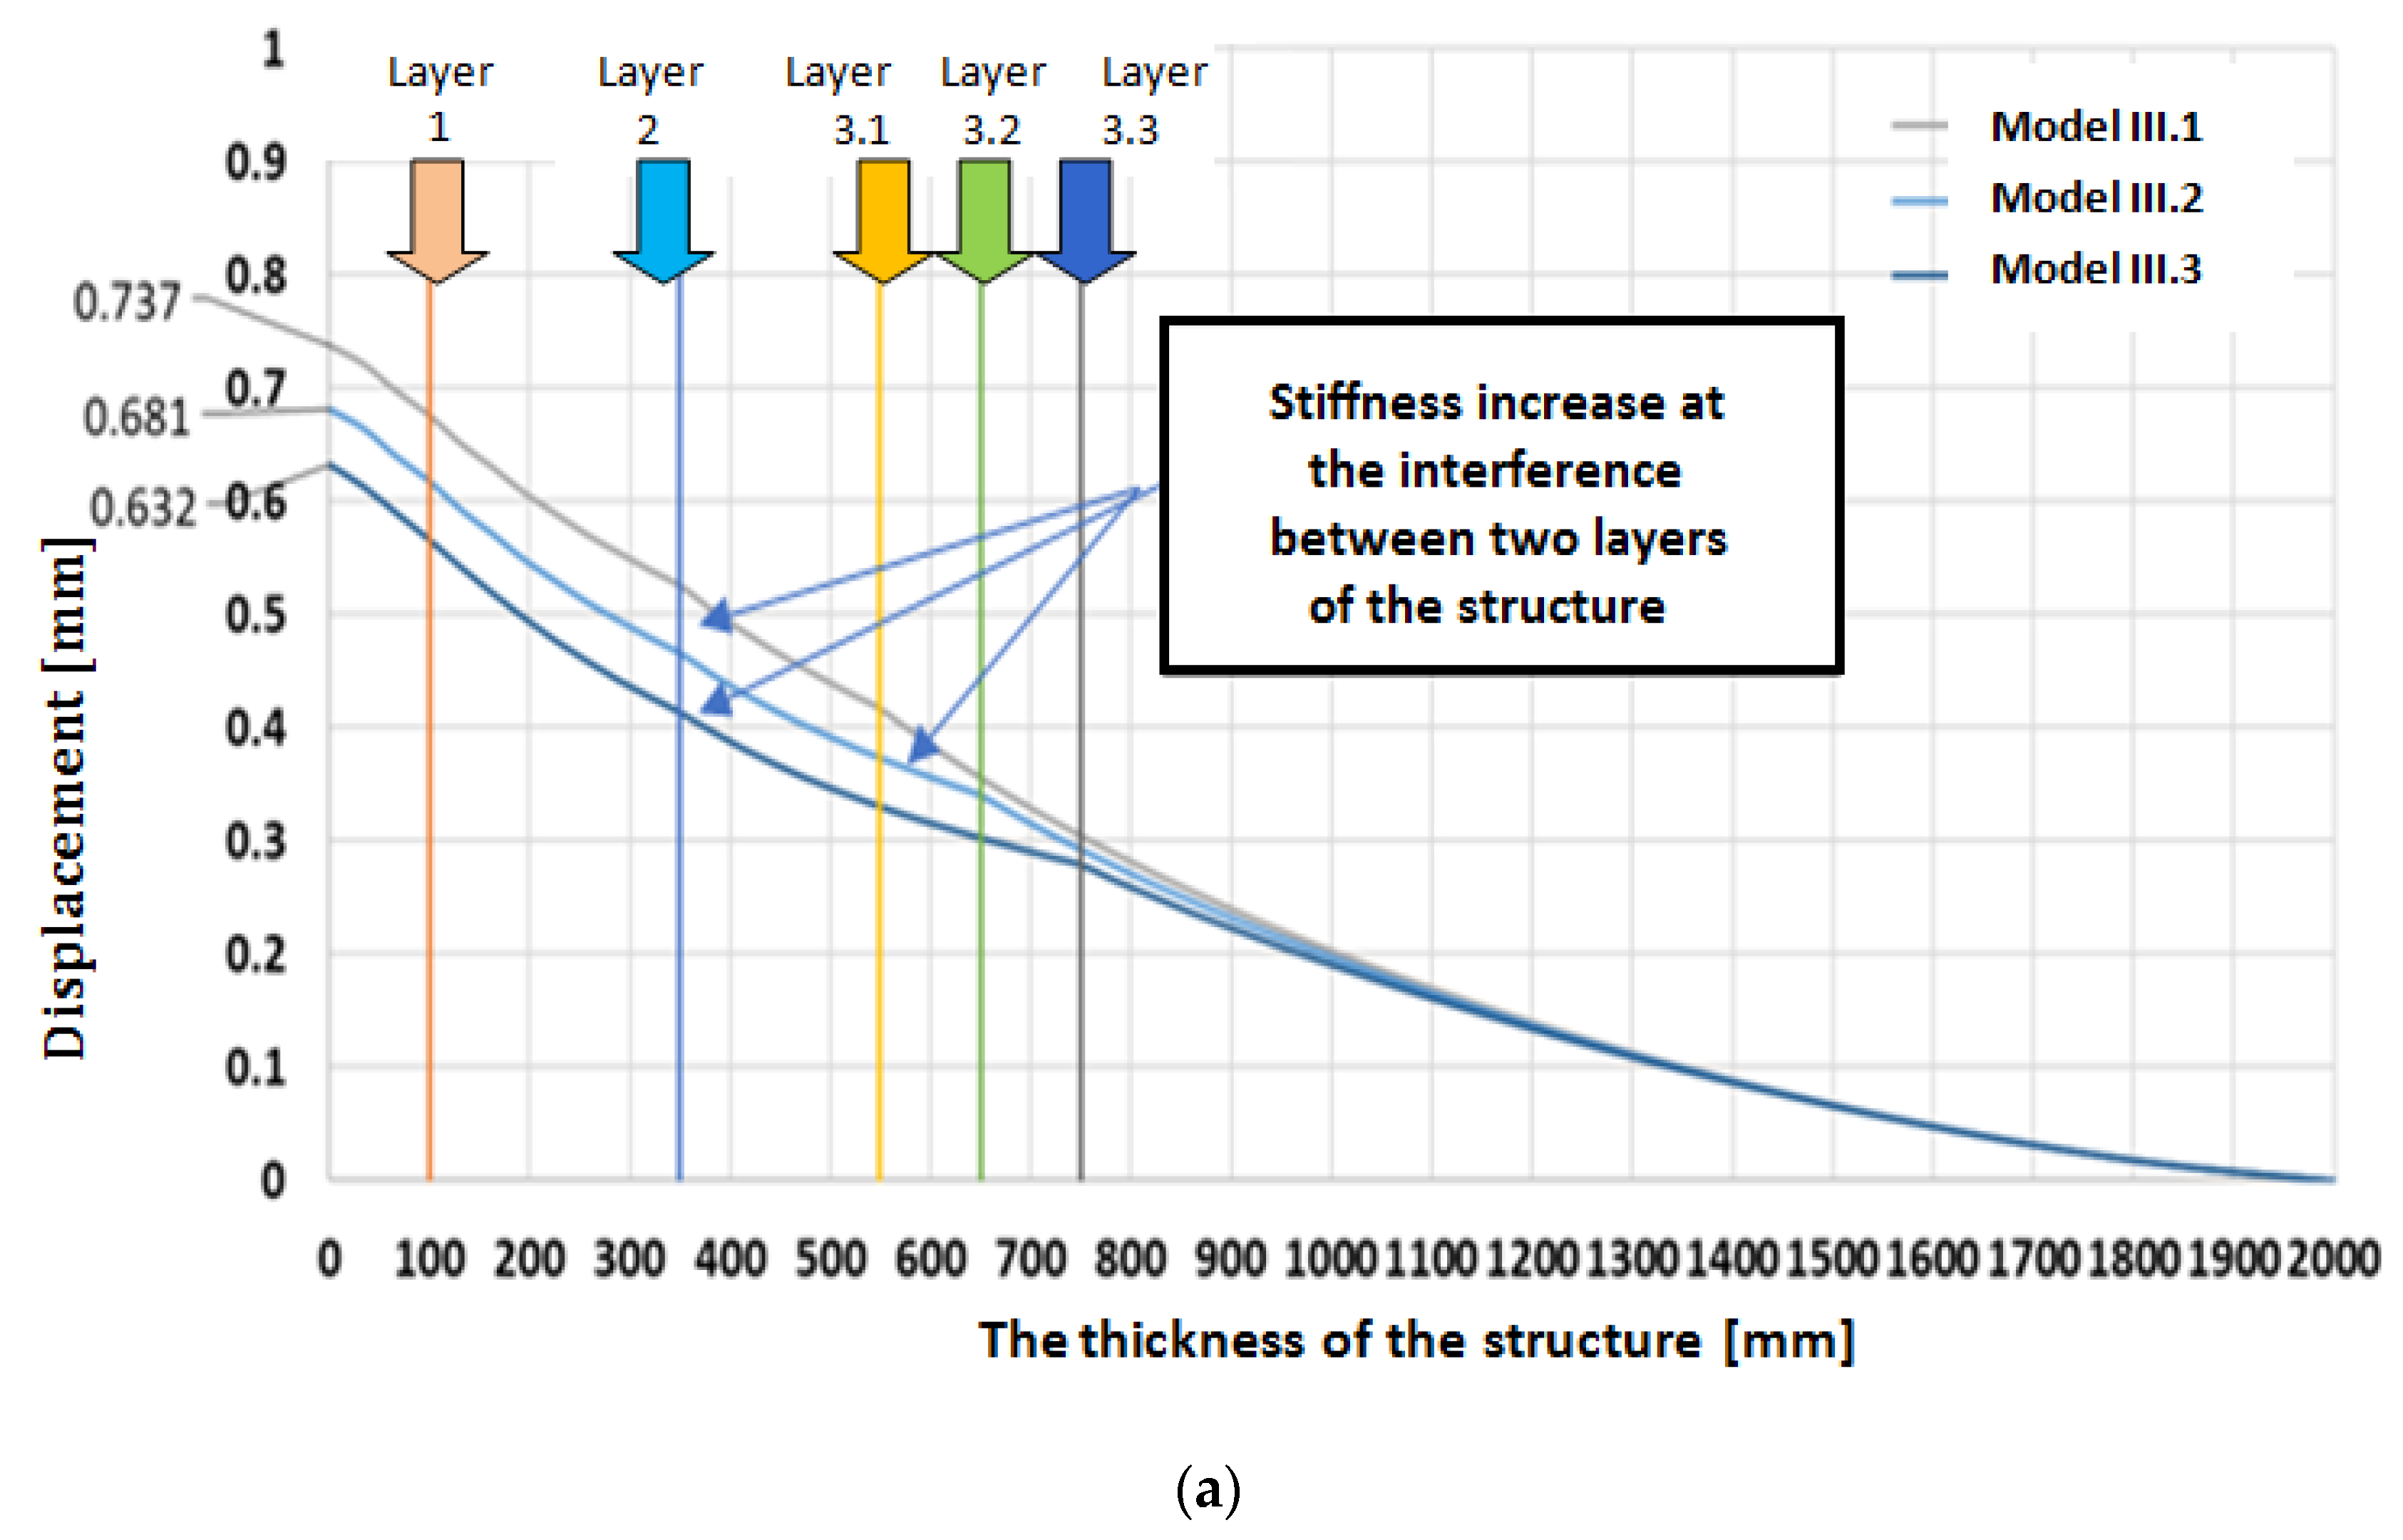
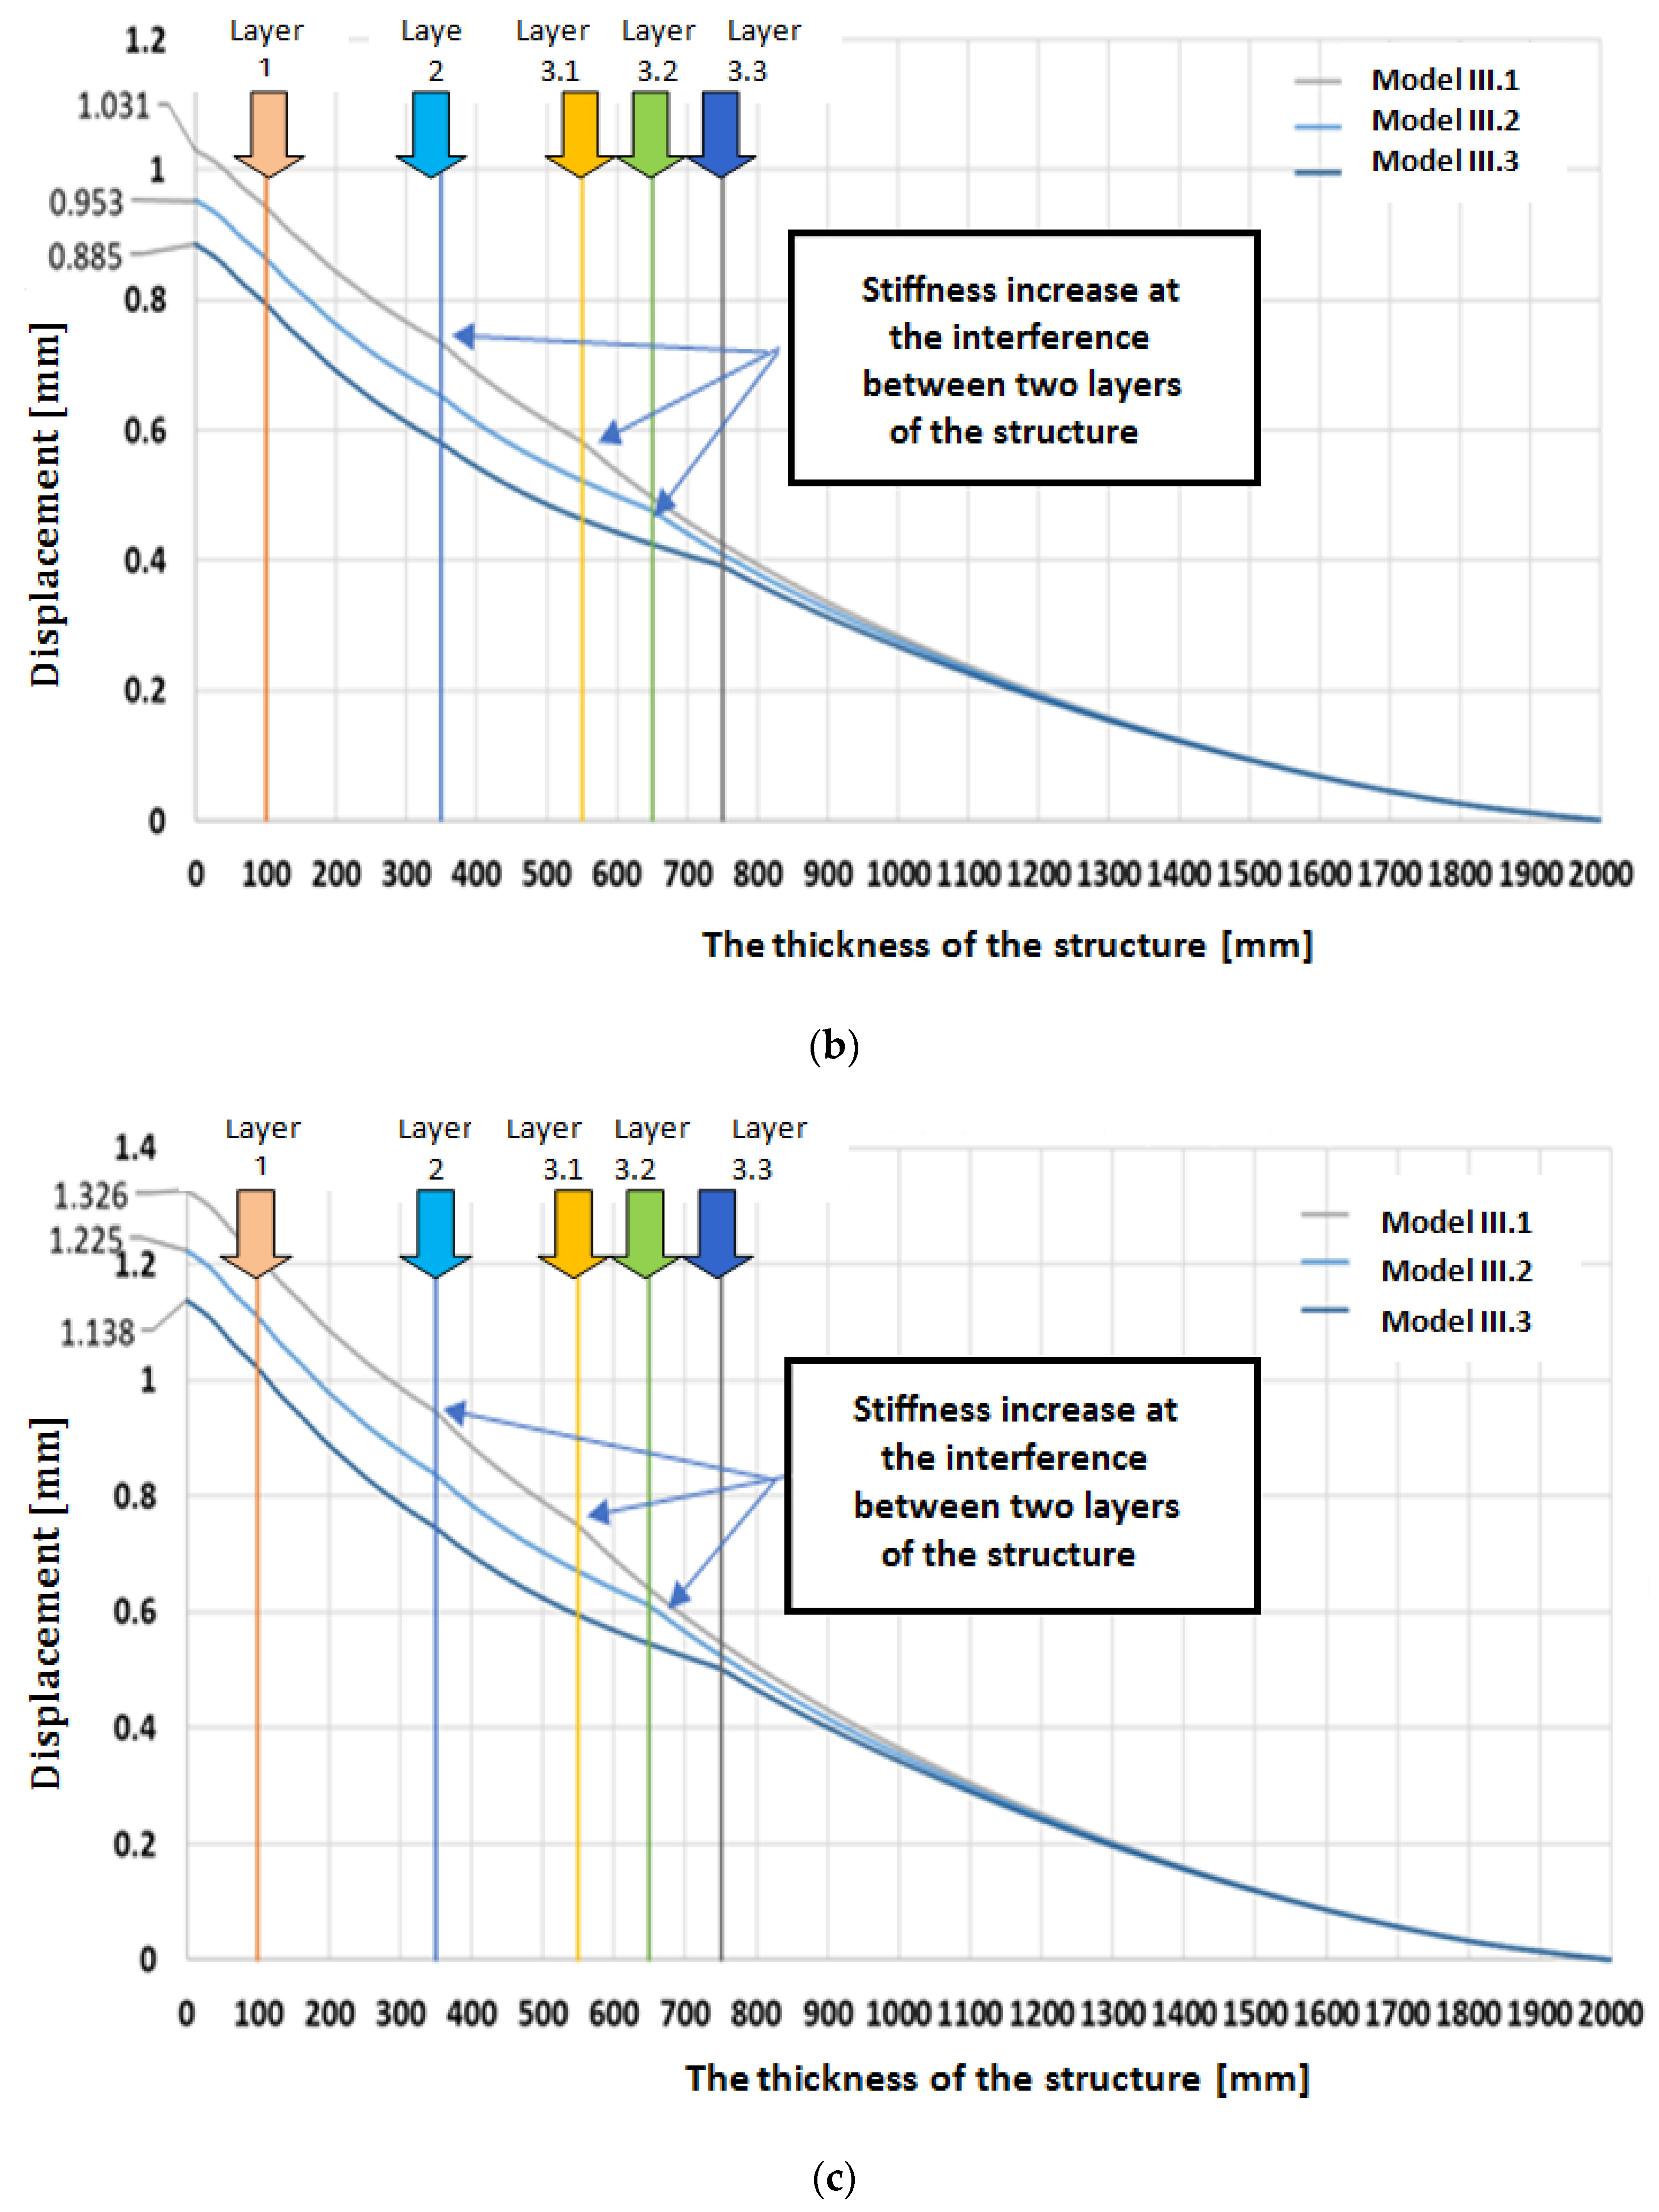
Type III of Road Systems
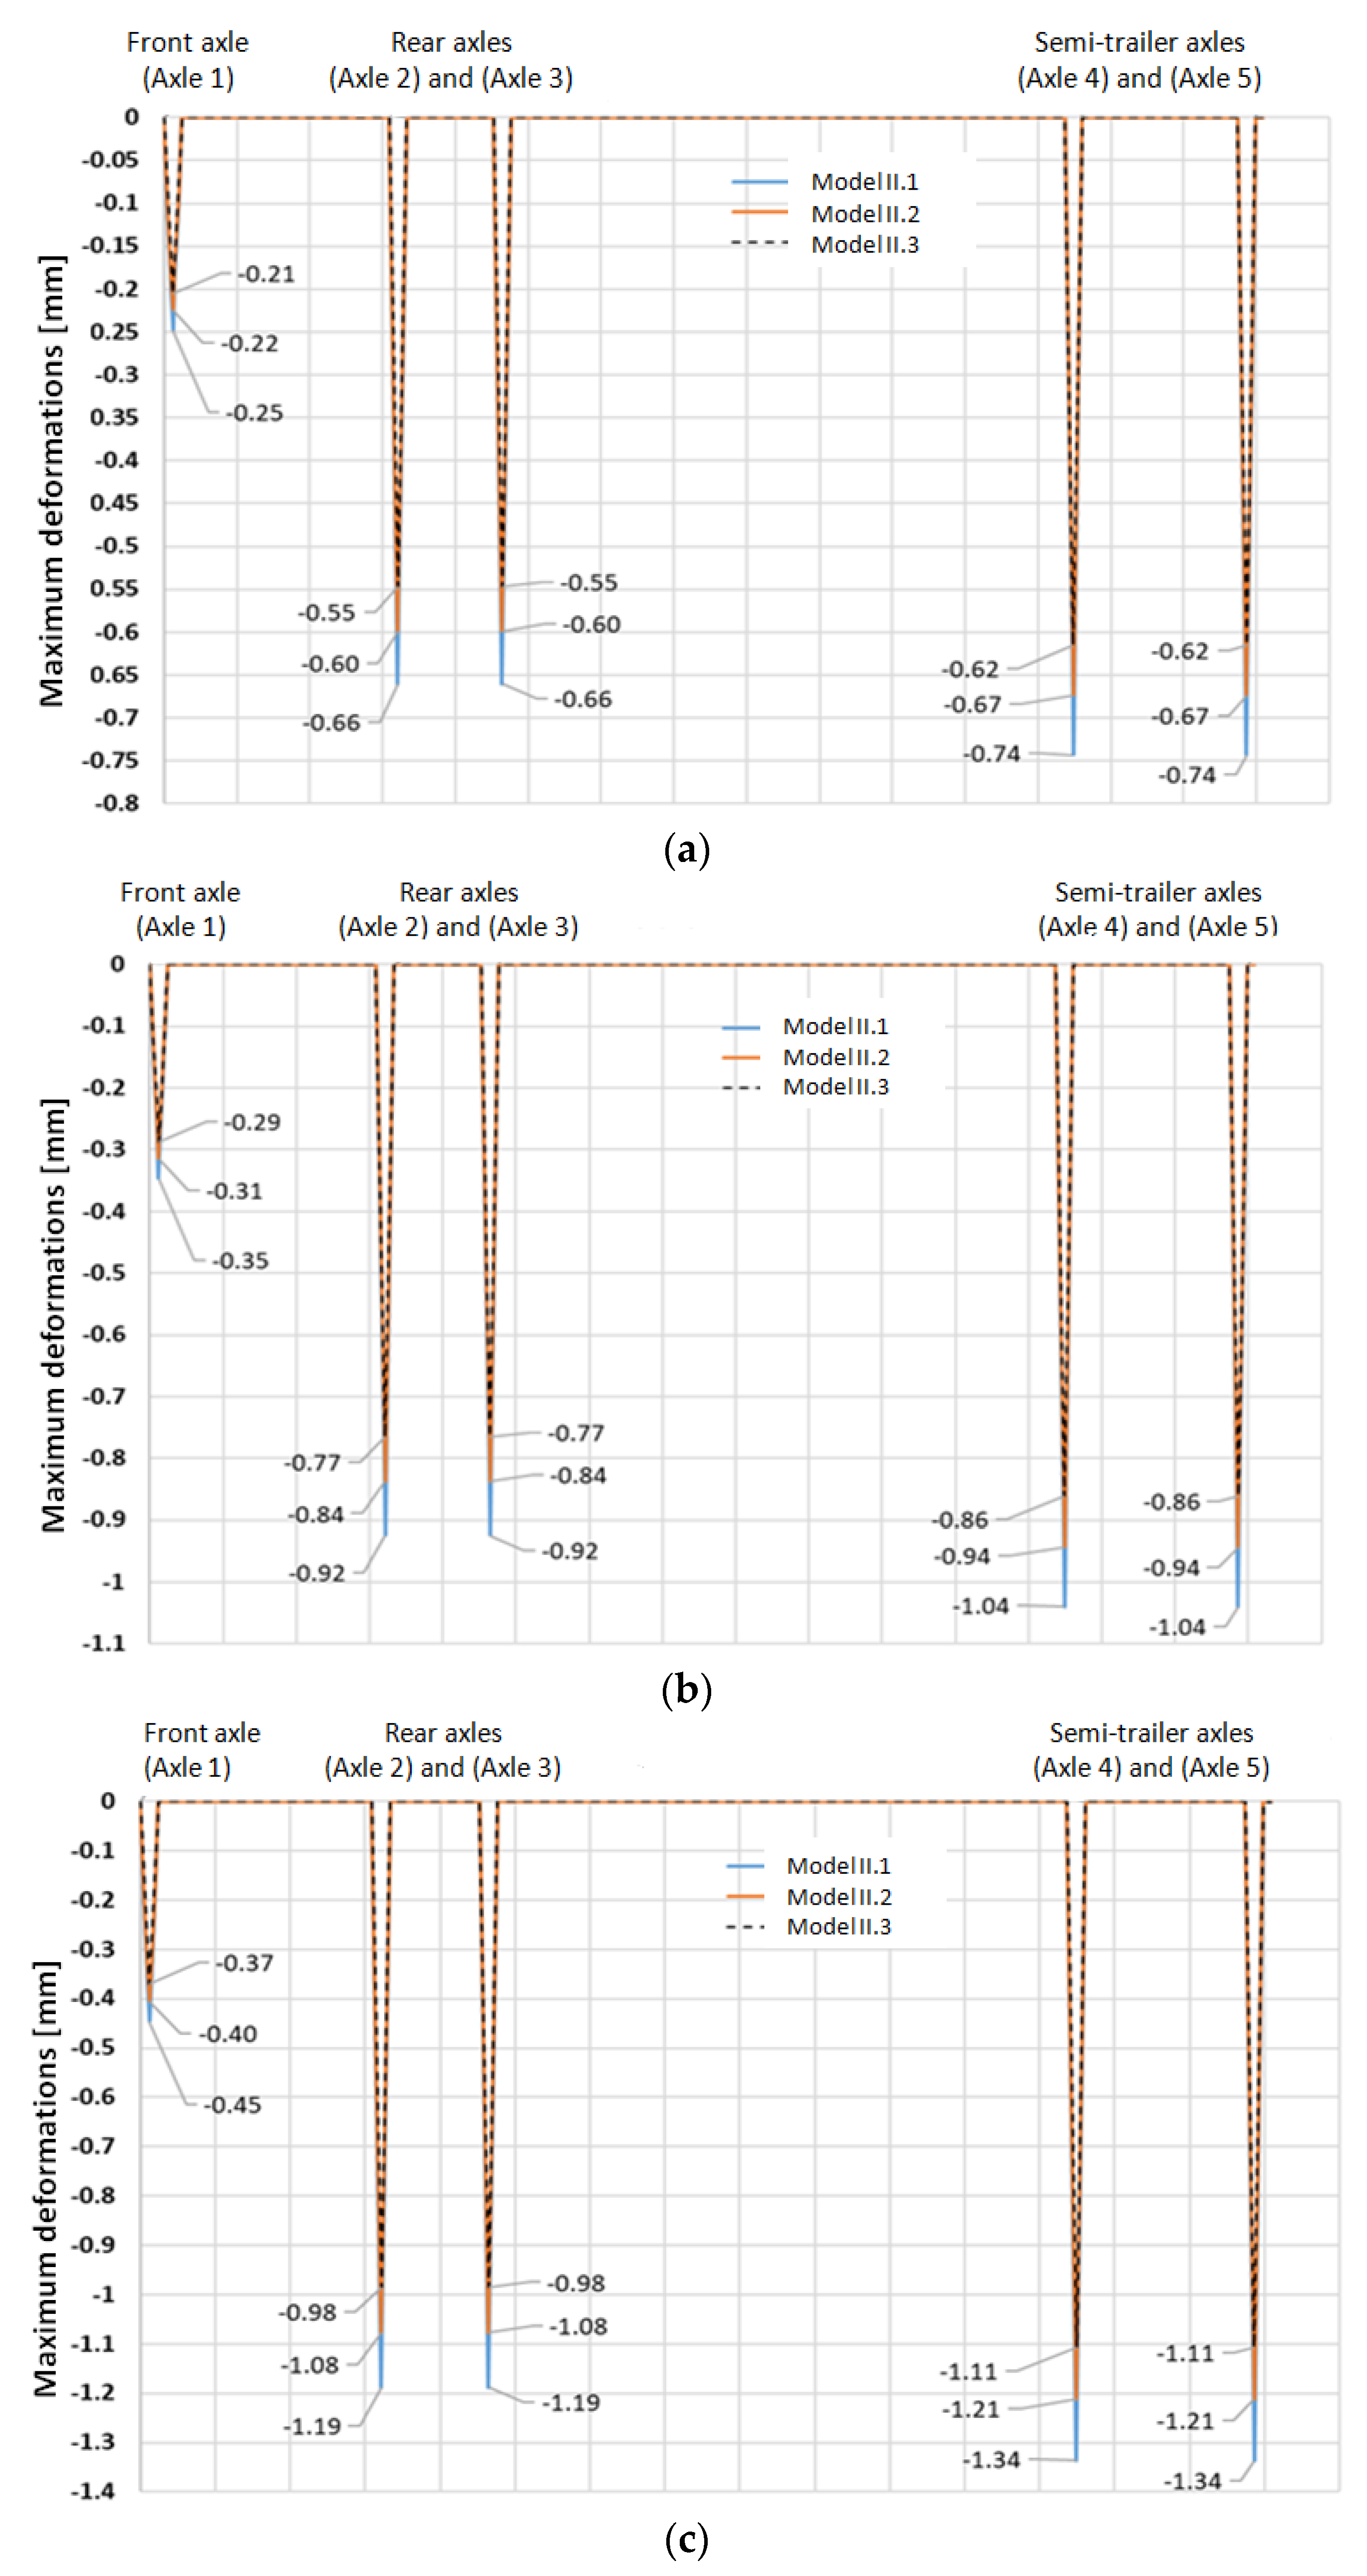
3.2.2. The Maximum Deformations Recorded at 25, 35 and 45 Tons Loadings
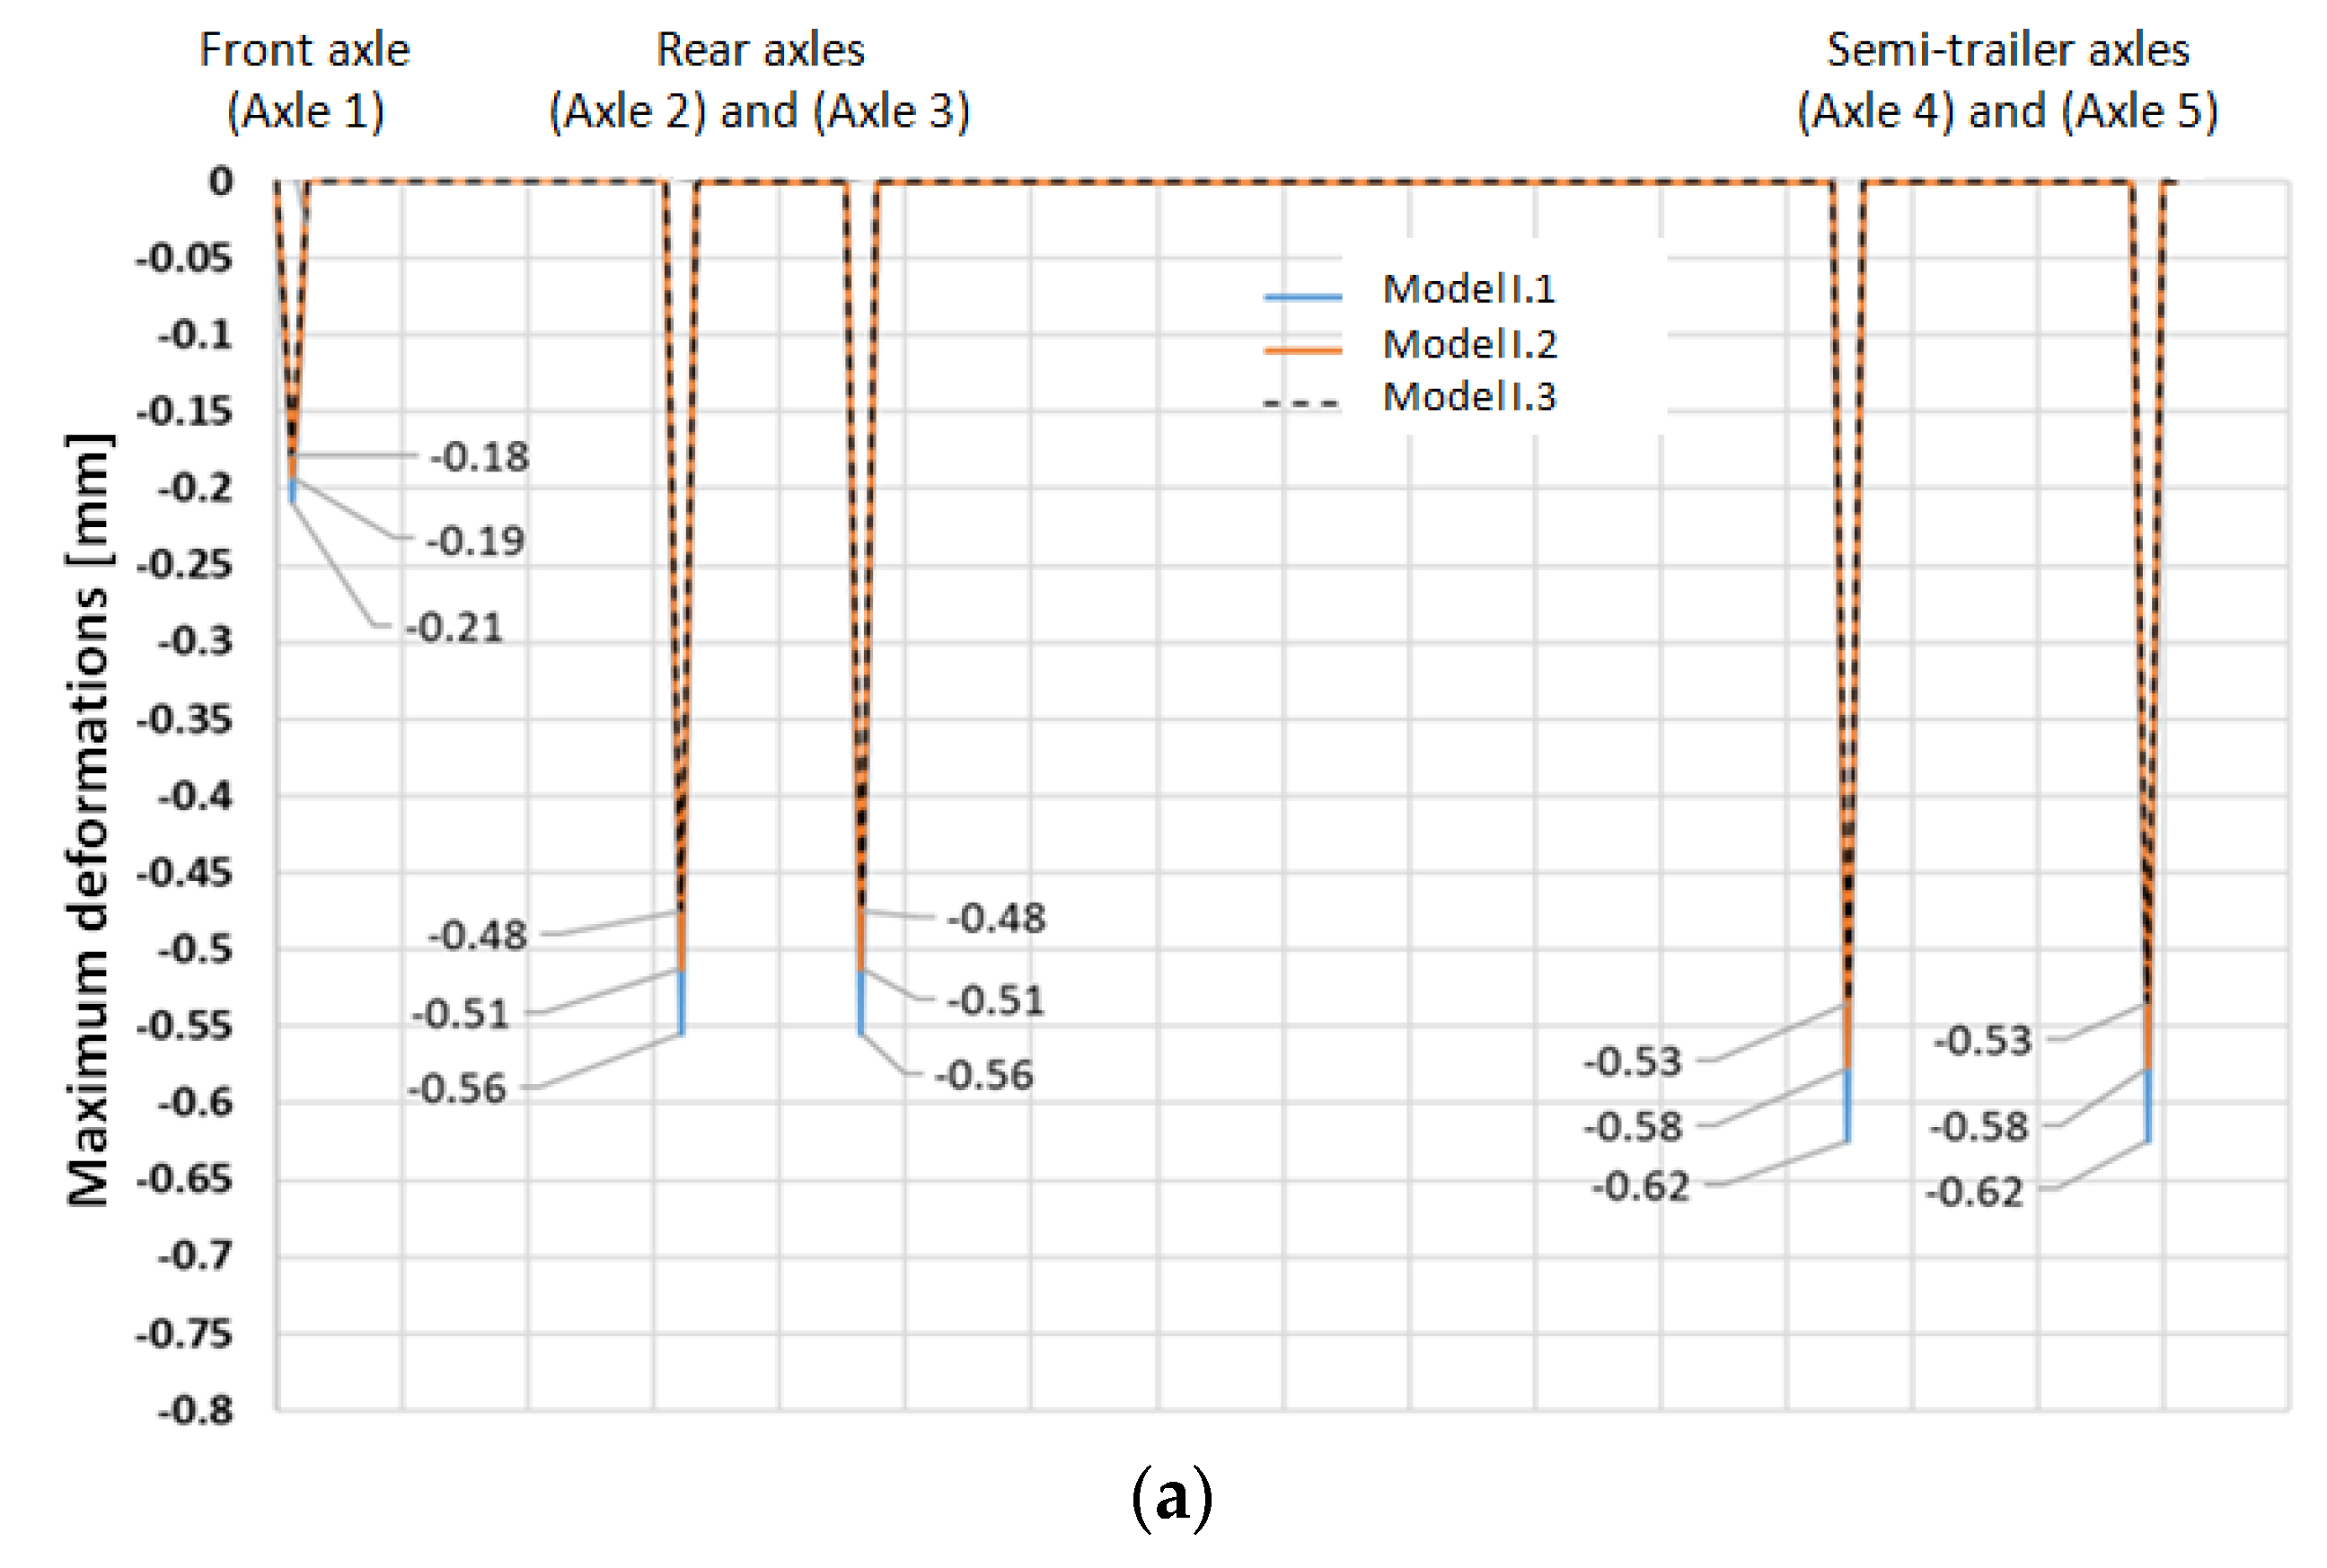
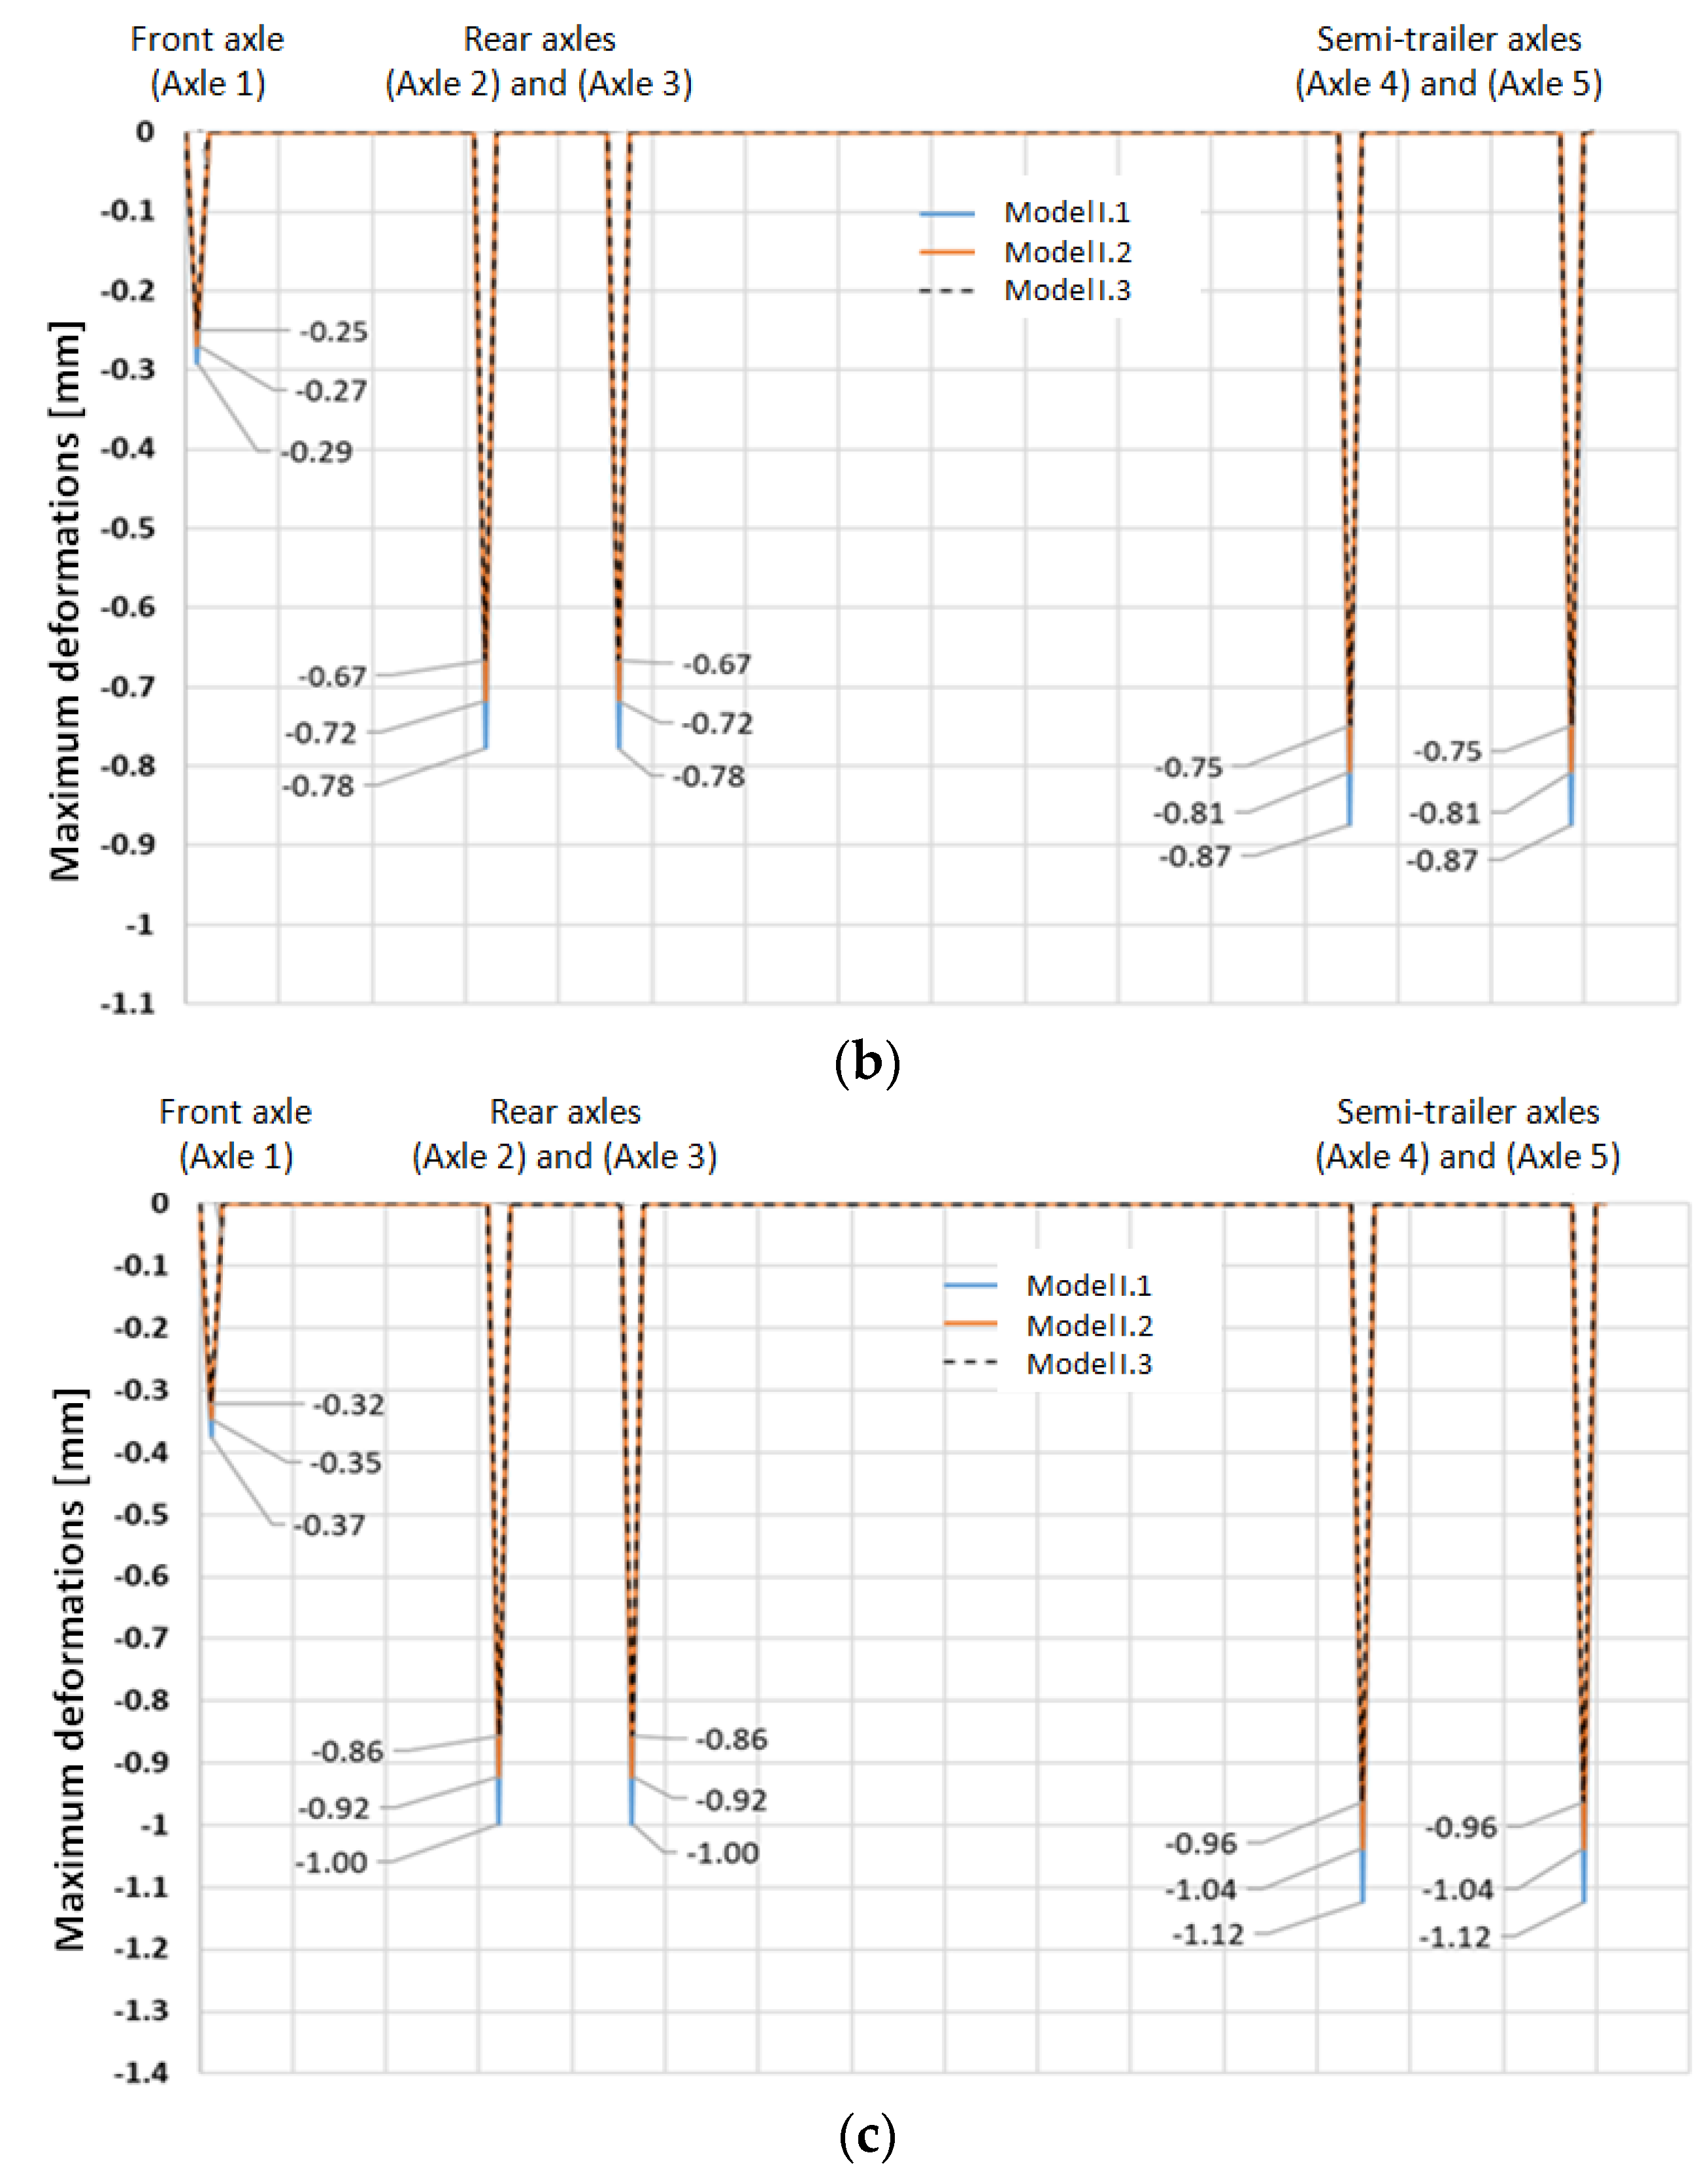
Type I Road Systems
Type II Road Systems
Type III Road Systems
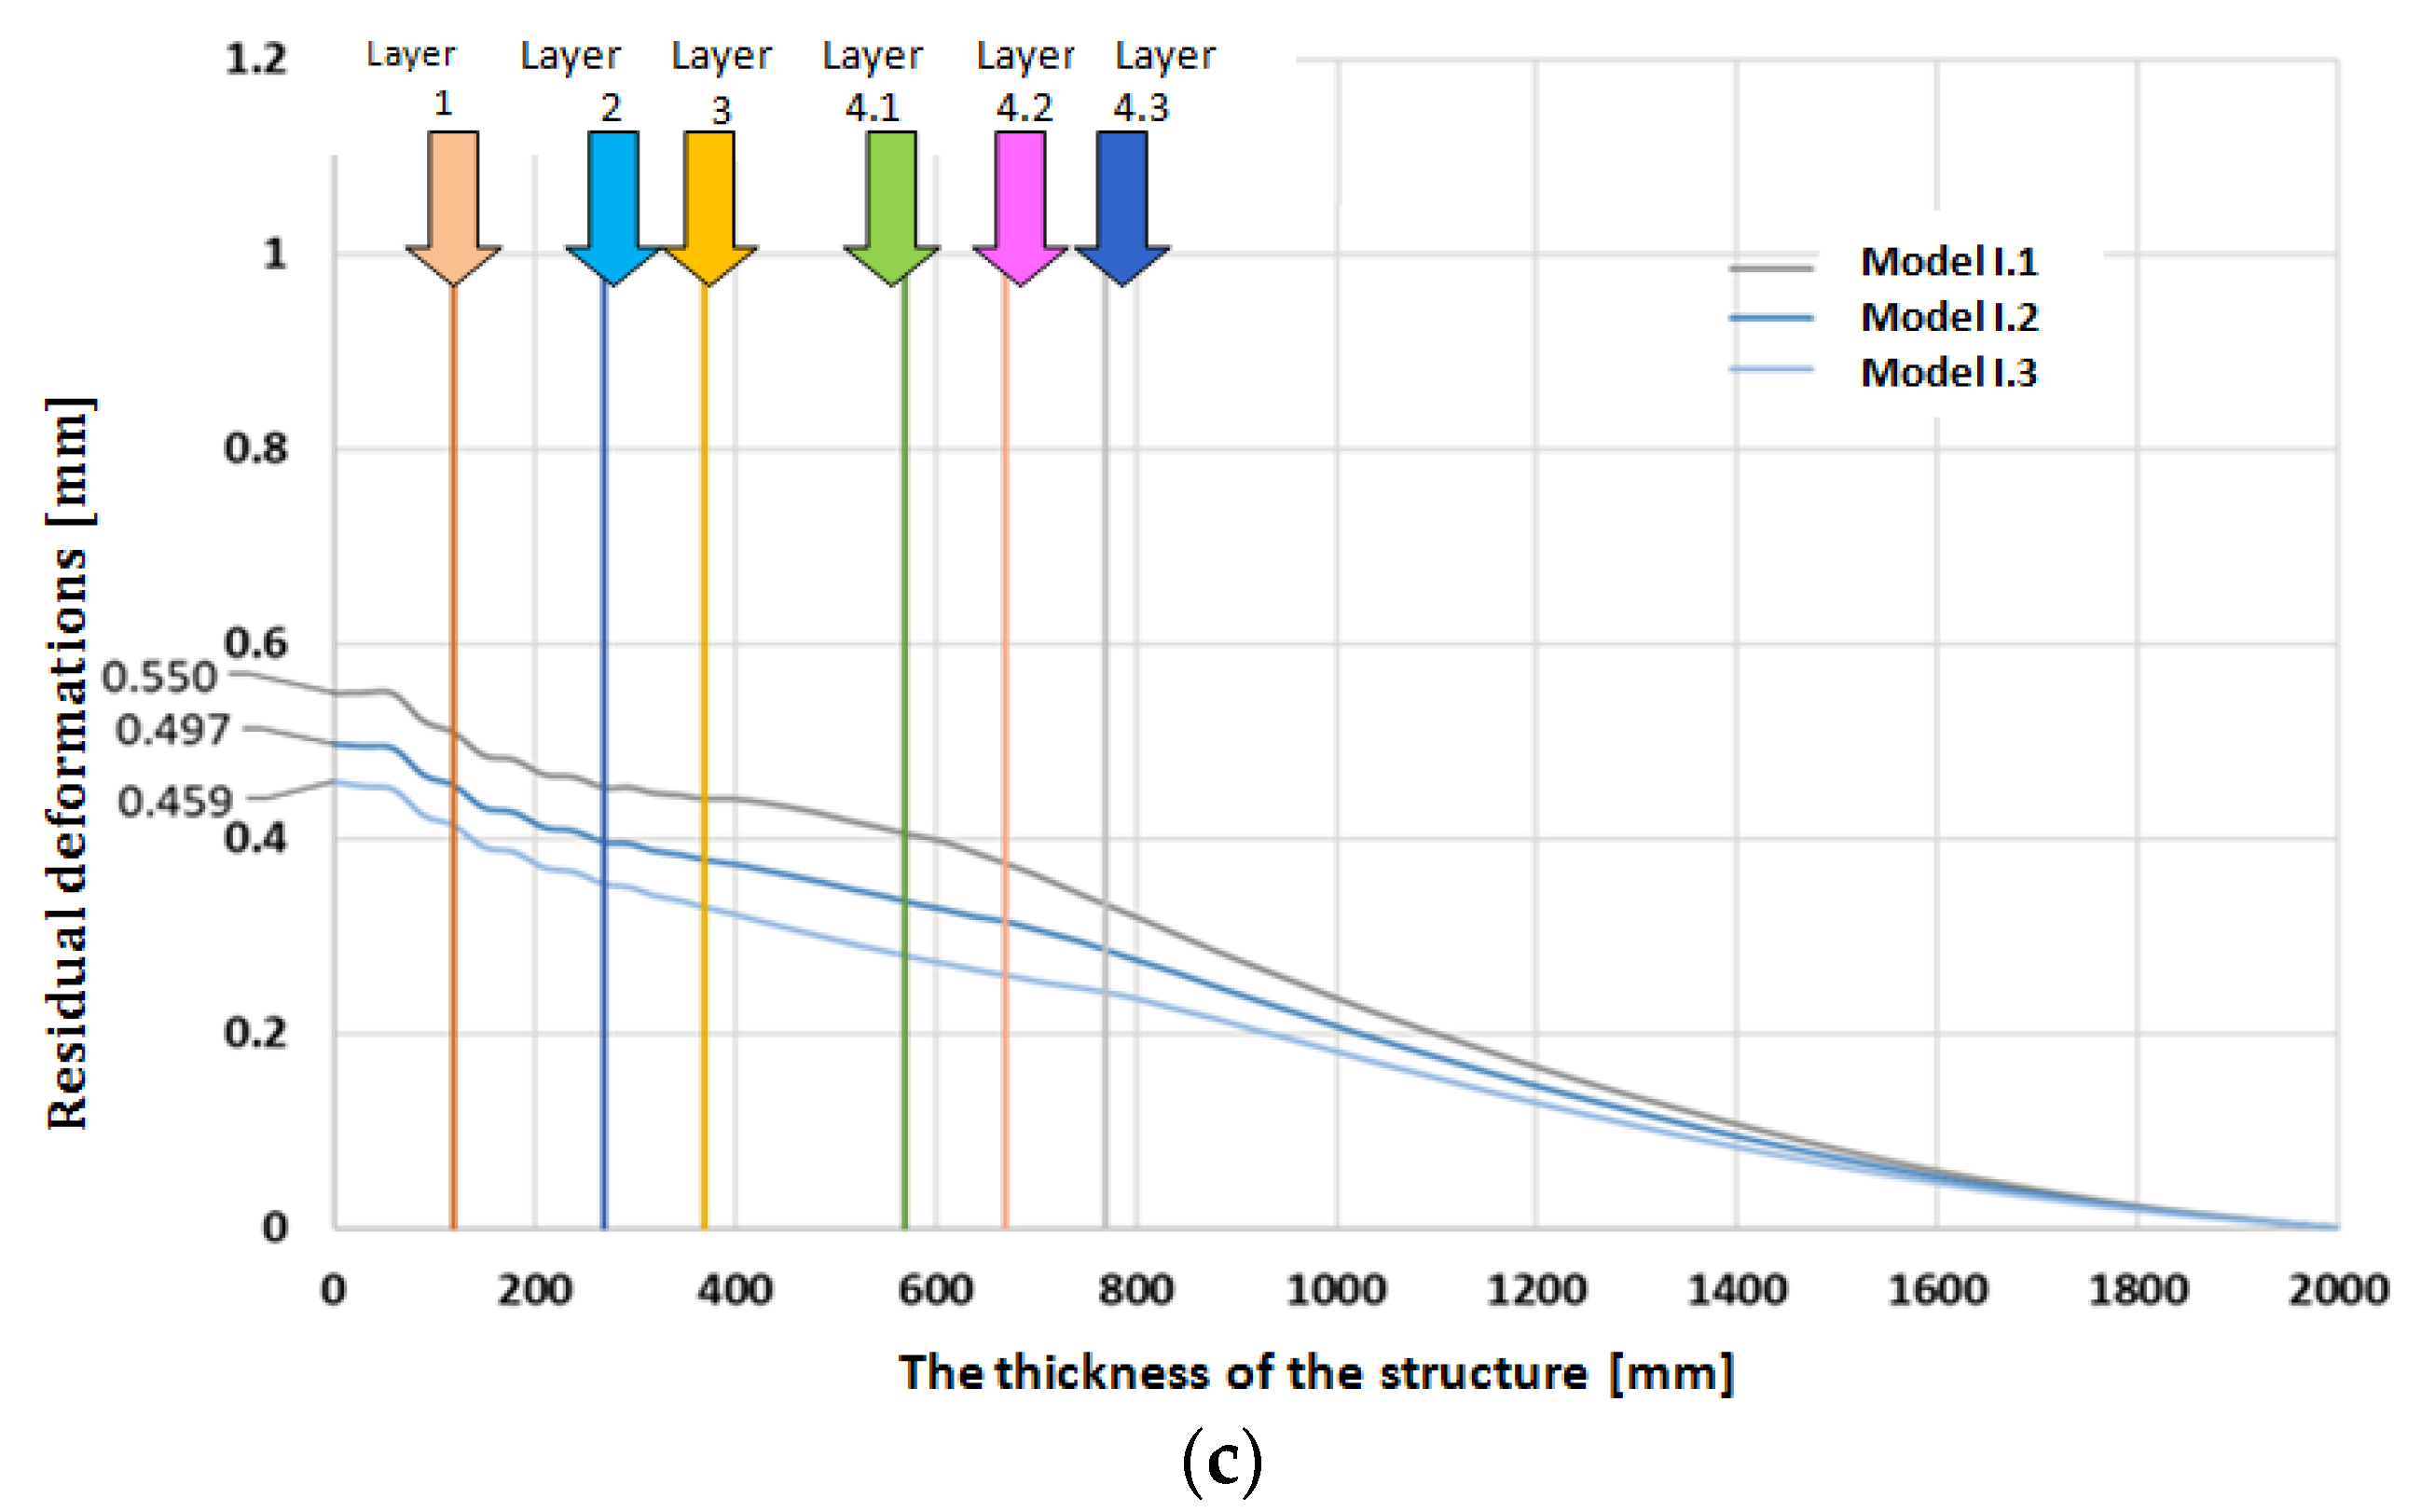
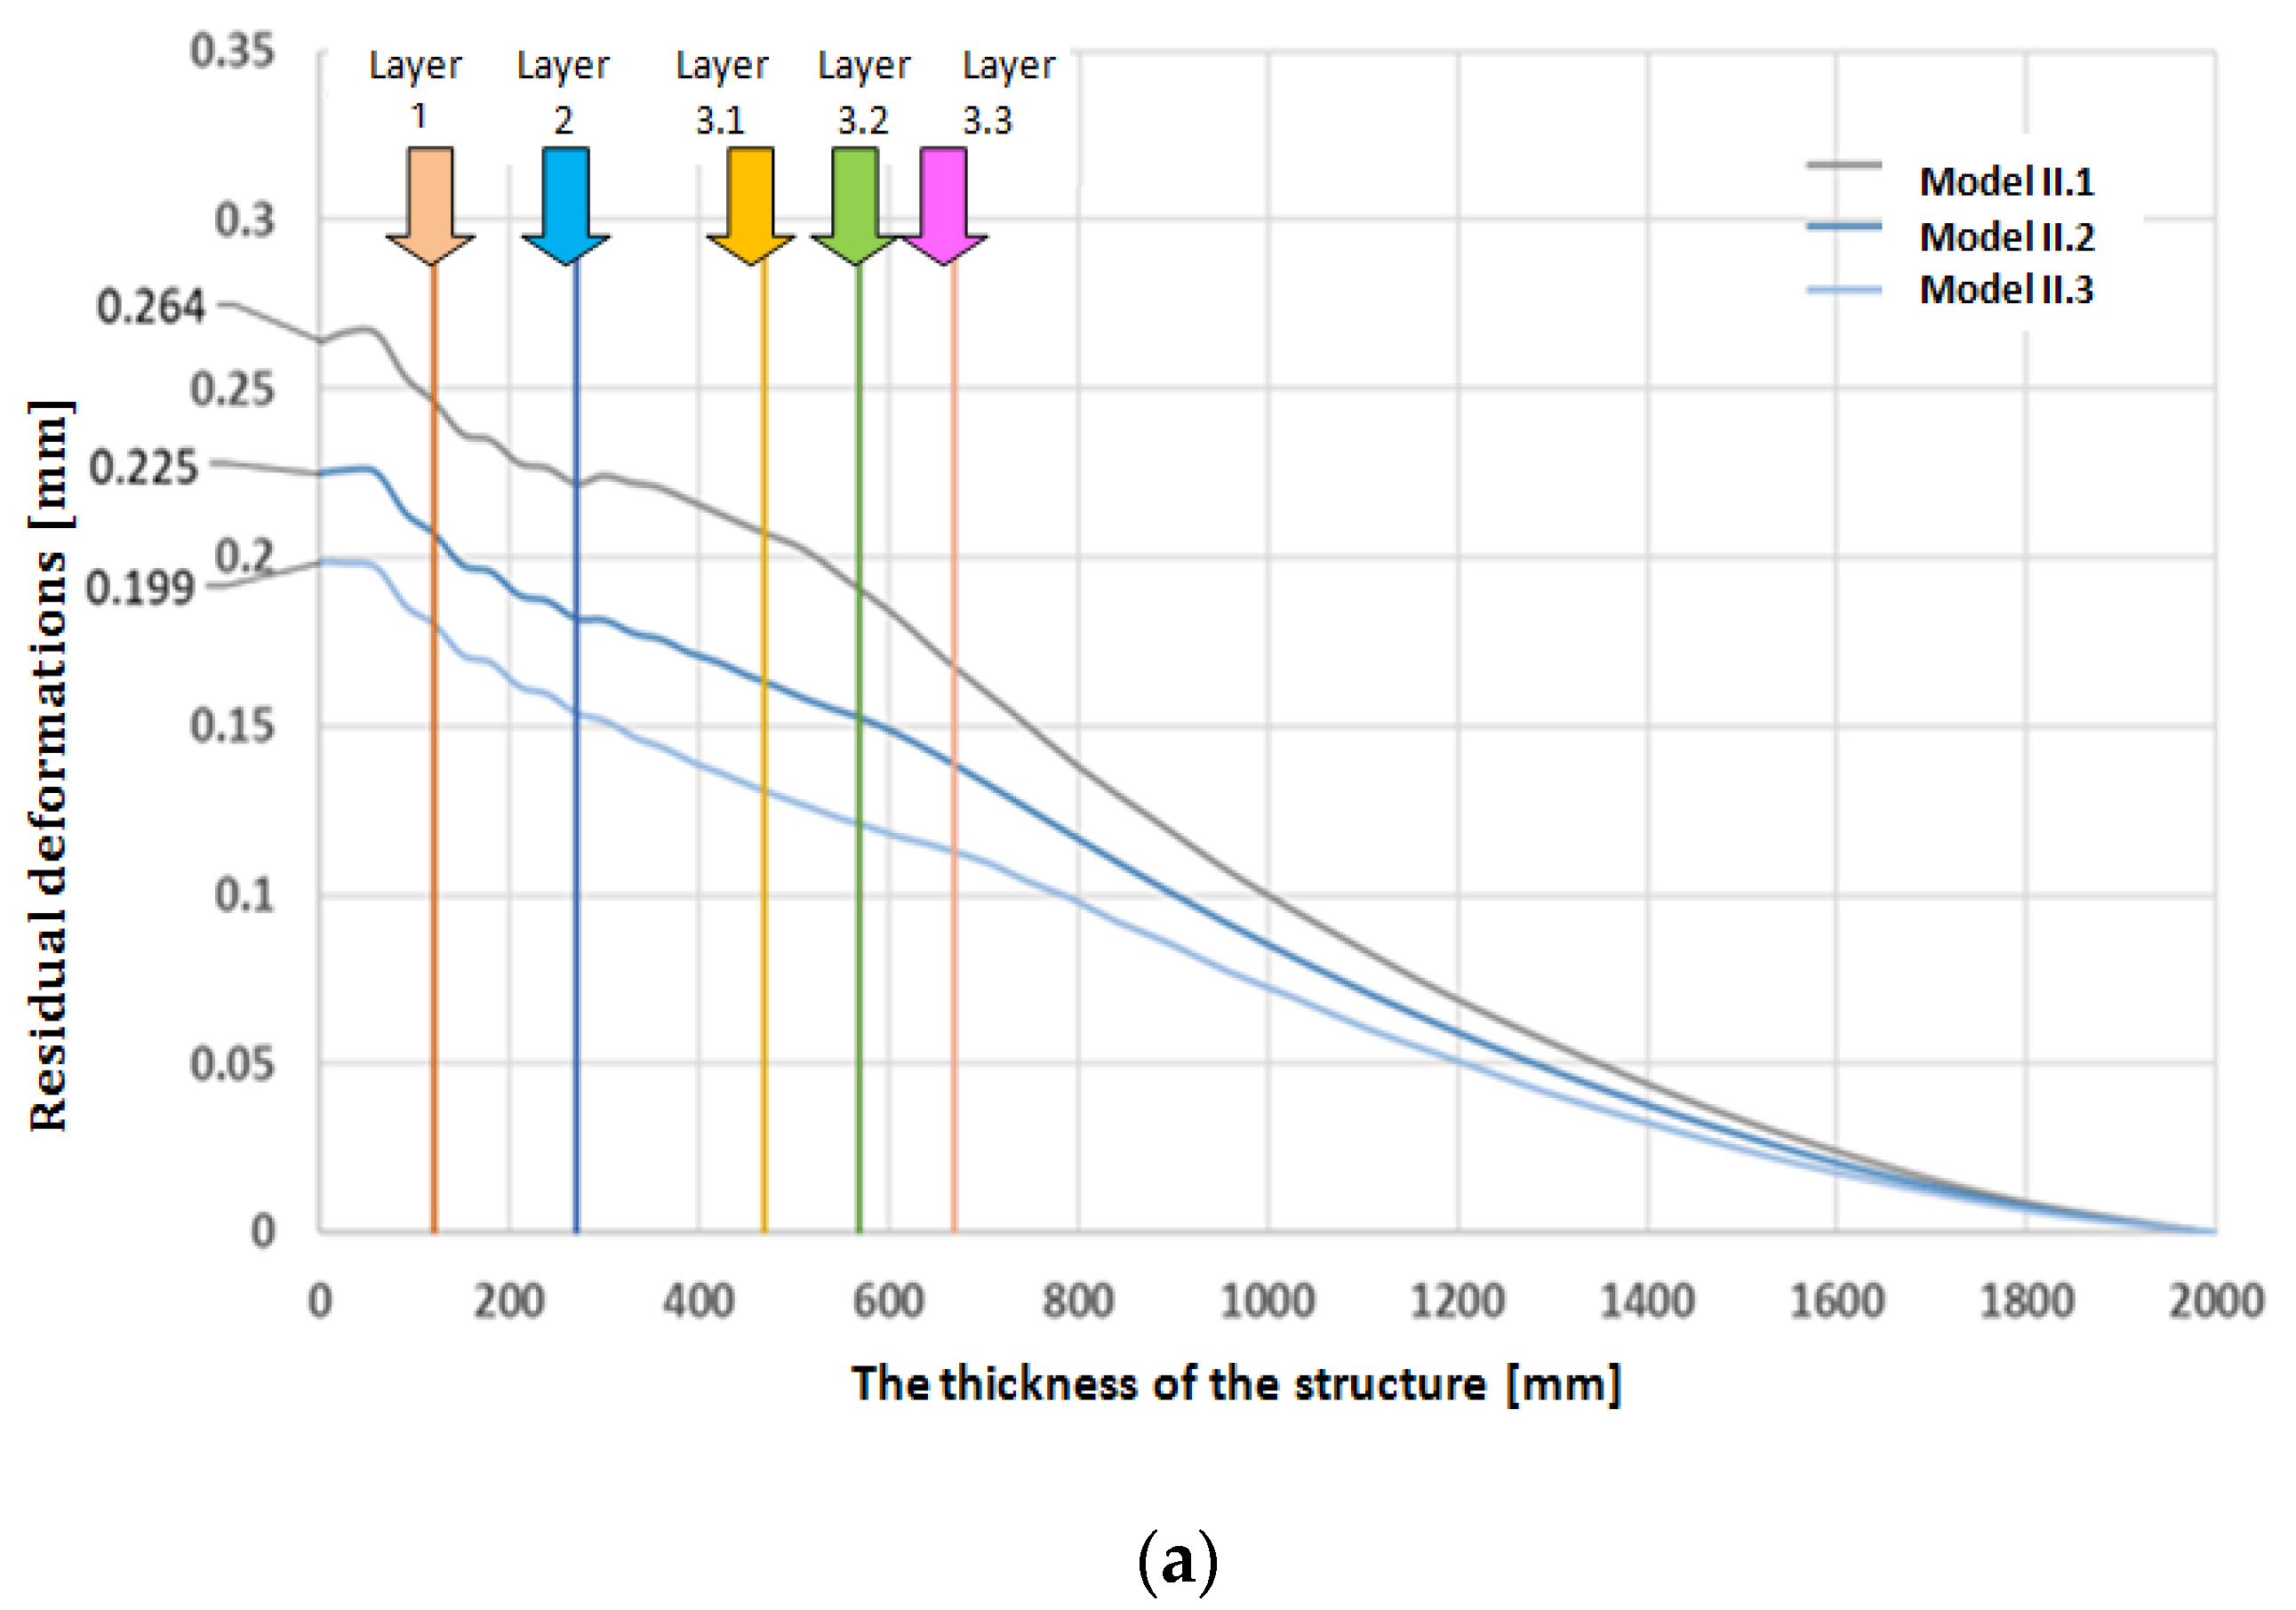
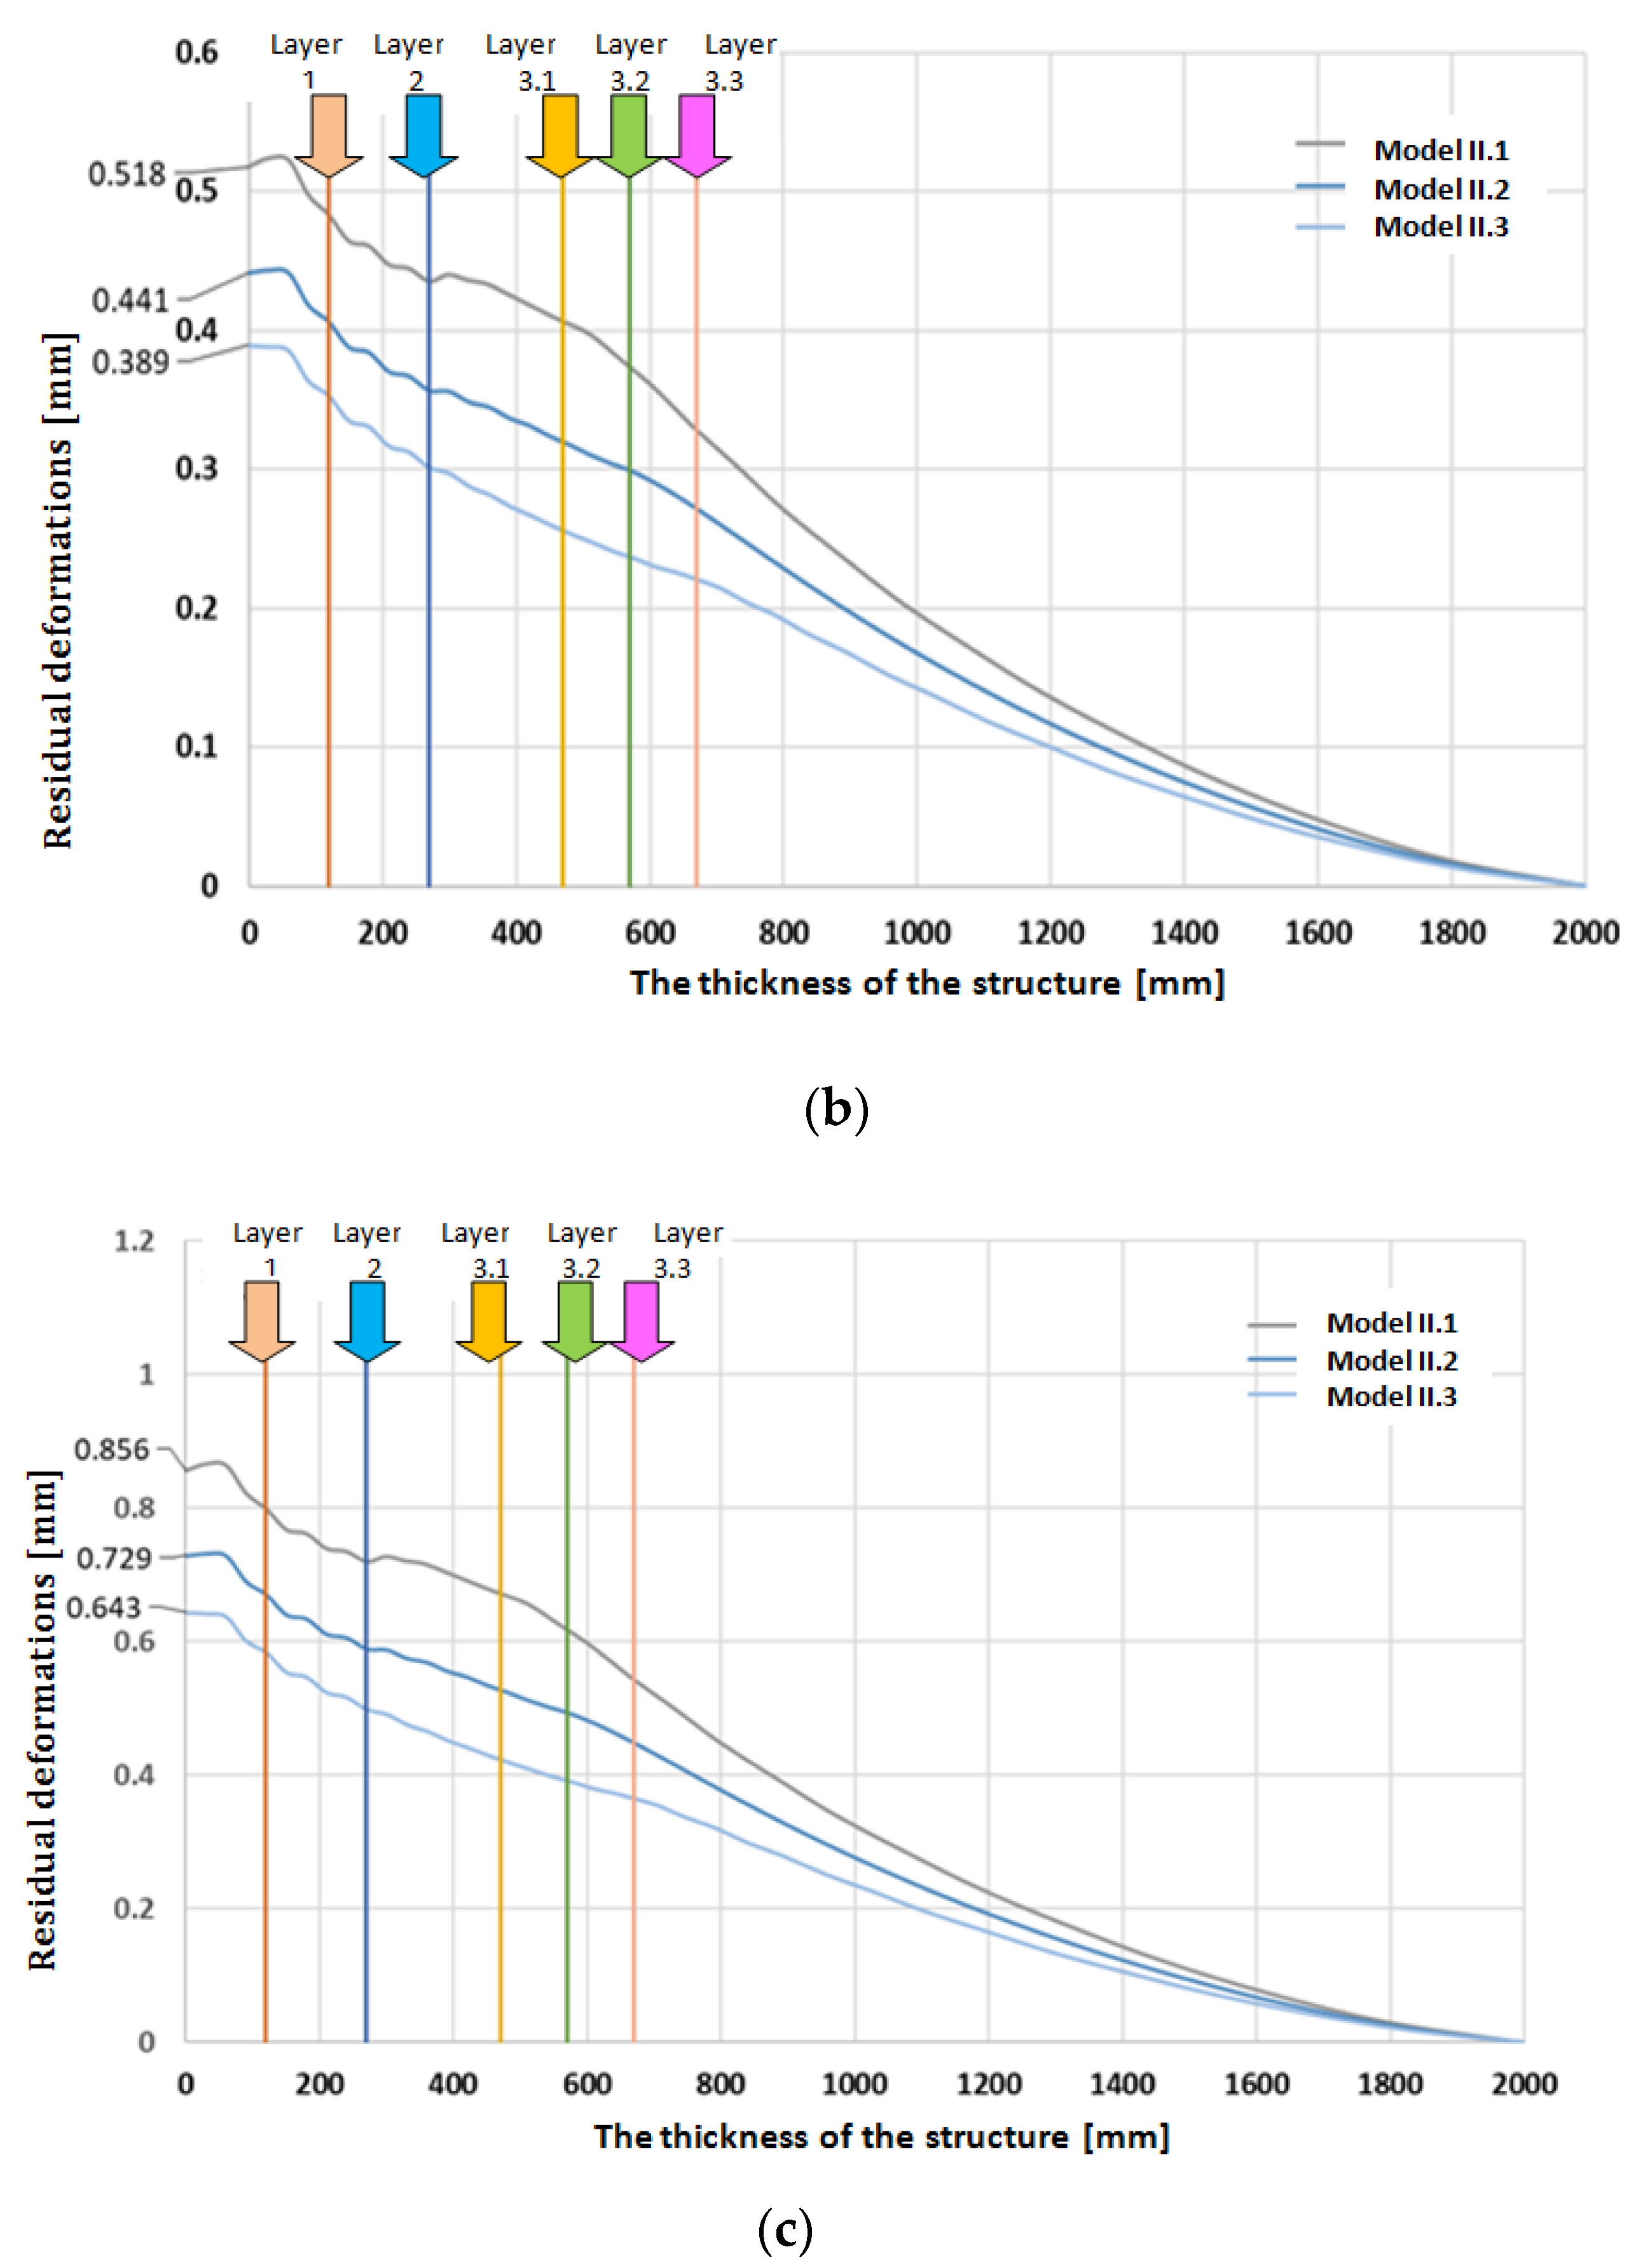
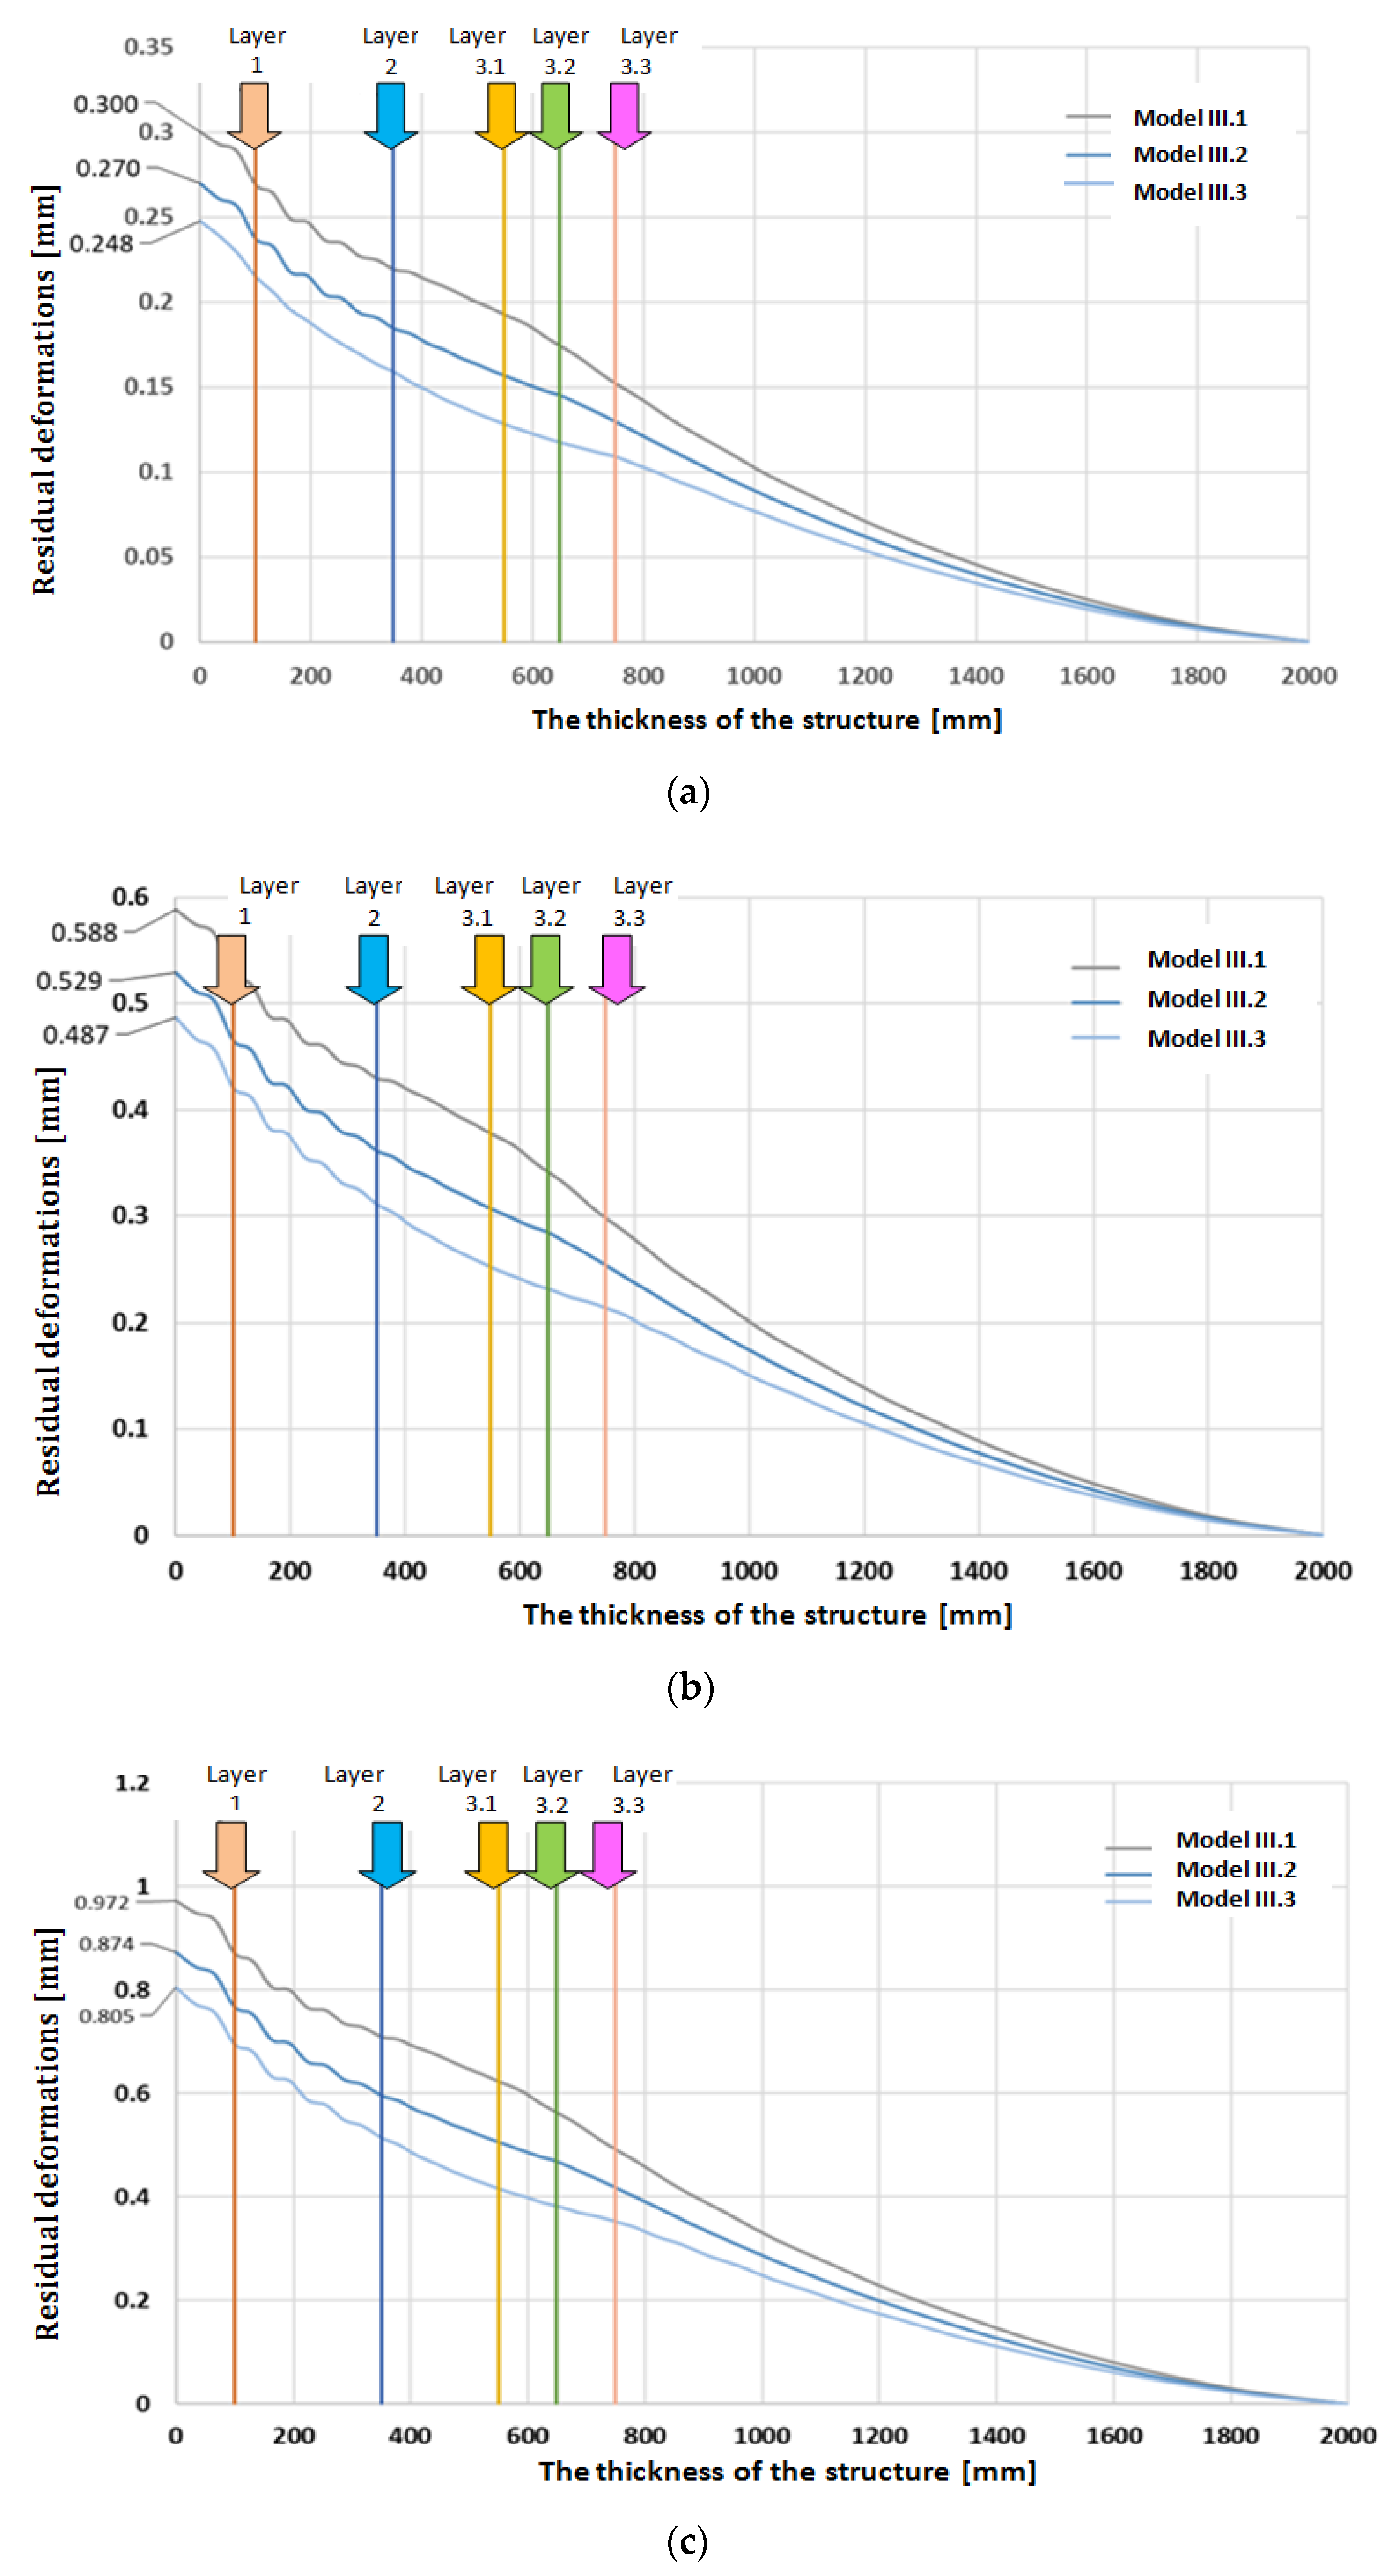
3.2.3. The Residual Deformations Recorded at 25, 35 and 45 Tons
Type I Road Systems
Type II Road Systems
Type III Road Systems
4. Discussion
5. Conclusions
- In the present study, the maximum deformation always occurs in the center of the pressing surface;
- The deformation of the roadbed depends on the road system composition (as a number of layers), its deformation being various for each case studied;
- A higher road system’s thickness can reduce the displacement into the depth of the layers and the maximum deformations;
- Among all nine types of road systems evaluated, it was observed that type III road systems was the most rigid, and it had the smallest deformations at the level of the contact surface, a fact due to the ballast layer’s thickness;
- In all the road systems studied, the largest deformations occur at the semi-trailer axles, the values being higher when the road system is of less thickness, and the loading is higher;
- By verifying the nine variants of standard road systems at loadings of 25, 35 and 40 tons, it was found that not all of them provide the necessary bearing capacity for the current traffic imposing themselves, as the case may be, increasing the thickness of system’s layers.
Author Contributions
Funding
Institutional Review Board Statement
Informed Consent Statement
Data Availability Statement
Acknowledgments
Conflicts of Interest
References
- Kochenderfer, J.N.; Wendel, G.W.; Clay Smith, H. Cost of and Soil Loss on ”Minimum-Standard” Forest Truck Road Constructed in the Central Appalachians; Research paper NE-544; United State Department of Agriculture, Forest Service, Northeastern Forest Experiment Station: Broomall, PA, USA, 1984; 12p.
- Legea nr. 10 din 18 Ianuarie 1995 (Republicată) Privind Calitateaîn Construcții. Published in the Official Monitor of Romania no.765 of 30 September 2016. Available online: https://legislatie.just.ro/Public/DetaliiDocument/5729 (accessed on 30 August 2022).
- Alexandru, V. Construcţia şi Întreţinerea Drumurilor Forestiere; Infomarket Press: Brasov, Romania, 2000; 397p. [Google Scholar]
- Normativ pentru Reabilitarea Drumurilor Forestiere. RD-001-11. Emitted by the Minister of the Environment and Forests no. 1373 on 4 May 2012. 34p. Available online: http://apepaduri.gov.ro/wp-content/uploads/2014/07/Cuprins-Normativ-reabilitare-1.pdf (accessed on 7 March 2019).
- Mușat, E.C.; Alexandru, V.M.; Ciobanu, V.D.; Săceanu, S.C.; Antoniade, C.; Vișan, J. The type and the extension of degradations caused by the introduction in the timber transportation of the increased weight vehicles. Rev. Pădurilor 2014, 5–6, 38–43. [Google Scholar]
- Săceanu, S.C. Contribuţii privind Comportarea Drumuril or Forestiere în Condiţiile Extinderii Transportului Lemnului cu Autovehicule de TonajSporit. Ph.D. Thesis, Transilvania University of Brasov, Brasov, Romania, 2014. [Google Scholar]
- Antoniade, C.C. ContribuţiiPrivindMajorareaCapacităţii Portante a Drumurilor Forestiere, înVedereaExtinderiiTransportuluiLemnului cu Autovehicule de TonajSporit. Ph.D. Thesis, Transilvania University of Brasov, Brasov, Romania, 2015. [Google Scholar]
- Kharavassefat, P.; Jelagin, D.; Birgisson, B. Dynamic response of flexible pavements at vehicle-road interaction. Road Mater. Pavement Des. 2015, 16, 256–276. [Google Scholar] [CrossRef]
- Kharavassefat, P.; Jelagin, D.; Birgisson, B. The non-stationary response of flexible pavements to moving loads. Int. J. Pavement Eng. 2016, 17, 458–470. [Google Scholar] [CrossRef]
- Research Report 148: Infrastructure: Road Construction Cost on Infrastructure Procurement Benchmarking: 2017 Update; Australian Government, Department of Infrastructure, Regional Development and Cities, Bureau Infrastructure, Transport and Regional Economics: Camberra, Autralia, 2018; 54p.
- Akgul, M.; Akburak, S.; Yurtseven, H.; Akay, A.O.; Cigizoglu, H.K.; Demir, M.; Ozturk, T.; Eksi, M. Potential impacts of weather and traffic conditions on road surface performance in terms of forest operations continuity. Appl. Ecol. Environ. Res. 2019, 17, 2533–2550. [Google Scholar] [CrossRef]
- Bitir, I.; Mușat, E.C.; Derczeni, R.A.; Ciobanu, V.D. The influence of the increased tonnage upon the superstructure of forest roads. In Proceedings of the 19th International Multidisciplinary Scientific Geoconference SGEM 2019, Albena, Bulgaria, 28 June–7 July 2019. [Google Scholar]
- Bitir, I.; Mușat, E.C.; Lunguleasa, A.; Ciobanu, V.D. Monitoring the transport on the Ciobănuș forest road within the Bacău Forestry Department. Recent J. 2021, 1, 10–16. [Google Scholar] [CrossRef]
- Kosztka, M.; Markó, G.; Péterfalvi, J.; Primusz, P.; Tóth, C. Measuring bearing capacity on forest roads in Hungary. In A Magyar Tudomanyos Akademia Agrartudomanyok Osztalya; Nyugat-Magyarországi Egyetem: Gödöllö, Ungary, 2008. [Google Scholar]
- Normativ privind Proiectarea Drumurilor Forestiere. Indicativ PD-003-11. Emitted by the Minister of the Environment and Forests no.1374 on 4 May 2012. 34p. Available online: http://apepaduri.gov.ro/wp-content/uploads/2014/07/Cuprins-Normativ-proiectare-1.pdf (accessed on 7 March 2019).
- Mușat, E.C.; Ciobanu, V.D.; Vișan, J.; Antoniade, C.; Săceanu, S.C. Analiza variantelor de structuri rutiere în contextul sporirii capacității portante a drumurilor forestiere. Rev. Pădurilor 2016, 3–4, 91–99. [Google Scholar]
- Zhu, X.Q.; Law, S.S. Recent development in inverse problems of vehicle-bridge interaction dynamics. J. Civ. Struct. Health Monit. 2016, 6, 107–128. [Google Scholar] [CrossRef]
- Constantinescu, Ș.; Suciu, D. Strategii de întreținere și reparații pentrustri ructurirutiere la drumuri noi. Rev. Drumuri Poduri 2002, 67, 13–17. [Google Scholar]
- Șerbulea, M. Certificarea de conformitate a calității produselor. Calitatea construcțiilor. Legea 10/18 ianuarie 1995. Rev. Drumuri Poduri 2002, 65, 31–33. [Google Scholar]
- Grajewski, S.M.; Czerniak, A.; Kuroska, E.E. The influence of vegetation succession on bearing capacity of forest roads made of unbound aggregates. Forests 2020, 11, 1137. [Google Scholar] [CrossRef]
- Yorulmaz, A.; Sivrikaya, O.; Uysal, F. Evaluation of the bearing capacity of poor subgrade soils stabilized with waste marble powder according to curing time and freeze-thaw cycles. Arab. J. Geosci. 2021, 14, 360. [Google Scholar] [CrossRef]
- Olteanu, N. Drumuri Forestiere. Proiectare; Transilvania University Press: Brasov, Romania, 1995; 173p. [Google Scholar]
- Olteanu, N. Proiectarea Drumurilor Forestiere; Lux Libris Press: Brasov, Romania, 1996; 236p. [Google Scholar]
- Olsson, L.; Lohmander, P. Optimal forest transportation with respect to road investments. Forest Policy Econ. 2005, 7, 369–379. [Google Scholar] [CrossRef]
- Li, L.; Sandu, C. On the impact of cargo weight, vehicle parameters, and terrain characteristics on the prediction of traction for off-road vehicles. J. Terramechanics 2002, 44, 221–238. [Google Scholar] [CrossRef]
- Zanuncio, A.J.V.; Carvalho, A.G.; da Silva, M.G.; Lima, J.T. Importance of wood drying to the forest transport and pulp mill supply. Cerne 2017, 23, 147–152. [Google Scholar] [CrossRef]
- Pentek, T.; Pičman, D.; Potočnik, I.; Dvorščak, P.; Nevečerel, H. Analysis of an existing forest road network. CROJFE 2005, 26, 39–50. [Google Scholar]
- Enache, A.; Stampfer, K.; Ciobanu, V.; Brânzea, O.; Duţă, C. Forest road network planning with state of the art tools in a private forest district from Lower Austria. BUT–Ser. II 2011, 4, 33–40. [Google Scholar]
- Trzcinski, G.; Kozakiewicz, P.; Selwakowski, R. The technical aspects of using timber in the construction of forest roads. J. Water Land Dev. 2017, 34, 241–247. [Google Scholar] [CrossRef]
- Derczeni, R.A.; Salcă, E.A.; Ciobanu, D.V.; Bitir, I.; Mușat, E.C. Research on establishing criteria for calculating the tax/road tolling for vehicles used for timber transport on forest roads. In Proceedings of the International Symposium “Forest and Sustainable Development”—The 8th Edition, Brasov, Romania, 25–27 October 2018. [Google Scholar]
- Southworth, J.; Tucker, C. The influence of accessibility, local institution and socioeconomic factors on forest cover change in the mountains of Western Honduras. MRD 2001, 21, 276–283. [Google Scholar] [CrossRef]
- Popovici, V.; Bereziuc, R.; Clinciu, I. Extinderea rețelei de drumuri pentru accesibilizarea fondului forestier și, în general, a pădurii. Bucov. For. 2003, XI, 36–40. [Google Scholar]
- Navarro Maroto, P.J.; Rodriques Bayo, J.; Codina i Palou, M.; Dominquez i Tores, G.; Lopes Vicens, Y. Prospects for the Market Supply of Wood and Other Forest Products from Areas with Fragmented Forest Ownership Structure; Task II. Case Study: Catalonia, Spain; Centre Tecnologic Forestal de Catalunya: Catalunya, Spain, 2010; 93p. [Google Scholar]
- Bereziuc, R.; Alexandru, V.; Ciobanu, V.; Mușat, E.C.; Dumitrașcu, A.-E.; Antoniade, C.; Vișan, J. The density index of the forest road network managed by the Natinal Forest Administration (R.N.P.). In Proceedings of the International Conference “Forest and Sustainable Development”, Brasov, Romania, 25–26 October 2014. [Google Scholar]
- Bereziuc, R. Realizăriși perspective în domeniul căilor forestiere de transport. An. Univ. “Ștefan Cel Mare” Suceava 2004, 2, 9–14. [Google Scholar]
- Potočnik, I.; Pentek, T.; Pičman, D. Impact of traffic characteristics on forest roads due to forest management. CROJFE 2005, 26, 51–57. [Google Scholar]
- Grulois, S.; Pellegrini, M.; Lingua, E.; Grignolato, S.; Protti, F.; Vitali, A.; Rebolj, L.; Grum, A.; Ginet, C.; Corette, T.; et al. General presentation of the wood transport sector in the alpine space. Interreg. Alp. Space Proj. 2014, 29. [Google Scholar]
- Turk, Y. Construction method of forest roads in Turkey. In Proceedings of the 5th Forest Engineering Conference—FORMEC, Gerarder, France, 23–26 September 2014. [Google Scholar]
- De Clercq, E.M.; De Wulf, R.; Van Herzele, A. Relating spatial pattern of forest cover to accessibility. Landsc. Urban Plan. 2007, 80, 14–22. [Google Scholar] [CrossRef]
- Huan, R.; Yeh, C. Development of an assessment framework for green highway construction. J. Chin. Inst. Eng. 2008, 31, 573–585. [Google Scholar] [CrossRef]
- Krč, J.; Beguš, J. Planning forest opening with forest roads. CROJFE 2013, 34, 217–228. [Google Scholar]
- Cebon, D. Interaction between Heavy Vehicles and Roads; SAE Technical Paper 930001; 1993; 81p. [Google Scholar] [CrossRef]
- Lachini, E.; Fiedler, N.; Silva, G.; Pinheiro, C.; Carmo, F. Operational analysis of forestry transportation using self-loading trucks in a mountainous region. For. Ambient. 2018, 25, e20150060. [Google Scholar] [CrossRef]
- Layton, D.A.; LeDoux, C.B.; Hassler, C.C. Cost Estimators for Construction of Forest Roads in Central Appalachians; Research Paper NE-665; United State Department of Agriculture, Forest Service, Northeastern Forest Experiment Station: Morgantown, WV, USA, 1992; 8p.
- Asikainen, A. Simulation of logging and barge transport of wood from forests on islands. Int. J. For. Eng. 2001, 12, 43–50. [Google Scholar] [CrossRef]
- Akay, A.E. Minimizing total costs of forest roads with computer-aided design model. Asdhana 2006, 31, 621–633. [Google Scholar] [CrossRef]
- Lindström, J.; Fjeld, D. Routing of self-loading logging trucks in Sweden. In Proceedings of the 34th Council on Forest Engineering, Quebec, QC, Canada, 12–15 June 2011. [Google Scholar]
- Ghajar, I.; Nakafi, A.; Karimimajd, A.M.; Boston, K.; Torabi, S.A. A program for cost estimation of forest road construction using engineer’s method. Forest Sci. Technol. 2013, 9, 111–117. [Google Scholar] [CrossRef]
- Acuna, M. Timber and biomass transport optimization: A review of planning issue, solution techniques and decision support tools. CROJFE 2017, 38, 279–290. [Google Scholar]
- Olteanu, I.; Stan, I. Transportul auto forestier—present și viitor. Rev. Pădurilor 1992, 107, 43–48. [Google Scholar]
- Holzleitner, F.; Kanzian, C.; Stampfer, K. Analyzing time and fuel consumption in road transport of round wood with an onboard fleet manager. Eur. J. Forest Res. 2011, 130, 293–301. [Google Scholar] [CrossRef]
- Ordonanța nr. 43 din 28 August 1997 privindRegimulDrumurilor. Emitted by the Romanian Govern and Published in the Official Monitor no. 237 on 29 June 1998. Available online: https://legislatie.just.ro/Public/DetaliiDocument/11269 (accessed on 30 August 2022).
- Bereziuc, R.; Alexandru, V.; Ciobanu, V.; Ignea, G. Elemente de Fundamentare a Normativului de Proiectare a Drumurilor Forestiere; Transilvania University Press: Brasov, Romania, 2008. [Google Scholar]
- Trzcinski, G.; Kaczmarzyk, S. Estimation of carrying capacity of slag and gravel forest road pavements. CROJFE 2006, 27, 27–36. [Google Scholar]
- Rahbarisisakht, S.; Hadi Moayeri, M.; Hayati, E.; Moein Sadeghi, S.M.; Kepfer-Rojas, S.; Hadi Pahlavani, M.; Kappel Schmidt, I.; Borz, S.A. Changes in soil’s chemical and biochemical properties induced by road geometry in the Hyrcanian temperate forests. Forest 2021, 12, 1805. [Google Scholar] [CrossRef]
- Begus, J.; Pertlik, E. Guide for Planning, Construction and Maintenance of Forest Roads; FAO: Budapest, Hungary, 2017; 51p. [Google Scholar]
- Normativ privind Proiectarea și Execuția Împietruirilor Drumurilor de Pământ. Condiții de calitate. Indicativ AND-582/2002. Buletin Thenic Rutier 2002, 3, 7–58.
- Bereziuc, R.; Alexandru, V.; Ciobanu, V. Accesibilizarea Pădurilorîn Condiții Ecologice, în Vederea Valorificării Masei Lemnoase. Rev. Pădurilor 2013, 128, 28–34. [Google Scholar]
- Tahvanainen, T.; Anttila, P. Supply chain cost analysis of long-distance transportation of energy wood in Finland. Biomass Bioenerg. 2011, 35, 3360–3375. [Google Scholar] [CrossRef]
- Beskou, N.D.; Hatzigeorgiou, G.; Theodorakopoulos, D. Finite element inelastic analysis of 3-D flexible pavements under moving loads. In Proceedings of the COMPDYN 2015—5th ECCOMAS Thematic Conference on Computational Methods in Structural Dynamics and Earthquake Engineering, Crete Island, Greece, 25–27 May 2015. [Google Scholar]
- Chen, Y.; Zhang, H.; Zhu, X.; Liu, D.W. The response of pavement to the multi-axle vehicle dynamic load. In Proceedings of the International Conference of Electrical, Automation and Mechanical Engineering—EAME, Phuket, Thailand, 26–27 July 2015. [Google Scholar]
- Ciobanu, V.D. CercetăriPrivindUtilizareaGeogrilelor la ConsolidareaPărțiiCarosabile a Drumurilor Forestiere AmplasateînTerenuriArgiloase. Ph.D. Thesis, Transilvania University of Brasov, Brasov, Romania, 1998. [Google Scholar]
- Yanov, D.V.; Zelepugin, S.A. Road pavement design using the finite element method. CICMCM—IOP Conf. Ser. J. Phys. Conf. Ser. 2019, 1214, 012024. [Google Scholar] [CrossRef]
- Rodgers, M.; Hayes, G.; Healy, M.G. Cyclic loading tests on sandstone and limestone shale aggregates used in unbound forest roads. Constr. Build. Mater. 2009, 23, 2421–2427. [Google Scholar] [CrossRef]
- Ryan, T.; Phillips, H.; Ramsay, J.; Dempsey, J. Forest Road Manual. Guidelines for the Desing, Construction and Management of Forest Roads; COFORD, National Council for Forest Research and Development Agriculture Building: Dublin, Ireland, 2004; 156p.
- Kapoor, K.; Prozzi, J.A. Methodology for Quantifying Pavement Damage Caused by Different Axle and Load Configurations; Report SWUTC/05/167827-1, April 2005; Center for Transportation Research, University of Texas: Austin, TA, USA, 2005. [Google Scholar]
- Thom, N. Principles of Pavement Engineering, 2nd ed.; ICE Publishing: London, UK, 2014; 456p. [Google Scholar]
- Bereziuc, R. Drumuri Forestiere; Didactical and Pedagogical Press: Bucharest, Roamnia, 1981; 335p. [Google Scholar]
- Arnold, G.K. Rutting of Granular Pavements. Ph.D. Thesis, University of Nottingham, Nottingham, UK, 2004. [Google Scholar]
- Thyagarajan, S. Improvements to Strain Computation and Reliability Analysis of Flexible Pavements in the Mechanical-Empirical Pavement Design Guide. Ph.D. Thesis, Washington State University, Washington, DC, USA, 2009. [Google Scholar]
- Calvarano, L.S.; Leonardi, G.; Palamara, R. Finite element modeling of unpaved road reinforced with geosynthetics. Procedia Eng. 2017, 189, 99–104. [Google Scholar] [CrossRef]
- Karadag, H.; Firat, S.; Isik, N.S.; Yilmaz, G. Determination of permanent deformation of flexible pavements using finite element model. Gradevinar 2022, 74, 471–480. [Google Scholar] [CrossRef]
- Harvey, J.B. A Large Displacement Finite Element Analysis of a Reinforced Unpaved Road. Ph.D. Thesis, University of Oxford, Oxford, UK, 1986. [Google Scholar]
- Rahmani, M.; Kim, Y.R.; Park, Y.B.; Jung, J.S. Mechanistic analysis of pavement damage and performance prediction based on finite element modeling with viscoelasticity and fracture of mixtures. LHI J. Land Hous. Urban Aff. 2020, 11, 95–104. [Google Scholar]
- Ambassa, Z.; Allou, F.; Petit, C.; Eko, R. Fatigue life prediction of an asphalt pavement subjected to multiple axle loadings with viscoelastic FEM. Constr. Build. Mater. 2013, 43, 443–452. [Google Scholar] [CrossRef]
- Leonardi, G.; Lo Bosco, D.; Palamara, R.; Suraci, F. Finite element analysis of geogrid-stabilized unpaved roads. Sustainability 2020, 12, 1929. [Google Scholar] [CrossRef]
- Sawan, A.M.M.I. Finite Elements Performance Analysis of Asphalt Pavement Mixtures Modified Using Nano-Additives. Master’s Thesis, The Higher Institute of Engineering, El-Shorouk Academy, Cairo, Egypt, 2013. [Google Scholar]
- Mulungye, R.M.; Owende, P.M.O.; Mellon, K. Finite element modelling of flexible pavements on soft soil subgrades. Mater. Des. 2007, 28, 739–756. [Google Scholar] [CrossRef]
- Barksdale, R.D. Performance of crushed-stone base courses. Transp. Res. Rec. 1984, 954, 78–87. [Google Scholar]
- Liang, P.; Yang, Y.; Huang, H.; Liu, J.; Guo, N. Experimental study on fractal characteristics of particle size distribution by repeated compaction of road recycling crushed stone. Appl. Sci. 2021, 12, 10303. [Google Scholar] [CrossRef]
- Rural Road Manual. Indian Roads Congress Special Publication 20; The Indian Roads Congress: New Delphi, India, 2002; 383p.
- Markó, G.; Primusz, P.; Péterfalvi, J. Measuring the bearing capacity of forest roads with an improved Benkelman beam apparatus. Acta Silv. Lignaria Hung. 2013, 9, 97–110. [Google Scholar] [CrossRef]


| Road System Type | Layer’s Thickness [mm] and the Modulus of Elasticity [MPa] | |||||||
|---|---|---|---|---|---|---|---|---|
| Mixed Crushed Stone | Crushed Stone, Assortment 63/90 | Pitching of Crushed Stone | Ballast Layer | |||||
| [mm] | [MPa] | [mm] | [MPa] | [mm] | [MPa] | [mm] | [MPa] | |
| I.1 | 120 | 500 | 150 | 400 | 100 | 300 | 200 | 152 |
| I.2 | 120 | 500 | 150 | 400 | 100 | 300 | 300 | 182 |
| I.3 | 120 | 500 | 150 | 400 | 100 | 300 | 400 | 208 |
| II.1 | 120 | 500 | - | 150 | 300 | 200 | 152 | |
| II.2 | 120 | 500 | - | 150 | 300 | 300 | 182 | |
| II.3 | 120 | 500 | - | 150 | 300 | 400 | 208 | |
| III.1 | 100 | 300 | - | 250 | 300 | 200 | 152 | |
| III.2 | 100 | 300 | - | 250 | 300 | 300 | 182 | |
| III.3 | 100 | 300 | - | 250 | 300 | 400 | 208 | |
| Truck Payload [tons] | Front Axle Loading [tons] | Rear Axles Loading of the Tractor [tons] | Loading on Semi-Trailer Axles [tons] |
|---|---|---|---|
| 25 | 3.750 | 10 | 11.250 |
| 35 | 5.250 | 14 | 15.750 |
| 45 | 6.750 | 18 | 20.250 |
| Loading [tons] | 25 tons | 35 tons | 45 tons | ||||||
|---|---|---|---|---|---|---|---|---|---|
| Type of structure | I.1 | I.2 | I.3 | I.1 | I.2 | I.3 | I.1 | I.2 | I.3 |
| Displacement [mm] | 0.625 | 0.577 | 0.535 | 0.874 | 0.807 | 0.749 | 1.124 | 1.038 | 0.963 |
| Type of structure | II.1 | II.2 | II.3 | II.1 | II.2 | II.3 | II.1 | II.2 | II.3 |
| Displacement [mm] | 0.743 | 0.673 | 0.616 | 1.040 | 0.943 | 0.862 | 1.337 | 1.212 | 1.108 |
| Type of structure | III.1 | III.2 | III.3 | III.1 | III.2 | III.3 | III.1 | III.2 | III.3 |
| Displacement [mm] | 0.737 | 0.681 | 0.632 | 1.031 | 0.953 | 0.885 | 1.326 | 1.225 | 1.138 |
| Maximum Deformations (mm) | ||||||||||
|---|---|---|---|---|---|---|---|---|---|---|
| Front Axle | Rear Axle | Semi-Trailer’s Axles | ||||||||
| Type of structure | I.1 | I.2 | I.3 | I.1 | I.2 | I.3 | I.1 | I.2 | I.3 | |
| Loading (tons) | 25 | 0.21 | 0.19 | 0.18 | 0.56 | 0.51 | 0.48 | 0.62 | 0.58 | 0.53 |
| 35 | 0.29 | 0.27 | 0.25 | 0.78 | 0.72 | 0.67 | 0.87 | 0.81 | 0.75 | |
| 45 | 0.37 | 0.35 | 0.32 | 1.00 | 0.92 | 0.86 | 112 | 1.04 | 0.96 | |
| Type of structure | II.1 | II.2 | II.3 | II.1 | II.2 | II.3 | II.1 | II.2 | II.3 | |
| Loading (tons) | 25 | 0.25 | 0.22 | 0.21 | 0.66 | 0.60 | 0.55 | 0.74 | 0.67 | 0.62 |
| 35 | 0.35 | 0.31 | 0.29 | 0.92 | 0.84 | 0.77 | 1.04 | 0.94 | 0.86 | |
| 45 | 0.45 | 0.40 | 0.37 | 1.19 | 1.08 | 0.98 | 1.34 | 1.21 | 1.11 | |
| Type of structure | III.1 | III.2 | III.3 | III.1 | III.2 | III.3 | III.1 | III.2 | III.3 | |
| Loading (tons) | 25 | 0.25 | 0.23 | 0.21 | 0.65 | 0.60 | 0.56 | 0.74 | 0.68 | 0.63 |
| 35 | 0.34 | 0.32 | 0.30 | 0.92 | 0.85 | 0.79 | 1.03 | 0.95 | 0.89 | |
| 45 | 0.44 | 0.41 | 0.38 | 1.18 | 1.09 | 1.01 | 1.33 | 1.22 | 1.14 | |
| Loading [tons] | 25 tons | 35 tons | 45 tons | ||||||
|---|---|---|---|---|---|---|---|---|---|
| Type I road systems | I.1 | I.2 | I.3 | I.1 | I.2 | I.3 | I.1 | I.2 | I.3 |
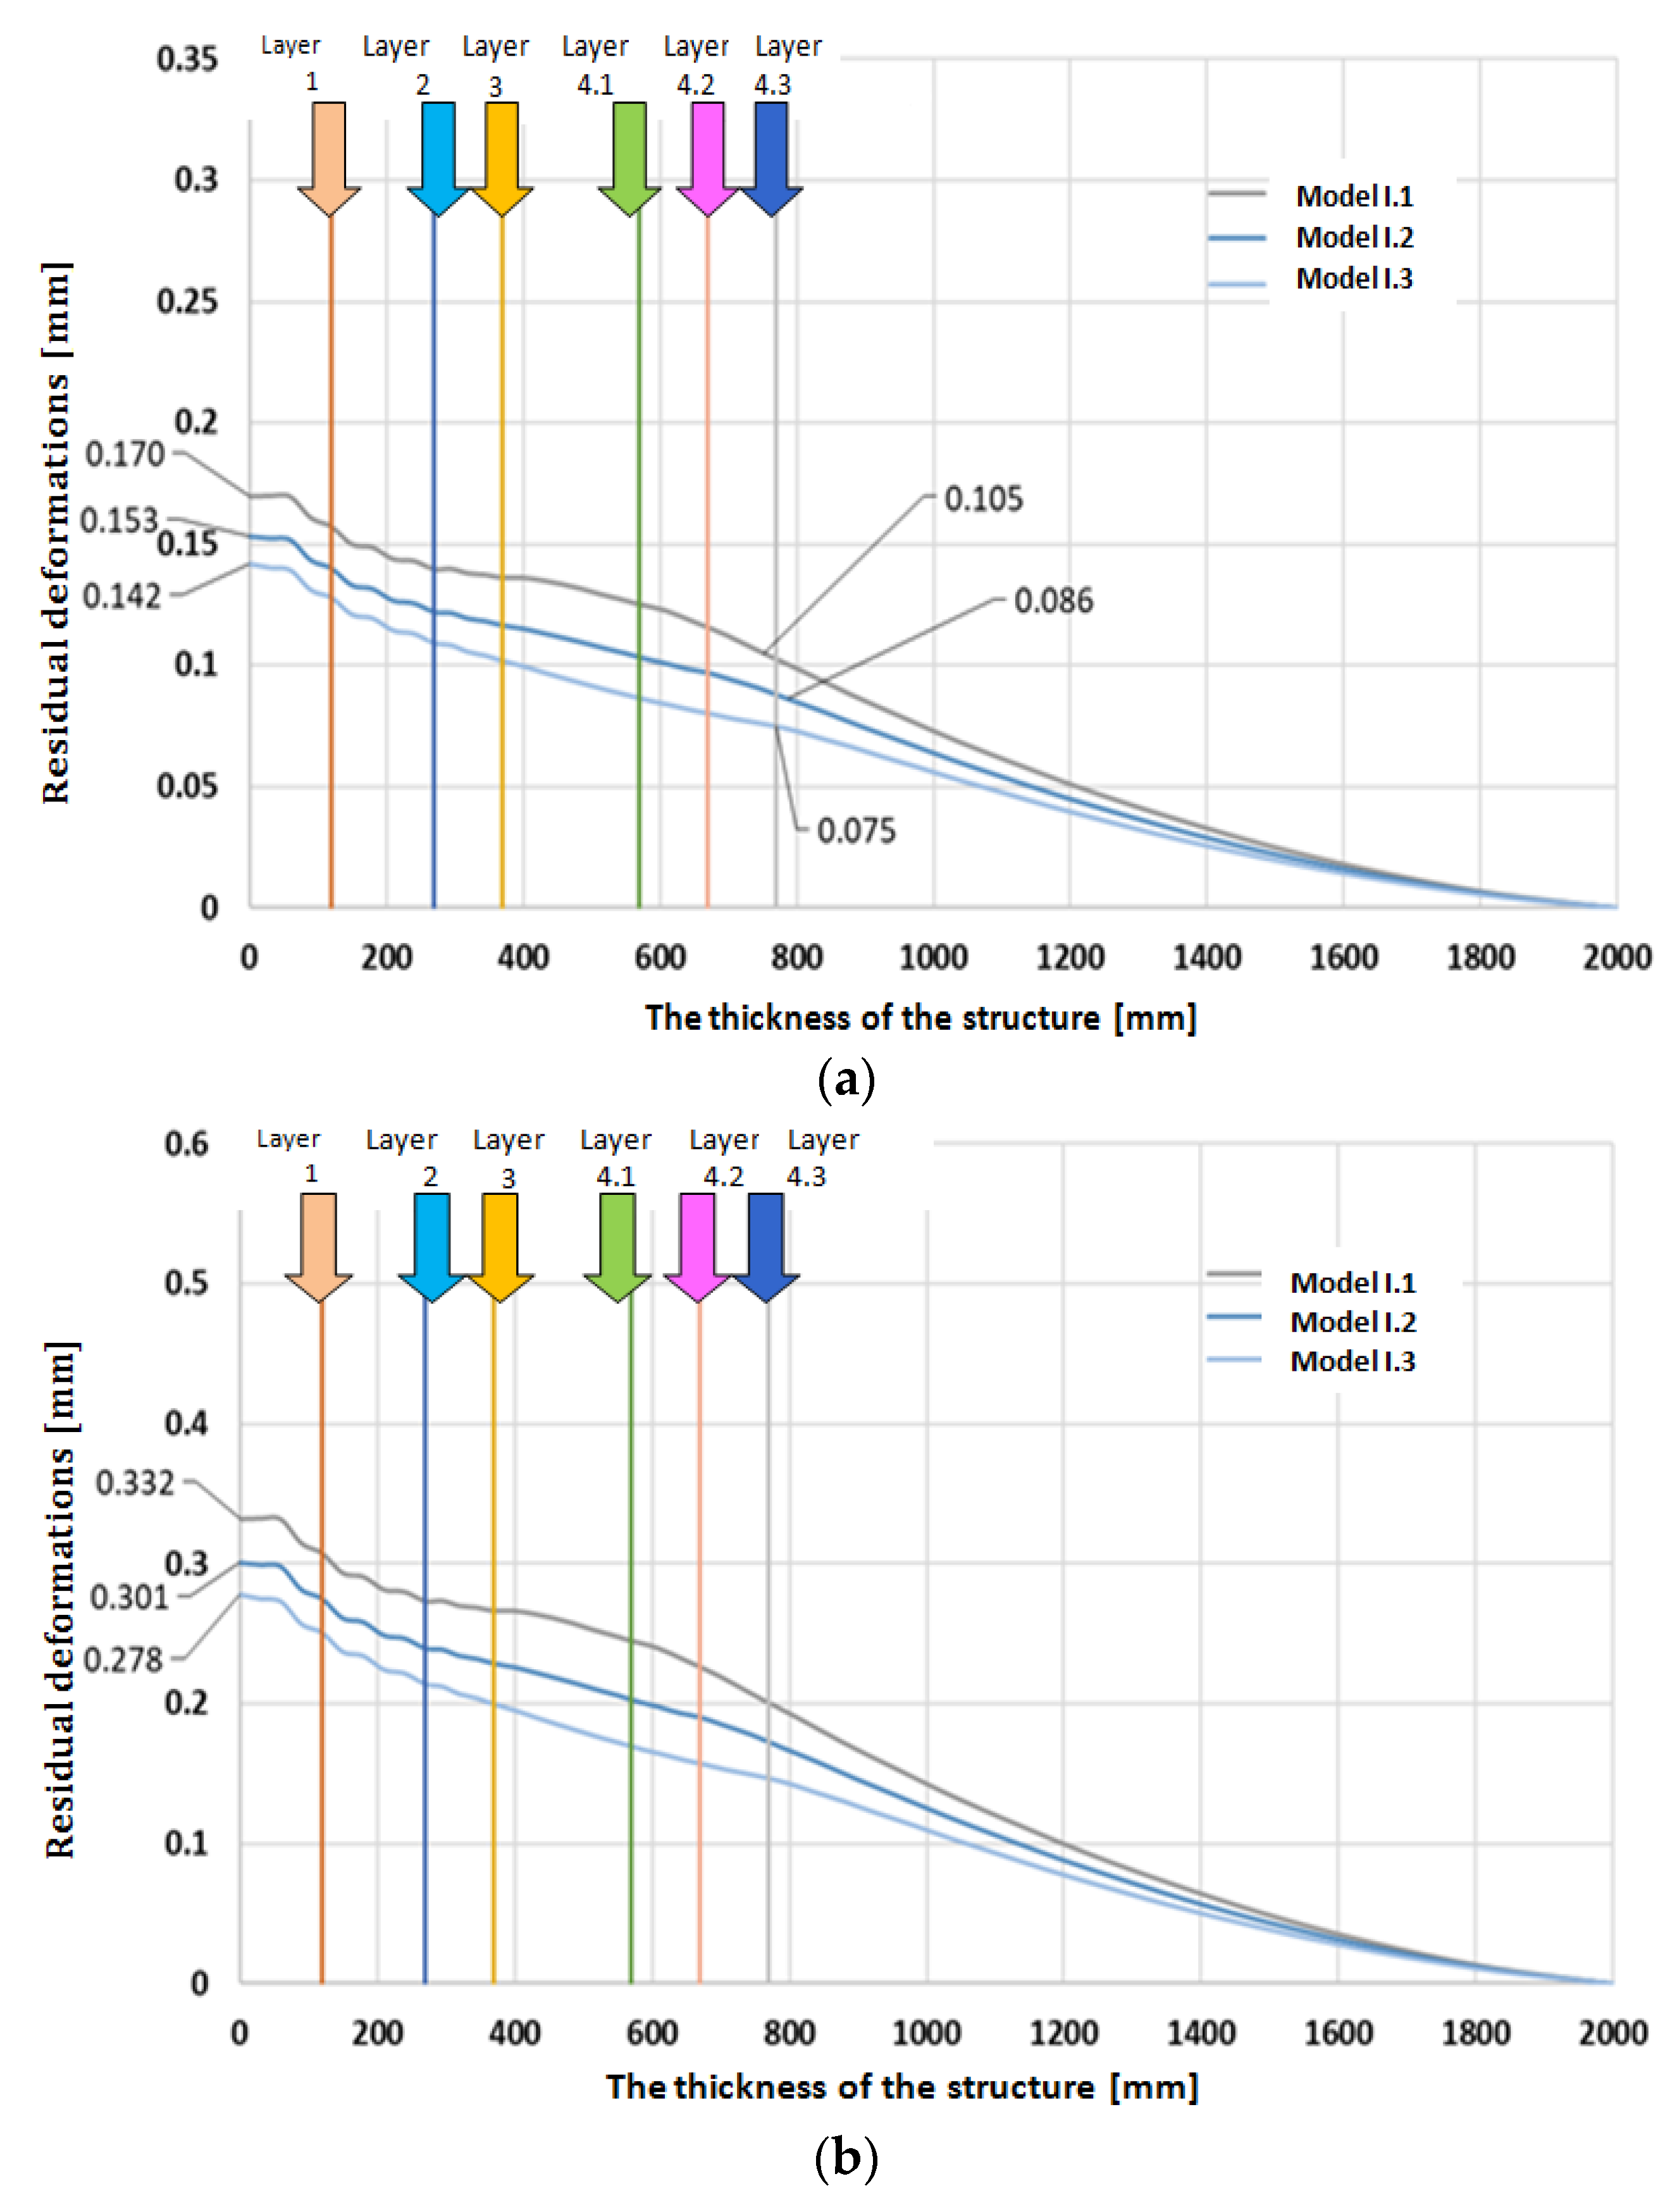
| Residual deformations [mm] | 0.170 | 0.153 | 0.142 | 0.332 | 0.301 | 0.278 | 0.550 | 0.497 | 0.459 |
| Type II road systems | II.1 | II.2 | II.3 | II.1 | II.2 | II.3 | II.1 | II.2 | II.3 |
| Residual deformations [mm] | 0.264 | 0.225 | 0.199 | 0.518 | 0.441 | 0.389 | 0.856 | 0.729 | 0.643 |
| Type III road systems | III.1 | III.2 | III.3 | III.1 | III.2 | III.3 | III.1 | III.2 | III.3 |
| Residual deformations [mm] | 0.300 | 0.270 | 0.248 | 0.588 | 0.529 | 0.487 | 0.972 | 0.874 | 0.805 |
Publisher’s Note: MDPI stays neutral with regard to jurisdictional claims in published maps and institutional affiliations. |
© 2022 by the authors. Licensee MDPI, Basel, Switzerland. This article is an open access article distributed under the terms and conditions of the Creative Commons Attribution (CC BY) license (https://creativecommons.org/licenses/by/4.0/).
Share and Cite
Mușat, E.-C.; Bitir, I. Evaluating the Forest Road Systems Subjected to Different Loadings by Using the Finite Element Method. Forests 2022, 13, 1872. https://doi.org/10.3390/f13111872
Mușat E-C, Bitir I. Evaluating the Forest Road Systems Subjected to Different Loadings by Using the Finite Element Method. Forests. 2022; 13(11):1872. https://doi.org/10.3390/f13111872
Chicago/Turabian StyleMușat, Elena-Camelia, and Ioan Bitir. 2022. "Evaluating the Forest Road Systems Subjected to Different Loadings by Using the Finite Element Method" Forests 13, no. 11: 1872. https://doi.org/10.3390/f13111872
APA StyleMușat, E.-C., & Bitir, I. (2022). Evaluating the Forest Road Systems Subjected to Different Loadings by Using the Finite Element Method. Forests, 13(11), 1872. https://doi.org/10.3390/f13111872