1. Introduction
A central element of forest planning is prediction of plantation growth and yield. Growth models can be broadly grouped as being empirical, process-based or hybrid, although model categorisation is often quite arbitrary as they all lie along a spectrum of empiricism [
1]. Empirical models fit statistical relationships to historical growth data and are not explicitly linked to the mechanisms that determine growth [
2,
3]. Through incorporation of the key physiological processes that influence growth, process-based models can characterise tree and stand development [
4,
5,
6] and are often used for understanding and exploring system behaviour [
2,
7,
8,
9]. Hybrid models combine useful features from both statistical and process-based approaches and aim to utilise physiological knowledge while simultaneously incorporating inputs and outputs applicable to forest management [
6]. Although these models encompass many variations in structure, they are often more sensitive to the environment than empirical models as they incorporate links to climatic and edaphic information [
10,
11,
12,
13] and do not require the parameterisation of process-based models [
6]. Although hybrid models and the simpler process-based models are occasionally used by forest managers [
14], almost all growth models used for operational management planning are empirical [
1].
Empirical models may operate at the individual tree level or the stand level as in the model described in this paper. Such models generally include several interlinked components. Growth and mortality functions are a minimum requirement but there are often also functions representing the impacts of silviculture and equations describing relationships between height, diameter and volume. One of the most important elements of a growth and yield model is the inclusion of a robust measure of site quality or productivity [
1]. As previously described [
15,
16], forest site productivity may be assessed in many different ways, including use of geocentric (earth-based) or phytocentric (plant-based) methods. Ideally, proxies for site quality should be correlated with site potential productivity, typically defined for forests as above-ground wood volume [
15]. Site quality is most often characterised using Site Index (
SI), which is usually defined as the mean height of dominant trees at a specified base age. Site Index was initially justified as a proxy for site quality in the late 19th century [
17,
18] and then later by Eichhorn’s rule [
19] which postulated a strong relationship between height and volume in even-aged stands, regardless of site and stand density.
However, analysis of growth data across a wide range of species has since demonstrated considerable site-dependent variation in volume at a given height [
20,
21,
22,
23,
24,
25,
26,
27,
28], which may vary by as much as 30% [
15]. Given the limitations of
SI, a metric based on volume is potentially more useful for describing site quality within growth models. However, this is not straightforward because, unlike height, volume is strongly influenced by stand density, especially at young ages. To understand this problem, we first need to consider the process used to incorporate
SI into growth model height equations. This involves the following steps described by Bailey and Clutter [
29] or more generally using the Generalised Algebraic Difference Approach (GADA) of Cieszewski and Bailey [
30]:
- (1)
A suitable sigmoidal function for predicting height from age, such as one of those listed by Zeide [
31], is chosen.
- (2)
One of the model parameters is chosen to act as a site-varying local parameter, transforming the equation into a dynamic model. If this is the asymptote parameter, the model is anamorphic, while if it is the time-scale parameter, the model is polymorphic with a common asymptote.
- (3)
The model is reformulated by replacing the local parameter with height at an arbitrary age. This allows it to project height growth from an initial measurement.
- (4)
By setting the arbitrary age to the SI base age, the model expresses height as a function of SI and age.
- (5)
Finally, the model is inverted to produce an SI equation which predicts SI from height and age.
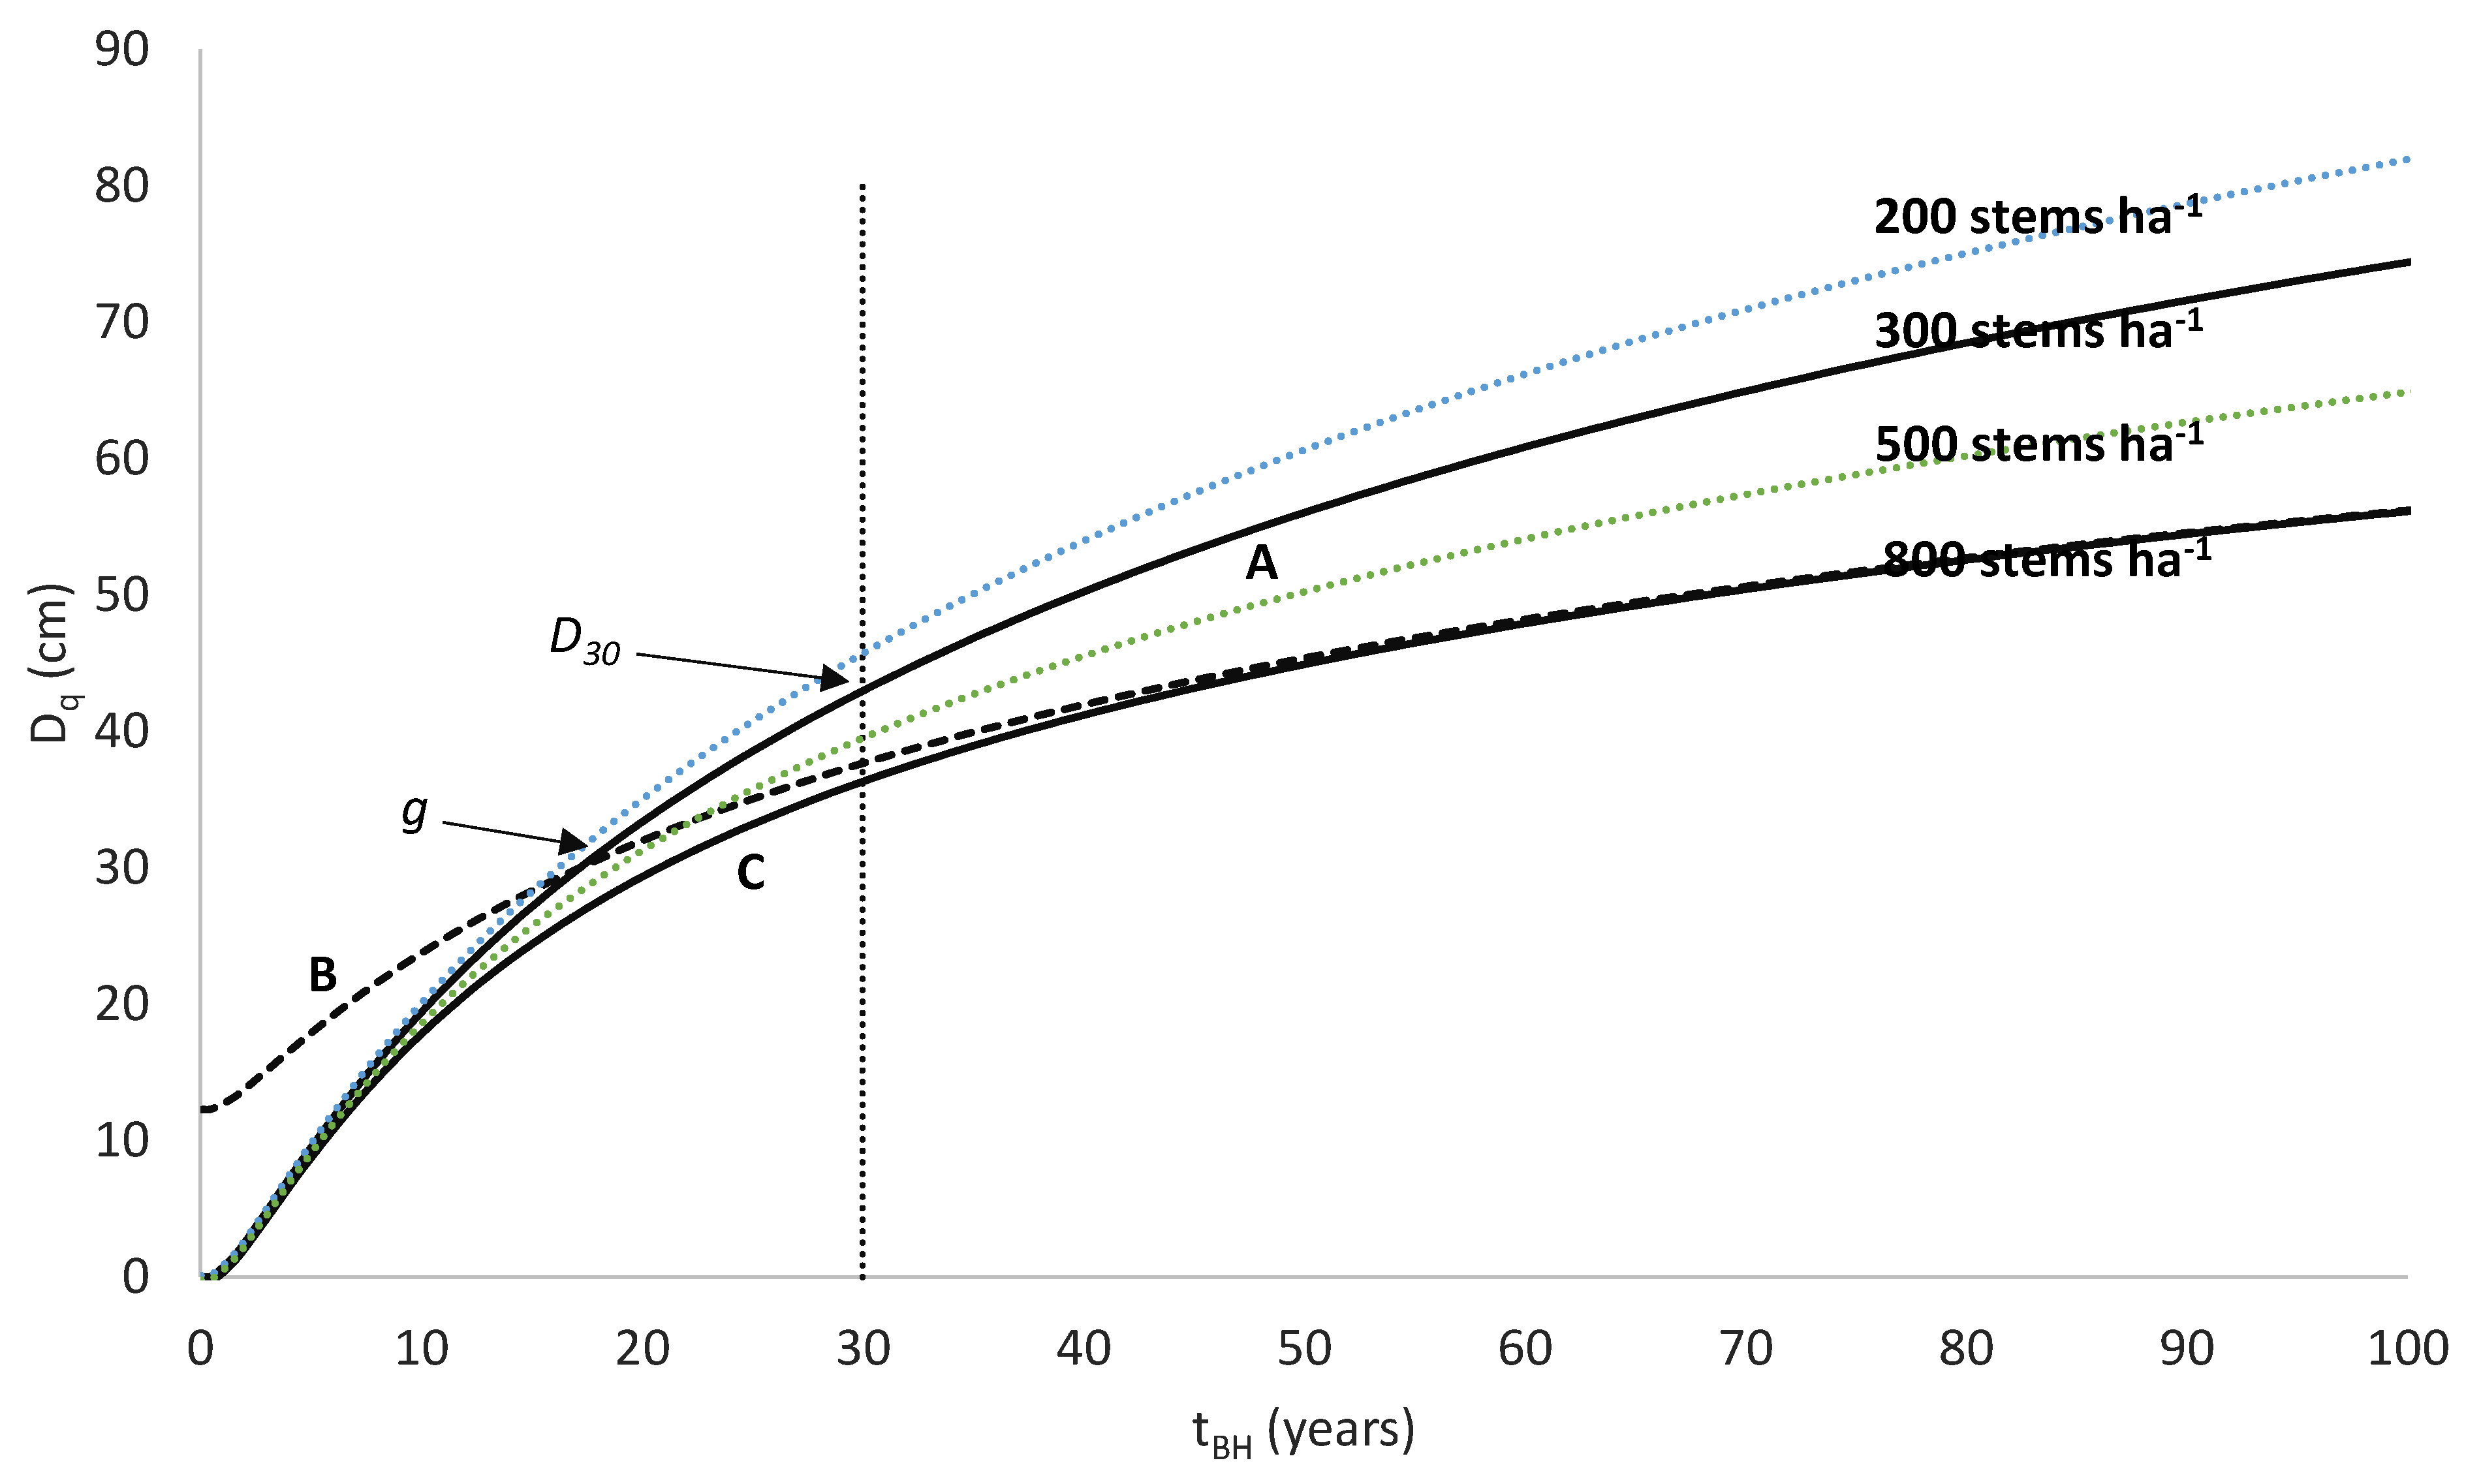
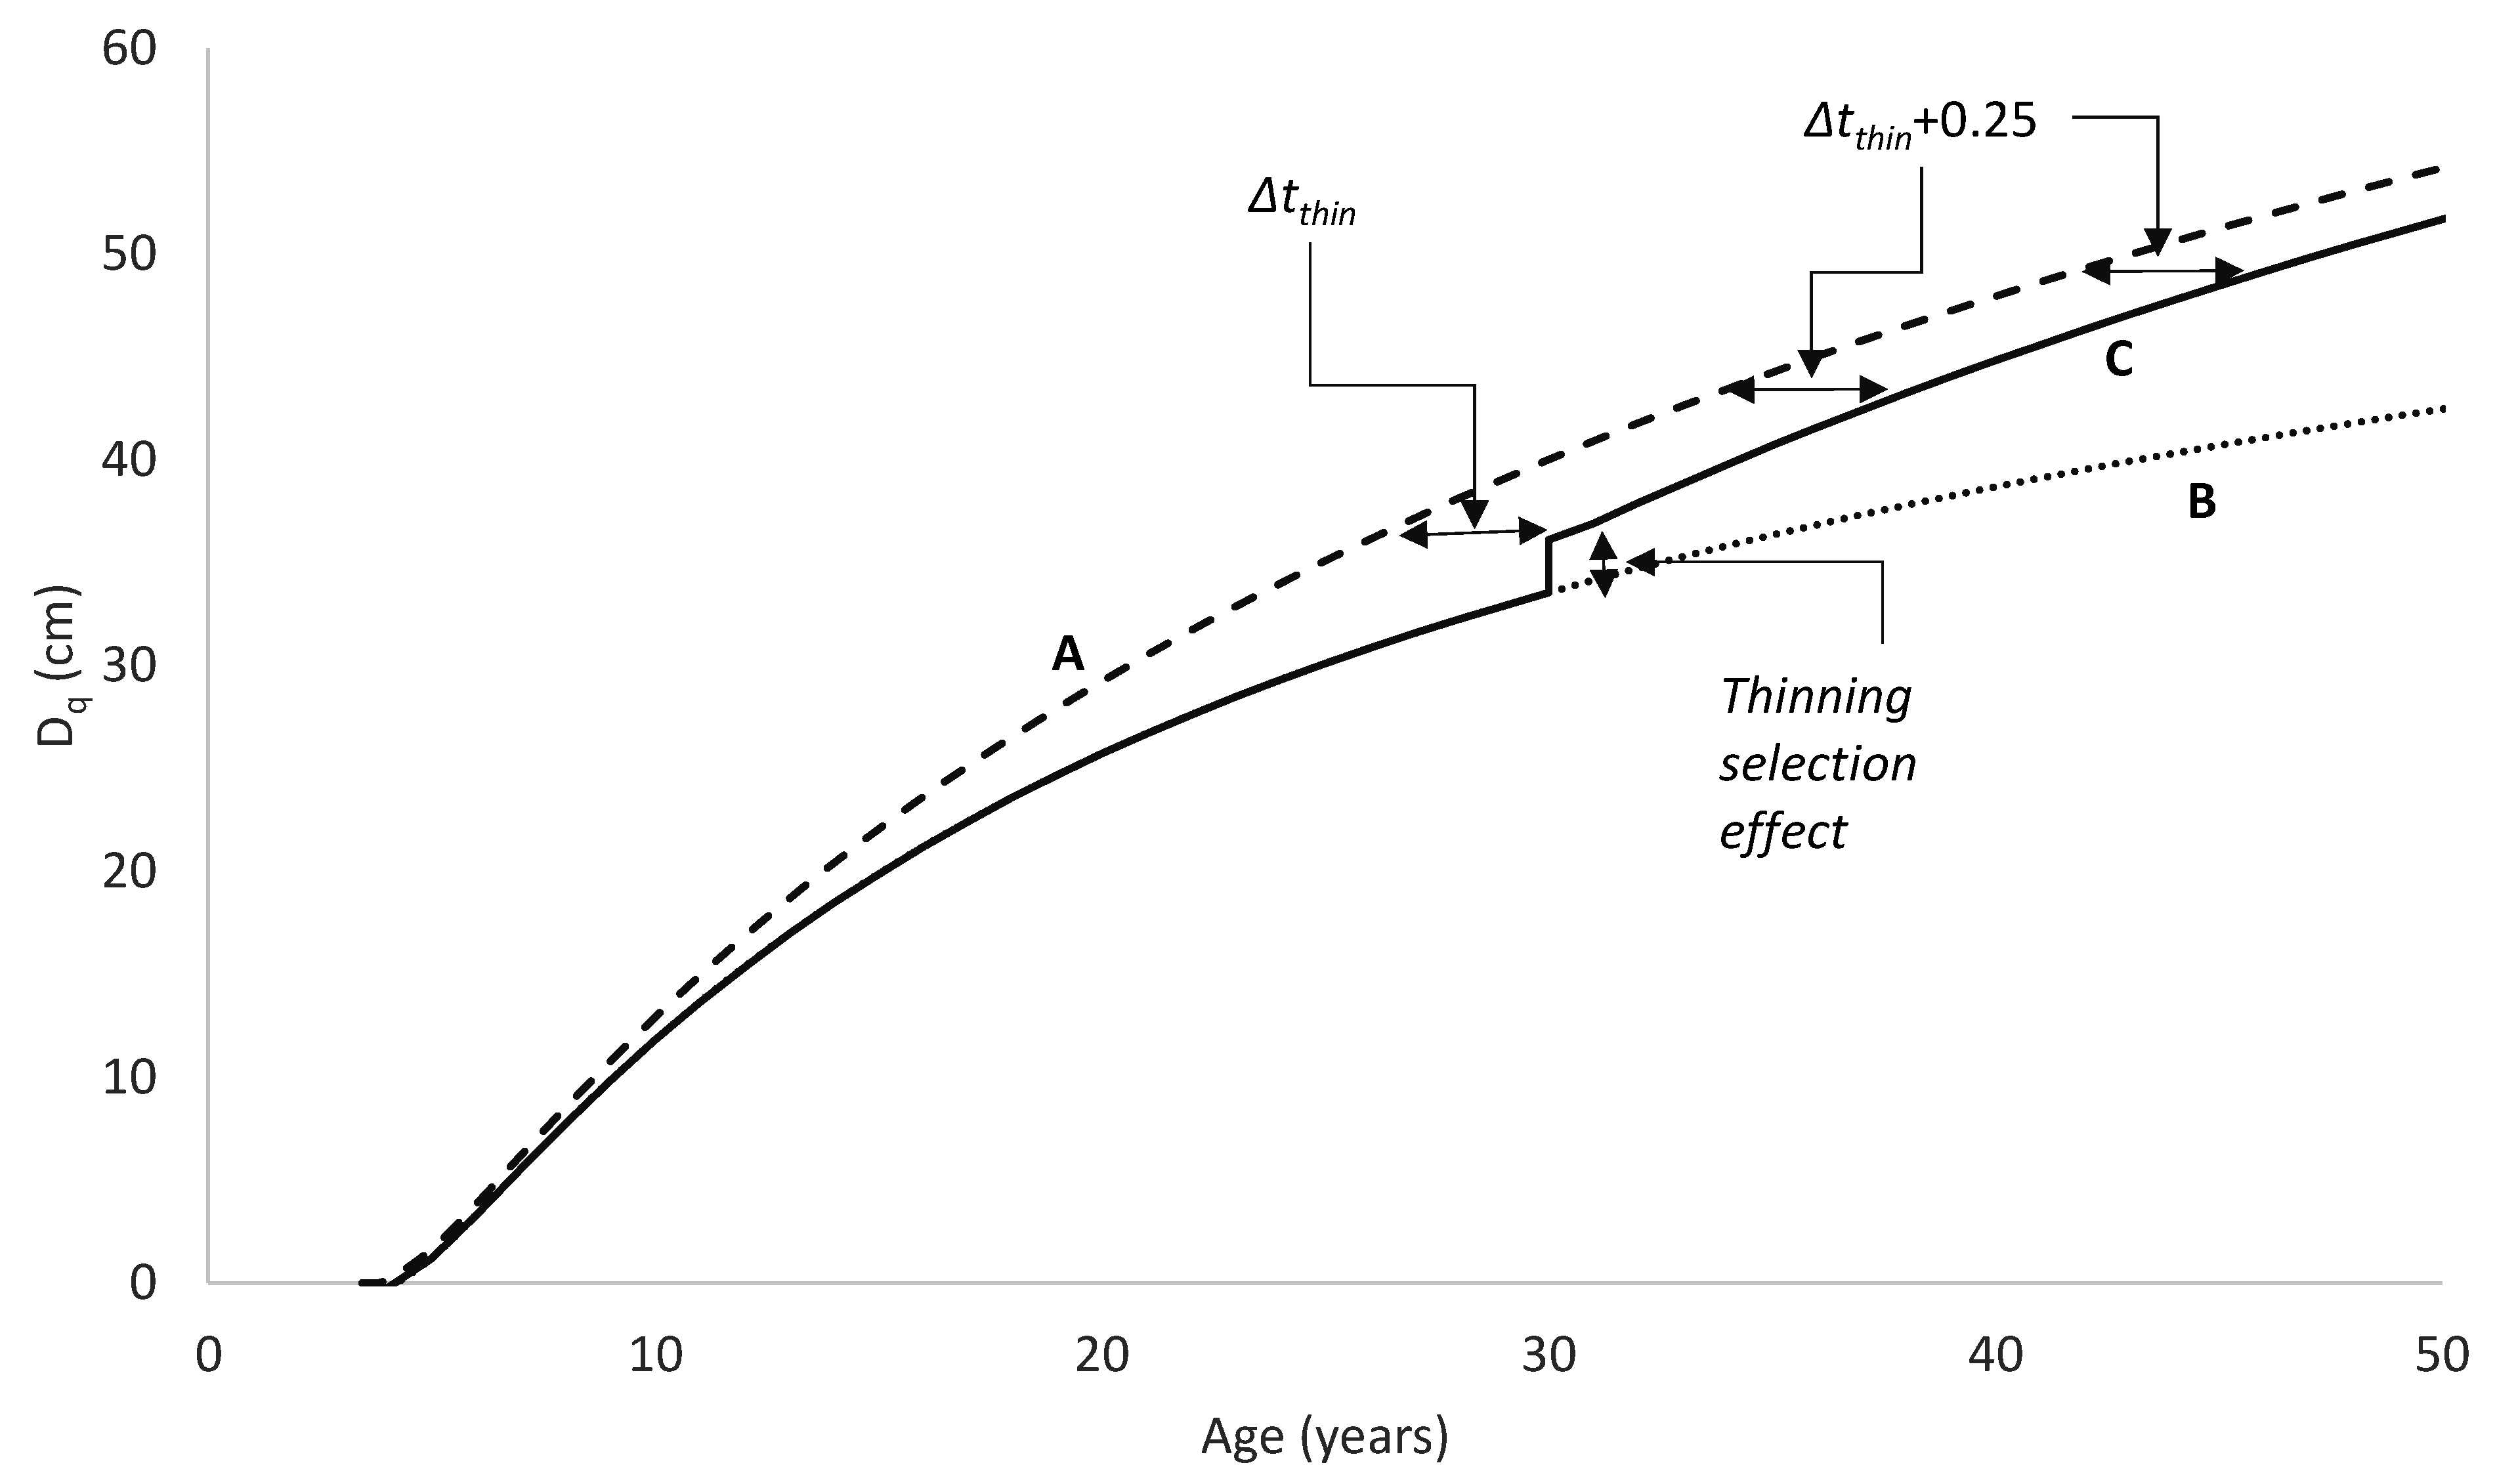
A similar process could be used to develop an equation of diameter growth, although only the first three steps would generally be useful. Steps 4 and 5, which would involve developing an index of diameter at a specified base age, would have little merit because diameter is influenced not only by site but also by stand density. Such a model could be used to project diameter forward in time from an initial measurement but could not readily be used to predict diameter for an alternative stand density at the same site. It would also have limitations in modelling the effects of thinning as it could not distinguish between thinned and unthinned stands with the same diameter and age, which would, however, be expected to follow different growth trajectories. A more fundamental limitation of such a model is that because it accounts for variation in diameter growth rate using a single local parameter, this parameter has to account for the effects of both stand density and site quality on diameter growth. At young ages, before competition develops, diameter is not affected by stand density, but growth rates between stand densities tend to diverge once competition begins to slow the diameter growth of more highly stocked stands. On the other hand, site quality might be expected to produce more of a scaled response, with higher productivity sites providing superior diameter growth at all ages. This suggests that diameter models should account separately for site productivity and stand density.
A solution to these problems is to include stand density in the diameter model formulation so that the model predicts diameter as a function of age and stand density. A diameter site index could then be developed, defining diameter at a base age and base stand density. A volume index based on the diameter index and SI which is an index of height productivity could also be derived from such a model. The data requirements for developing a model of this type are somewhat more demanding, consisting, at a minimum, of growth measurements covering a range of stand densities, ages and levels of site productivity. Ideally, measurements from permanent growth plots installed across the population should be supplemented by measurements from trials comprising a range of stand densities at one site.
An example of this type of model is the national growth model developed for New Zealand-grown radiata pine (
Pinus radiata D. Don), which uses a volume productivity index, the 300 Index [
24]. The 300 Index is defined as the stem volume mean annual increment (MAI) at age 30 years for a reference regime with a final stand density of 300 stems ha
−1. Research using New Zealand radiata pine plantations has shown that accurate and unbiased values for the 300 Index can be obtained using measurements taken from stands differing in age or stand density from those of the 300 Index reference regime [
24]. However, although this growth model has been widely accepted and used for prediction of radiata pine growth and yield within New Zealand, little research has developed similar growth models for other productive plantation species.
Coast redwood (
Sequoia sempervirens (Lamb.ex D. Don) Endl.) is a rapidly growing, shade-tolerant, evergreen conifer that is endemic to a narrow coastal strip in central California and southwest Oregon. Individuals within this species include some of the oldest and tallest living trees on Earth, which have reached ages that exceed 2200 years [
32,
33,
34] and heights of 115 m [
35]. Outside its native range, redwood has been widely planted within New Zealand, where growth rates of redwood often exceed those of radiata pine on warm sites with little seasonal water deficit [
36]. Despite this, radiata pine has been far more widely planted within New Zealand, where it constitutes 90% of plantation area [
37], with redwood comprising less than 1% [
38]. Given that redwood is one of the most promising alternatives to radiata pine, it would be advantageous to develop a growth model based on the 300 Index so that direct growth comparisons can be made between the two species. Such a growth model would allow growers to optimise site selection and silvicultural treatments for redwood, potentially incentivising further afforestation using this species.
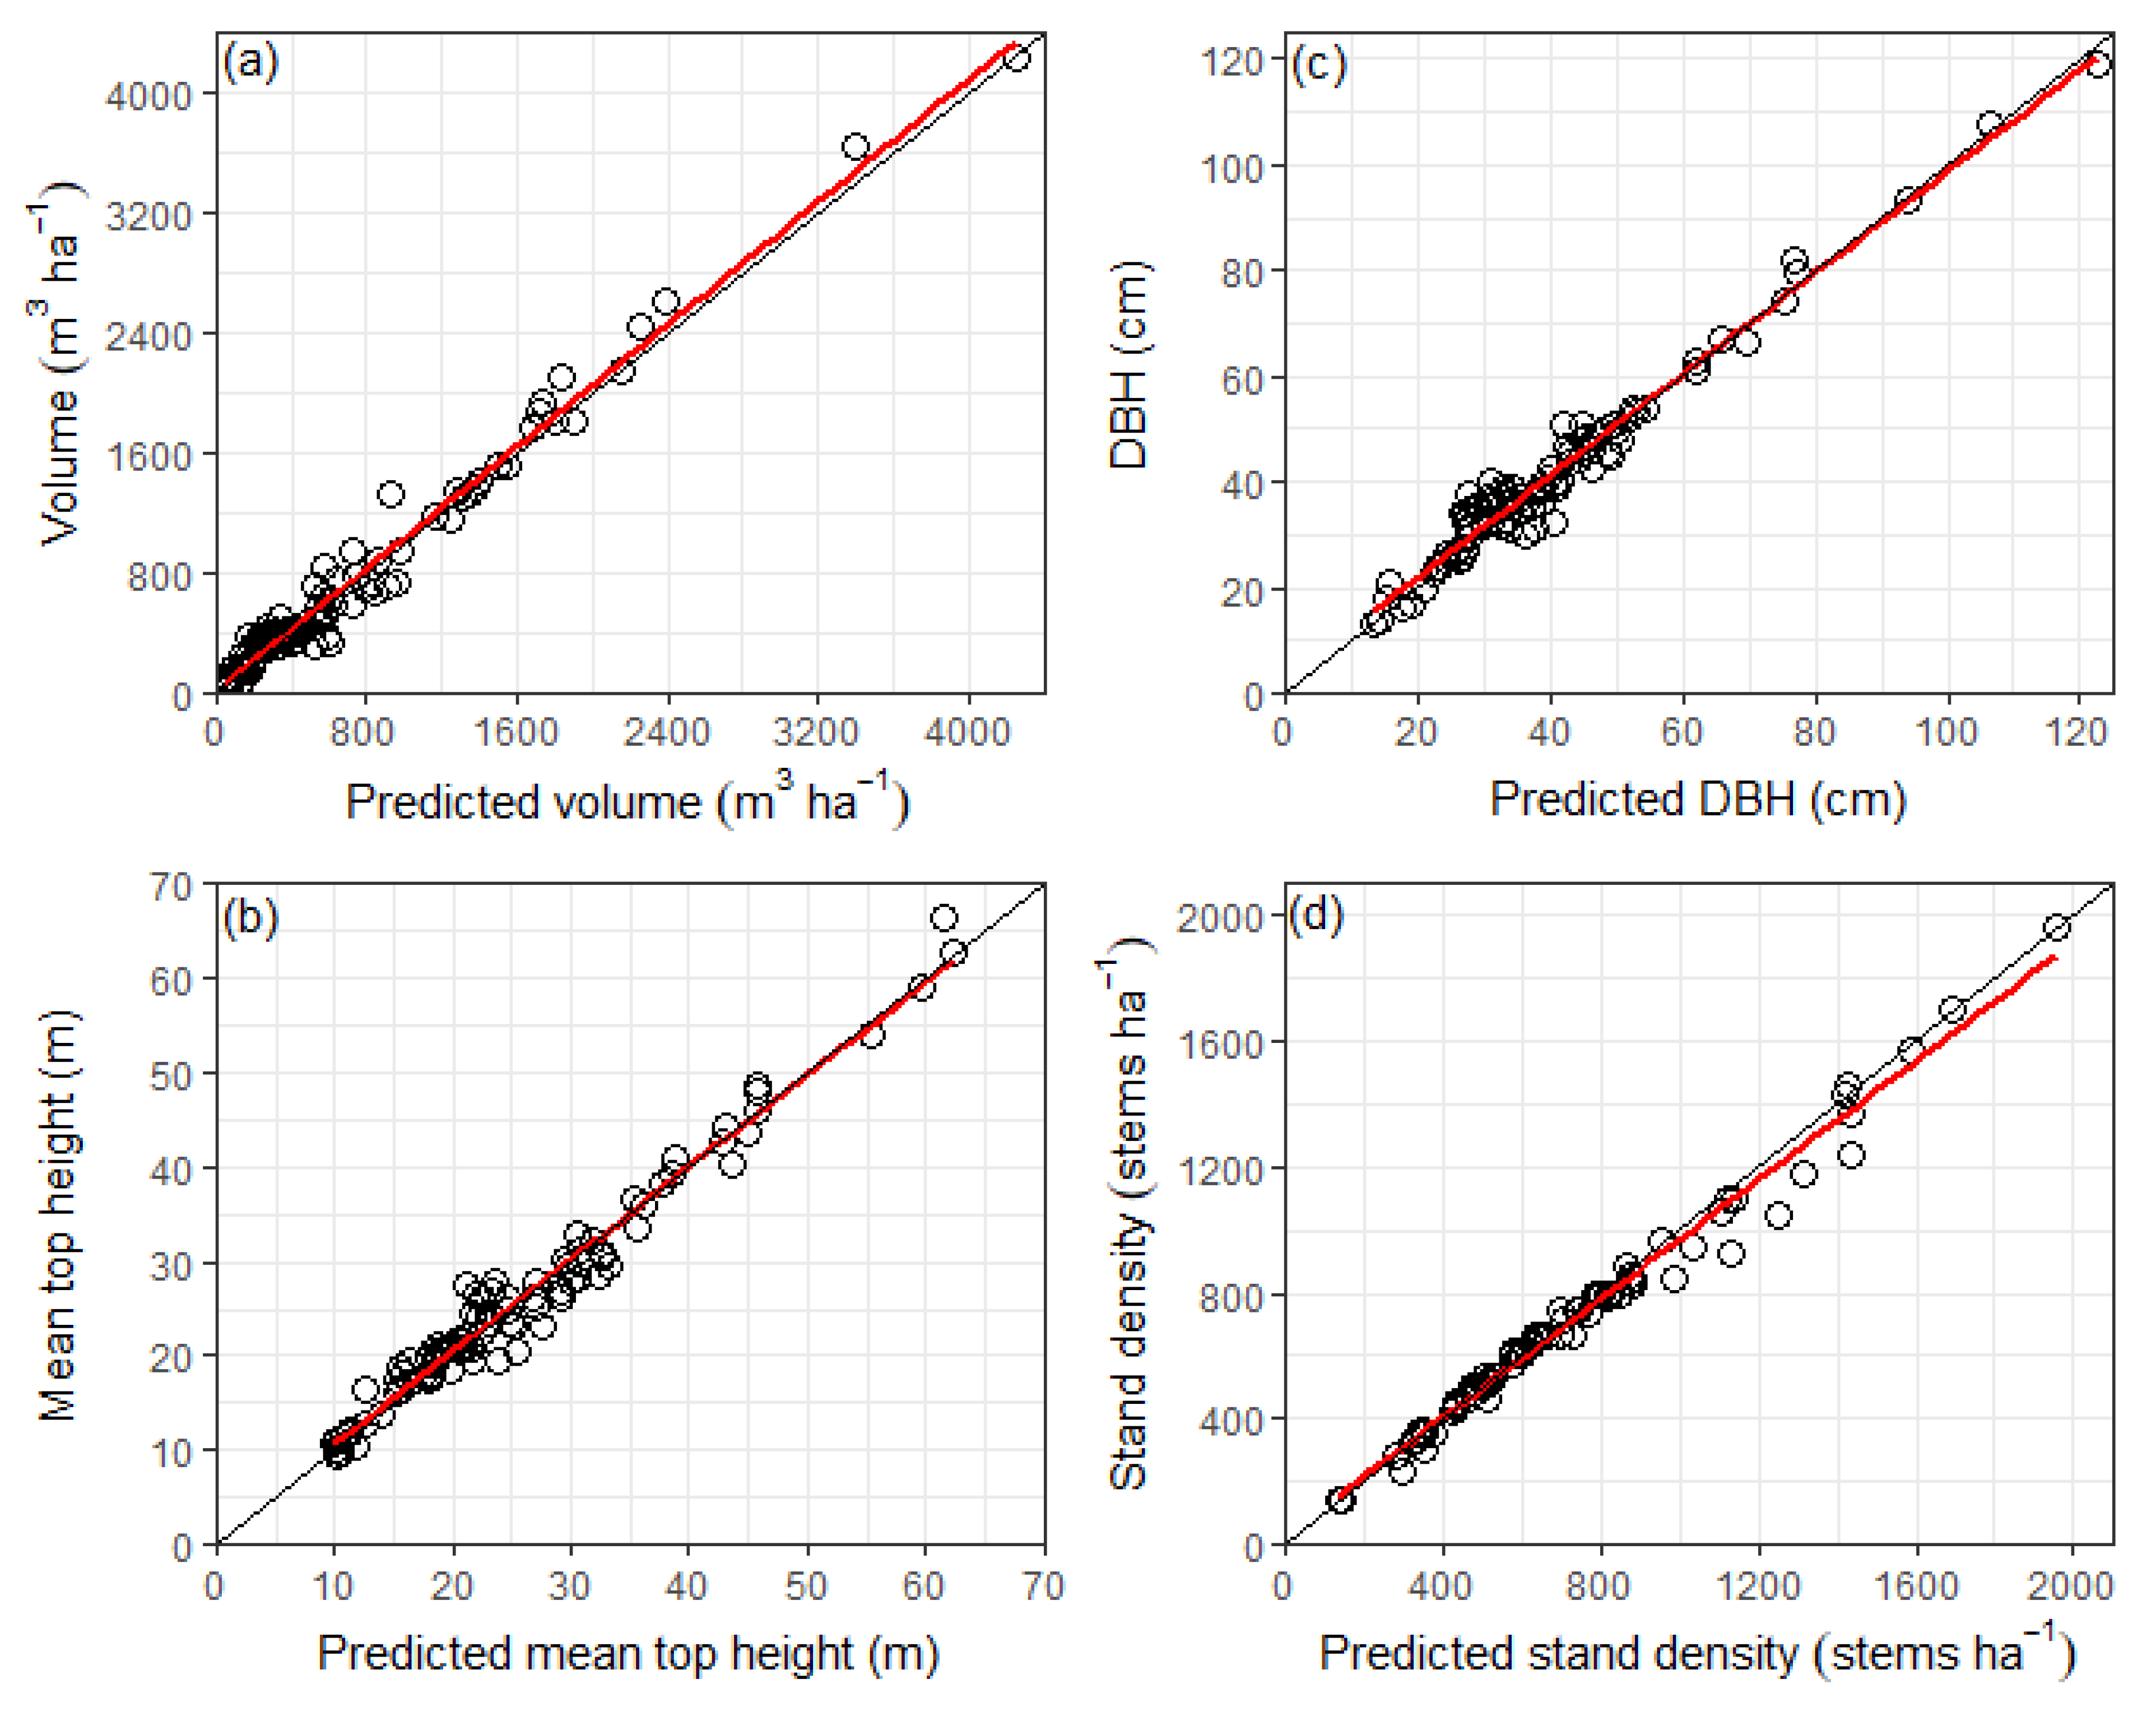
The objective of this study was to develop a stand-level growth model for plantation-grown redwood in New Zealand using two site productivity indices to characterise site quality, namely the 300 Index and SI. Requirements of the model were that it should predict common stand-level forest variables, including mean top height, quadratic mean diameter, stand density, basal area and stem volume, across a variety of stand densities and thinning regimes. This paper presents the structure and fit of the model and provides a comparison of growth predictions for redwood with those produced by an existing radiata pine growth model of similar form.
4. Discussion
In contrast to most empirical models that only use
SI, the redwood growth model described in this paper uses both
SI and 300 Index to more fully describe site productivity. Site quality was more robustly described using the 300 Index as this metric is a direct measure of site productivity, which is typically defined for forests as above-ground wood volume. Site Index has the advantage of not being greatly influenced by stand density, but its use as an index of site quality depends on the assumption that height and diameter growth are closely related at a constant stand density. However,
SI was only able to account for 59% of the variation in the volume-based 300 Index within the dataset used to develop the growth model (i.e., r = 0.77, see
Table 11). In contrast, the index of
BA at a base age and stand density had a very high correlation with the 300 Index (r = 0.96), demonstrating the greater importance of diameter and stand density in regulating volume. It is also interesting to note the relatively weak correlation between
SI and the
BA index (r = 0.59), suggesting that the environmental drivers of height and
BA growth for redwood are different, which closely aligns with previous research [
43,
44].
The equation used by the model to predict diameter growth as a function of age, stand density and site is based on an approach that has been successfully used to model diameter growth in New Zealand-grown radiata pine. This suggests that the function may be generally suited for predicting diameter growth in even-aged forest stands of different species. The inclusion of stand density in the model formulation greatly enhances its utility and provides a considerable improvement over many current methods of modelling BA or diameter growth in forest stands.
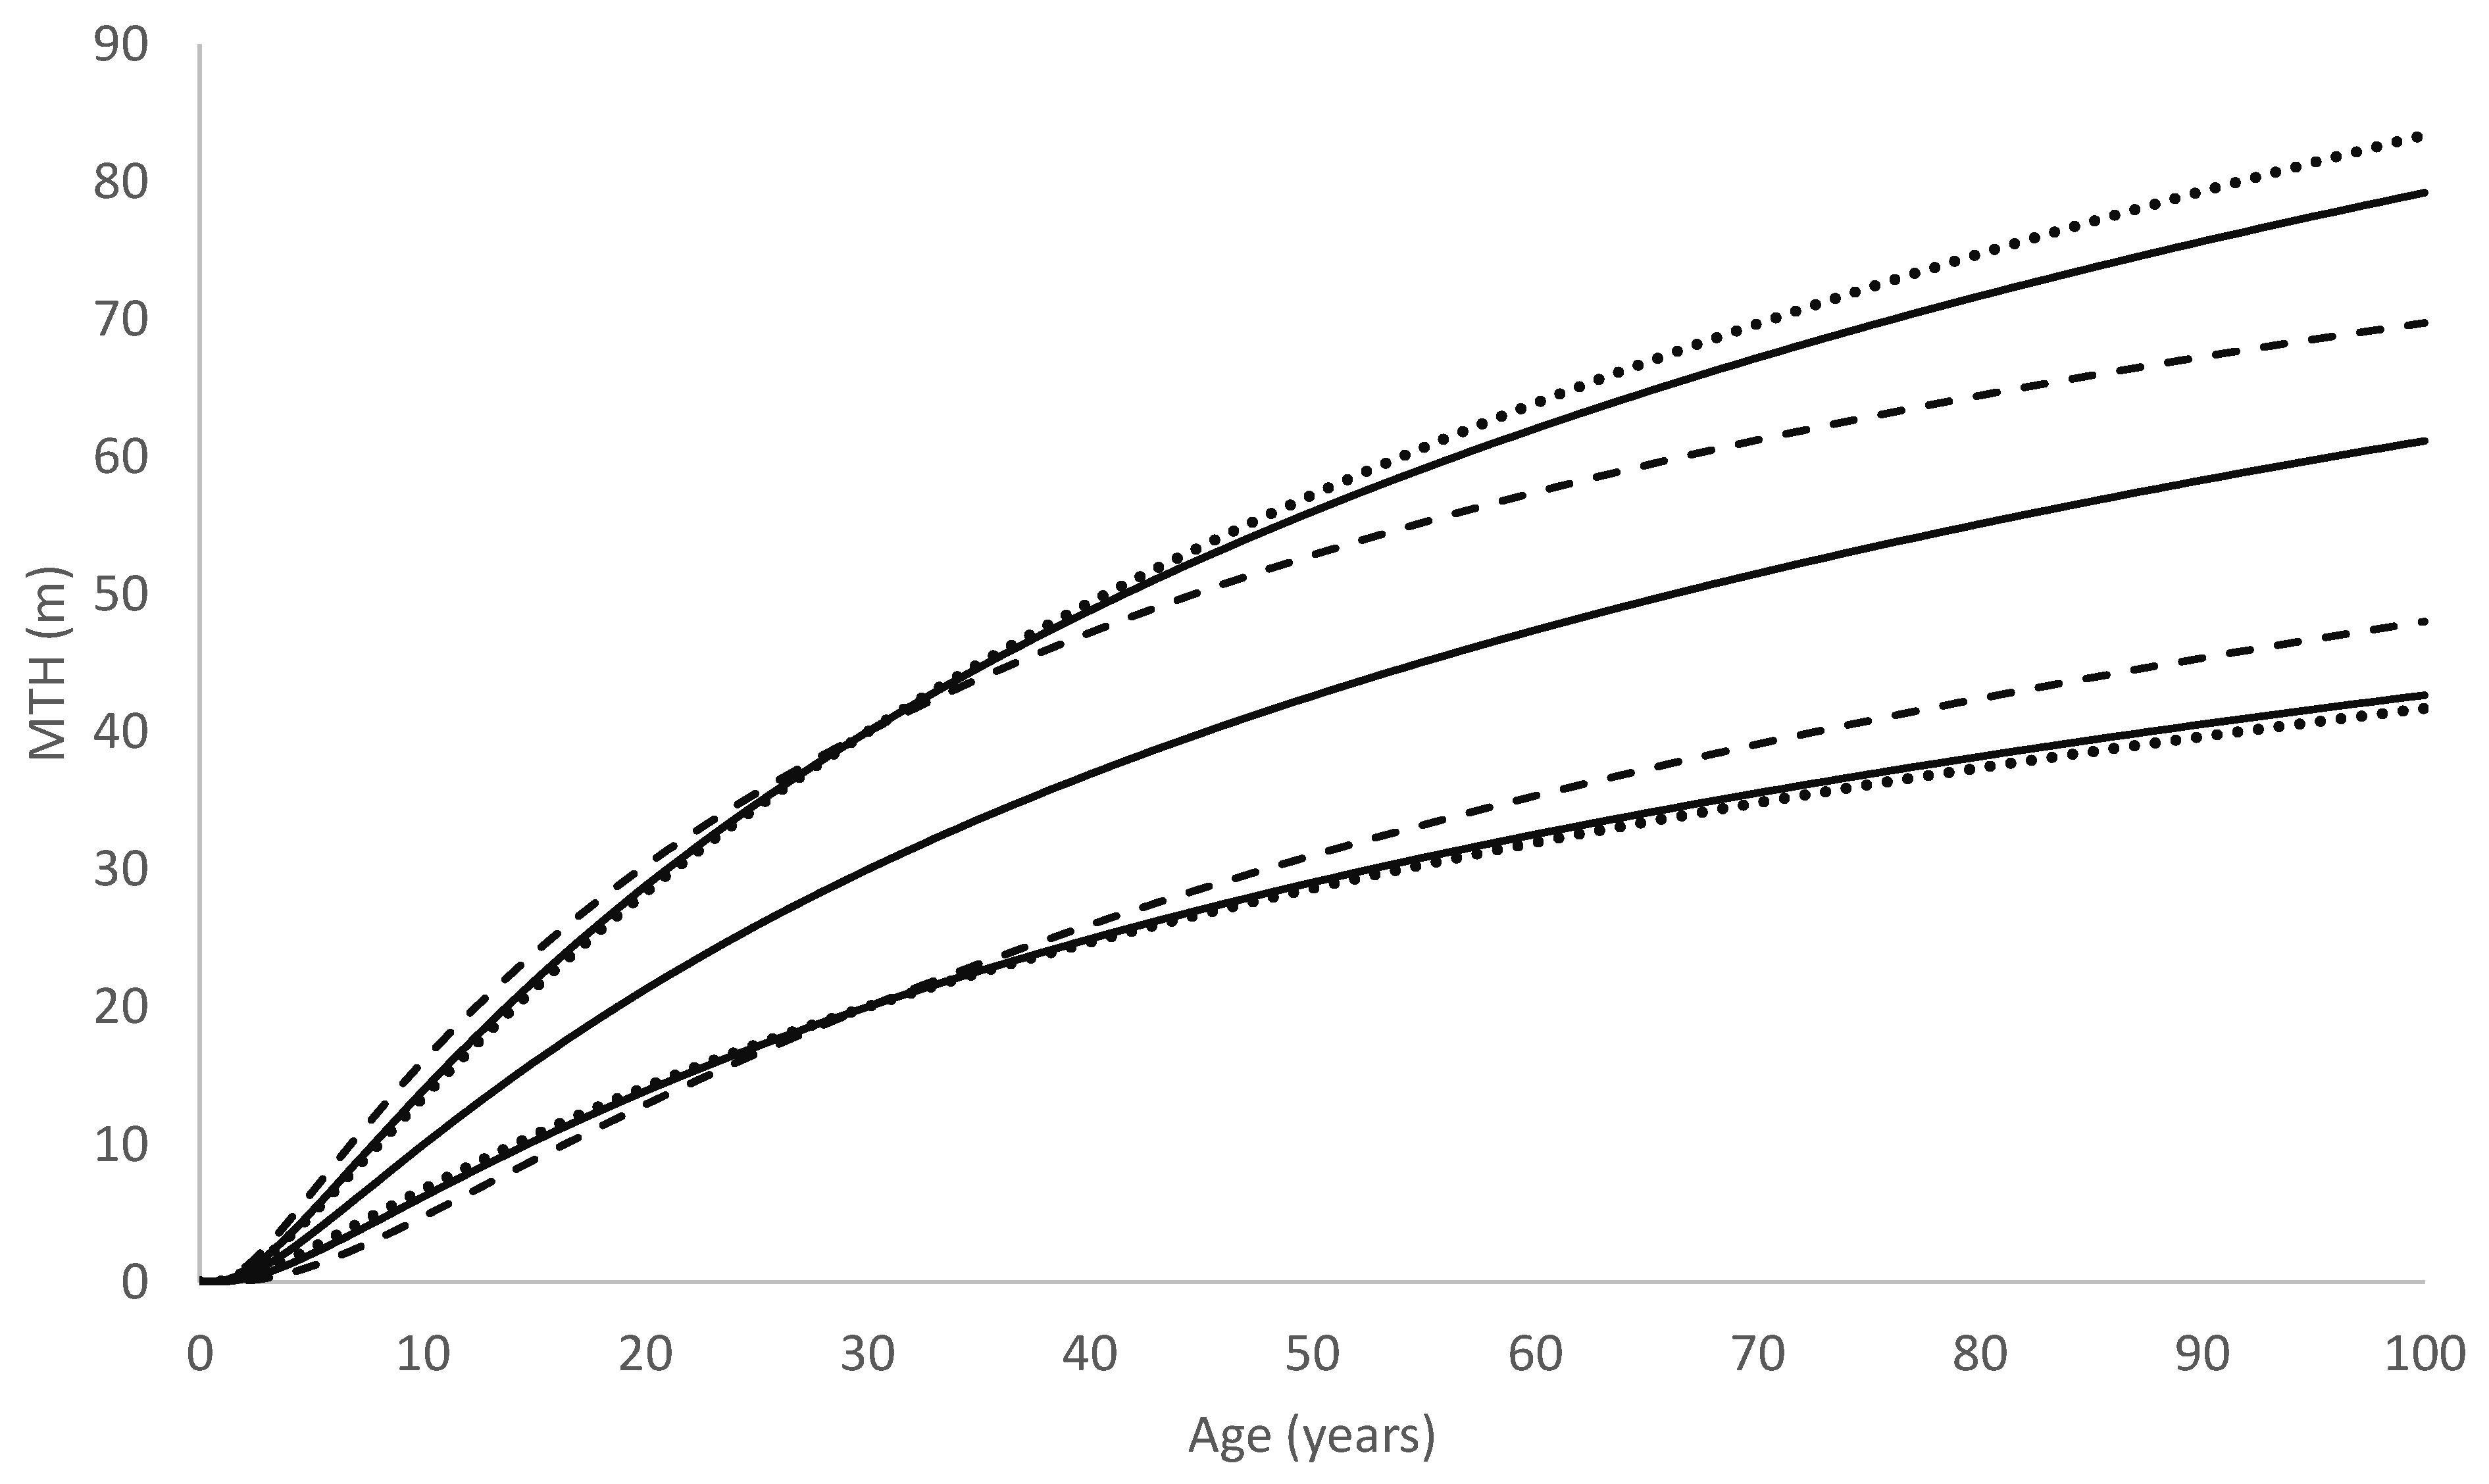
One difference between the redwood and radiata pine diameter models lies in their underlying sigmoidal growth equations; the Richards function is used in the radiata pine model whereas the redwood model uses the Korf function. The height equations used in both models also use these two functions—the Richards in the radiata pine model [
45] and the Korf in the new redwood model. In both cases, the equations were selected from a range of tested sigmoidal growth functions based on model fit to growth data. Although the Korf function is often applied to growth data, the Richards function is the most widely used equation for modelling tree and stand growth [
31] and appears especially suited for modelling radiata pine growth [
46,
47,
48].
A close examination of the properties of these two models revealed an interesting difference. The differential forms of growth functions such as the Richards and Korf models can be decomposed into two components representing growth expansion and decline [
31]. These components can be expressed as a ratio, with the numerator representing expansion and the denominator representing decline. Ignoring the scaling parameters
a and
b, the differential forms of the two models are
for the Richards model and
for the Korf model. The growth expansion components are similar for both models and depend on tree size,
y, with growth expansion increasing in proportion to
y (Korf) or to a power of
y (Richards). Although the growth decline components of both models are related to age,
t, rather than size, they differ greatly. In the Richards model, growth decline increases exponentially with age, whereas in the Korf model, it increases more steadily in proportion to
tc+1.
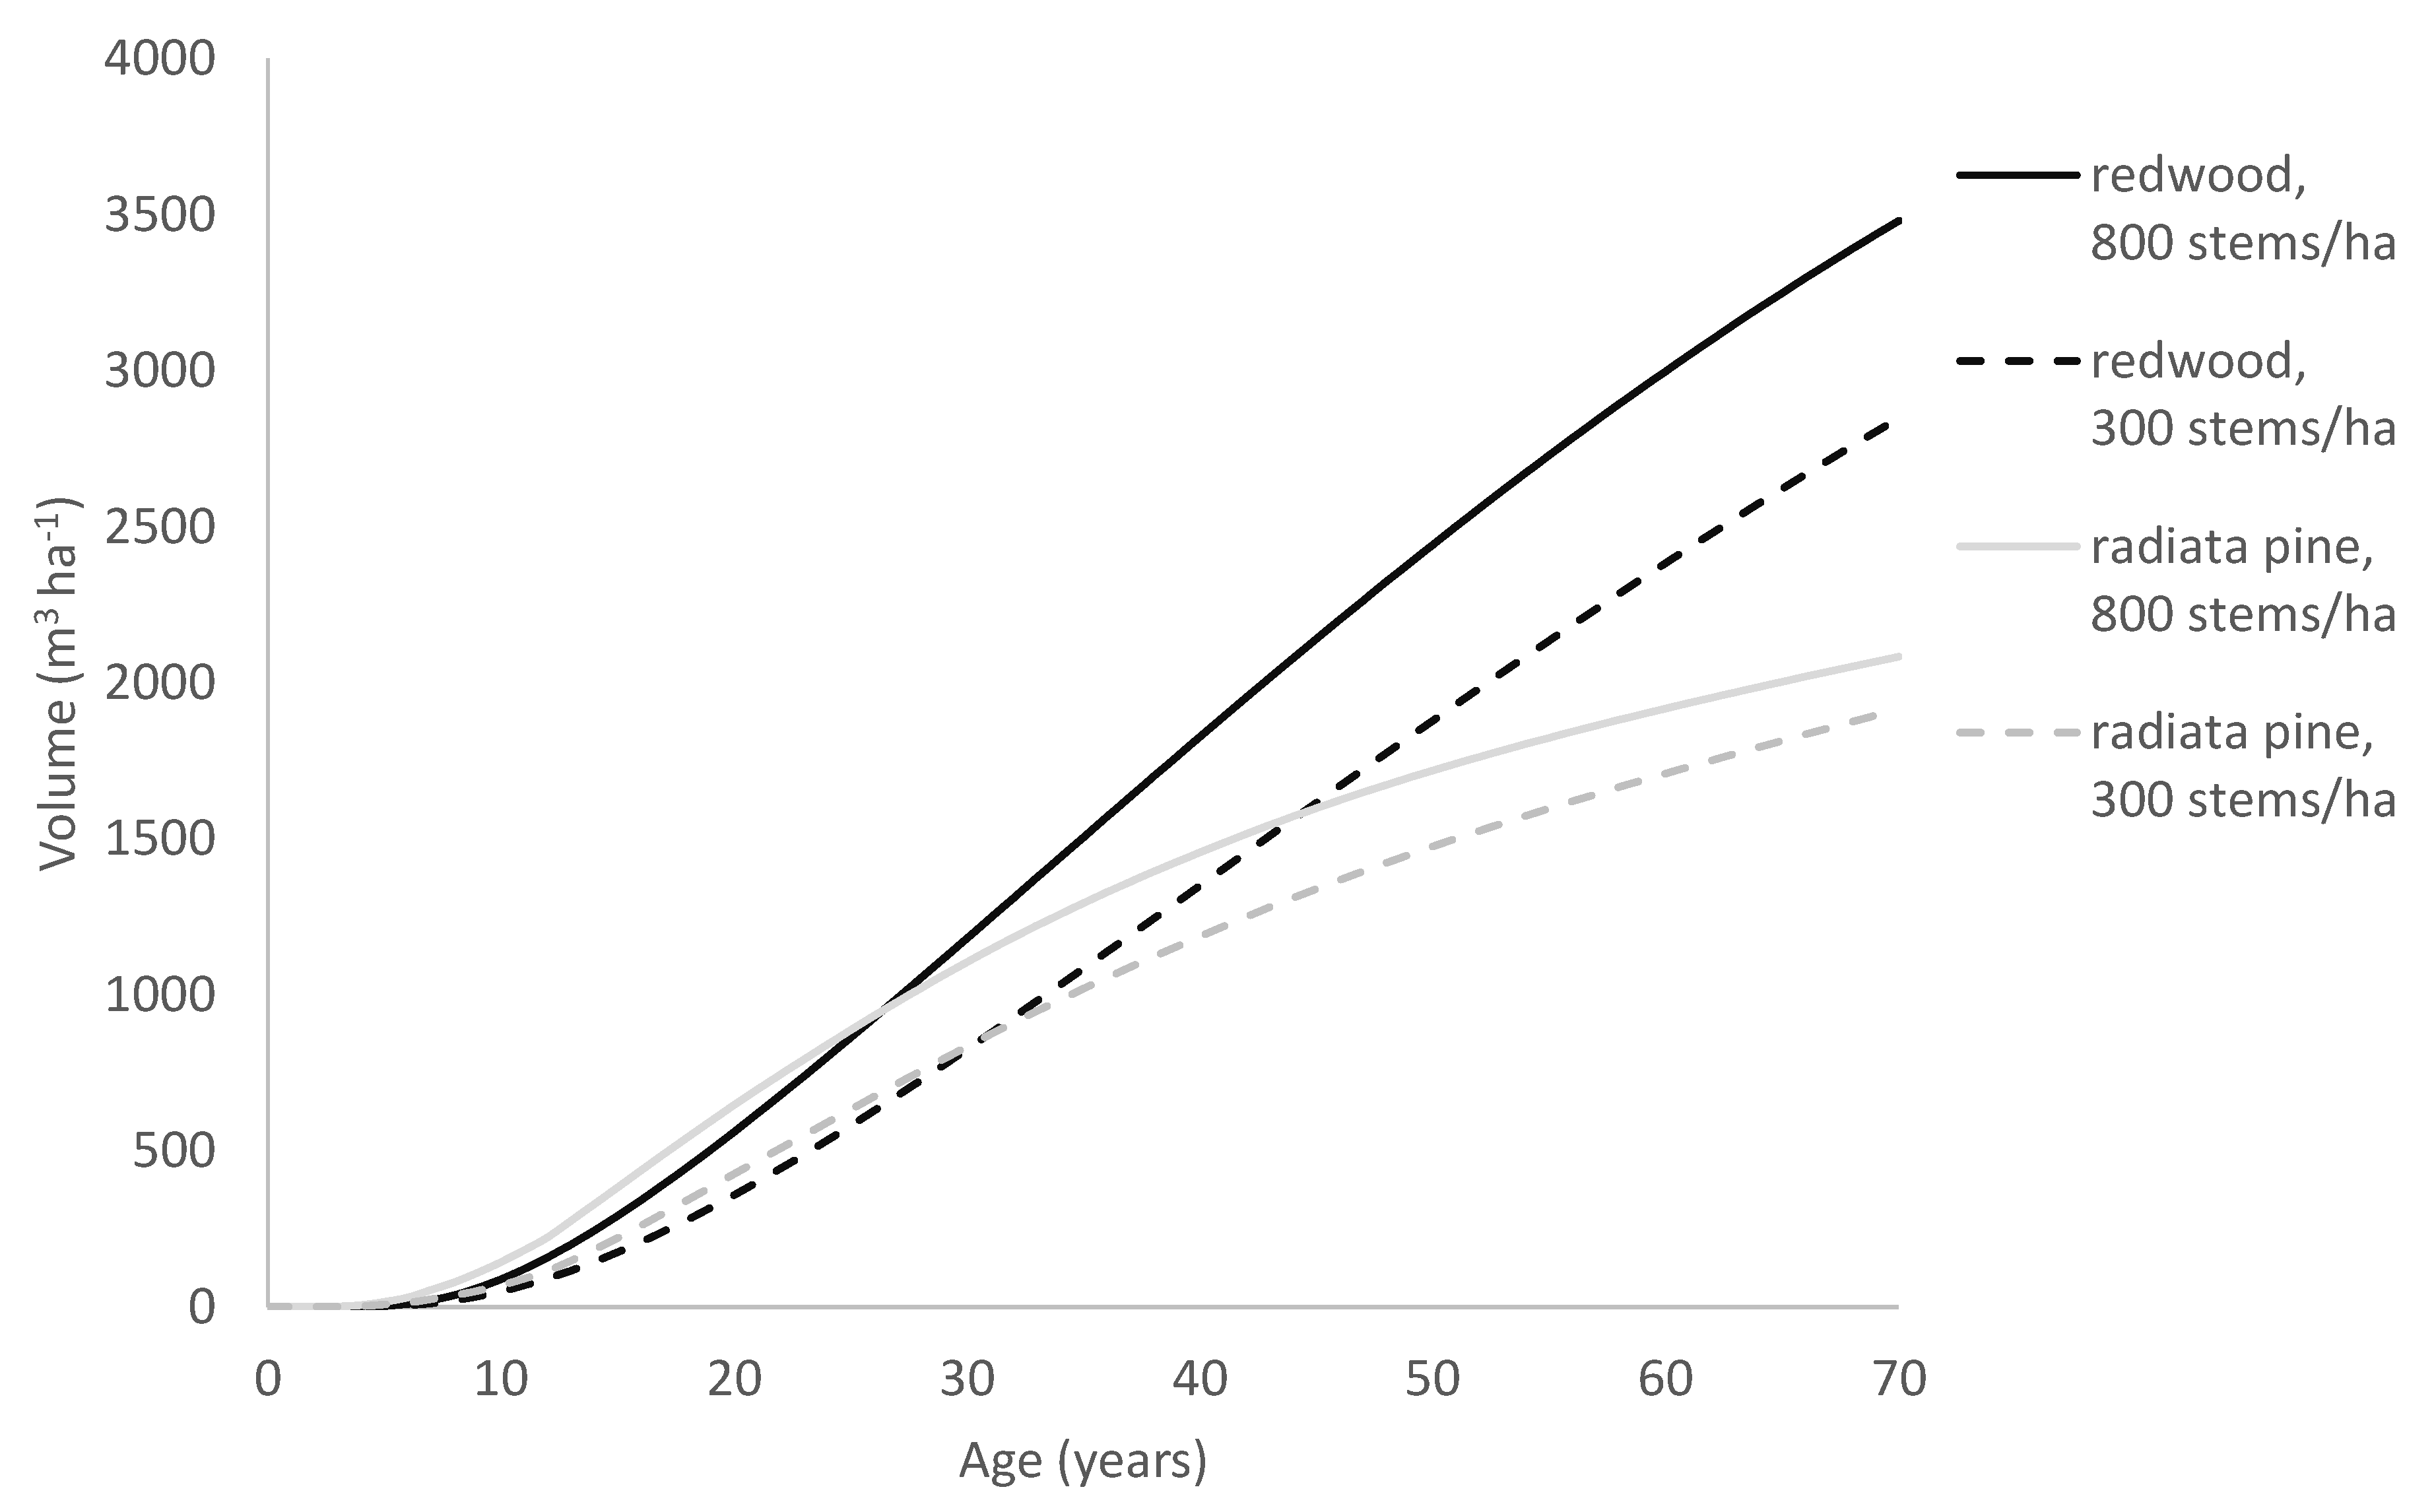
As a consequence, in trees showing similar early growth, those following the Richards growth pattern will slow more rapidly and approach the asymptote more abruptly than trees following the Korf growth pattern. Due to this, although the radiata pine model often predicts faster early growth than the redwood model does, it transitions towards its asymptote far more rapidly than the redwood model. This can be seen, for example, in
Figure 9, which compares growth predictions by the two models for a site typical of the North Island of New Zealand. Although it may be premature to infer too much from only two species, these results suggest that the Richards model is better suited to modelling growth for fast-growing but relatively short-lived tree species such as radiata pine, whereas the Korf model performs better at modelling fast-growing but extremely long-lived species that can maintain high growth rates over a prolonged period such as redwood.
The growth model described in this paper can be used in similar ways to other empirical growth models. These include the projection of yield from inventory data and regime evaluation. The characterisation of a stand using the 300 Index and SI only requires a single measurement of age, stand density, MTH and BA. Following this characterisation, site productivity can be evaluated and metrics of stand growth can be predicted for any age and management regime. The model is therefore particularly well suited for regime evaluation, as once the two productivity indices have been determined for a forest, it can be used to assess the effects of stand density, the intensity and timing of thinning and rotation length on harvest production. The facility to accurately model tree growth under a variety of stand densities and thinning regimes, across a wide range of site qualities, is likely to substantially improve management of redwood within New Zealand.
Predictions made by this model can be used to produce regional maps describing variation in the 300 Index. As described above, the model can be readily used to estimate the 300 Index from sample plots, and this is likely to be particularly useful when plot data representing wide environmental gradients are available (e.g., national permanent sample plot datasets). By extracting environmental covariates for plot locations from GIS layers, regional models of the 300 Index can be created. Using this approach, a redwood 300 Index surface has been developed for New Zealand and compared to a previously produced 300 Index surface for radiata pine [
36]. Results from this study show that redwood is more productive than radiata pine throughout most of the North Island [
36]. Spatial comparisons of these surfaces are invaluable for growers who are purchasing new land or making decisions around species selection for new plantings. The 300 Index can also be used to examine historical trends in productivity and the response of stands to experimental treatments. The model of redwood 300 Index for New Zealand described above showed there was little variation in productivity for stands established prior to 1978, after which there was an exponential increase in 300 Index that continued through to the most recently planted stands in 2013 [
36].
The development of national surfaces describing the 300 Index and
SI also provides a useful means of model parameterisation which greatly enhances the generality of the model. Such a method is widely used within New Zealand for describing the productivity of radiata pine, and these national surfaces are part of the software used to parameterise growth for a specific site [
24]. This approach can be used for running model simulations when plot data are not available. The linking of the growth model to these productivity surfaces effectively transforms the described empirical model into a hybrid model that is sensitive to fine-scale environmental variation.


