Abstract
Background: Although numerous studies have been carried out in recent decades, soil respiration remains one of the less understood elements in global carbon budget research. Tropical forests store a considerable amount of carbon, and a well-established knowledge of the patterns, components, and controls of soil respiration in these forests will be crucial in global change research. Methods: Soil respiration was separated into two components using the trenching method. Each component was measured at multiple temporal scales and in different microhabitats. A commercial soil efflux system (Li8100/8150) was used to accomplish soil respiration monitoring. Four commonly used models were compared that described the temperature dependence of soil heterotrophic respiration using nonlinear statistics. Results and Conclusions: Trenching has a limited effect on soil temperature but considerably affects soil water content due to the exclusion of water loss via tree transpiration. Soil respiration decreased gradually from 8 to 4 μmol·m−2·s−1 6 days after trenching. Soil autotrophic (Ra) and heterotrophic respiration (Rh) have contrasting diel patterns and different responses to temperature. Rh was negatively correlated with temperature but positively correlated with relative humidity. Both Ra and Rh varied dramatically among microhabitats. The Q10 value of Rh derived using the Q10 model was 2.54. The Kirschbaum–O’Connell model, which implied a strong decrease of Q10 with temperature, worked best in describing temperature dependence of Rh. Heterotrophic respiration accounted for nearly half of the total soil efflux. We found an unexpected diurnal pattern in soil heterotrophic respiration which might be related to diurnal moisture dynamics. Temperature, but not soil moisture, was the major controller of seasonal variation of soil respiration in both autotrophic and heterotrophic components. From a statistical perspective, the best model to describe the temperature sensitivity of soil respiration was the Kirschbaum–O’Connell model. Soil respiration varied strongly among the microhabitats and played a crucial role in stand-level ecosystem carbon balance assessment.
1. Introduction
Soil respiration is an important process in carbon cycle of terrestrial ecosystems. Numerous studies have been carried out to investigate topics of soil respiration or efflux, from tropical to boreal forests [1,2]. However, current knowledge on soil respiration is still poor compared to that on photosynthesis. It is necessary to achieve a process-based model on soil respiration which is similar to photosynthesis biochemical models [3].
Tropical forest, where a warm and wet climate drives fast biogeochemical turnover, plays a major role in global carbon cycling and, hence, the rate of climatic warming [4]. Nevertheless, soil respiration studies on tropical forests are much fewer in number than those on boreal or temperate forests [5,6,7]. In the tropical forests near the equator, the annual temperature range is small compared to boreal or temperate forests. The common temperature dependence of soil respiration in other biomes was not detected in these equatorial tropical forests [8,9]. Even in the case of tropical seasonal forests, soil respiration was found not related to temperature [10,11,12]. This hindered the assessment of temperature sensitivity in tropical soil respiration, an important parameter in climatic and biogeochemical models.
Soil respiration is the sum of autotrophic respiration by plant roots and heterotrophic respiration by soil microbes. Since different organisms are involved in these two componential processes, they might respond differently to environmental changes. Thus, it is necessary to separate them when carrying out soil respiration studies. However, such steps have seldom been taken in previous studies on tropical soil respiration.
To investigate the pattern, components, and controls of tropical forest soil respiration, we used the trenching method and measured the two componential processes of soil respiration in a mixed dipterocarp forest in China. The specific aims of the study were (1) to determine temperature sensitivity and the best model describing this sensitivity, (2) to separate respiration into autotrophic and heterotrophic components, as well as investigate their patterns and controls, and (3) to investigate how soil respiration varies among microhabitats. In the mixed dipterocarp forest, the annual temperature range could be up to 10 °C; thus, it was feasible to achieve our objects in our study site.
2. Materials and Methods
2.1. Site Description
The experiment was carried out in a dipterocarp forest on the northern edge of tropical Southeast Asia, in Xishuangbanna, China, at 21°37′ N, 101°35′ E [13]. The climate of this area shows strong seasonality. A local meteorologist divided the whole year into three sub-seasons: the dry hot season (March and April), fog cool season (November through February next year), and rainy season (May through October) [14]. Climatic records over the past 50 years showed a mean annual total rainfall of about 1500 mm, 87% of which occurred in the rainy season. The remaining 13% (195 mm) occurred in the dry half of the year, when the monthly rainfall was usually less than 50 mm. Mean annual air temperature is around 21.8 °C, while the coldest monthly mean temperature is below 15 °C and cold fronts can lower the temperature to 2–4 °C.
The forest being studied here is a primary mixed dipterocarp forest, referred to by local vegetation scientists as a tropical seasonal rainforest (Figure 1). This forest is famous for its particularly tall trees which can reach heights of 60–70 m. The forest canopy is very complex with multiple layers. A closed canopy exists at 25–35 m, while emergent trees (mostly Shorea wantianshuea) reach 60–70 m. The mean diameter at breast height is 5.69 cm, and the mean total basal area for trees with a diameter at breast height above 1.0 cm is 42.34 m2 per hectare. The mean stand biomass is 421 t of dry matter per hectare, which is close to the biomass levels in equatorial rainforest in Pasoh [13,15]. The presence of large logs, many epiphytes, an uneven age distribution, and complex canopy characterizes the forest as “old growth”. The soil is lateritic, derived from siliceous rocks such as granite and gneiss, with pH from 4.91, and the organic matter content of the 0–20 cm mineral soil layer is approximately 20 g·kg−1. [15]. A 20 ha permanent plot was established in 2007 for the purpose of studying the structure and dynamics of the dipterocarp forest.
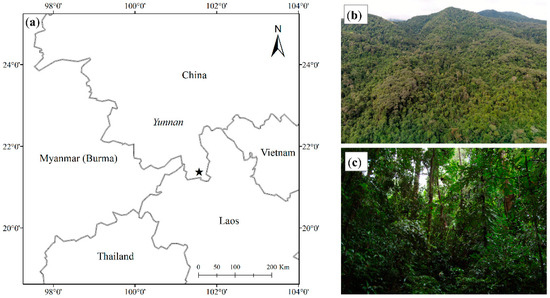
Figure 1.
Site location (★) and the landscape: (a) site location; (b) canopy; (c) understory.
2.2. Experimental Design
The studied forest is located in a mountainous area [13] (cf. Figure 2 in terrain map), and the terrain is very complex (Figure 1). The elevation gradient of this area varies from 709 to 869 m above sea level. Different microhabitats exist due to changes in micro-terrain. It is noted that forest soil respiration has strong spatial heterogeneity, and the degree of variation could be enforced by the complex micro-terrain [15]. Taking representative measurements in this area is a challenging task, and each microhabitat should be considered.
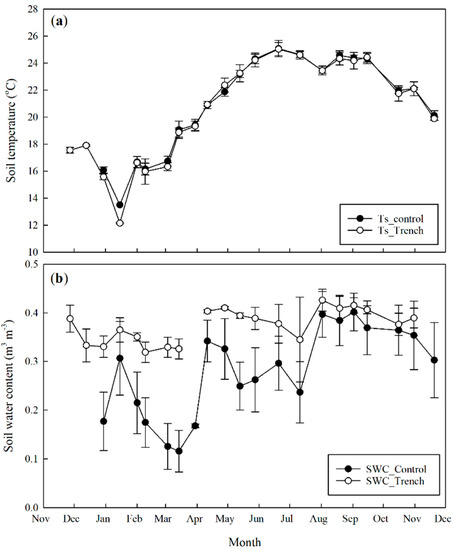
Figure 2.
Temporal dynamics of soil temperature (a) and soil water content (b). Both soil temperature and soil water content were measured at a depth of 5 cm. Error bars represent standard deviation.
We firstly chose a small low-elevation hill as the target site for soil respiration in this study. The small hill has an area of around 60 × 50 m and is irregular in shape. The slope is gentle (around 6–15 degree) in this small hill. Below the hill is a watershed stream and a small pond. We chose this small low-elevation hill as the study site, considering the representativeness of this site and the difficulties in placing soil respiration instruments, here the Li-8150, at sites with steep slopes.
The small hill was classified into the following three microhabitats: (1) forest gap (Plot #1); (2) upper slope (Plot #2); (3) lower slope valley (Plot #3). There is a new forest gap in the lower-slope position of the target hill; thus, we set up Plot #1 near this gap. The upper-slope microhabitat (Plot #2) has little organic litter on the floor as the runoff flow of rain could drive the litter and nutrients to the lower habitats. Thus, it could be viewed as a nutrient- and organic-poor habitat. The lower-slope habitat, on the contrary, has a relatively thick decaying litter, and the soil surface looks darker than that of the upper-slope habitat.
In each microhabitat, we set up two paired plots. One plot was trenched, and the paired plot within the same habitat was treated as a control. The plot was 3 × 3 m in size. The 50 cm wide trench had a depth of 120–130 cm. The trench was refilled with the excavated soil. In order to avoid root growth into the plot, four high-quality plexiglass sheets were erected in the trench of each plot. We believed that this trench depth could cut off all roots in this study forest, as no roots were visible at this depth. Soil was hard and rock was semi-weathered at this depth. In the center of each plot, we randomly placed 3–4 collars for soil measurements.
2.3. Measurements of Soil Respiration and Microclimatic Factors
A commercial soil efflux system was used to measure soil respiration and microclimatic factors. Some of the self-made soil efflux chambers used fans to mix air in the chamber during measurement. However, it has been experimentally established that soil efflux rates increase linearly with wind speed [16]. The Li-8100/8150 multiplexer automatic soil CO2 flux system (Li-Cor Inc, Lincoln, NE, USA) selected for this study has a special design that avoids the use of fans during measurement [17].
The Li-8150, connected with eight chambers, was used three times. The first time was to monitor how soil respiration changed during and after trenching. The second and third times were to monitor diurnal variation during the dry and rainy seasons. The second measurement ran from 22 March 2015 to 29 March 2015. Data from the third set of measurements were not used here for experimental reasons. Air relative humidity data were collected from a nearby tower in the same time period.
The Li-8100 was used to carry out regular soil respiration measurements twice a month for detecting seasonal patterns and for annual sum estimation. Each time, soil respiration measurements were started at 11:00 a.m. and lasted until 1:00 p.m. Each collar was measured three times. Soil water content (SWC) and soil temperature (Ts) were measured at the same time with sensors provided by the manufacturers.
2.4. Definition and Calculations
The commercial efflux system provides calculated soil carbon dioxide flux by either linear or exponential fitting of the CO2 concentration to time (cf. Li-Cor 8100/8150 manual). We did not carry out further recalculations but adopted the values generated by the system. Soil carbon dioxide flux measured in the control and trench treatment were regarded as total soil respiration (Rs) and heterotrophic respiration (Rh), respectively. Autotrophic respiration (Ra) was calculated as the difference between Rs and Rh. The annual sum of respiration was extrapolated by integrating with time.
2.5. Models for Temperature Response of Soil Respiration
There are four commonly used models in describing temperature dependence of soil heterotrophic respiration (Rh):
where R10 is the reference respiration at 10 °C, T is the driving temperature, TK is the driving temperature in units of Kelvin, Q10 is the temperature sensitivity index defined as , Ea is the activation energy, R is the gas constant (8.314 J·mol−1·K−1), α, β, and Tm are fitted parameters, E0 is a similar but loose term of activation energy , and T0 is a fitted parameter, the initial value of which needs to be lower than any observed temperature when applying nonlinear regression.
The Q10 expression for each model is as follows:
where Cons indicates a constant.
All nonlinear regressions in the study were performed using Matlab 7.1 (Mathworks Inc., Natick, MA, USA). We used the determinant coefficient (r2) and sum of residual squares (SSR) to assess goodness of fit. The upper and lower 95% confidential intervals of each fitted parameter were provided.
3. Results
3.1. Trench Effect on Soil Microclimate and Soil Respiration
Trenching had a limited effect on soil temperature (Ts). There was no difference in Ts between control and trenching treatments (Figure 2a). On the contrary, the effect of trenching on soil water content (SWC) was very strong (Figure 2b). The SWC did not drop even during the driest period in trenching plots.
The effect of trenching on soil respiration was obvious (Figure 3). Average Rs decreased from 8 μmol·m−2·s−1 to 4 μmol·m−2·s−1 after trenching. This decrease was a gradual process lasting several days.
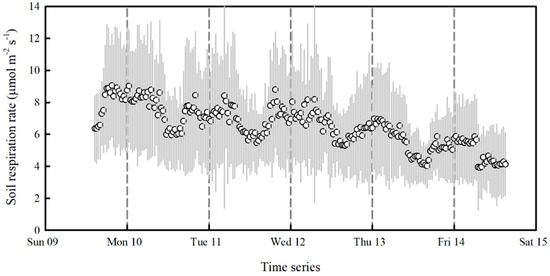
Figure 3.
A continuous monitoring of soil respiration rate to show the effect of trenching. Gray shading indicates the standard deviation.
3.2. Diel Variation of Soil Respiration and Its Components
There were clear diel patterns in soil respiration and its components (Figure 4). Heterotrophic respiration (Rh) decreased from the highest level in the early morning to the lowest level in the late afternoon during the daytime, and then it increased to the highest level in the early morning during the nighttime. This pattern was similar to the pattern of relative humidity (Hr), but not to that of soil temperature (Ts) (Figure 4d). A significant positive correlation was found between Rh and Hr (r = 0.69, p < 0.001), whereas a significant negative correlation was found between Rh and Ts (r = −0.64, p < 0.001).
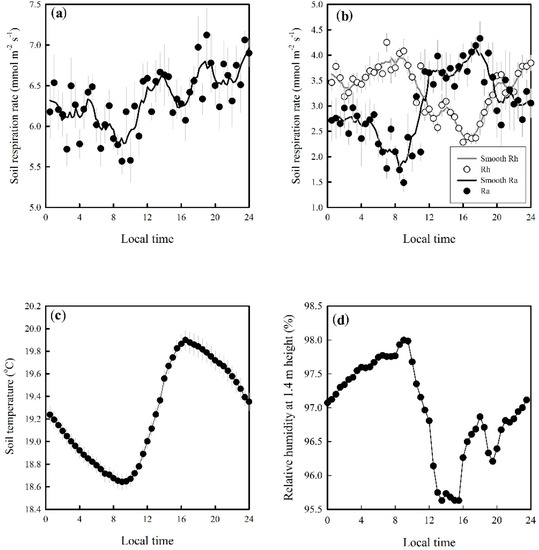
Figure 4.
The diurnal variation of soil respiration (a), its components (b), soil temperature (c), and relative humidity of air at 1.4 m height (d). Rh: heterotrophic respiration in the trenching treatment; Ra: autotrophic respiration calculated as the difference between total soil respiration and Rh. Error bars indicate the standard deviation.
Autotrophic respiration (Ra) exhibited an opposite diel pattern to that of Rh. Ra was highest in the late afternoon. There was a continuous decrease in Ra during the nighttime. A significant positive correlation was found between Ra and Ts (r = 0.77, p < 0.001). The diurnal range of Ra (~3 μmol·m−2·s−1) was higher than that of Rh (~1.5 μmol·m−2·s−1). Total soil respiration (Rs) exhibited a similar pattern to that of Rh and was significantly correlated to Ts (r = 0.58, p < 0.001).
3.3. Variation in Soil Respiration across Seasons and Microhabitats
Both Rs and Rh varied dramatically in different microhabitats, with a clear seasonal pattern (Figure 5). The lowest Rs and Rh were observed in the upper-slope microhabitat. The gap plot showed the highest Rs (10.07 ± 3.90 μmol·m−2·s−1). Highest Rh was observed in the lower-slope valley microhabitat (5.27 ± 1.96 μmol·m−2·s−1). The highest Rs values could be as high as three times the lowest values. The Rh in the valley habitat was twice as high as that in the upper-slope habitat.

Figure 5.
Soil respiration rate of the paired plots in control (a) and trenching treatment (b). Plot #1 and Plot #1′ are paired plots in forest gap; Plot #2 and Plot #2′ are paired plots in upper slope; Plot #3 and Plot #3′ are paired plots in lower slope valley. Error bars represent the standard deviation.
3.4. Temperature Sensitivity of Soil Respiration
Soil respiration, especially the heterotrophic component (Rh), was highly correlated to temperature in the studied forest (Figure 6). The Q10 value of Rh derived using the Q10 model was 2.54. From a statistical perspective, however, the Q10 model did not provide the best description of the temperature dependence of Rh (Table 1). The Kirschbaum–O’Connell model which implied a strong decrease in Q10 with temperature fit the best (Figure 7 and Table 1). The Q10 values derived using the four models converged at a temperature around 16 °C (Figure 7). The Q10 value at the mean annual temperature (22 °C) varied dramatically among models. It was 2.54, 2.40, 1.79, and 1.01 for the Q10, Arrhenius, Lloyd–Kavanau, and Kirschbaum–O’Connell models, respectively.
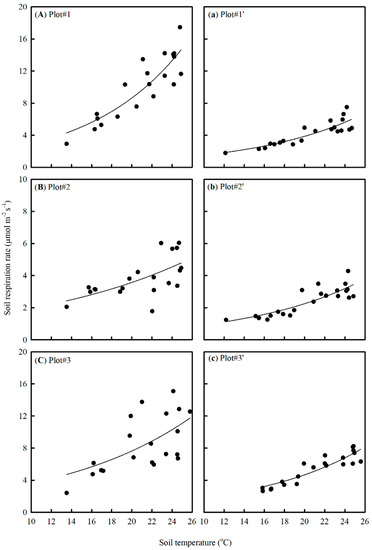
Figure 6.
Temperature response of soil respiration rate for the paired plots in different treatments. Plots #1–3 are control treatments; Plots #1′–3′ are trench treatments. Plots #1–3 are paired to Plots #1′–3′ from the forest gap, upper slope, and lower slope valley, respectively. The regression line was fitted using a two-parameter exponential growth equation.

Table 1.
Summary table for comparison of the fitting of four models for soil heterotrophic respiration. Values in parentheses are 95% confidential intervals of each estimated parameter; r2 represents the determinant coefficient; SSE is the sum of squared errors.
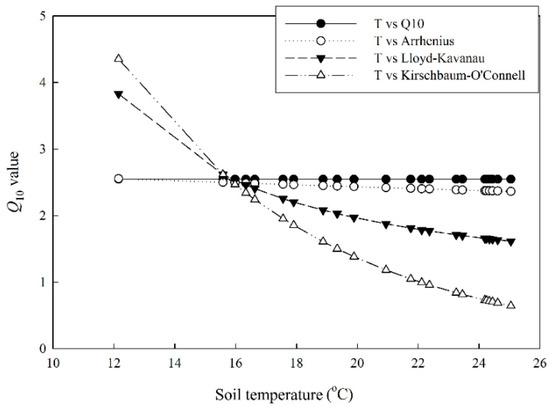
Figure 7.
Soil temperature dependence of Q10 derived using four different models.
3.5. Contribution of autotrophic and heterotrophic components to total soil respiration
The Rh, Ra, Rs and Rh/Rs all exhibit clear seasonal patterns (Figure 8). In general, Ra and Rs were higher during the rainy season. The Rh, however, increased from the beginning of the rainy season with no obvious decline until the end of the year. The overall mean contribution of Rh to Rs is 57.01%. This implies that the contribution of Rh is slightly higher than that of Ra to Rs.
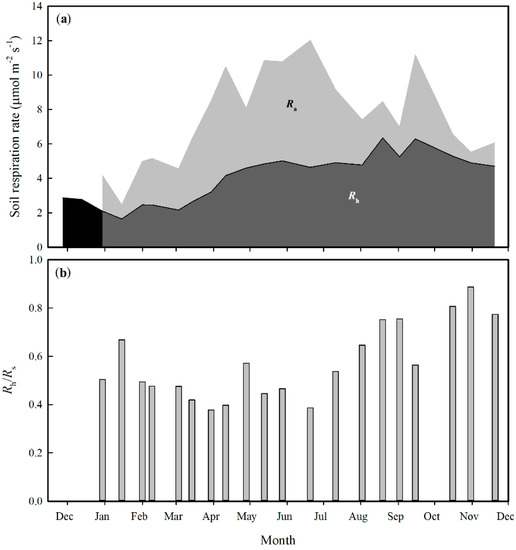
Figure 8.
Temporal dynamics of soil respiration rate and its components (a), and of Rh/Rs (b). Ra: autotrophic respiration, Rh: heterotrophic respiration.
4. Discussion
4.1. The Unexpected Diel Pattern in Heterotrophic Respiration
The effect of trenching on soil temperature was very small, but trenching had an obvious influence on soil water content and soil respiration. This was possibly due to the inhibition of transpiration and consumption of carbohydrates in roots. The existence of a hysteresis between temperature and soil respiration at a diurnal scale has been extensively reported [18]. Nevertheless, the reasons why hysteresis occurs between temperature and Rs are still unknown. In our study, we separated Rs into Ra and Rh using the trenching method and related them to soil temperature (Figure 9). We found contrasting diel patterns in Rh and Ra, as well as in their responses to soil temperature. The diel pattern and its response to soil temperature of Ra were consistent with previous findings [18]. However, the negative correlation between Rh and Ts was unexpected, and, to our knowledge, this is the first report of this new pattern.
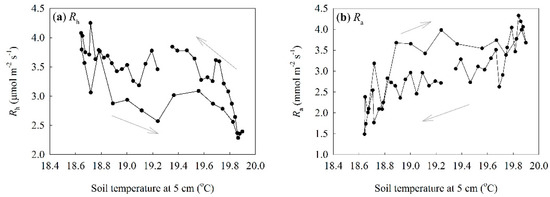
Figure 9.
The relationship between soil temperature and soil respiration at diel scale: (a) variation of Rh with soil temperature; (b) variation of Ra with soil temperature.
We aimed to determine whether this unexpected new diel pattern in Rh is a common pattern or not, and why it occurs. We compared our results with those collected in a tropical secondary forest in Thailand [11]. The lowest Rh occurred after noon [11]. We also compared our results with unpublished data collected in Pasoh, Malaysia (data copyright reserved by Dr. Naishen Liang). The findings from Pasoh showed very similar results to those of this study. We, thus, suspect that this might be a common pattern in tropical forests of Southeast Asia. We further hypothesize that water condition is a major factor leading to the unexpected diel pattern in Rh. The major factors affecting Rh could be summarized as temperature, water, and substrate [19,20]. The substrates for heterotrophic respiration include aboveground (e.g., leaves, branches) and belowground (e.g., dead roots) plant litter and soil organic matter. There is no evidence that these substrates vary significantly from day to night, although they do vary over longer time periods, such as seasonally and annually. Thus, substrate is not likely to account for this pattern. As shown before, there was a negative relationship between Rh and Ts. This violates the basic principle of temperature-driving biochemical processes. Therefore, we could also exclude temperature as the cause for the observed pattern. Thus, the only factor remaining for consideration is water condition.
Evidence in support of the hypothesis that water condition is a major factor leading to the unexpected diel pattern in Rh includes the following:
- (i)
- We found a close relationship between Rh and relative humidity (Hr).
- (ii)
- The climate in tropical forests could form a diel dry-and-rewet cycle on surface litter. Evaporation is strong in tropical rainforest because of the high year-round solar radiation and temperature [21,22]. High rates of evaporation dry the air, as well as surfaces of soil litter, during the day. On calm nights, radiation fog can form [23,24] and air humidity increases. Litter surfaces can be rewetted during humid nights, representing one type of diel dry-and-rewet cycle.
- (iii)
- Litter may play an important role in soil carbon flux of tropical forests. A litterfall manipulation experiment in Costa Rican rainforest stressed the considerable role of litterfall in soil carbon cycling [25]. Litterfall, both as a direct source of CO2 and as an input of soil organic matter, should be expected to play an important role in soil heterotrophic respiration, especially in the rapid-turnover tropical rainforest [26,27].
4.2. Temperature Sensitivity of the Studied Tropical Forests
We have little information on temperature sensitivity of tropical forests except that collected from incubation studies [28,29]. The equatorial tropical forests have a narrow temperature range. Observations across seasons found a clear dependence of respiration upon water rather than temperature [8,9]. The studied tropical forest has an annual temperature range of up to 10 °C, providing the possibility to investigate temperature sensitivity.
Many models have been used to describe the temperature dependence of soil respiration [30,31]. We compared four commonly used models to derive the temperature sensitivity index (Q10) of soil heterotrophic respiration (Table 1). The Q10 value derived from the Q10 model was 2.54. Nevertheless, we found that the Kirschbaum–O’Connell model worked best in describing the temperature dependence from a statistical perspective. The Kirschbaum–O’Connell model stressed a steep decline in Q10 with temperature (Figure 7). The reason why models implying a decrease in Q10 with temperature work better than those with fixed Q10 is still unknown. This might be related to substrate availability as suggested in modeling work [32].
The Q10 of Rh estimated using the Q10 model (2.54) was higher than that collected from incubation studies, i.e., a forest in northern Southeast Asia (2.2) [28] and in Australia (1.43–2.21) [29]. The Q10 value was also higher than that of the total soil respiration of a nearby non-dipterocarp forest (2.03–2.36) [33]. Soil water content was maintained at a near-saturation level across the seasons owing to the exclusion of transpiration water losses (Figure 2). The confounding effect of soil water content on Q10 estimation was minimized. The Q10 value here should, thus, be representative of the studied forest. This might be related to the latitude and mean annual temperature of this site. The site is close to the Tropic of Cancer with a mean annual temperature of around 22 °C. Given that Q10 decreases with mean annual temperature, the Q10 of the studied forest was expected to be higher than that of forests closer to the equator [34].
4.3. Variation of Soil Respiration among Microhabitats and Implications for Carbon Balance
Topographic fragmentation is strong in the studied site [13], and spatial heterogeneity is an important dimension that needs to be taken into account under such circumstances [15]. Soil respiration of the three habitats varied strongly (Figure 5). The highest value was nearly three times that of the lowest. The arithmetical mean Rh of the three microhabitats was 4.00 μmol·m−2·s−1, which can be easily extrapolated to 1516 gC·m−2·year−1. As reported before, the net primary production of this forest is 1198 gC·m−2·year−1 [13]. Thus, the studied forest was proposed as a net carbon source. However, this is not a convincing estimation. In fact, the forest gap only accounts for a small part of the total forest land [35]. A weighted averaging could produce a more sound estimation of soil respiration for the whole stand. We adopted a 20 × 20 m resolution habitat classification map to accomplish the weight averaging [35]. Gap, low valley, and others accounted for 6.2%, 28.0%, and 65.8% land area of the 20 ha plot, respectively. The weight-averaged soil heterotrophic respiration was 3.33 μmol·m−2·s−1 (equal to 1262 gC·m−2·year−1). This indicates a near-carbon-neutral state or a very slight carbon source for the studied forests. However, this remains a rough estimation because the microhabitats discussed here should be examined at a scale of several meters, as this is more reliable and convincing than the arithmetical averaging method.
Uncertainties arising from measuring techniques were slight in this study because of the following:
- (i)
- The use of the commercial Li-8100/8150 avoided the problem caused by fan mixing. Some self-design chambers use the convenience of fans for mixing [6]. This violates the basic principle of soil efflux measurement with the static chamber method [17]. Research has shown that soil CO2 efflux increases linearly with wind speed [16].
- (ii)
- Sufficient trench depth: Trenching is still a major method used to separate soil heterotrophic and autotrophic respiration. Given insufficient trench depth, heterotrophic respiration cannot be completely separated [36]. We trenched to a depth of 1.2–1.3 m; at this depth, no visible root could be found, and rock was semi-weathered.
- (iii)
- Reliability of the method used to calculate fluxes: Linear regression should be used appropriately in calculating CO2 efflux with a static chamber [37], as inappropriate application of this method could lead to serious bias. The present study avoided this bias (cf. Li-8100/8150 manual).
5. Conclusions
We investigated patterns, components, and controls of a mixed dipterocarp forest in China. Several conclusions could be drawn.
- (i)
- Soil respiration varied strongly among the microhabitats and played a crucial role in stand-level ecosystem carbon balance assessment. A weight-averaged estimate taking this spatial variation into account could give more defensible soil respiration and net carbon budget assessment than arithmetical averaging.
- (ii)
- The unexpected diel pattern on heterotrophic respiration was probably related to moisture dynamics.
- (iii)
- The Kirschbaum–O’Connell model was the best model describing the temperature dependence of soil heterotrophic respiration among the four models. The temperature sensitivity index (Q10) varied among models. The value derived using the Q10 model was 2.54.
Author Contributions
Methodology and investigation, Z.-H.T., J.-F.Z. and Z.-Y.L.; writing—original draft preparation, J.-F.Z.; writing—review and editing, Z.-H.T. and Z.-Y.L.; data curation, J.-F.Z. and L.-Y.Y.; supervision, J.-K.S. All authors read and agreed to the published version of the manuscript.
Funding
This research was funded by the National Natural Science Foundation of China (no. 41771099, 41861023 and 31660142) and the Hainan Province Key Research and Development Project (ZDYF2018171).
Acknowledgments
We sincerely thank the Xishuangbanna Station for Tropical Rain Forest Ecosystem Studies, especially Xiaofei Yang and Yun Deng, for their help with our field work.
Conflicts of Interest
The authors declare no conflict of interest.
References
- Bond-Lamberty, B.; Thomson, S. Temperature-associated increases in the global soil respiration record. Nature 2010, 464, 579–582. [Google Scholar] [CrossRef]
- Mukhortova, L.; Schepaschenko, D.; Moltchanova, E.; Shvidenko, A.; See, L. Respiration of Russian soils: Climatic drivers and response to climate change. Sci. Total. Environ. 2021, 785, 147314. [Google Scholar] [CrossRef]
- Farquhar, G.D.; von Caemmerer, S.; Berry, J.A. A biochemical model of photosynthetic CO2 assimilation in leaves of C3 species. Planta 1980, 149, 78–90. [Google Scholar] [CrossRef] [Green Version]
- Brown, S.; Lugo, A.E. The storage and production of organic matter in tropical forests and their role in the global carbon cycle. Biotropica 1982, 14, 161–187. [Google Scholar] [CrossRef]
- Hashimoto, S.; Suzuki, M.; Inoue, A.; Takizawa, H.; Kosaka, I.; Tanaka, K.; Tantasirin, C.; Tangtham, N. Soil respiration and soil CO2 concentration in a tropical forest, Thailand. J. For. Res. 2004, 9, 75–79. [Google Scholar] [CrossRef]
- Tan, Z.; Liang, N.; Zhang, Y.; Teramoto, M.; Yu, G.; Yan, J. Soil respiration of tropical forests: Overview and synthesis. J. Yunnan Univ. 2013, 35, 833–842. [Google Scholar] [CrossRef]
- Liu, B.; Li, X.B.; He, D.J.; Chen, L.; Pang, D.B.; Zhu, Z.Y.; Liu, L.Z.; Wu, M.Y.; Wu, Y.Q. Knowledge Mapping Analysis of Soil Respiration Research Based on Web of Science. Chin. J. Soil Sci. 2021, 52, 443–453. [Google Scholar] [CrossRef]
- Kosugi, Y.; Mitani, T.; Itoh, M.; Noguchi, S.; Tani, M.; Matsuo, N.; Takanashi, S.; Ohkubo, S.; Nik, A.R. Spatial and temporal variation in soil respiration in a Southeast Asian tropical rainforest. Agric. For. Meteorol. 2007, 147, 35–47. [Google Scholar] [CrossRef]
- Ohashi, M.; Kumagai, T.; Kume, T.; Gyokusen, K.; Saitoh, T.M.; Suzuki, M. Characteristics of soil CO2 efflux variability in an aseasonal tropical rainforest in Borneo Island. Biogeochemistry 2008, 90, 275–289. [Google Scholar] [CrossRef]
- Hanpattanakit, P.; Panuthai, S.; Chidthaisong, A. Temperature and moisture controls of soil respiration in a dry Dipterocarp forest, Ratchaburi Province. Kasetsart J. 2009, 43, 650–661. [Google Scholar]
- Hanpattanakit, P.; Leclere, M.Y.; Mcmillan, A.M.S.; Limtong, P.; Maeght, J.L.; Panuthai, S.; Inubushi, L.; Chidthaisong, A. Multiple timescale variations and controls of soil respiration in a tropical dry dipterocarp forest, western Thailand. Plant Soil 2015, 390, 167–181. [Google Scholar] [CrossRef]
- Wangluk, S.; Boonyawat, S.; Diloksumpun, S.; Tongdeenok, P. Role of soil temperature and moisture on soil respiration in a teak plantation and mixed deciduous forest in Thailand. J. Trop. For. Sci. 2013, 25, 339–349. [Google Scholar]
- Tan, Z.; Deng, X.; Hughes, A.; Tang, Y.; Cao, M.; Zhang, W.; Yang, X.; Sha, L.; Song, L.; Zhao, J. Partial net primary production of a mixed dipterocarp forest: Spatial patterns and temporal dynamics. J. Geophys. Res. Biogeosci. 2015, 120, 570–583. [Google Scholar] [CrossRef]
- Zhang, K. A preliminary study on the causes of climatic properties in Southern Yunan. Acta Meteorol. Sin. 1963, 33, 218–230. [Google Scholar]
- Song, Q.; Tan, Z.; Zhang, Y.; Cao, M.; Sha, L.; Tang, Y.; Liang, N.; Schaefer, D.; Zhao, J.; Zhao, J.; et al. Spatial heterogeneity of soil respiration in a seasonal rainforest with complex terrain. Iforest-Biogeosci. For. 2013, 6, 65–72. [Google Scholar] [CrossRef]
- Hanson, P.J.; Wullschleger, S.D.; Bohlman, S.A.; Todd, D.E. Seasonal and topographic patterns of forest floor CO2 efflux from an upland oak forest. Tree Physiol. 1993, 13, 1–15. [Google Scholar] [CrossRef]
- Welles, J.M.; Demetriades-Shah, T.H.; McDermit, D.K. Considerations from measuring ground CO2 effluxes with chambers. Chem. Geol. 2001, 177, 3–13. [Google Scholar] [CrossRef]
- Zhang, Q.; Katul, G.G.; Oren, R.; Daly, E.; Manzoni, S.; Yang, D. The hysteresis response of soil concentration and soil respiration to soil temperature. J. Geophys. Res. Biogeosci. 2015, 120, 1605–1618. [Google Scholar] [CrossRef]
- Davidson, E.A.; Janssens, I.A. Temperature sensitivity of soil carbon decomposition and feedbacks to climate change. Nature 2006, 440, 165–173. [Google Scholar] [CrossRef] [PubMed]
- Cai, Z.L.; Qiu, S.P. Seasonal variation of soil respiration and its impact factors in tropical seasonal rainforest in Xishuangbanna, Yunnan. Ecol. Environ. Sci. 2019, 28, 283–290. [Google Scholar] [CrossRef]
- Schellekens, J.; Bruijnzeel, L.; Scatena, F.; Bink, N.; Holwerda, F. Evaporation from a tropical rain forest, Luquillo Experimental Forest, eastern Puerto Rico. Water Resour. Res. 2000, 36, 2183–2196. [Google Scholar] [CrossRef] [Green Version]
- Kosugi, Y.; Takanashi, S.; Tani, M.; Ohkubo, S.; Matsuo, N.; Itoh, M.; Noguchi, S.; Nik, A. Effect of inter-annual climate variability on evapotranspiration and canopy CO2 exchange of a tropical rainforest in Peninsular Malaysia. J. For. Res. 2012, 17, 227–240. [Google Scholar] [CrossRef]
- Bruijnzeel, L.; Veneklaas, E. Climatic conditions and tropical montane forest productivity: The fog has not lifted yet. Ecology 1998, 79, 3–9. [Google Scholar] [CrossRef]
- Liu, W.; Wang, P.; Li, J.; Li, P.; Liu, W. The importance of radiation fog in the tropical seasonal rain forest of Xishuangbanna, South-west China. Hydrol. Res. 2008, 39, 79–87. [Google Scholar] [CrossRef] [Green Version]
- Leff, J.W.; Wieder, W.R.; Taylor, P.G.; Townsend, A.R.; Nemergut, D.R.; Grandy, A.S.; Cleveland, C.C. Experimental litterfall manipulation drives large and rapid changes in soil carbon cycling in a wet tropical forest. Glob. Chang. Biol. 2012, 18, 2969–2979. [Google Scholar] [CrossRef]
- Malhi, Y.; Baldocchi, D.D.; Jarvis, P.G. The carbon balance of tropical, temperate and boreal forests. Plant Cell Environ. 1999, 22, 715–740. [Google Scholar] [CrossRef]
- Sayer, E.J.; Heard, M.S.; Grant, H.K.; Marthews, T.R.; Tanner, E. Soil carbon release enhanced by increased tropical forest litterfall. Nat. Clim. Chang. 2011, 1, 304–307. [Google Scholar] [CrossRef]
- Hashimoto, S. Temperature sensitivity of soil CO2 production in a tropical hill evergreen forest in northern Thailand. J. For. Res. 2005, 10, 497–503. [Google Scholar] [CrossRef]
- Zimmermann, M.; Bird, M.I. Temperature sensitivity of tropical forest soil respiration increase along an altitude gradient with ongoing decomposition. Geoderma 2012, 187–188, 8–15. [Google Scholar] [CrossRef]
- Fang, C.; Moncrieff, J.B. The dependence of soil CO2 efflux on temperature. Soil Biol. Biochem. 2001, 33, 155–165. [Google Scholar] [CrossRef]
- Reichstein, M.; Beer, C. Soil respiration across scales: The importance of a model-data integration framework for data interpretation. J. Plant Nutr. Soil Sci. 2008, 171, 344–354. [Google Scholar] [CrossRef]
- Kirschbaum, M.U.F. Seasonal variations in the availability of labile substrate confound the derived temperature dependence of heterotrophic respiration. Soil Biol. Biochem. 2013, 57, 568–576. [Google Scholar] [CrossRef]
- Sha, L.Q.; Zheng, Z.; Tang, J.W.; Wang, Y.H.; Zhang, Y.P.; Cao, M.; Wang, R.; Liu, G.G.; Wang, Y.S.; Sun, Y. Soil respiration in tropical seasonal rain forest in Xishuangbanna, SW China. Sci. China D 2005, 48, 189–197. [Google Scholar] [CrossRef]
- Peng, S.; Piao, S.; Wang, T.; Sun, J.; Shen, Z. Temperature sensitivity of soil respiration in different ecosystems in China. Soil Biol. Biochem. 2009, 41, 1008–1014. [Google Scholar] [CrossRef]
- Yang, J.; Zhang, G.; Ci, X.; Swenson, N.G.; Cao, M.; Sha, L.; Li, J.; Baskin, C.C.; Ferry Slik, J.W.; Lin, L. Functional and phylogenetic assembly in a Chinese tropical tree community across size classes, spatial scales and habitats. Funct. Ecol. 2014, 28, 520–529. [Google Scholar] [CrossRef]
- Aguilos, M.; Takagi, K.; Liang, N.; Watanabe, Y.; Goto, S.; Takahashi, Y.; Mukai, H.; Sasa, K. Soil warming in a cool-temperate mixed forest with peat soil enhanced heterotrophic and base respiration rates but not Q10 remained unchanged. Biogeosci. Discuss. 2011, 8, 6415–6445. [Google Scholar] [CrossRef] [Green Version]
- Kutzbach, L.; Schneider, J.; Sachs, T.; Giebels, M.; Nykänen, H.; Shurpali, N.J.; Martikainen, P.J.; Alm, J.; Wilmking, M. CO2 flux determined by close-chamber methods can be seriously biased by inappropriate application of linear regression. Biogeosciences 2007, 4, 1005–1025. [Google Scholar] [CrossRef]
Publisher’s Note: MDPI stays neutral with regard to jurisdictional claims in published maps and institutional affiliations. |
© 2021 by the authors. Licensee MDPI, Basel, Switzerland. This article is an open access article distributed under the terms and conditions of the Creative Commons Attribution (CC BY) license (https://creativecommons.org/licenses/by/4.0/).