Article

Spatial Patterns of Non-Structural Carbohydrates in Eucalyptus urophylla× E. grandis under Dry-Season Irrigation with Fertilization

Guangdong Key Laboratory for Innovative Development and Utilization of Forest Plant Germplasm, College of Forestry and Landscape Architecture, South China Agricultural University, Guangzhou 510642, China
*
Author to whom correspondence should be addressed.
Forests 2021, 12(8), 1049; https://doi.org/10.3390/f12081049
Submission received: 20 June 2021 / Revised: 5 August 2021 / Accepted: 5 August 2021 / Published: 7 August 2021
(This article belongs to the Special Issue Drought Resilience of Forest Trees)

Abstract

:
Non-structural carbohydrates (NSC) affect tree growth and survival when photosynthesis is impacted by climate change, such as seasonal drought and extreme precipitation. Nevertheless, it is still unclear whether Eucalyptus suffers growth limitation under natural conditions and if trees recover under artificial cultivation. In present study, we conducted a field control experiment to compare the NSC storage in Eucalyptus urophylla × Eucalyptus grandis trees on fertilization and dry-season irrigation to determine the variations of NSC under drought stress. The results indicated total soluble sugar (TSS) was the primary existing form of NSC. In spatial patterns, NSC concentration showed gradient differences from source organ to sink organ, and finally accumulated in root. The TSS concentration showed a decreased trend with height except leaf, while the trend of starch concentration was contrast. Surprisingly, fertilization and dry-season irrigation had not changed the carbon distribution among all tissues but reduced the TSS concentration in most organs. The fast-growing E. urophylla × E. grandis will consume the assimilates and carbohydrates of storage organs, but maintains the NSC concentration at a certain threshold. Our results help to comprehend the NSC allocation and improve the productivity of E. urophylla × E. grandis plantations in seasonal arid areas.

1. Introduction

In the context of global climate change, the precipitation patterns around the world are changing. According to the research of Spinoni [1], drought events are becoming more frequent and severe worldwide. Under drought stress, vegetation decreases transpiration and photosynthesis rate due to less available water, resulting in declines of the physiological and morphological traits, ultimately decreasing forest productivity [2,3,4]. In Eucalyptus plantations, drought stress also reduced physiological traits such as photosynthesis and transpiration, and morphological traits such as leaf area and growth [5,6]. In addition, drought reduced nutrients and carbon storage in the soil, and microbial activity [7,8,9], which would reduce ecosystem stability and further limit forest productivity. Irrigation can eliminate the negative effects of drought and increase forest productivity [10]. Although rainfall in South China is comparatively plenty, tree growth is always limited by drought under the uneven spatial and temporal distribution of precipitation [11]. According to the data of Guangzhou Meteorological Observatory from 1969 to 2010, the precipitation between October and March is less than 20% of the whole year. As one of the three fast-growing tree species in the world, Eucalyptus plays an important role in the forestry of China, with a planted area of 4.5 Mhm2 [12]. In recent years, seasonal drought has reduced the water consumption and productivity of Eucalyptus in southern China [13]. Therefore, it is necessary to comprehend the response metabolism of Eucalyptus to drought stress for managing Eucalyptus plantations under climate change.
Non-structural carbohydrates (NSC), important compounds involved in plant physiological metabolism, greatly affect the growth and even survival of trees under drought stress. NSC include two components: soluble sugar and starch. Soluble sugars are the important substances directly involved in physiological metabolism, while starch is mainly used as energy storage. Soluble sugar and starch are interconvertible, providing energy and carbon substrates for physiological metabolism [14]. The NSC consumed for growing mainly come from recent assimilates or the storage organ by redistribution when the assimilates fail to meet growth requirements [15,16]. The growth would be slowed down under drought [17,18] and activate accumulation of soluble sugar converted by starch to keep cell turgor and maintain metabolism (e.g., osmoregulation) and repair tissue damage [19]. Although the organs need abundant NSC to maintain metabolism and repair the damage, carbon depletion is an infrequent phenomenon on account due to the active maintenance of NSC pool [19] and the NSC transport limitation caused by the damage of hydraulic and phloem [14], but these would adjust the allocation to resist the stress [20]. Thus, better understanding of NSC distribution is vital to realize the performance and productivity of trees under drought stress.
As a vital mechanism of plant adaptation to the changing environment, the distribution of NSC among organs (leaf, stem, root) is extremely complicated. Research on the NSC distribution in plantations has mainly focused on seasonal and height change [21,22,23]. However, we know little about NSC distribution in Eucalyptus due to the metabolic differences caused by experiment condition, species and intraspecific variation [24]. In most cases, leaves are the source organs with high NSC concentrations, while root and stem are the sink organs with low NSC concentrations [14]. High NSC concentration in leaves is beneficial to maintain photosynthesis and transport assimilates [25,26]. Carbohydrates stored in stem and root are important for tree survival. Tree restoration is supported by underground and aboveground NSC reserves after low levels of stress. While under stress, the restoration depends on the underground NSC reserves [14]. Therefore, carbohydrates are usually stored in root to improve survival rates and restoration [27,28]. On the whole, the distribution of NSC from source organ to sink organ follows the principle of proximity [10] and demand priority [29]. However, the NSC allocation mechanism varies (e.g., primary storage substance, storage organ and carbon redistribution) after the environment changed [24]. Under drought stress, due to carbon assimilation lower than carbon requirements, NSC would be remobilized and converted to osmotically active compounds for metabolism and respiration [30]. For the synthesis effects of growth consumption, carbon translocation interrupted by higher pathway resistance and viscosity of the phloem sap [30,31], trees showed a response that NSC decreased in roots [30] and accumulated in the aboveground parts [32,33] under drought. Due to interspecific and intraspecific variations of NSC [34], the response mechanism of NSC with height has not been clarified, but it might be of biological significance related to water strategy [35]. Some research has explored the NSC trend with height, which showed significant differences in various species and growth stage [26,30,34]. For instance, as a fast-growing tree species, the response of Eucalyptus with height showed a decreased trend [36], while Pinus tends to increase carbohydrate concentration with height [21,37]. Furthermore, the addition of nutrients would cause slight and moderate drought and boost metabolism [38], which further complicates the carbon allocation mechanism, and especially under the seasonal drought stress. The increases of biomass and photosynthesis caused by fertilization would result in larger transpiration and drought stress, despite the addition of nutrients that would increase the water use efficiency [38]. Nitrogen addition aggrandized carbon allocation to growth and respiration, of which the increase aboveground was stronger than that of underground [39]. Notably, common nitrogen fertilization did not affect foliar NSC concentration [30], while nitrogen enrichment decreased foliar NSC [39]. Due to the role of potassium in maintaining osmotic adjustment [40] and stomal regulation [41], potassium is generally fertilized to increase water use efficiency and resist drought stress, which decreased the part of carbon allocated underground [42,43]. Under the combination of potassium fertilization and drought stress, drought stress would counteract the effects of potassium and increase the belowground carbon allocation [6,44]. However, the combined effects of irrigation and fertilization on NSC distribution have been rarely reported. Due to the different response mechanism of carbohydrates to fertilization and drought stress [44,45], the variations of NSC distribution are difficult to predict based on past studies. Thus, exploring the whole tree NSC carbon distribution under fertilization and drought stress can furnish a theoretical basis for carbon resources management with seasonal drought.
This experiment selected the species E. urophylla × E. grandis, generally planted in South China, and studied the NSC distribution with height among organs under fertilization and dry-season irrigation. Eucalyptus plantations were variously treated with fertilization to increase productivity, especially in southern China where the soil fertility is poor [46]. Fertilization, which accelerates the consumption of groundwater resources [6], has been shown in many studies to promote the growth of Eucalyptus [47,48,49]. However, fertilization has a dual effect on the water status of Eucalyptus. Excessive use of groundwater exacerbates carbon supply constraints and hydraulic damage in extreme droughts, which is detrimental to survival of Eucalyptus [14,50,51]. In contrast, potassium and sodium fertilization increased the water use efficiency, which alleviates water deficit of Eucalyptus grandis [52,53]. In general, fertilization increased the productivity of Eucalyptus, but also increased water requirements so as to exacerbate water stress during drought. Management of Eucalyptus plantations under climate change requires reconsideration of fertilization regimes and water supply in order to improve tree water status and growth. Thus, the following hypothesis is proposed in this study: (1) the trend of soluble sugar with height is increased to overcome hydraulic limitation; (2) NSC are primarily stored in roots to promote growth and water uptake; (3) dry-season irrigation can alleviate drought stress and decrease soluble sugar concentration; (4) fertilization can increase NSC concentration to resist drought stress, especially the soluble sugar concentration in roots. The purpose of this study is to explore the response of non-structural carbohydrates at organ and height level of E. urophylla × E. grandis trees under dry-season irrigation with fertilization.

2. Materials and Methods

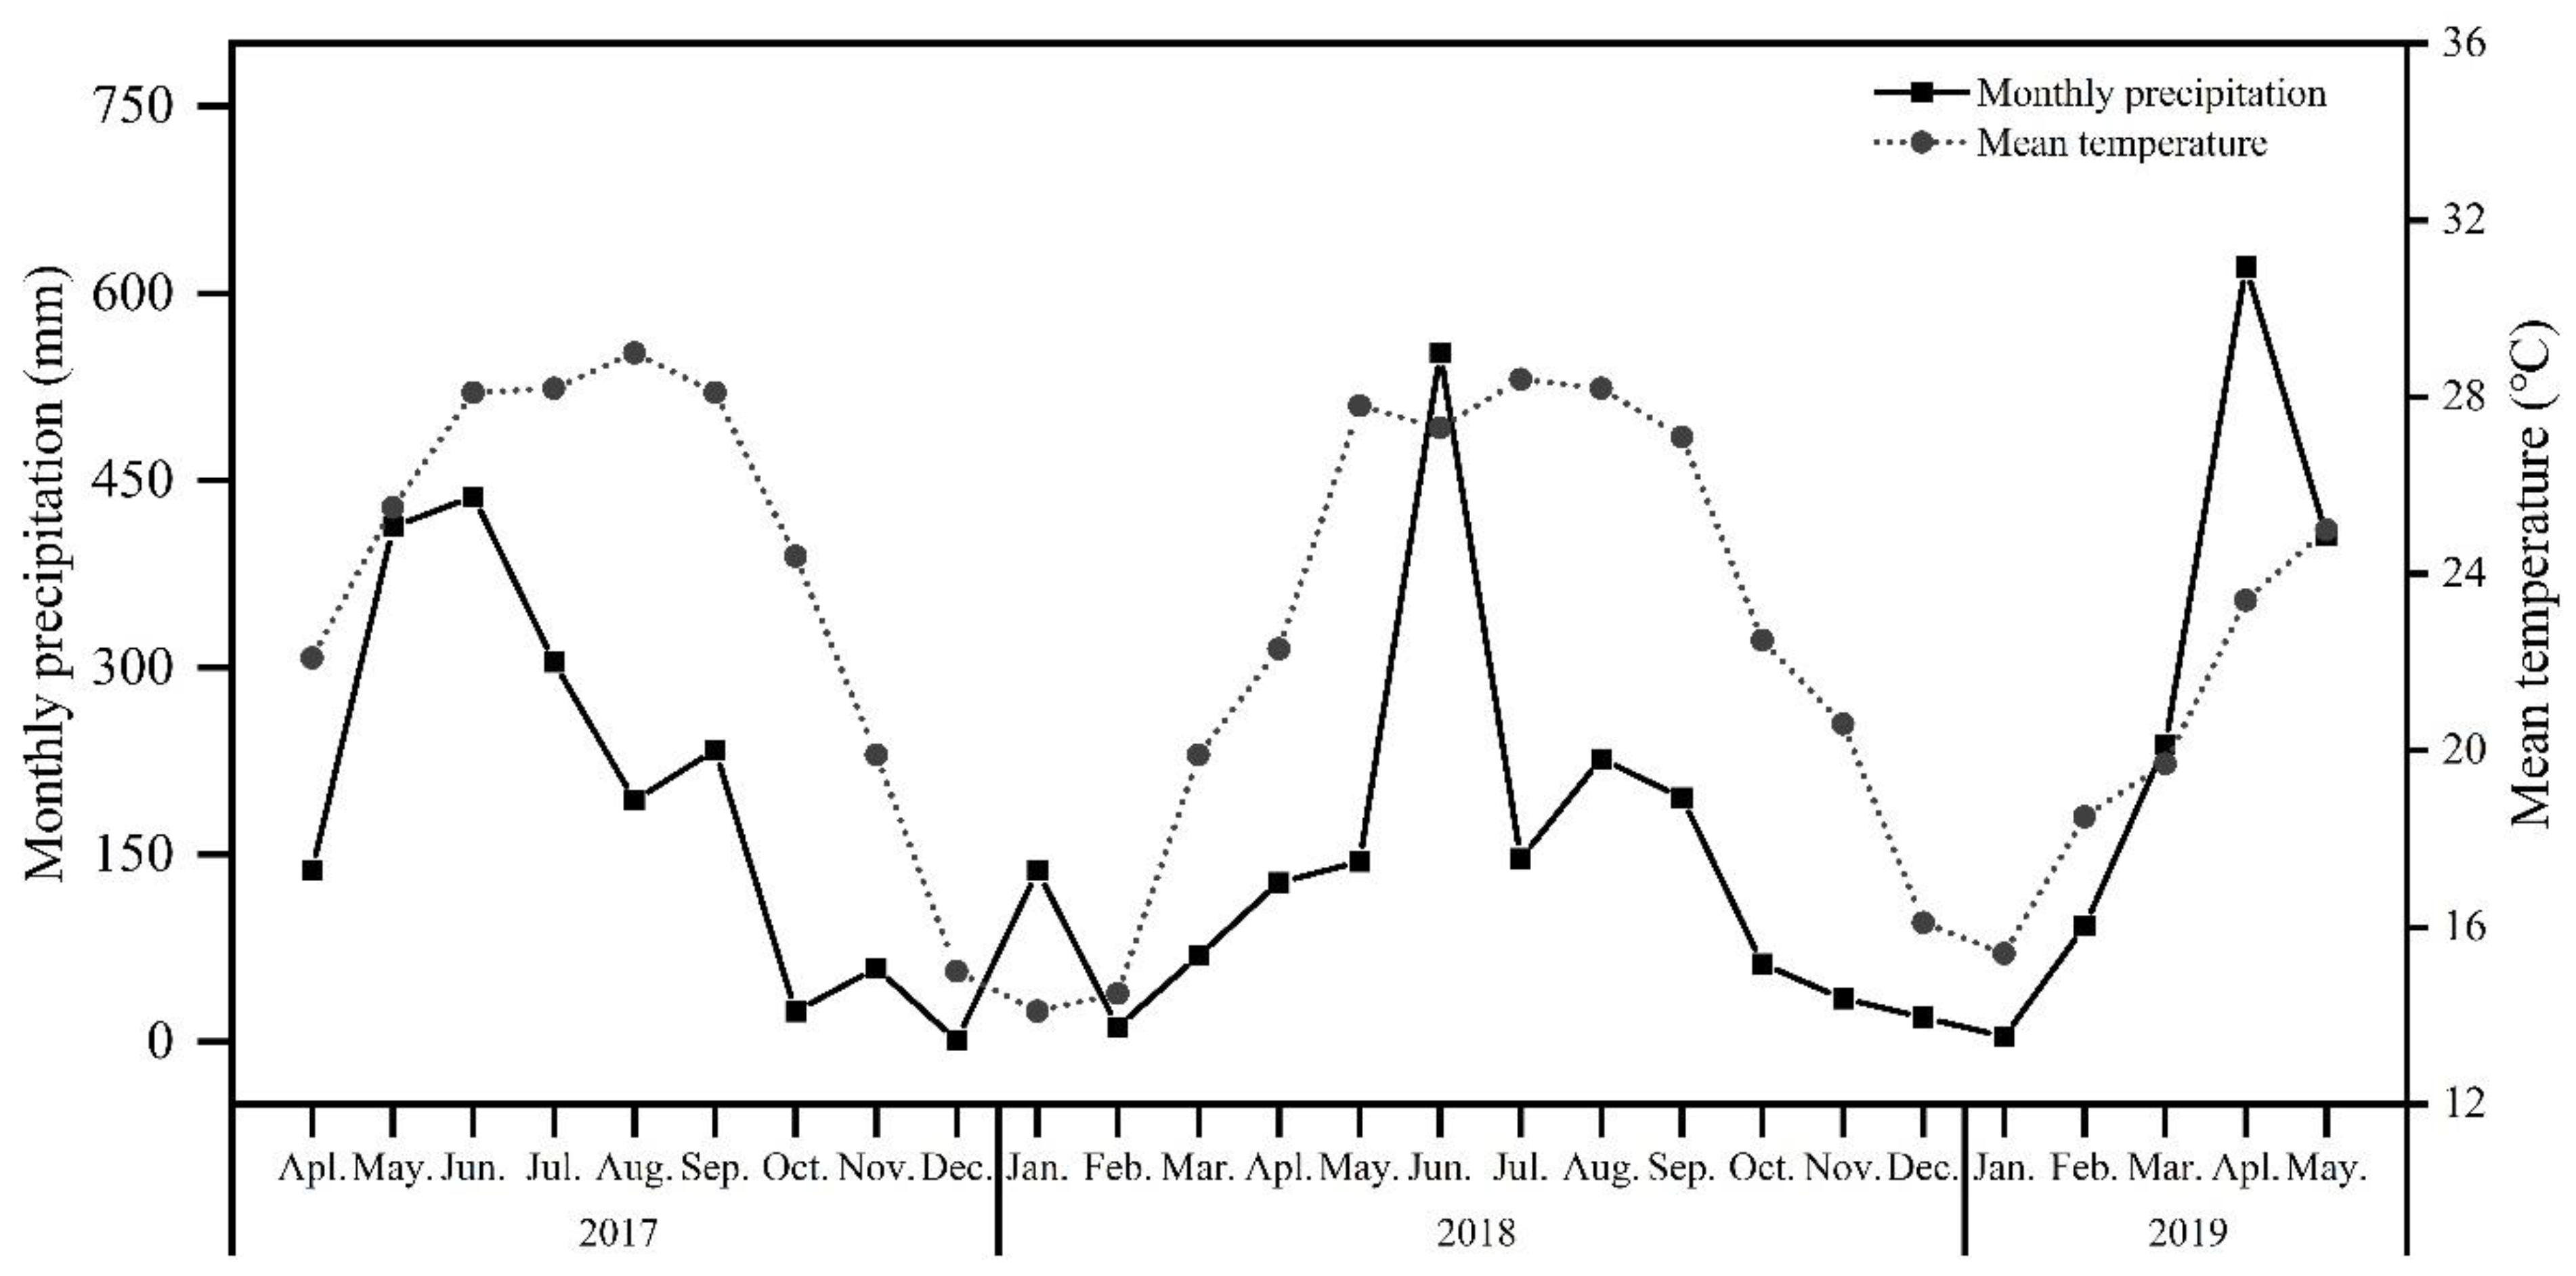
2.1. Study Site and Plant Material

The study was conducted at Zengcheng Teaching and Research Bases of South China Agricultural University, Guangzhou (23°14′48 N, 113°38′20 E), which belongs to subtropical monsoon climate with an annual average temperature of 21.9 °C. Mean annual precipitation is ca. 2004.5 mm, of which about 80% occurs in the rainy season (April to September). According to the meteorological data of Guangzhou, the monthly precipitation at Zengcheng district of Guangzhou, was from 0.8 to 304.3 mm in the dry season of 2017–2019. The mean precipitation of the dry season was only 50.2 mm (Figure 1).
An orthogonal water and fertilizer experimental design set up in April 2017 with high productivity genotypes (Eucalyptus urophylla × E. grandis seedlings). The details were described in Yu’s study [54]. There were four treatments replicated in five blocks, which were divided by the horizontal terraced land preparation method. The four treatments were (1) non-irrigation and non-fertilization (CK), (2) irrigation and non-fertilization (W), (3) non-irrigation and fertilization (F), (4) irrigation and fertilization (WF). Irrigation was carried out only in the dry season (October to December). Irrigation was given 8 h/week at 4 L/h to ensure the soil water concentration at 40 cm depth and 40 cm away from the tree reached 90% of the field water holding capacity. The fertilizer application amount referred to Eucalyptus production. The base fertilizer (400 g) was applied to each tree in March 2017. The fertilizer contained N: 24 g, P: 72 g and K: 24 g. In July 2018, the top dressing (300 g/plant) was applied to F and WF treatments, containing N: 45 g, P: 21 g and K: 24 g. The E. urophylla × E. grandis seedlings with a height of 20–35 cm tall were carefully planted in April 2017. The planting density was 3 × 2 m (1667 plants/hm2) and the total area was about 0.57 hm2. In the early stage, young trees invest most assimilates into growth, which consume a mass of carbohydrates, so they are more likely to exhibit carbon starvation than mature trees [55]. In addition, trees require a large amount of soluble sugar to maintain osmotic adjustment under drought stress, which is not conducive to the growth of Eucalyptus [51]. Thus, studying the influence of dry-season irrigation on young trees can provide data support to maintain the rapid growth during the early stage of Eucalyptus plantations under seasonal drought stress.
To define the soil moisture under fertilization and dry-season irrigation, the soil water content (SWC) was measured at the end of the month with 3 repeats in each block (total 15 repeats each treatment). In each block, the soil samples from three random points (40 cm away from the trees and 40 cm depth) were packed into a small aluminum box. All boxes were weighed and then baked in a 105 °C oven to a constant weight, where SWC (%) = (fresh weight − dry weight)/(dry weight − aluminum box weight) × 100%. The field moisture capacity was measured once a year with the ring-knife method. The relative soil water content (SWCr) = SWC/field moisture capacity. The SWCr from May 2017 to May 2019 is shown in Table 1.

2.2. Index Measurements

2.2.1. Field Sampling and Initial Sample Processing

Sampling was conducted shortly after ending the dry-season irrigation (May 2019). At each block, we selected a standard tree to cut down (total 5 trees per treatment). Each standard tree was in the middle of the treated plot to avoid the forest edge effect. The aboveground parts were electric-saw-felled and the underground parts were dug out by hand. After cutting down the tree, we measured its DBH, tree height and canopy length (Table 2). Considering the metabolism of organs at the same height varying greatly under different treatments, we referred to Smith’s study [36] and divided the canopy and stem into five equal parts to collect leaves, branchlet, old branch and disk. The disk was taken from the middle stem of each segment and carefully whittled into xylem (including metaxylem and secondary xylem) and vascular cambium with a razor blade. The root was dug out after cutting down and divided into fine roots (FR) and coarse roots (CR), which were differentiated by the diameter of 2 mm, and rinsed with water and toothbrush to remove soil from the surface. Each tissue was randomly sampled over 100 g from the divided material in the field (dead branch and leaves excluded). Non-structural carbohydrate samples were immediately dried at 105 °C for 3 h, oven-dried to constant weight at 65 °C, and then ground into powder in a mill with a 0.5 mm sieve.

2.2.2. Chemical Analysis

We measured two basis components of NSC: soluble sugar (the sum of glucose, sucrose and fructose) and starch. Soluble sugar and starch analysis followed anthrone methods [56], which are confirmed to be true and highly correlated with other analysis approaches [57]. To measure soluble sugar concentration, a 0.2 g powdered sample was extracted using 80% hot ethanol (80 °C) for 30 min and rinsed twice followed by colorimetric analysis with ethyl anthrone acetate reagent. The resulting soluble sugar extract was read at 620 mm on a microplate reader. To determine the starch concentration, the remainder of soluble sugar was solubilized in perchloric acid and then colorimetric analysis conducted with ethyl anthrone acetate reagent at 620 mm. Soluble sugar and starch concentration were calibrated by a standard curve for a known concentration made at the same time.

2.3. Statistical Analysis

For multivariate general linear model, we used Duncan’s multiple comparison analysis and correlation analysis; all measured data were square-root transformation to improve normality and heteroscedasticity. Data means of various heights were used as input parameters to conduct PCA.
Excel 2021 was used for data consolidation; SPSS 22.0 and Origin 2021 software were used for the multivariate general linear model (MGLM), Duncan’s multiple comparison analysis, correlation analysis and principal component analysis (PCA) of TSS, starch, NSC and ratio of TSS to starch. For MGLM and Duncan’s multiple comparison analysis, all measured data were square-root transformation to improve normality and heteroscedasticity. The MGLM including three fixed factors (height, dry-season irrigation and fertilization) along with one covariate (block) was used to explain the variations of NSC concentrations and tested the effects of height/classification and treatment using a factorial ANOVA with a nested block structure (block/tree/height). Data means of various heights were used as input parameters to conduct PCA.

3. Results

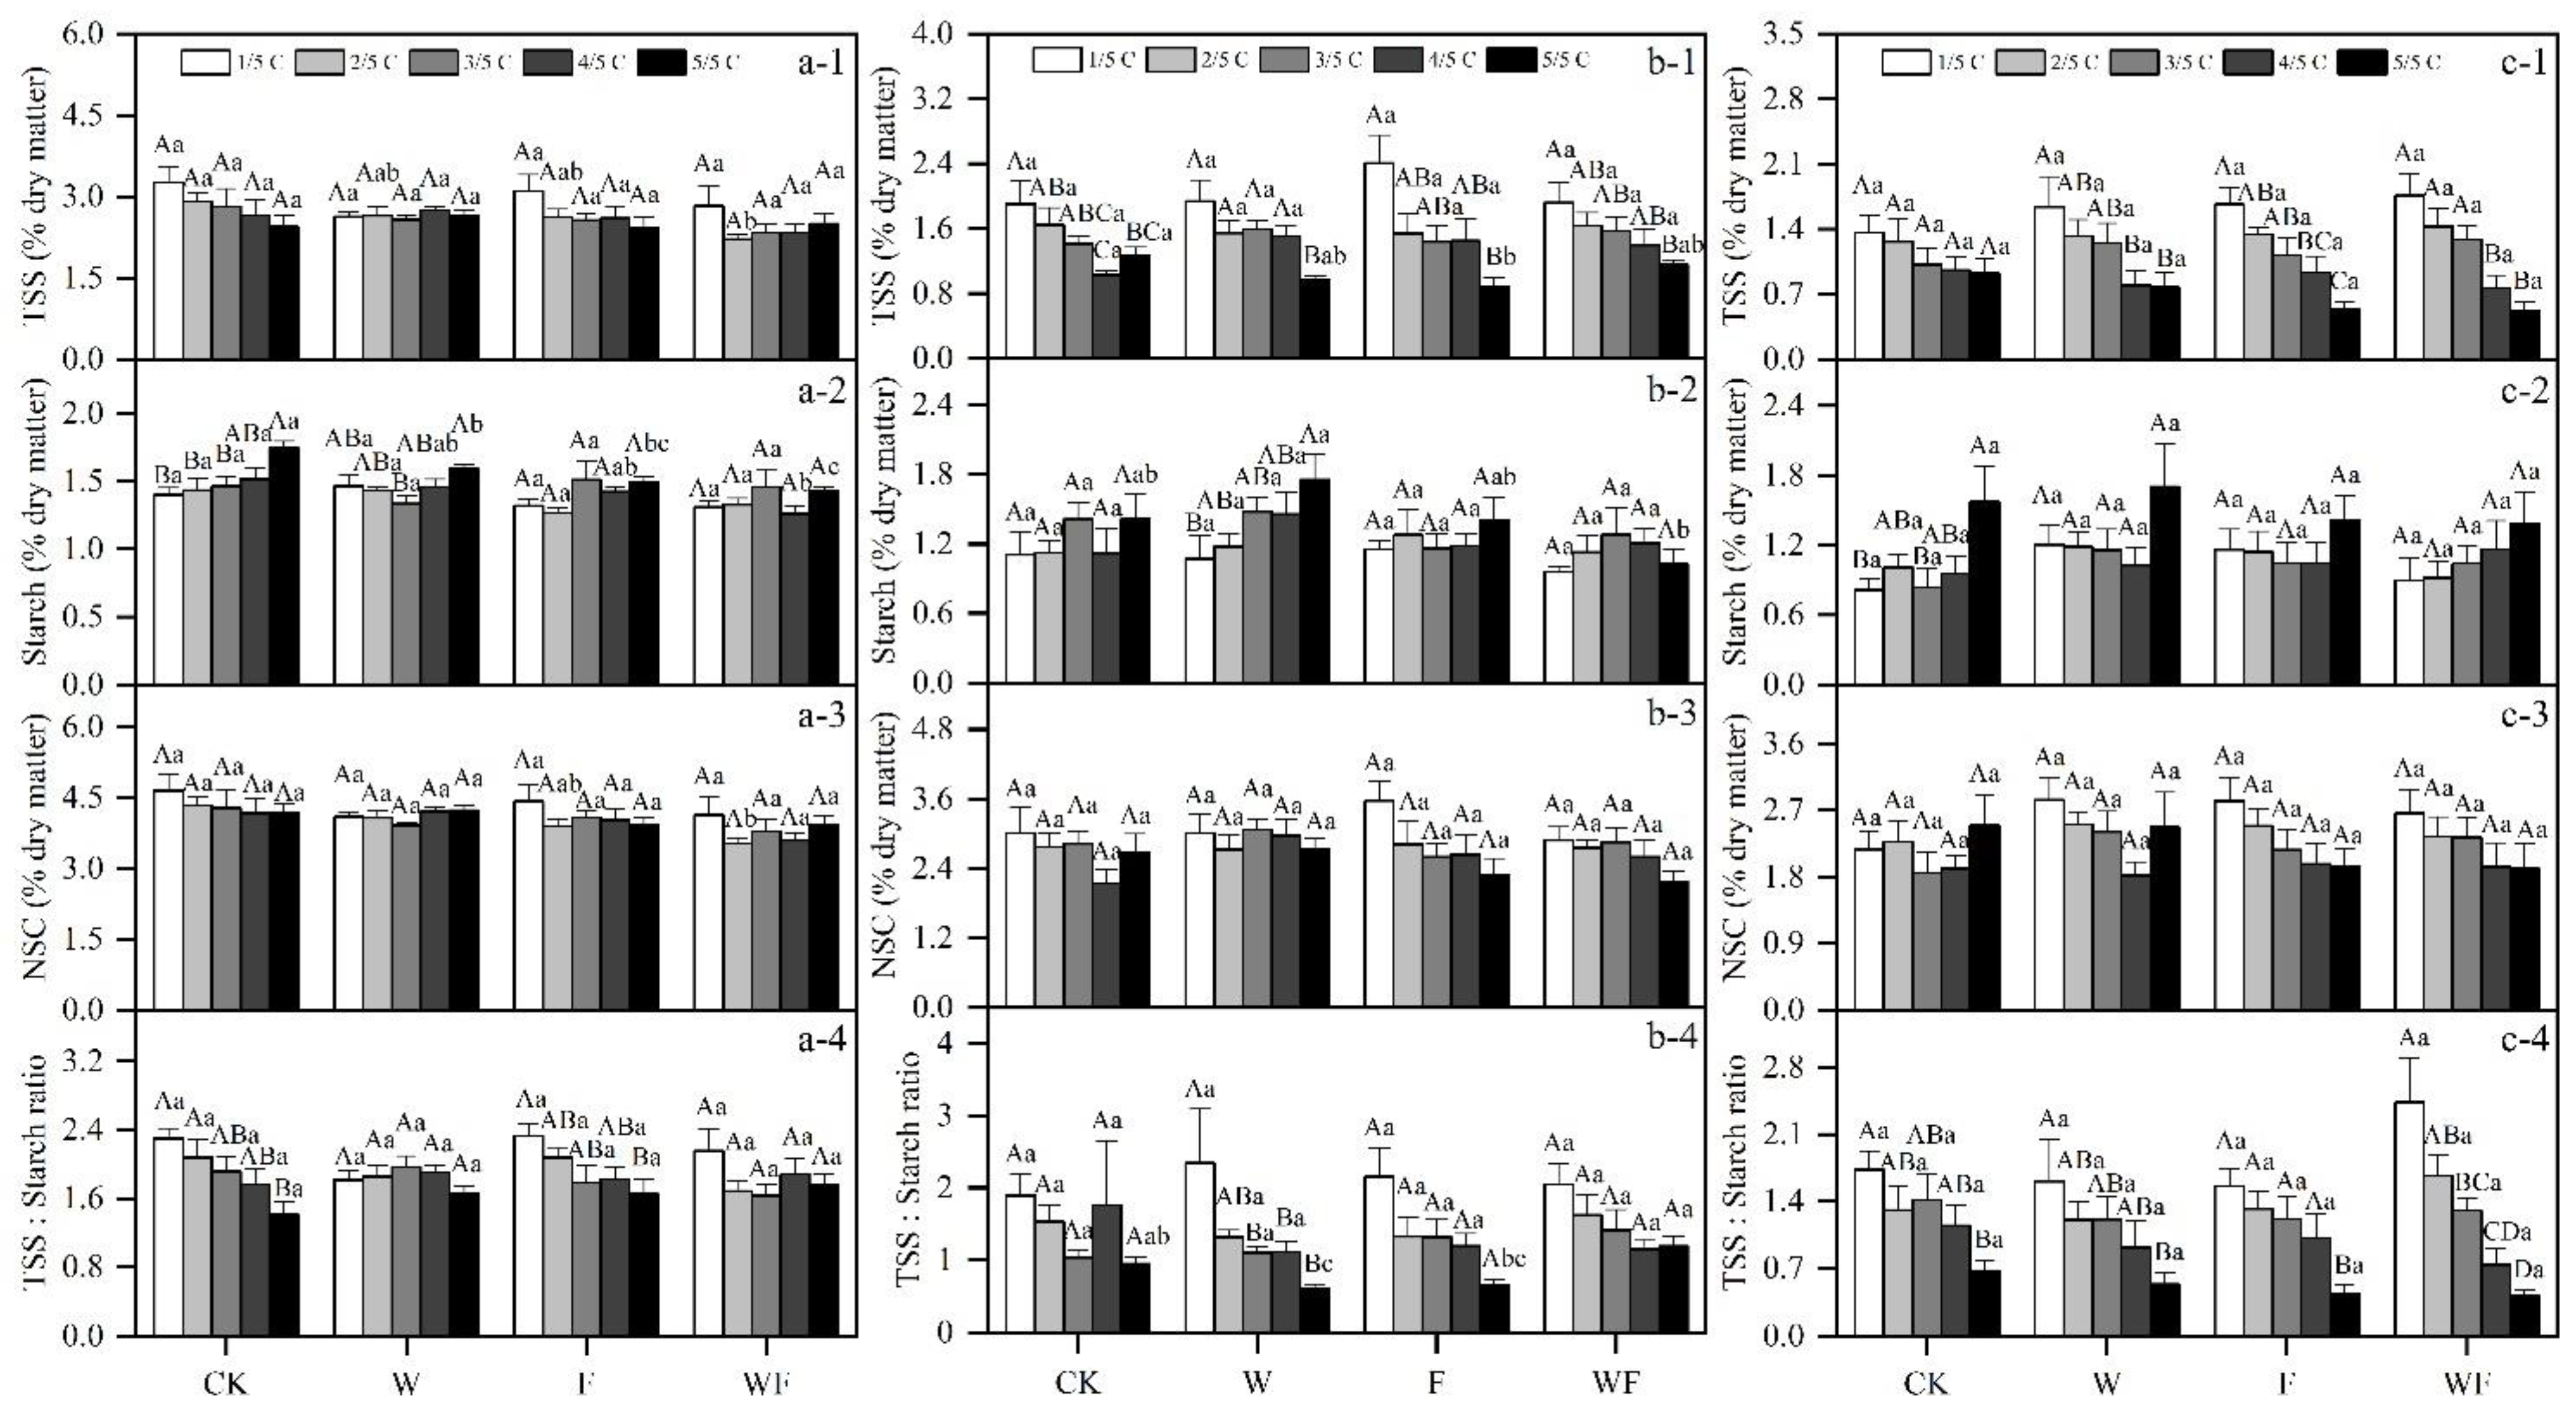
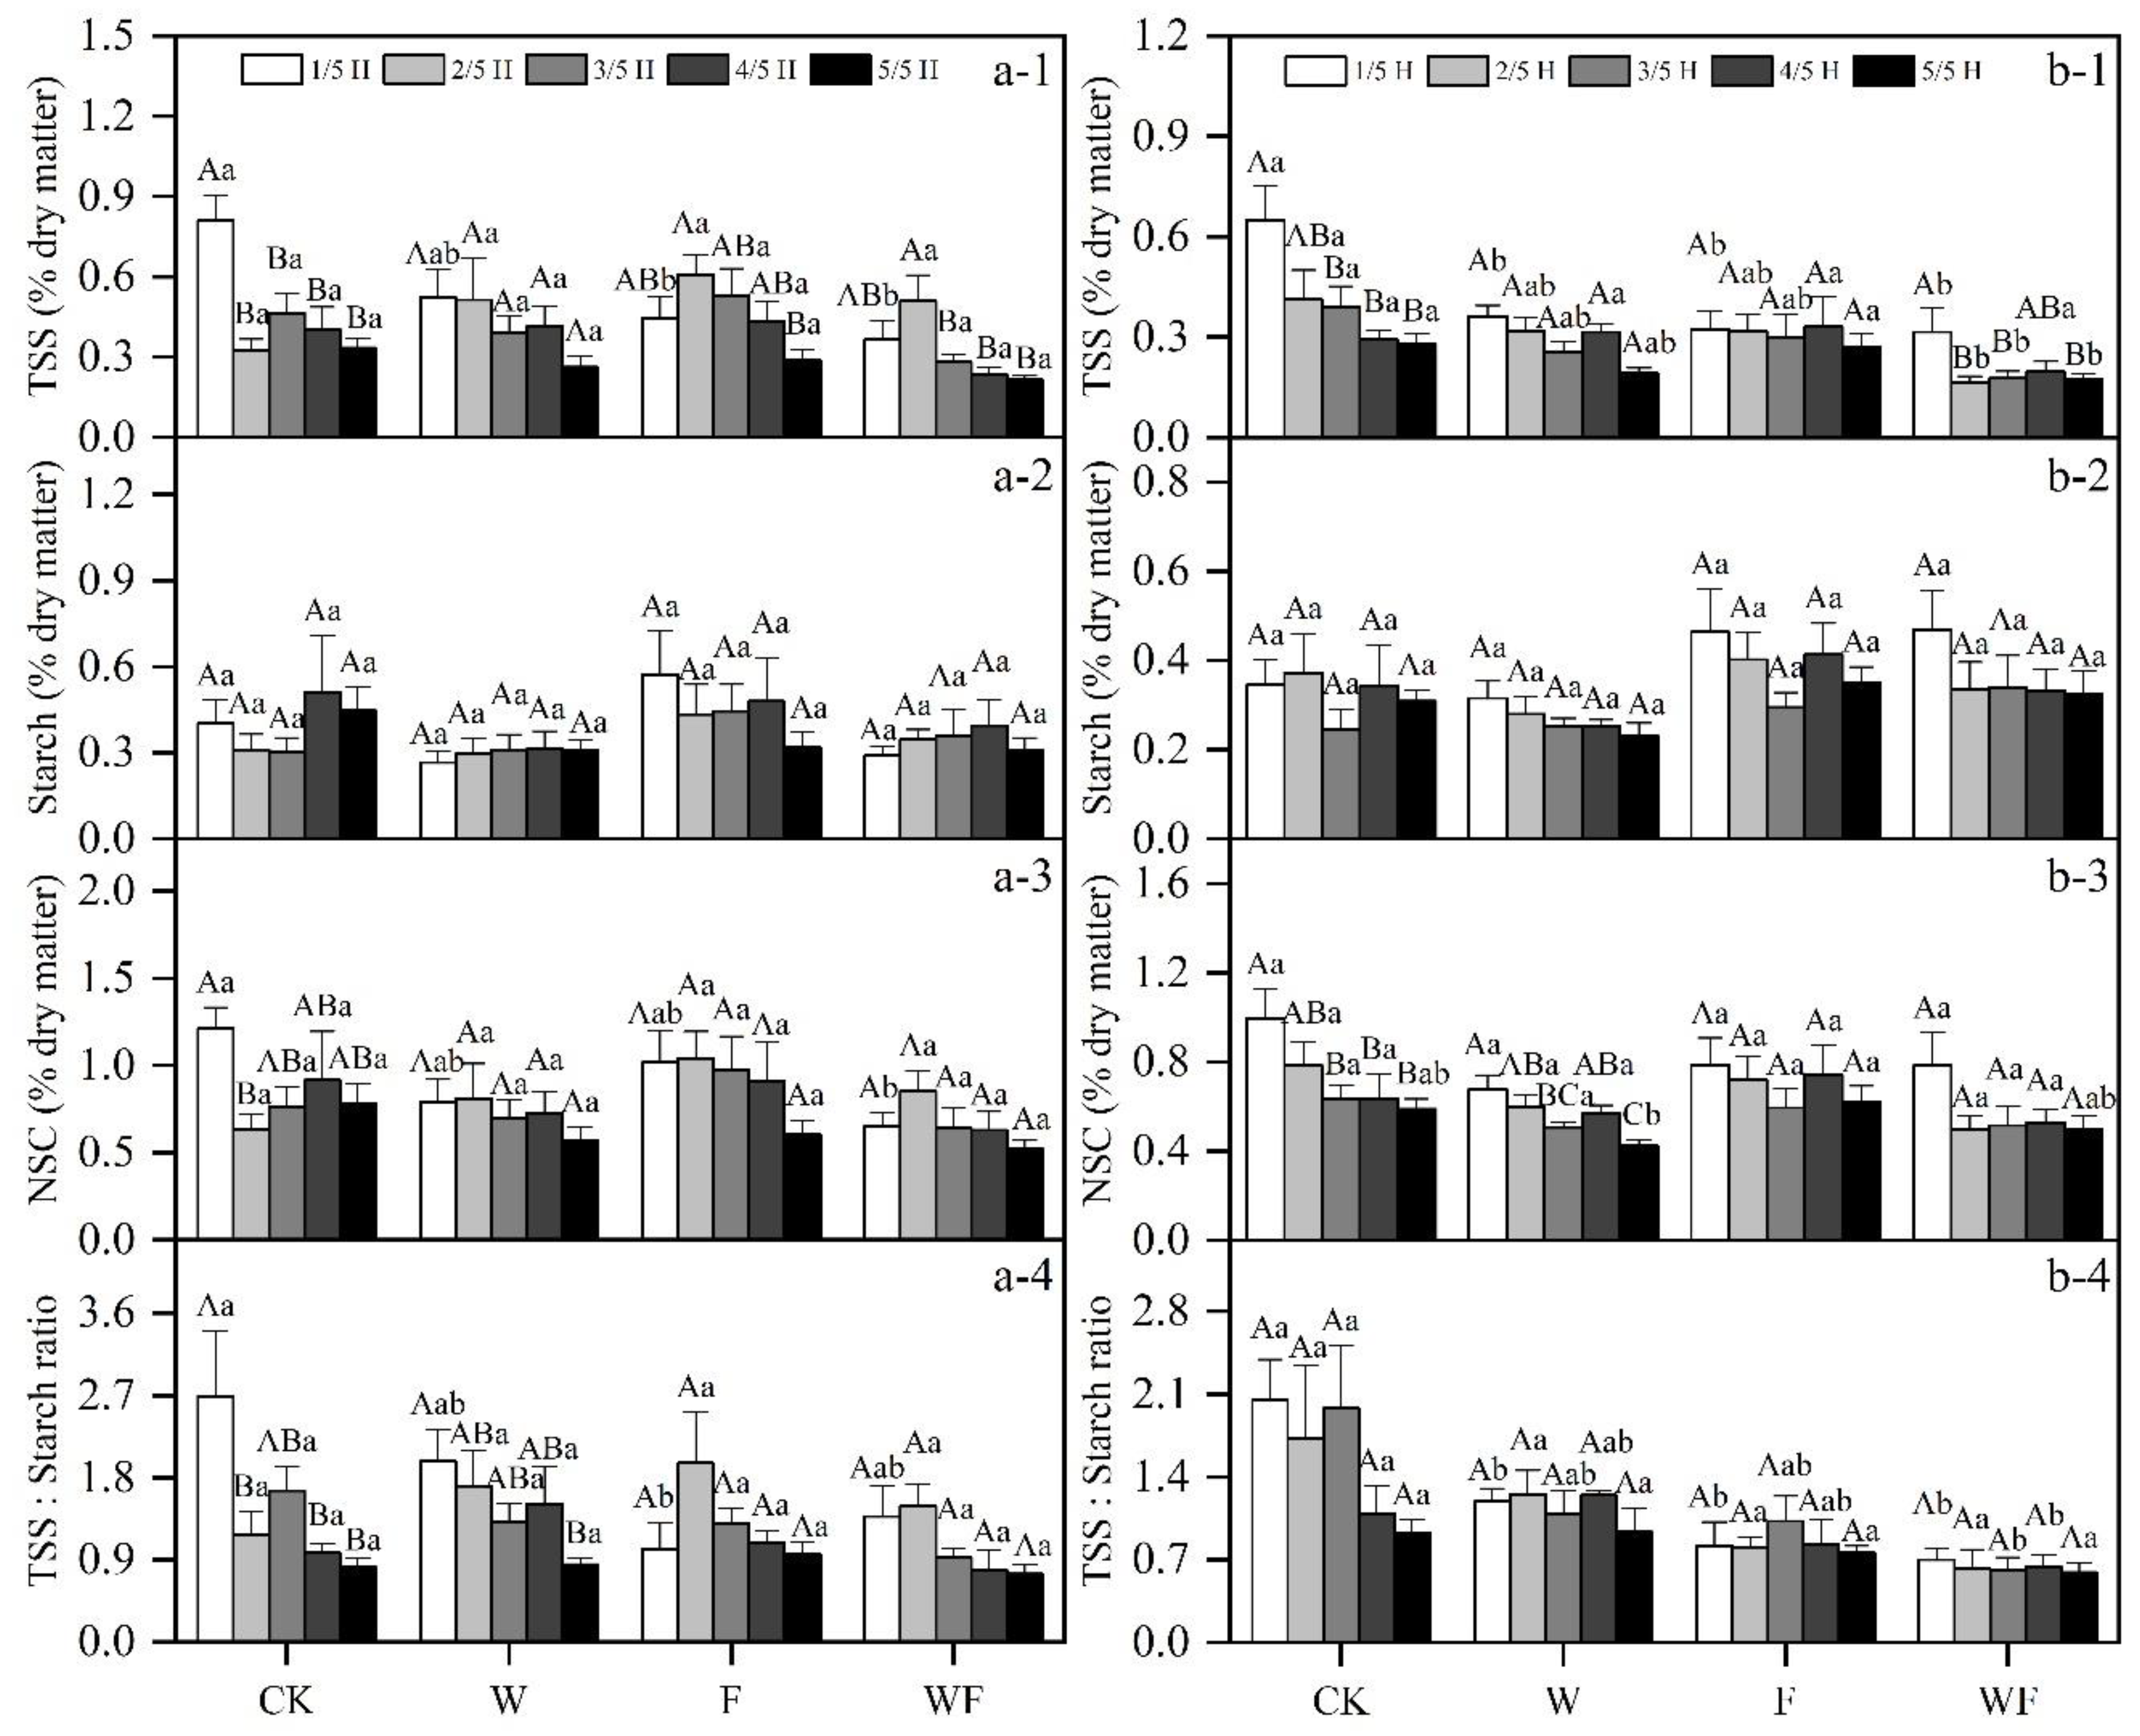
3.1. Variation of Aboveground NSC Concentrations under Different Treatments

In the aboveground part of 2-year-old Eucalyptus, the TSS, starch and NSC concentrations formed gradient differences from source organ to sink organ (Figure 2 and Figure 3), ranking as leaf > branchlet > old branch > stem xylem > stem cambium. In addition, the TSS showed a decreased trend with height in most tissues (except leaves), while the starch showed a contrary trend in leaves, branchlet and old branch.
Duncan’s multiple comparison analysis revealed that dry-season irrigation and fertilization decreased the TSS concentrations of the aboveground part (Figure 2 and Figure 3), but barely affected the NSC concentrations (except leaf in 2/5C, stem xylem in 1/5H and stem cambium in 5/5H). Even though the differences of various treatments in most tissues of canopy were not significant, W and F decreased the TSS concentrations of branchlet and old branch, and only the TSS concentration of branchlet in 5/5C was decreased by F (42%, Figure 2). In addition, compared to CK, WF significantly decreased the foliar TSS concentration in 2/5C (−23%, Figure 2(a-1)). Variations of different treatments in starch concentration were much less than that of TSS concentration. Significant decrease of foliar starch concentration induced by W and F was only observed in 5/5H (−8% and −14%), while decrease caused by WF was only detected in 4/5H (−18%, Figure 2(a-2)). In addition, due to the increased starch concentration of branchlet in 5/5H, the starch concentration in 5/5H under WF was significantly lower than that under W (−70%, Figure 2(b-2)). In the stem, dry-season irrigation and fertilization significantly decreased the TSS concentrations of stem xylem and stem cambium. In stem cambium, the TSS of stem cambium under CK was significantly higher (106%, 152%, 120% and 59%) than that under WF in 1/5H, 2/5H, 3/5H and 5/5H (Figure 3(b-1)). In stem xylem, F significantly decreased the TSS concentration in 1/5H (−54%, Figure 3(a-1)).
On the whole, even though dry-season irrigation and fertilization significantly affected TSS concentration of various tissues, only WF significantly decreased the NSC concentration of leaf in 2/5C (−19%, Figure 2(a-3)) and stem xylem in 1/5H (−46%, Figure 3(a-3)). The axial patterns in ratio were consistent with TSS, while the radial patterns were not. In particular, W and F treatments had more influence on stem cambium than other tissues, and specifically, W only significantly decreased the ratio of branchlet in 5/5H (−37%, Figure 2(b-4)) and F significantly decreased the ratio of stem xylem in 1/5H (−62%, Figure 3(a-4)). In stem cambium, W and F significantly decreased the ratio in 1/5H (−42% and −60%). Compared to W, the ratio of cambium in 4/5H under WF significantly decreased about 48%, while the ratio in 3/5H under WF was significantly lower than that under CK (−69%, Figure 2(b-4)).

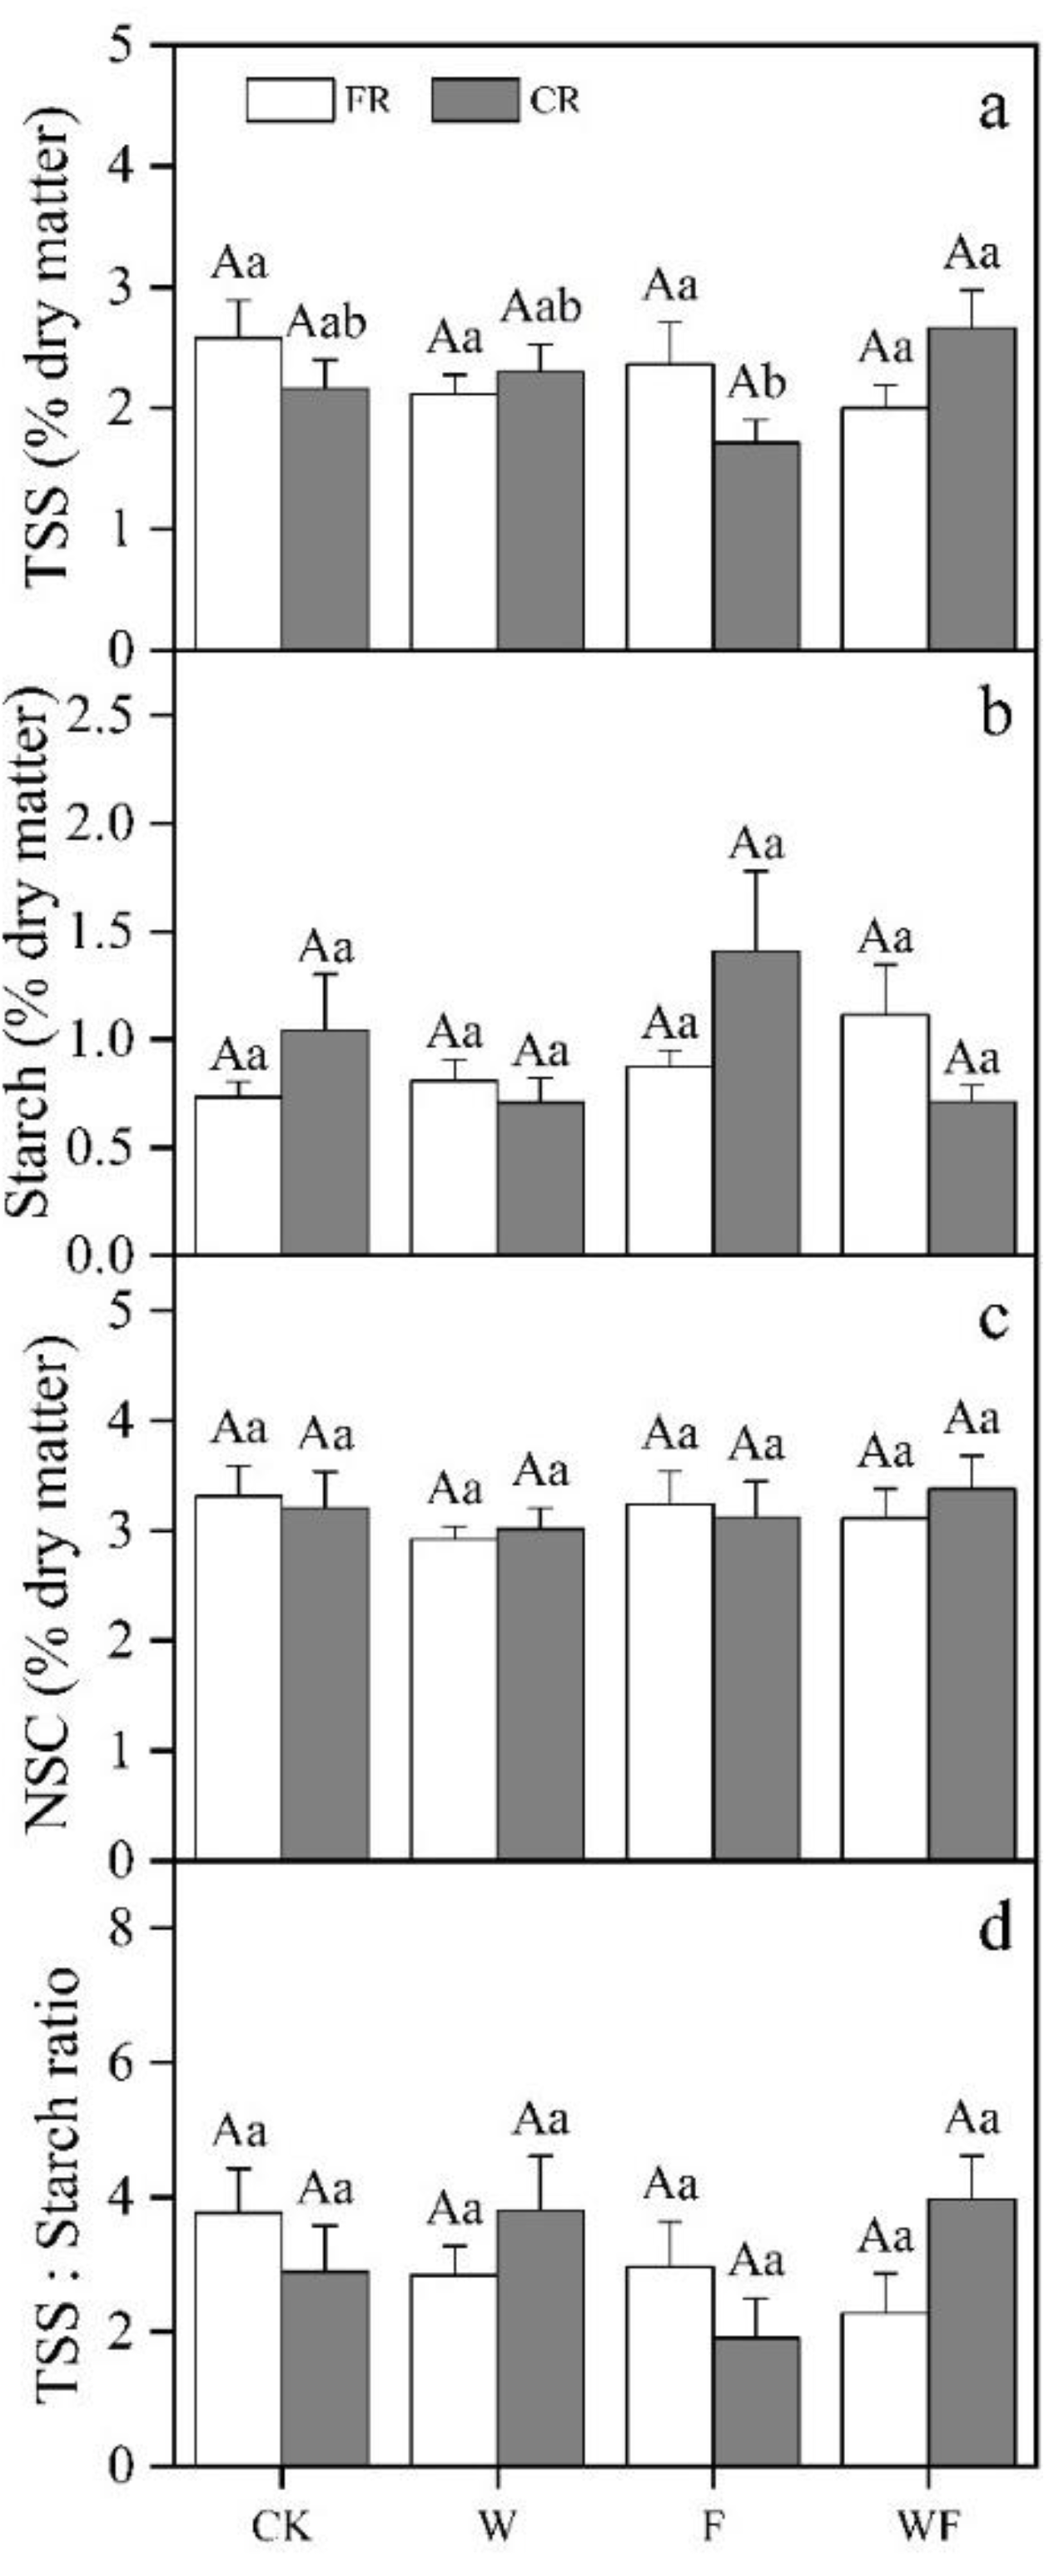
3.2. Variation of Underground NSC Concentrations under Different Treatment

Underground, TSS concentrations were still obviously higher than starch concentration and the ratios of FR and CR were distinctly higher than aboveground. In spite of source organ (leaf) as the primary sink organ, roots had the greatest concentrations of TSS (2.2%, Figure 4), which were notably higher than that of branchlet, old branch, stem xylem and stem cambium (0.3–1.5%, Figure 2 and Figure 3). Compared to the aboveground part, different treatments had a little influence on the concentrations of FR and CR, for which only the TSS concentration in coarse root under WF was significantly higher (55.5%) than that under F (Figure 4a).

3.3. Multivariate General Linear Model (MGLM) of the NSC Concentrations in Various Tissues

According to the MGLM, the NSC concentrations of various tissues were mostly affected by height and block, but not the treatments (Table 3 and Table 4). Dry-season irrigation mainly influenced the TSS and NSC concentrations of stem xylem and cambium, while fertilization primarily affected NSC concentrations of leaf and stem cambium. The mixed effects of dry-season irrigation, fertilization and height completely had no significant influences on the NCS concentrations in all tissues (Table 3). The variation of block accounted for 5.6%–65.6% of the NSC concentrations in all tissues.

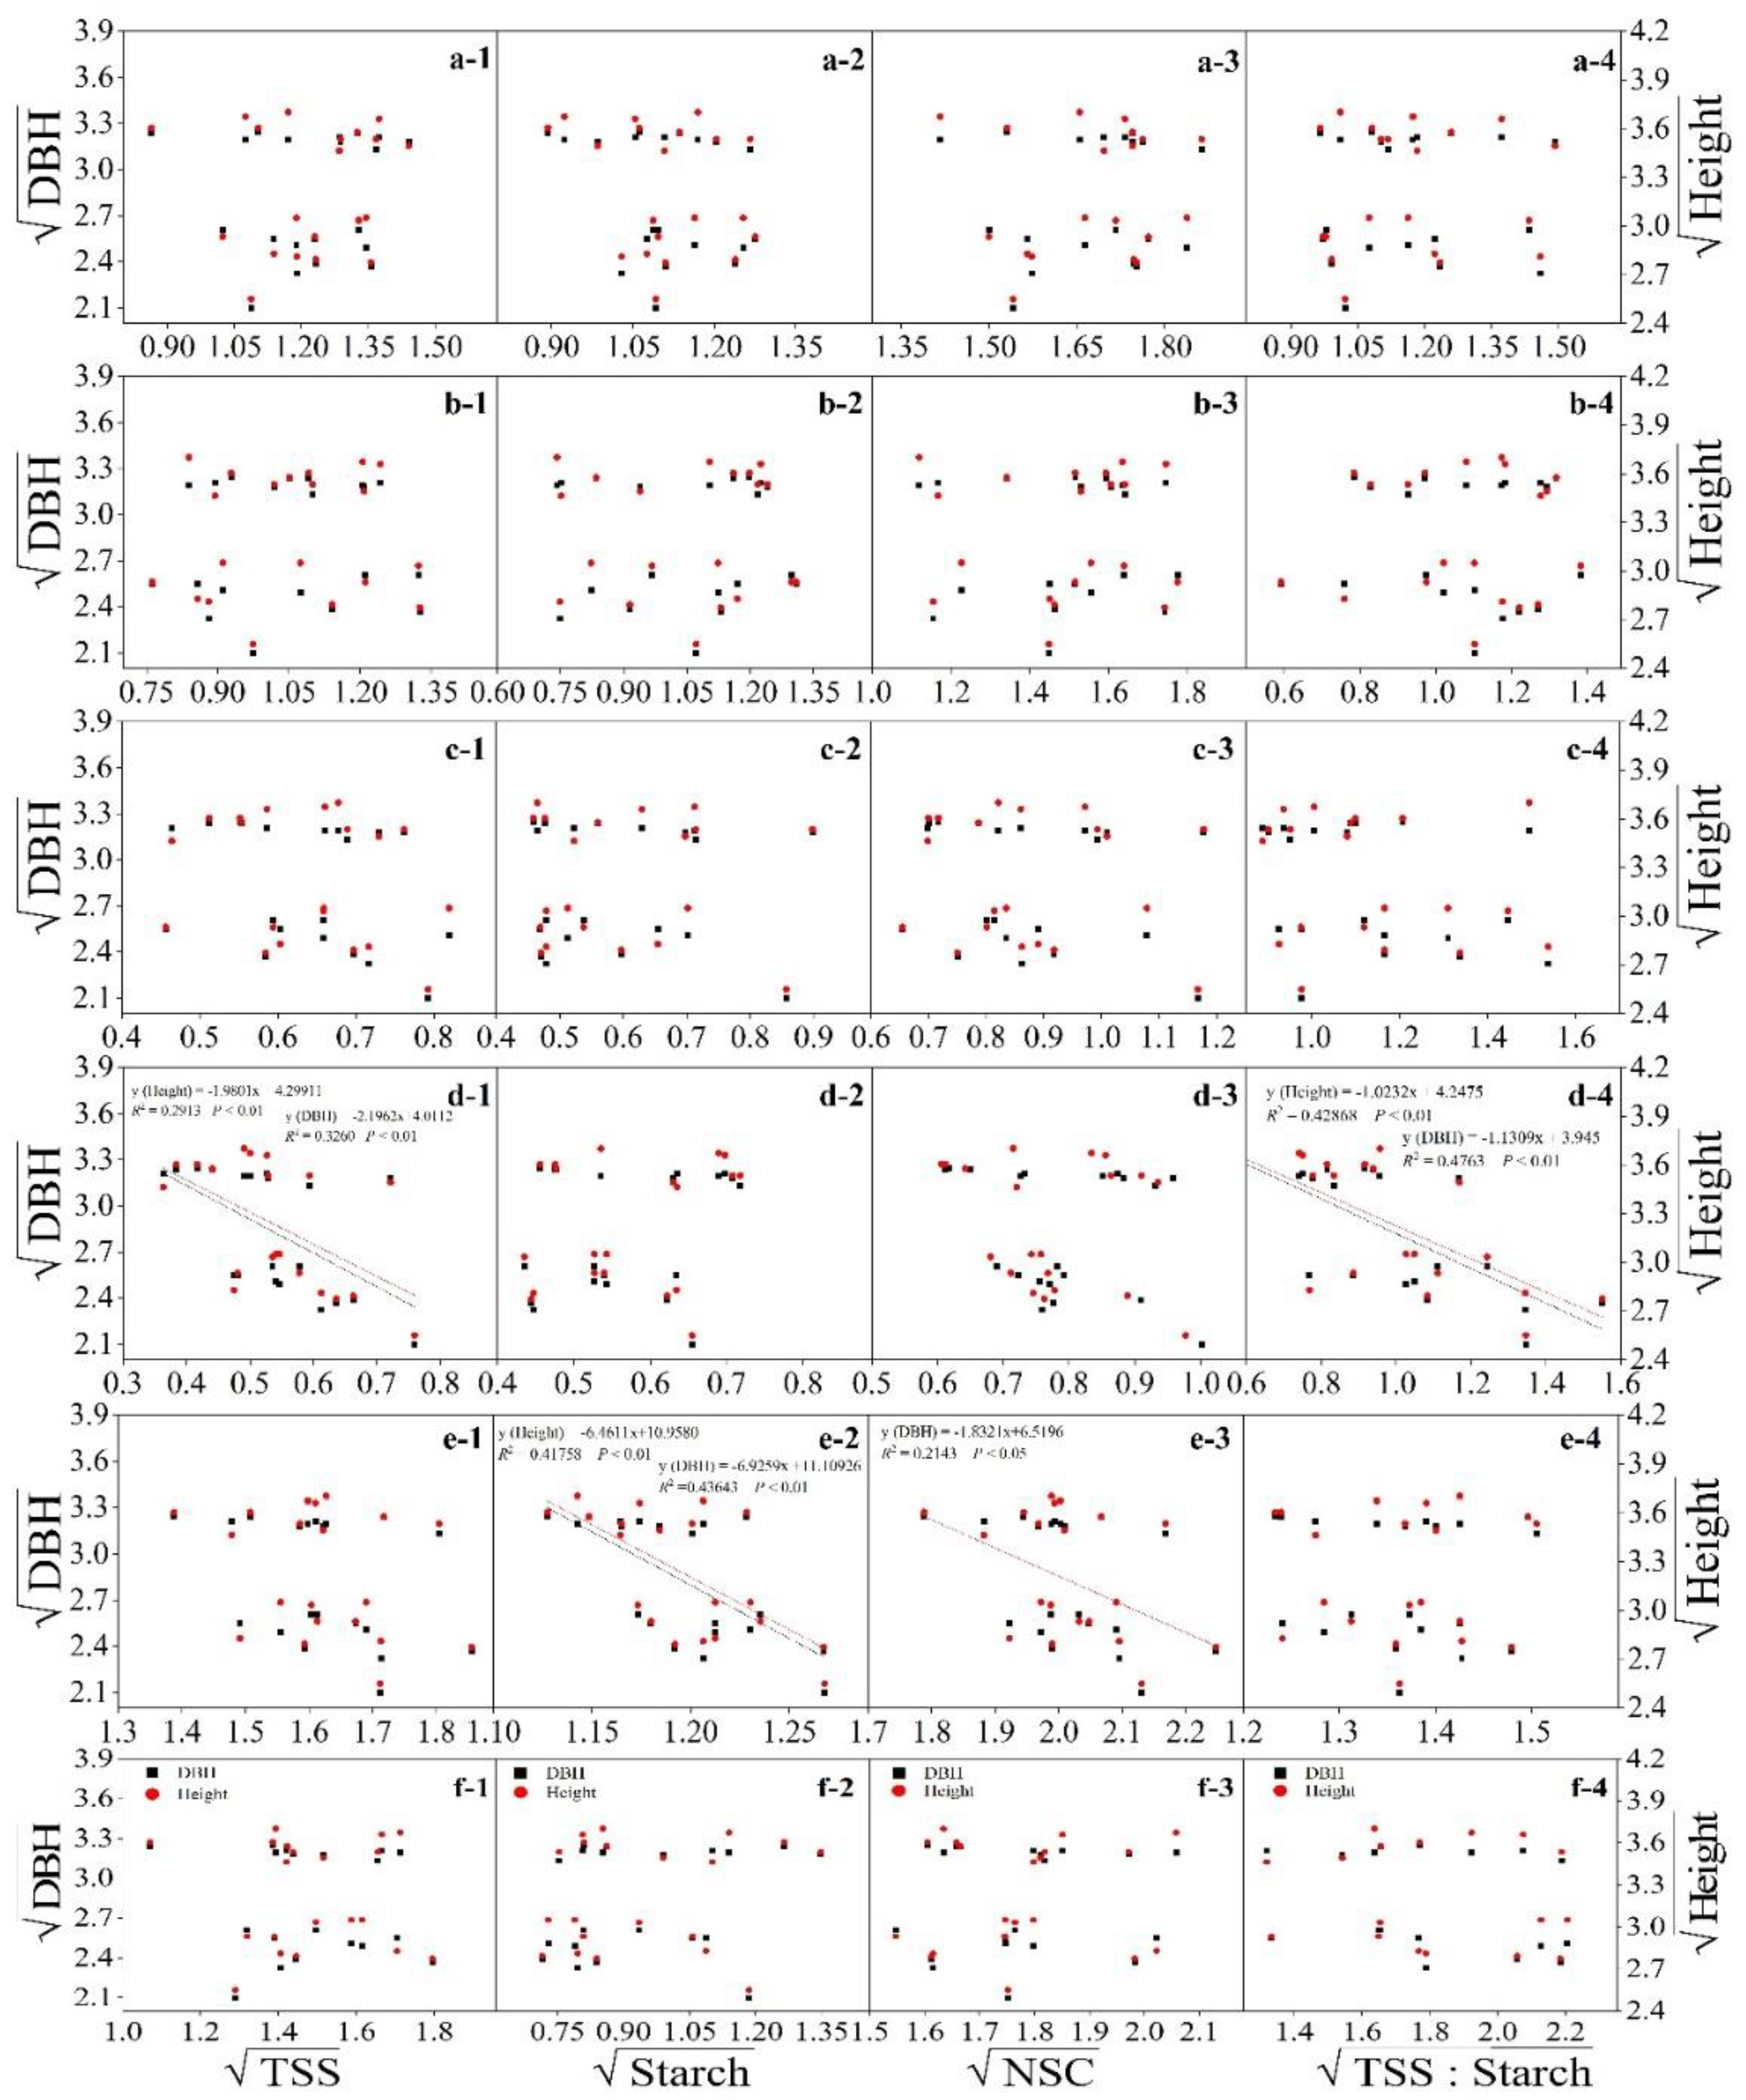
3.4. Relationship between Nonstructural Carbohydrates and Growth

In general, NSC concentration in most tissues had no correlation with DBH and height (Figure 5), while the Pearson analysis showed significantly negative correlation with growth indexes in NSC concentration of both stem cambium and xylem (p < 0.01 and p < 0.05). However, the relationship between them and growth indexes was different. The TSS of stem cambium was significantly negatively correlated with height and DBH (Figure 5(d-1)), resulting in the same correlation of the ratio of TSS to starch (Figure 5(d-4)). The starch of xylem also showed a negative correlation with height and DBH (Figure 5(e-2)). In particular, xylem only showed negative correlation with height in NSC (Figure 5(e-3)). Nevertheless, there was no correlation between the ratio of TSS to starch and growth indexes in xylem.

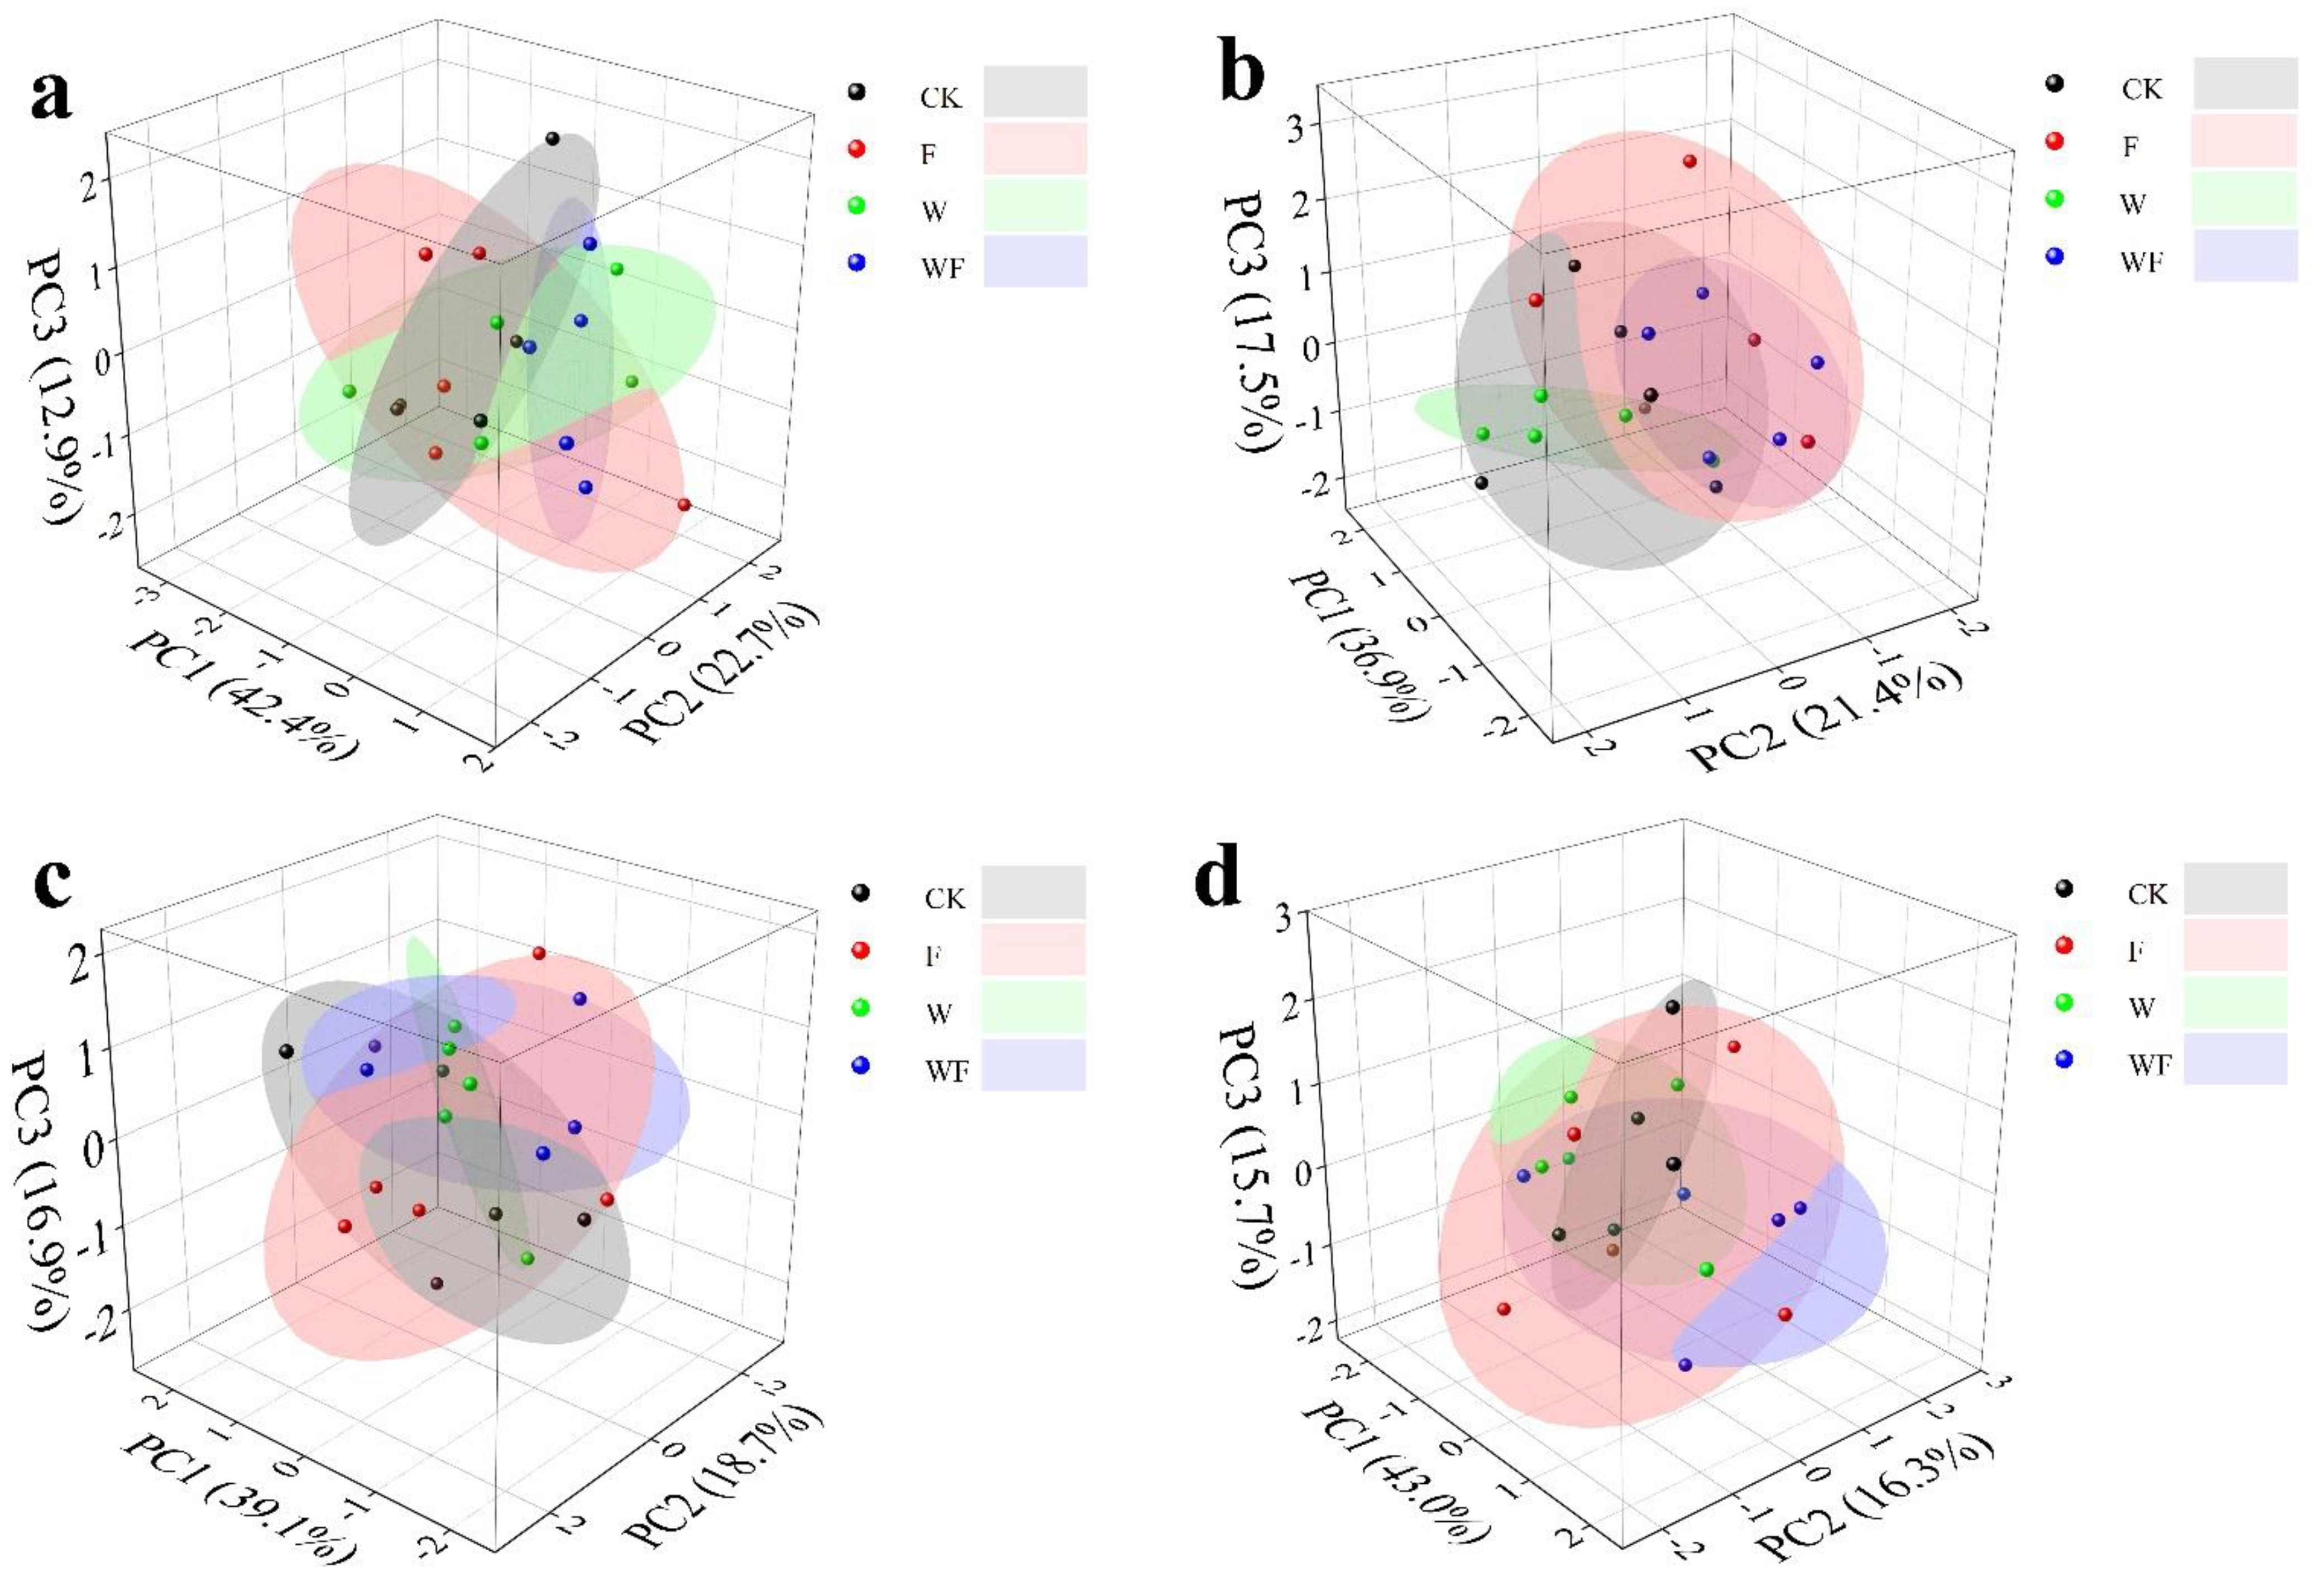
3.5. Effects of Different Treatments on NSC

Fertilization and dry-season irrigation induced the modification of E. urophylla × E. grandis in NSC that reflected in changes of the six tissues (leaf, branchlet, old branch, stem xylem, stem cambium and root). We used variance analysis and Pearson correlation analysis to identify parameters that are most sensitive for fertilization and dry-season irrigation. However, each parameter was not completely independent because the NSC distribution of plants was different under various environments. Therefore, PCA was used to comprehensively evaluate the changes of experimental data, which could effectively analyze the variation of different treatments on NSC. The result of PCA shown in Figure 6a–d represent PC1 (42.4%, 36.9%, 37.1%, 37.4%), PC2 (22.7%, 21.4%, 18.7%, 17.8%) and PC3 (12.9%, 17.5%, 16.9%, 15.5%) of the total variance in TSS, starch, NSC and ratio, respectively. In TSS, the sample distribution within PC1/PC2/PC3 three-dimensional space is not homogeneous. The scatter of various treatments was clearly divided into four regions (Figure 6a). In Figure 6a, the four elliptical regions overlap each other partly (¼–⅓), except that the ellipse of WF is completely separated from F. Compared to TSS, the four ellipses in starch, NSC and ratio have a higher degree of overlap (Figure 6b–d). In particular, the WF ellipse in starch completely overlaps with F ellipse, while the WF ellipse is perpendicular to W ellipse with minimal overlap (Figure 6a–b). It means that fertilization and dry-season irrigation have various effects on TSS and starch. Dry-season irrigation has a great effect on TSS and fertilization has a significant effect on starch.

4. Discussion

4.1. Soluble Sugar as the Primarily Existing Form of NSC

The ratio of TSS to starch was greater than one in most tissues, which proved that soluble sugar is the primary existing form of NSC, consistent with other Eucalyptus species [36,51,58,59]. However, our study showed lower NSC concentration in stem and higher TSS concentrations in root, which may be caused by the difference of metabolic intensity under various growth stages [30,60] and interspecific and intraspecific variations [22]. TSS concentration varied significantly among tissues indicating that TSS was not distributed uniformly across all tissues but preferentially stored in specific storage pool. In contrast, starch concentrations were similar among all organs but maintained at a lower level, indicating that starch was not accumulated. As an anisohydric strategy species, high TSS concentration was beneficial to maintain a high metabolic intensity to ensure growth throughout the year, which was not conductive to store NSC to resist adversity [61].
Fertilization and dry-season irrigation reduced the TSS concentration of most tissues, while having little effect on starch and NSC. TSS performs immediate functions (e.g., osmoregulation) and provides energy for metabolism and repairing tissue damage, while starch is used as a carbon storage pool with inactive osmosis [62]. When trees suffer drought stress, a water deficit would lead to overproduction of reactive oxygen species (ROS) in leaves, causing damage to proteins, lipids and nucleic acids [63]. High TSS concentration is conductive to enhance osmotic adjustment, protect macromolecules (such as protein) and provide energy for antioxidant defense system used to scavenge ROS [64,65]. In addition, high TSS concentration could promote the repair of xylem embolism caused by drought stress [66]. Affected by the strategies of anisohydric, Eucalyptus relies on osmotic adjustment to control the osmotic potential of living cells in leaves and stems under drought stress. The substances involved in the osmotic regulation of Eucalyptus are mainly composed of soluble sugar, cyclitols and potassium ions [41,67], among which the soluble sugar plays an important role [68]. Thus, the decrease in TSS induced by dry-season irrigation proved the presence of drought stress in Eucalyptus under control and fertilization treatments. However, the decrease of TSS caused by fertilization is inconsistent with the observation that fertilization stimulated trees accumulation of soluble sugar under drought stress [69,70]. These soluble sugars are converted to starch under drought stress (Figure 2, Figure 3 and Figure 4), even though fertilization has no effect on the starch concentration of most organs. In another drought experiment of E. urophylla, Chen [51] found that starch was converted by over 35% to soluble sugar to maintain osmotic adjustment and repair the xylem embolism, which is contrary to our results. Fertilization decreasing soluble sugar concentration in our results may be caused by one or a combination of several elements: (i) application of potassium enhanced osmotic regulation, causing K+ partly to replace the role of soluble sugar [53] or (ii) rapid growth characteristics result in the consumption of large amounts of soluble sugar.

4.2. NSC Concentrations of Tissues under Dry-Season Irrigation and Fertilization

At the tissue level, soluble sugar and starch were not distributed uniformly among all tissues, forming a gradient difference from source organ to sink organ. NSC were primarily stored in roots, which were conductive to uptake water and survive in drought stress [71,72,73], with small part stocks located in the branches, which can be consumed by bud break and leaf expansion for growth [74]. The significantly different distribution of carbohydrates between stem and root means that NSC storage is spatially proximate to root. It is clear that the coordination between NSC storage and root is an optimized storage strategy that evolved with underground growth. In contrast, the root system is a virtual component of the forest ecosystem: water and nutrient uptake, mechanical support and carbon and nutrients supply to the rhizosphere [75]. On the other hand, roots can act as soil environmental sensors, sending signals to the canopy [76]. Higher NSC concentrations are beneficial to keep cell turgor [77] and promote root growth [78] to optimize water uptake, especially Eucalyptus, a species with great transpiration [79]. However, different treatments had little influence on root NSC concentrations when drought stress existed in CK and F treatment (Table 1). In most cases, drought increased root NSC concentration to obtain water [28,62], but decreased them over time due to carbon consumption larger than supply [61]. Although there some research observed that root NSC concentrations did not change under drought stress, the response mechanism has been rarely reported [80].
In present study, we observed that the NSC concentration of roots is about 2–6 times greater than that of stems, which is different from previous studies [58,59]. During the early growth stages in Eucalyptus, excessive growth rate of stems consumes a large amount of NSC, especially 2 years after planting [81]. The negative correlations of growth and the NSC concentrations in stem xylem and cambium indicate that investment in DBH and height are the main reason for the lowest NSC concentrations among all tissues. As the growth rate of stems slow with age, stems accumulate NSC to slightly lower than that of roots [36,59,60]. However, low stem NSC concentration was adverse to the repair of xylem embolism caused by drought stress, which further enhanced the water deficit in Eucalyptus [66]. Compared to significant differences in height and DBH, stem xylem and cambium NSC under different treatments are maintained at similar levels, which further indicates that E. grandis × E. urophlly as an anisohydric species put all the assimilates increased by fertilization and dry-season irrigation into growth [36,49]. In particular, fertilization and dry-season irrigation also had little effect on the soluble sugar and starch concentration of leaves and branches, while having significant influences on stem cambium. This finding is contrary to the widely accepted conclusion that soluble sugar concentration increased under drought stress, and in addition, the presence of drought stress had been proved in our study during the dry season and under fertilization (Table 1) [36]. The soluble sugar decline in stem cambium under dry-season irrigation further indicates that drought stress had affected the metabolic activity [82]. In the drought experiment of Eucalyptus, the response to drought stress varies greatly at the organ level, even though the level of whole tree soluble sugar concentration increased [51,59]. Fertilization decreased TSS concentration contrary to our hypothesis that fertilization can increase TSS concentration to resist drought stress. Compared to the starch concentration, fertilization promoted the soluble sugar to convert into starch in stem cambium, which is contrary to the result of Li [39] and Huang [69]. This might be caused by the formation of a gradient difference in carbon distribution [14] and consumption of rapid growth [59]. In particular, the effects of additional irrigation were not obvious under fertilization, which seems that irrigation had not alleviated the drought stress caused by fertilization. Those findings are contrary to another hypothesis that fertilization had positive effects on NSC, which can be affected by dry-season irrigation [30,69]. In fact, compared to irrigation treatment, the increase of canopy biomass under fertilization diluted the effects of dry-season irrigation to a great extent.
On the whole, fertilization and dry-season irrigation had little effect on NSC concentration except stem cambium. Drought stress induced by fertilization and climate in our study site decreased physiological traits such as photosynthesis and transpiration, and morphological traits such as leaf area and growth [38,51]. The reaction of NSC is detrimental to survival under severe drought. However, we currently lack the data of prolonged and severe droughts to test whether NSC insensitivity is associated with growth and survival. If so, fast-growing plantations need to strengthen water management under mid-drought to reduce the risk of severe droughts.

4.3. TSS Concentrations Decreased with Height

Most tissues indicated a decreasing trend of NSC concentration with height, which was mainly caused by the change of soluble sugar concentration. However, such change was not significant, except in stem xylem and cambium. There was also a decreased trend with height for soluble sugar, whereas starch concentration did not vary with height in most tissues, which is consistent with Smith’s finding [36] but contrary to our hypothesis. The decreased trend indicates that carbon demand at the top of trees is larger than supply. Due to the apical dominance [83], upper parts of trees grow faster than other parts, resulting in a large amount of NSC consumption. In addition, foliar photosynthesis decreased with height because of enhancing hydraulic limitations [84]. When newly photosynthetic assimilates could not meet the demand, the NSC in storage organs would be remobilized to meet the metabolic requirement [15,17,85]. However, the remobilization could damage the phloem under drought stress. According to the Mücnch model [86], the allocation of NSC was driven by hydrostatic pressure gradient from source organ to sink organ. Notably, water movement from xylem to phloem could be limited by the high xylem tensions in upper xylem and apoplast, which results in increase of the phloem sap concentration and limit of assimilate transport [31]. The lower soluble sugar concentrations increase the osmotic potential, which leads to hydraulic limitation and restriction of water influx from xylem [87,88], and eventually resulting in phloem damage by long-distance transport and excessive sap concentration [14,31,51]. In the source organ, sugar is loaded into the phloem in two ways, either energetically against gradient difference with consuming energy or moving along the gradient difference passively [27]. The decreased trend of TSS with height helped E. urophylla × E. grandis transport TSS from below to the above. However, because of few studies of Eucalyptus, it is unclear that the long-distance transport of sugar from bottom to top results in extreme phloem damage [31,53]. We were surprised to find that fertilization and dry-season irrigation had little effect on NSC concentrations in horizontal and vertical direction, which further proved that the strategy of anisohydric species coping with drought stress is aggressive. Although it is well known that root growth greatly responds to drought and fertilization [42,43,78], past research has not adequately studied the NSC distribution underground. In order to realize NSC distribution of the entire tree under different growth patterns, further research will need to identify the NSC distribution in the underground part of Eucalyptus and its response to fertilization and irrigation.

5. Conclusions

In a subtropical zone in southern China with seasonal drought, our results indicated soluble sugar was the primary existing form of NSC and mainly stored in roots. Throughout the tree, E. urophylla × E. grandis formed gradient differences from source organ to sink organ and from bottom to top in aboveground parts, which were not changed by fertilization and dry-season irrigation. However, the mechanism of how trees form the gradient differences need further study. Using the isotope label method can make this carbon-derived dynamic more apparent. There are still many factors affecting carbohydrate distribution, which directly correlate to nutrient concentration [88] and cyclitol concentration [67]. Under drought stress, NSC concentration changes without significant differences in most tissues of E. urophylla × E. grandis, but the TSS concentrations were reduced by fertilization and dry-season irrigation. The reaction of NSC is detrimental to survival under severe drought. Eucalyptus can uptake deep groundwater to alleviate drought stress [6]. There may be a gradient difference of NSC concentration in the underground part as similar with that of the aboveground part, which needs further investigation. In conclusion, this research helps us better understand the strategy between carbon storage and growth under seasonal drought, further realizing the spatial pattern of carbon in a fast-growing tree species.

Author Contributions

J.-Y.L. and Q.Q. mainly contributed to the conceptualization of the work; funding acquisition, Q.Q. and J.-Y.L.; investigation, J.-J.K., F.H. and W.-Q.L.; methodology and analysis, Y.S., Q.H. and J.-J.K.; project administration, F.Y., Y.S., J.-Y.L. and Q.Q.; resources, J.-J.K.; software, J.-J.K.; visualization, Q.Q. and Q.H.; writing—original draft preparation, J.-J.K., Q.Q.; writing—review and editing, L.H. All authors have read and agreed to the published version of the manuscript.

Funding

This research was supported by the National Natural Science Foundation of China (31800527) and National Key Research and Development Program of China (2016YFD0600201; 2016YFD060020102).

Institutional Review Board Statement

Not applicable.

Informed Consent Statement

Not applicable.

Data Availability Statement

Data are contained within the article.

Acknowledgments

The authors wish to thank the editor and the anonymous reviewers for their valuable insights.

Conflicts of Interest

The authors declare no conflict of interest.

References

  1. Spinoni, J.; Barbosa, P.; De Jager, A.; McCormick, N.; Naumann, G.; Vogt, J.V.; Magni, D.; Masante, D.; Mazzeschi, M. A new global database of meteorological drought events from 1951 to 2016. J. Hydrol. 2019, 22, 100593. [Google Scholar] [CrossRef] [PubMed]
  2. Wang, W.; Wang, J.; Liu, X.; Zhou, G.; Yan, J. Decadal drought deaccelerated the increasing trend of annual net primary production in tropical or subtropical forests in southern China. Sci. Rep. 2016, 6, 28640. [Google Scholar] [CrossRef] [PubMed] [Green Version]
  3. Bhusal, N.; Lee, M.; Reum Han, A.; Han, A.; Kim, H.S. Responses to drought stress in Prunus sargentii and Larix kaempferi seedlings using morphological and physiological parameters. For. Ecol. Manag. 2020, 465, 118099. [Google Scholar] [CrossRef]
  4. Caurla, S.; Lobianco, A. Estimating climate service value in forestry: The case of climate information on drought for maritime pine in Southwestern France. Clim. Serv. 2020, 17, 100106. [Google Scholar] [CrossRef]
  5. Battie-Laclau, P.; Delgado-Rojas, J.S.; Christina, M.; Nouvellon, Y.; Bouillet, J.; Piccolo, M.D.C.; Moreira, M.Z.; Gonçalves, J.L.D.M.; Roupsard, O.; Laclau, J. Potassium fertilization increases water-use efficiency for stem biomass production without affecting intrinsic water-use efficiency in Eucalyptus grandis plantations. For. Ecol. Manag. 2016, 364, 77–89. [Google Scholar] [CrossRef] [Green Version]
  6. Christina, M.; le Maire, G.; Nouvellon, Y.; Vezy, R.; Bordon, B.; Battie-Laclau, P.; Gonçalves, J.L.M.; Delgado-Rojas, J.S.; Bouillet, J.P.; Laclau, J.P. Simulating the effects of different potassium and water supply regimes on soil water content and water table depth over a rotation of a tropical Eucalyptus grandis plantation. For. Ecol. Manag. 2018, 418, 4–14. [Google Scholar] [CrossRef] [Green Version]
  7. O’Connell, C.S.; Ruan, L.; Silver, W.L. Drought drives rapid shifts in tropical rainforest soil biogeochemistry and greenhouse gas emissions. Nat. Commun. 2018, 9, 1348. [Google Scholar] [CrossRef]
  8. Huang, S.; Ye, G.; Lin, J.; Chen, K.; Xu, X.; Ruan, H.; Tan, F.; Chen, H.Y.H. Autotrophic and heterotrophic soil respiration responds asymmetrically to drought in a subtropical forest in the Southeast China. Soil Biol. Biochem. 2018, 123, 242–249. [Google Scholar] [CrossRef]
  9. Bastida, F.; Torres, I.F.; Andres-Abellan, M.; Baldrian, P.; Lopez-Mondejar, R.; Vetrovsky, T.; Richnow, H.H.; Starke, R.; Ondono, S.; Garcia, C.; et al. Differential sensitivity of total and active soil microbial communities to drought and forest management. Glob. Chang. Biol. 2017, 23, 4185–4203. [Google Scholar] [CrossRef]
  10. Wang, Z.; Du, A.; Xu, Y.; Zhu, W.; Zhang, J. Factors Limiting the Growth of Eucalyptus and the Characteristics of Growth and Water Use under Water and Fertilizer Management in the Dry Season of Leizhou Peninsula, China. Agronomy 2019, 9, 590. [Google Scholar] [CrossRef] [Green Version]
  11. Wang, Z.; Zhong, R.; Lai, C.; Zeng, Z.; Lian, Y.; Bai, X. Climate change enhances the severity and variability of drought in the Pearl River Basin in South China in the 21st century. Agric. For. Meteorol. 2018, 249, 149–162. [Google Scholar] [CrossRef]
  12. Xie, Y.; Arnold, R.J.; Wu, Z.; Chen, S.; Du, A.; Luo, J. Advances in Eucalypt research in China. Front. Agric. Sci. Eng. 2017, 4, 380–390. [Google Scholar] [CrossRef] [Green Version]
  13. Pan, J.; Lin, N.; He, Q.; Su, Y.; Li, J. Factors influencing the productivity of three Eucalyptus plantation areas in China. Acta Ecol. Sinca 2018, 38, 6932–6940. [Google Scholar]
  14. Dietze, M.C.; Sala, A.; Carbone, M.S.; Czimczik, C.I.; Mantooth, J.A.; Richardson, A.D.; Vargas, R. Nonstructural carbon in woody plants. Annu. Rev. Plant Biol. 2014, 65, 667–687. [Google Scholar] [CrossRef] [PubMed] [Green Version]
  15. Muhr, J.; Messier, C.; Delagrange, S.; Trumbore, S.; Xu, X.; Hartmann, H. How fresh is maple syrup? Sugar maple trees mobilize carbon stored several years previously during early springtime sap-ascent. New Phytol. 2016, 209, 1410–1416. [Google Scholar] [CrossRef] [PubMed]
  16. Carbone, M.S.; Czimczik, C.I.; Keenan, T.F.; Murakami, P.F.; Pederson, N.; Schaberg, P.G.; Xu, X.; Richardson, A.D. Age, allocation and availability of nonstructural carbon in mature red maple trees. New Phytol. 2013, 200, 1145–1155. [Google Scholar] [CrossRef] [PubMed] [Green Version]
  17. Klein, T.; Hoch, G.; Yakir, D.; Korner, C. Drought stress, growth and nonstructural carbohydrate dynamics of pine trees in a semi-arid forest. Tree Physiol. 2014, 34, 981–992. [Google Scholar] [CrossRef] [PubMed] [Green Version]
  18. Zhang, T.; Cao, Y.; Chen, Y.; Liu, G. Non-structural carbohydrate dynamics in Robinia pseudoacacia saplings under three levels of continuous drought stress. Trees 2015, 29, 1837–1849. [Google Scholar] [CrossRef]
  19. Kannenberg, S.A.; Phillips, R.P. Non-structural carbohydrate pools not linked to hydraulic strategies or carbon supply in tree saplings during severe drought and subsequent recovery. Tree Physiol. 2020, 40, 259–271. [Google Scholar] [CrossRef]
  20. Zhang, P.; Zhou, X.; Fu, Y.; Shao, J.; Zhou, L.; Li, S.; Zhou, G.; Hu, Z.; Hu, J.; Bai, S.H.; et al. Differential effects of drought on nonstructural carbohydrate storage in seedlings and mature trees of four species in a subtropical forest. For. Ecol. Manag. 2020, 469, 118159. [Google Scholar] [CrossRef]
  21. Cheng, F.; Wang, C. Impacts of Tree Species and Tissue on Estimation of Nonstructural Carbohydrates Storage in Trunk. Sci. Silvae Sin. 2016, 52, 1–9. [Google Scholar]
  22. Furze, M.E.; Huggett, B.A.; Aubrecht, D.M.; Stolz, C.D.; Carbone, M.S.; Richardson, A.D. Whole-tree nonstructural carbohydrate storage and seasonal dynamics in five temperate species. New Phytol. 2019, 221, 1466–1477. [Google Scholar] [CrossRef] [PubMed]
  23. Schiestl-Aalto, P.; Ryhti, K.; Mäkelä, A.; Peltoniemi, M.; Bäck, J.; Kulmala, L. Analysis of the NSC Storage Dynamics in Tree Organs Reveals the Allocation to Belowground Symbionts in the Framework of Whole Tree Carbon Balance. Front. For. Glob. Chang. 2019, 2, 17. [Google Scholar] [CrossRef]
  24. Hartmann, H.; Bahn, M.; Carbone, M.; Richardson, A.D. Plant carbon allocation in a changing world—Challenges and progress: Introduction to a Virtual Issue on carbon allocation. New Phytol. 2020, 227, 981–988. [Google Scholar] [CrossRef]
  25. Piper, F.I. Drought induces opposite changes in the concentration of non-structural carbohydrates of two evergreen Nothofagus species of differential drought resistance. Ann. For. Sci. 2011, 68, 415–424. [Google Scholar] [CrossRef] [Green Version]
  26. Sala, A.; Hoch, G. Height-related growth declines in ponderosa pine are not due to carbon limitation. Plant Cell Environ. 2009, 32, 22–30. [Google Scholar] [CrossRef]
  27. Hartmann, H.; Trumbore, S. Understanding the roles of nonstructural carbohydrates in forest trees—From what we can measure to what we want to know. New Phytol. 2016, 211, 386–403. [Google Scholar] [CrossRef] [PubMed] [Green Version]
  28. Kannenberg, S.A.; Novick, K.A.; Phillips, R.P. Coarse roots prevent declines in whole-tree non-structural carbohydrate pools during drought in an isohydric and an anisohydric species. Tree Physiol. 2018, 38, 582–590. [Google Scholar] [CrossRef]
  29. Chapin, F. The Ecology and Economics of Storage in Plants. Annu. Rev. Ecol. Syst. 1990, 21, 423–447. [Google Scholar] [CrossRef]
  30. Li, W.; Hartmann, H.; Adams, H.D.; Zhang, H.; Jin, C.; Zhao, C.; Guan, D.; Wang, A.; Yuan, F.; Wu, J. The sweet side of global change-dynamic responses of non-structural carbohydrates to drought, elevated CO2 and nitrogen fertilization in tree species. Tree Physiol. 2018, 38, 1706–1723. [Google Scholar] [CrossRef]
  31. Nikinmaa, E.; Hölttä, T.; Hari, P.; Kolari, P.; Mäkelä, A.; Sevanto, S.; Vesala, T. Assimilate transport in phloem sets conditions for leaf gas exchange. Plant Cell Environ. 2013, 36, 655–669. [Google Scholar] [CrossRef]
  32. Reinhardt, K.; Germino, M.J.; Kueppers, L.M.; Domec, J.; Mitton, J. Linking carbon and water relations to drought-induced mortality in Pinus flexilis seedlings. Tree Physiol. 2015, 35, 771–782. [Google Scholar] [CrossRef] [Green Version]
  33. Liu, H.; Shangguan, H.; Zhou, M.; Airebule, P.; Zhao, P.; He, W.; Xiang, C.; Wu, X. Differentiated responses of nonstructural carbohydrate allocation to climatic dryness and drought events in the Inner Asian arid timberline. Agric. For. Meteorol. 2019, 271, 355–361. [Google Scholar] [CrossRef]
  34. Oliver, T.H.; Heard, M.S.; Isaac, N.J.B.; Roy, D.B.; Procter, D.; Eigenbrod, F.; Freckleton, R.; Hector, A.; Orme, C.D.L.; Petchey, O.L.; et al. Biodiversity and Resilience of Ecosystem Functions. Trends Ecol. Evol. 2015, 30, 673–684. [Google Scholar] [CrossRef] [PubMed] [Green Version]
  35. Hartmann, H.; Link, R.M.; Schuldt, B. A whole-plant perspective of isohydry: Stem-level support for leaf-level plant water regulation. Tree Physiol. 2021, 41, 901–905. [Google Scholar] [CrossRef]
  36. Smith, M.G.; Miller, R.E.; Arndt, S.K.; Kasel, S.; Bennett, L.T. Whole-tree distribution and temporal variation of non-structural carbohydrates in broadleaf evergreen trees. Tree Physiol. 2018, 38, 570–581. [Google Scholar] [CrossRef] [PubMed] [Green Version]
  37. Woodruff, D.R.; Meinzer, F.C. Water stress, shoot growth and storage of non-structural carbohydrates along a tree height gradient in a tall conifer. Plant Cell Environ. 2011, 34, 1920–1930. [Google Scholar] [CrossRef]
  38. Hua, L.; Yu, F.; Qiu, Q.; He, Q.; Su, Y.; Liu, X.; Li, J. Relationships between diurnal and seasonal variation of photosynthetic characteristics of Eucalyptus plantation and environmental factors under dry-season irrigation with fertilization. Agric. Water Manag. 2021, 248, 106737. [Google Scholar] [CrossRef]
  39. Li, W.; Zhang, H.; Huang, G.; Liu, R.; Wu, H.; Zhao, C.; McDowell, N.G. Effects of nitrogen enrichment on tree carbon allocation: A global synthesis. Glob. Ecol. Biogeogr. 2019, 29, 573–589. [Google Scholar] [CrossRef]
  40. Zahoor, R.; Zhao, W.; Abid, M.; Dong, H.; Zhou, Z. Title: Potassium application regulates nitrogen metabolism and osmotic adjustment in cotton (Gossypium hirsutum L.) functional leaf under drought stress. J. Plant Physiol. 2017, 215, 30–38. [Google Scholar] [CrossRef] [PubMed]
  41. Santos, E.F.; Mateus, N.S.; Rosário, M.O.; Garcez, T.B.; Mazzafera, P.; Lavres, J. Enhancing potassium content in leaves and stems improves drought tolerance of Eucalyptus clones. Physiol. Plant. 2020, 170, 1–19. [Google Scholar]
  42. Goodsman, D.W.; Lieffers, V.J.; Landhäusser, S.M.; Erbilgin, N. Fertilization of lodgepole pine trees increased diameter growth but reduced root carbohydrate concentrations. For. Ecol. Manag. 2010, 260, 1914–1920. [Google Scholar] [CrossRef]
  43. Epron, D.; Laclau, J.P.; Almeida, J.C.R.; Goncalves, J.L.M.; Ponton, S.; Sette, C.R.; Delgado-Rojas, J.S.; Bouillet, J.P.; Nouvellon, Y. Do changes in carbon allocation account for the growth response to potassium and sodium applications in tropical Eucalyptus plantations? Tree Physiol. 2012, 32, 667–679. [Google Scholar] [CrossRef] [Green Version]
  44. Ryan, M.G.; Stape, J.L.; Binkley, D.; Fonseca, S.; Loos, R.A.; Takahashi, E.N.; Silva, C.R.; Silva, S.R.; Hakamada, R.E.; Ferreira, J.M.; et al. Factors controlling Eucalyptus productivity: How water availability and stand structure alter production and carbon allocation. For. Ecol. Manag. 2010, 259, 1695–1703. [Google Scholar] [CrossRef]
  45. Stape, J.L.; Binkley, D.; Ryan, M.G. Production and carbon allocation in a clonal Eucalyptus plantation with water and nutrient manipulations. For. Ecol. Manag. 2008, 255, 920–930. [Google Scholar] [CrossRef]
  46. Lu, H.; Xu, J.; Li, G.; Liu, W. Site Classification of Eucalyptus urophylla × Eucalyptus grandis Plantations in China. Forests 2020, 11, 871. [Google Scholar] [CrossRef]
  47. Bouillet, J.; Laclau, J.; Gonçalves, J.L.D.M.; Voigtlaender, M.; Gava, J.L.; Leite, F.P.; Hakamada, R.; Mareschal, L.; Mabiala, A.; Tardy, F.; et al. Eucalyptus and Acacia tree growth over entire rotation in single- and mixed-species plantations across five sites in Brazil and Congo. For. Ecol. Manag. 2013, 301, 89–101. [Google Scholar] [CrossRef]
  48. Viera, M.; Schumacher, M.V.; Bonacina, D.M.; de Oliveira Ramos, L.O.; Rodríguez-Soalleiro, R. Biomass and nutrient allocation to aboveground components in fertilized Eucalyptus saligna and E. urograndis plantations. New For. 2017, 48, 445–462. [Google Scholar] [CrossRef]
  49. Silva, P.H.M.D.; Poggiani, F.; Libardi, P.L.; Gonçalves, A.N. Fertilizer management of Eucalypt plantations on sandy soil in Brazil: Initial growth and nutrient cycling. For. Ecol. Manag. 2013, 301, 67–78. [Google Scholar] [CrossRef]
  50. Rowland, L.; Da Costa, A.C.L.; Galbraith, D.R.; Oliveira, R.S.; Binks, O.J.; Oliveira, A.A.R.; Pullen, A.M.; Doughty, C.E.; Metcalfe, D.B.; Vasconcelos, S.S.; et al. Death from drought in tropical forests is triggered by hydraulics not carbon starvation. Nature 2015, 528, 119–122. [Google Scholar] [CrossRef] [PubMed] [Green Version]
  51. Chen, X.; Zhao, P.; Ouyang, L.; Zhu, L.; Ni, G.; Schäfer, K.V.R. Whole-plant water hydraulic integrity to predict drought-induced Eucalyptus urophylla mortality under drought stress. For. Ecol. Manag. 2020, 468, 118179. [Google Scholar] [CrossRef]
  52. Christina, M.; Le Maire, G.; Battie Laclau, P.; Nouvellon, Y.; Bouillet, J.P.; Jourdan, C.; Moraes Gonçalves, J.L.; Laclau, J.P. Measured and modeled interactive effects of potassium deficiency and water deficit on gross primary productivity and light-use efficiency in Eucalyptus grandis plantations. Glob. Chang. Biol. 2015, 21, 2022–2039. [Google Scholar] [CrossRef]
  53. Battie-Laclau, P.; Laclau, J.P.; Domec, J.C.; Christina, M.; Bouillet, J.P.; de Cassia, P.M.; de Moraes, G.J.; Moreira, R.M.E.; Krusche, A.V.; Bouvet, J.M.; et al. Effects of potassium and sodium supply on drought-adaptive mechanisms in Eucalyptus grandis plantations. New Phytol. 2014, 203, 401–413. [Google Scholar] [CrossRef]
  54. Yu, F.; Truong, T.V.; He, Q.; Hua, L.; Su, Y.; Li, J. Dry Season Irrigation Promotes Leaf Growth in Eucalyptus urophylla × E. grandis under Fertilization. Forests 2019, 10, 67. [Google Scholar] [CrossRef]
  55. Weber, R.; Schwendener, A.; Schmid, S.; Lambert, S.; Wiley, E.; Landhausser, S.M.; Hartmann, H.; Hoch, G. Living on next to nothing: Tree seedlings can survive weeks with very low carbohydrate concentrations. New Phytol. 2018, 218, 107–118. [Google Scholar] [CrossRef] [PubMed] [Green Version]
  56. Morris, D. Quantitative determination of carbohydrates with Dreywood’s anthrone reagent. Science 1948, 107, 254–255. [Google Scholar] [CrossRef] [PubMed]
  57. Rose, R.; Rose, C.L.; Omi, S.K.; Forry, K.R.; Durall, D.M.; Bigg, W.L. Starch determination by perchloric acid vs enzymes: Evaluating the accuracy and precision of six colorimetric methods. J. Agric. Food Chem. 1991, 39, 2–11. [Google Scholar] [CrossRef]
  58. Barry, K.M.; Quentin, A.; Eyles, A.; Pinkard, E.A. Consequences of resource limitation for recovery from repeated defoliation in Eucalyptus globulus Labilladiere. Tree Physiol. 2012, 32, 24–35. [Google Scholar] [CrossRef] [PubMed] [Green Version]
  59. Mitchell, P.J.; O’Grady, A.P.; Tissue, D.T.; White, D.A.; Ottenschlaeger, M.L.; Pinkard, E.A. Drought response strategies define the relative contributions of hydraulic dysfunction and carbohydrate depletion during tree mortality. New Phytol. 2013, 197, 862–872. [Google Scholar] [CrossRef] [PubMed]
  60. Sala, A.; Woodruff, D.R.; Meinzer, F.C. Carbon dynamics in trees: Feast or famine? Tree Physiol. 2012, 32, 764–775. [Google Scholar] [CrossRef] [Green Version]
  61. Maguire, A.J.; Kobe, R.K. Drought and shade deplete nonstructural carbohydrate reserves in seedlings of five temperate tree species. Ecol. Evol. 2015, 5, 5711–5721. [Google Scholar] [CrossRef]
  62. Prescott, C.E.; Grayston, S.J.; Helmisaari, H.; Kaštovská, E.; Körner, C.; Lambers, H.; Meier, I.C.; Millard, P.; Ostonen, I. Surplus Carbon Drives Allocation and Plant—Soil Interactions. Trends Ecol. Evol. 2020, 35, 1110–1118. [Google Scholar] [CrossRef]
  63. Mittler, R.; Vanderauwera, S.; Gollery, M.; Van Breusegem, F. Reactive oxygen gene network of plants. Trends Plant Sci. 2004, 9, 490–498. [Google Scholar] [CrossRef]
  64. Khaleghi, A.; Naderi, R.; Brunetti, C.; Maserti, B.E.; Salami, S.A.; Babalar, M. Morphological, physiochemical and antioxidant responses of Maclura pomifera to drought stress. Sci. Rep. 2019, 9, 19250. [Google Scholar] [CrossRef] [PubMed]
  65. Bhusal, N.; Lee, M.; Lee, H.; Adhikari, A.; Han, A.R.; Han, A.; Kim, H.S. Evaluation of morphological, physiological, and biochemical traits for assessing drought resistance in eleven tree species. Sci. Total Environ. 2021, 779, 146466. [Google Scholar] [CrossRef]
  66. Brodersen, C.R.; McElrone, A.J. Maintenance of xylem Network Transport Capacity: A Review of Embolism Repair in Vascular Plants. Front. Plant Sci. 2013, 4, 1–11. [Google Scholar] [CrossRef] [PubMed] [Green Version]
  67. Souden, S.; Ennajeh, M.; Ouledali, S.; Massoudi, N.; Cochard, H.; Khemira, H. Water relations, photosynthesis, xylem embolism and accumulation of carbohydrates and cyclitols in two Eucalyptus species (E. camaldulensis and E. torquata) subjected to dehydration–rehydration cycle. Trees 2020, 34, 1439–1452. [Google Scholar] [CrossRef]
  68. Warren, C.R.; Bleby, T.; Adams, M.A. Changes in gas exchange versus leaf solutes as a means to cope with summer drought in Eucalyptus marginata. Oecologia 2007, 154, 1–10. [Google Scholar] [CrossRef] [PubMed]
  69. Huang, J.; Wang, X.; Zheng, M.; Mo, J. 13-year nitrogen addition increases nonstructural carbon pools in subtropical forest trees in southern China. For. Ecol. Manag. 2021, 481, 118748. [Google Scholar] [CrossRef]
  70. Brunner, I.; Herzog, C.; Dawes, M.A.; Arend, M.; Sperisen, C. How tree roots respond to drought. Front. Plant Sci. 2015, 6, 547. [Google Scholar] [CrossRef] [Green Version]
  71. Savage, J.A.; Clearwater, M.J.; Haines, D.F.; Klein, T.; Mencuccini, M.; Sevanto, S.; Turgeon, R.; Zhang, C. Allocation, stress tolerance and carbon transport in plants: How does phloem physiology affect plant ecology? Plant Cell Environ. 2016, 39, 709–725. [Google Scholar] [CrossRef]
  72. Sardans, J.; Peñuelas, J. Hydraulic redistribution by plants and nutrient stoichiometry: Shifts under global change. Ecohydrology 2014, 7, 1–20. [Google Scholar] [CrossRef]
  73. Christina, M.; Nouvellon, Y.; Laclau, J.P.; Stape, J.L.; Bouillet, J.P.; Lambais, G.R.; Maire, G. Importance of deep water uptake in tropical Eucalypt forest. Funct. Ecol. 2016, 31, 509–519. [Google Scholar] [CrossRef]
  74. Klein, T.; Vitasse, Y.; Hoch, G. Coordination between growth, phenology and carbon storage in three coexisting deciduous tree species in a temperate forest. Tree Physiol. 2016, 36, 847–855. [Google Scholar] [CrossRef] [Green Version]
  75. Brunner, I.; Godbold, D.L. Tree roots in a changing world. J. For. Res. Jpn. 2007, 12, 78–82. [Google Scholar] [CrossRef] [Green Version]
  76. Schachtman, D.P.; Goodger, J.Q.D. Chemical root to shoot signaling under drought. Trends Plant Sci. 2008, 13, 281–287. [Google Scholar] [CrossRef]
  77. Merchant, A.; Tausz, M.; Arndt, S.K.; Adams, M.A. Cyclitols and carbohydrates in leaves and roots of 13 Eucalyptus species suggest contrasting physiological responses to water deficit. Plant Cell Environ. 2006, 29, 2017–2029. [Google Scholar] [CrossRef] [PubMed]
  78. Nóia Júnior, R.D.S.; Amaral, G.C.; Pezzopane, J.E.M.; Fonseca, M.D.S.; Câmara Da Silva, A.P.; Xavier, T.M.T. Ecophysiological acclimatization to cyclic water stress in Eucalyptus. J. For. Res. 2020, 31, 797–806. [Google Scholar] [CrossRef]
  79. Ferraz, S.F.D.B.; Rodrigues, C.B.; Garcia, L.G.; Alvares, C.A.; Lima, W.D.P. Effects of Eucalyptus plantations on streamflow in Brazil: Moving beyond the water use debate. For. Ecol. Manag. 2019, 453, 117571. [Google Scholar] [CrossRef]
  80. Kannenberg, S.A.; Phillips, R.P. Plant responses to stress impacts: The C we do not see. Tree Physiol. 2017, 37, 151–153. [Google Scholar] [CrossRef] [Green Version]
  81. Binkley, D.; Campoe, O.C.; Alvares, C.A.; Carneiro, R.L.; Stape, J.L. Variation in whole-rotation yield among Eucalyptus genotypes in response to water and heat stresses: The TECHS project. For. Ecol. Manag. 2020, 462, 117953. [Google Scholar] [CrossRef]
  82. Schonbeck, L.; Gessler, A.; Hoch, G.; McDowell, N.G.; Rigling, A.; Schaub, M.; Li, M.H. Homeostatic levels of nonstructural carbohydrates after 13 yr of drought and irrigation in Pinus sylvestris. New Phytol. 2018, 219, 1314–1324. [Google Scholar] [CrossRef] [PubMed] [Green Version]
  83. Kebrom, T.H. A growing stem inhibits bud outgrowth—The overlooked theory of apical dominance. Front. Plant Sci. 2017, 8, 1874. [Google Scholar] [CrossRef] [PubMed]
  84. Han, Q. Height-related decreases in mesophyll conductance, leaf photosynthesis and compensating adjustments associated with leaf nitrogen concentrations in Pinus densiflora. Tree Physiol. 2011, 31, 976–984. [Google Scholar] [CrossRef] [PubMed] [Green Version]
  85. Hoch, G.; Siegwolf, R.T.W.; Keel, S.G.; Körner, C.; Han, Q. Fruit production in three masting tree species does not rely on stored carbon reserves. Oecologia 2013, 171, 653–662. [Google Scholar] [CrossRef] [PubMed] [Green Version]
  86. Münch, E. Die Stoffbewegungen in der Pflanze. Protoplasma 1932, 15, 488–489. [Google Scholar]
  87. Givnish, T.J.; Wong, S.C.; Stuart-Williams, H.; Holloway-Phillips, M.; Farquhar, G.D. Determinants of maximum tree height in Eucalyptus species along a rainfall gradient in Victoria, Australia. Ecology 2014, 95, 2991–3007. [Google Scholar] [CrossRef] [Green Version]
  88. Palacio, S.; Camarero, J.J.; Maestro, M.; Alla, A.Q.; Lahoz, E.; Montserrat-Martí, G. Are storage and tree growth related? Seasonal nutrient and carbohydrate dynamics in evergreen and deciduous Mediterranean oaks. Trees 2018, 32, 777–790. [Google Scholar] [CrossRef]
Figure 1. Monthly precipitation and mean temperature from April 2017 to May 2019 before standard tree cutting. The square pattern with the solid line indicates the monthly precipitation and the circle pattern with imaginary line represents the mean temperature.
Forests 12 01049 g001
Figure 2. Changes in TSS, starch, NSC concentration and ratio of TSS to starch in the canopy of E. urophylla × E. grandis under different treatments. The average value and standard error of each time are shown (n = 5). The (ac) represent the leaf, branchlet and old branch. Numbers 1–4 indicate the concentrations of TSS, starch, NSC and the ratio of TSS to starch, respectively. The letters over the bars represent the results of Duncan’s multiple comparison analysis. Different capital letters indicate significant differences between different canopy heights (C) under the same treatment (p < 0.05). Different lower-case letters indicate significant differences between different treatments for the same tissues (p < 0.05).
Forests 12 01049 g002
Figure 3. Changes in TSS, starch, NSC concentration and ratio of TSS to starch in the stem of E. urophylla × E. grandis under different treatments. The average value and standard error of each time are shown (n = 5). The (a,b) represent the stem xylem and stem cambium. Numbers 1–4 indicate the concentrations of TSS, starch, NSC and the ratio of TSS to starch, respectively. The letters over the bars represent the results of Duncan’s multiple comparison analysis. Different capital letters indicate significant differences between different tree heights under the same treatment (p < 0.05). Different lower-case letters indicate significant differences between different treatments for the same tissues (p < 0.05).
Forests 12 01049 g003
Figure 4. Changes in TSS, starch, NSC concentration and ratio of TSS to starch in the roots of E. urophylla × E. grandis under different treatments. The average value and standard error of each time are shown (n = 5). The letters (ad) indicate the concentrations of TSS, starch, NSC and the ratio of TSS to starch, respectively. The letters over the bars represent the results of Duncan’s multiple comparison analysis. Different capital letters indicate significant differences between fine root (FR) and coarse root (CR) under the same treatment (p < 0.05). Different lower-case letters indicate significant differences between different treatments for the same tissues (p < 0.05).
Forests 12 01049 g004
Figure 5. The correlations of NSC and growth indexes. Relationships of (a) branchlet, (b) old branch, (c) stem xylem, (d) stem cambium, (e) leaf and (f) root with (1) total soluble sugar (TSS), (2) starch, (3) non-structural carbon (NSC) and (4) ratio of TSS to starch. All data were square root transformed to improve normality and homoscedasticity before linear regression analysis and Pearson correlation analyses were used to obtain regressions and correlations (R2 and p values).
Forests 12 01049 g005
Figure 6. Principal component analysis of TSS (a), starch (b), NSC (c) and ratio of TSS to starch (d) under different treatment. The gray, red, green and blue ellipsoids represent CK, F, W and WF treatment, respectively. The data used for PCA were averaged (n = 5).
Forests 12 01049 g006
Table 1. The relative soil water content (%) from April 2017 to May 2019, before sampling.
SeasonTreatmentMay 2017–May 2018June 2018–May 2019
Dry seasonCK67.48 ± 0.7377.11 ± 1.84
W90.56 ± 0.4289.06 ± 1.29
F57.40 ± 0.5168.06 ± 1.68
WF83.44 ± 0.4384.06 ± 1.53
Rainy seasonCK85.82 ± 0.4780.80 ± 1.27
W85.64 ± 0.4785.74 ± 1.49
F81.95 ± 0.5575.83 ± 1.60
WF83.62 ± 0.5183.09 ± 2.03
Mean ± SE are shown. CK, non-irrigation and non-fertilization; W, irrigation and non-fertilization; F, non-irrigation and fertilization; WF, irrigation and fertilization.
Table 2. The diameter at breast height (DBH), tree height and under-crown height of standard trees felled in May 2019 with different treatments.
TreatmentDBH (cm)Tree Height (m)Under-Crown Height (m)
CK5.52 ± 0.307.58 ± 0.253.66 ± 0.28
W6.52 ± 0.119.00 ± 0.156.28 ± 1.07
F10.14 ± 0.1012.78 ± 0.244.92 ± 0.24
WF10.37 ± 0.0612.94 ± 0.244.96 ± 0.81
Mean ± SE were shown. CK, non-irrigation and non-fertilization; W, irrigation and non-fertilization; F, non-irrigation and fertilization; WF, irrigation and fertilization.
Table 3. The multivariate general linear model (MGLM) of the aboveground NSC concentrations with treatment, height, and block.
TissueVariablesFixed FactorsCovariatesR2
HeightDry-Season Irrigation (W)Fertilization (F)Height × WHeight × FW × FHeight × W × FBlock
LeafTSS0.050 *0.0600.0570.3190.7720.6000.8590.002 **0.310
Starch0.002 **0.1390.002 **0.4670.1040.9420.8170.4810.356
NSC0.2390.025 *0.007 **0.7060.7570.6860.8710.002 **0.299
Ratio0.001 **0.3510.9240.0930.3730.5950.8330.013 *0.352
BranchletTSS0.000 **0.5940.7190.6630.8120.9070.2280.0900.421
Starch0.1180.8020.1700.7570.5230.1000.7080.022 *0.241
NSC0.0640.6250.5710.5940.5510.2710.7890.9410.191
Ratio0.000 **0.8570.5210.9600.9050.2060.4340.002 **0.420
Old branchTSS0.000 **0.8070.9370.4650.1350.9660.9820.000 **0.585
Starch0.016 *0.4860.8290.9670.9090.1110.7900.007 **0.256
NSC0.041 *0.4800.8830.8330.5820.2950.9130.5080.185
Ratio0.000 **0.7590.8750.5110.2970.0690.7110.000 **0.656
Stem xylemTSS0.000 **0.008 **0.1790.4580.028 *0.1790.3440.0950.522
Starch0.9090.036 *0.2730.7510.7290.9330.8440.1810.150
NSC0.1120.008 **0.9420.5840.3610.4720.8020.8530.238
Ratio0.000 **0.5300.024 *0.8230.030 *0.2970.2180.001 **0.432
Stem cambiumTSS0.000 **0.000 **0.000 **0.8270.3280.8250.1540.001 **0.517
Starch0.1320.1730.006 **0.7230.9540.6920.9970.004 **0.569
NSC0.002 **0.001 **0.6790.9750.8270.7040.6480.9850.304
Ratio0.1220.004 **0.000 **0.3000.3810.8840.4780.000 **0.580
The p value is shown. Ratio: ratio of TSS to starch. The TSS, starch, NSC and ratio were square-root transformed to improve normality and homoscedasticity; * p < 0.05, ** p < 0.01.
Table 4. The multivariate general linear model (MGLM) of the underground NSC concentrations with treatment, classification and block.
TissueVariablesFixed FactorsCovariatesR2
Classification (C)Dry-Season Irrigation (W)Fertilization (F)C × WC × FW × FC × W × FBlock
RootTSS0.7760.6610.5310.026 *0.7980.2570.3820.4410.224
Starch0.7700.2760.1810.041 *0.8550.7540.4660.0810.273
NSC0.9000.6490.6820.5100.8360.4280.8450.6140.056
Ratio0.8800.4230.2300.023 *0.7710.4650.5200.1620.263
The p value is shown. Ratio: ratio of TSS to starch. The TSS, starch, NSC and ratio were square root transformed to improve normality and homoscedasticity; * p < 0.05.
Publisher’s Note: MDPI stays neutral with regard to jurisdictional claims in published maps and institutional affiliations.

