
Evaluation of Wood Quality Traits in Salix viminalis Useful for Biofuels: Characterization and Method Development


Abstract
:1. Introduction
2. Materials and Methods
2.1. Plant Materials Havesting and Sample Preparation
2.2. Density Measurements
2.3. Chemical Analyses
2.4. Analysis of Growth Ring Proportions and Presence of Tension Wood
2.5. Morphometric Analyses
3. Results
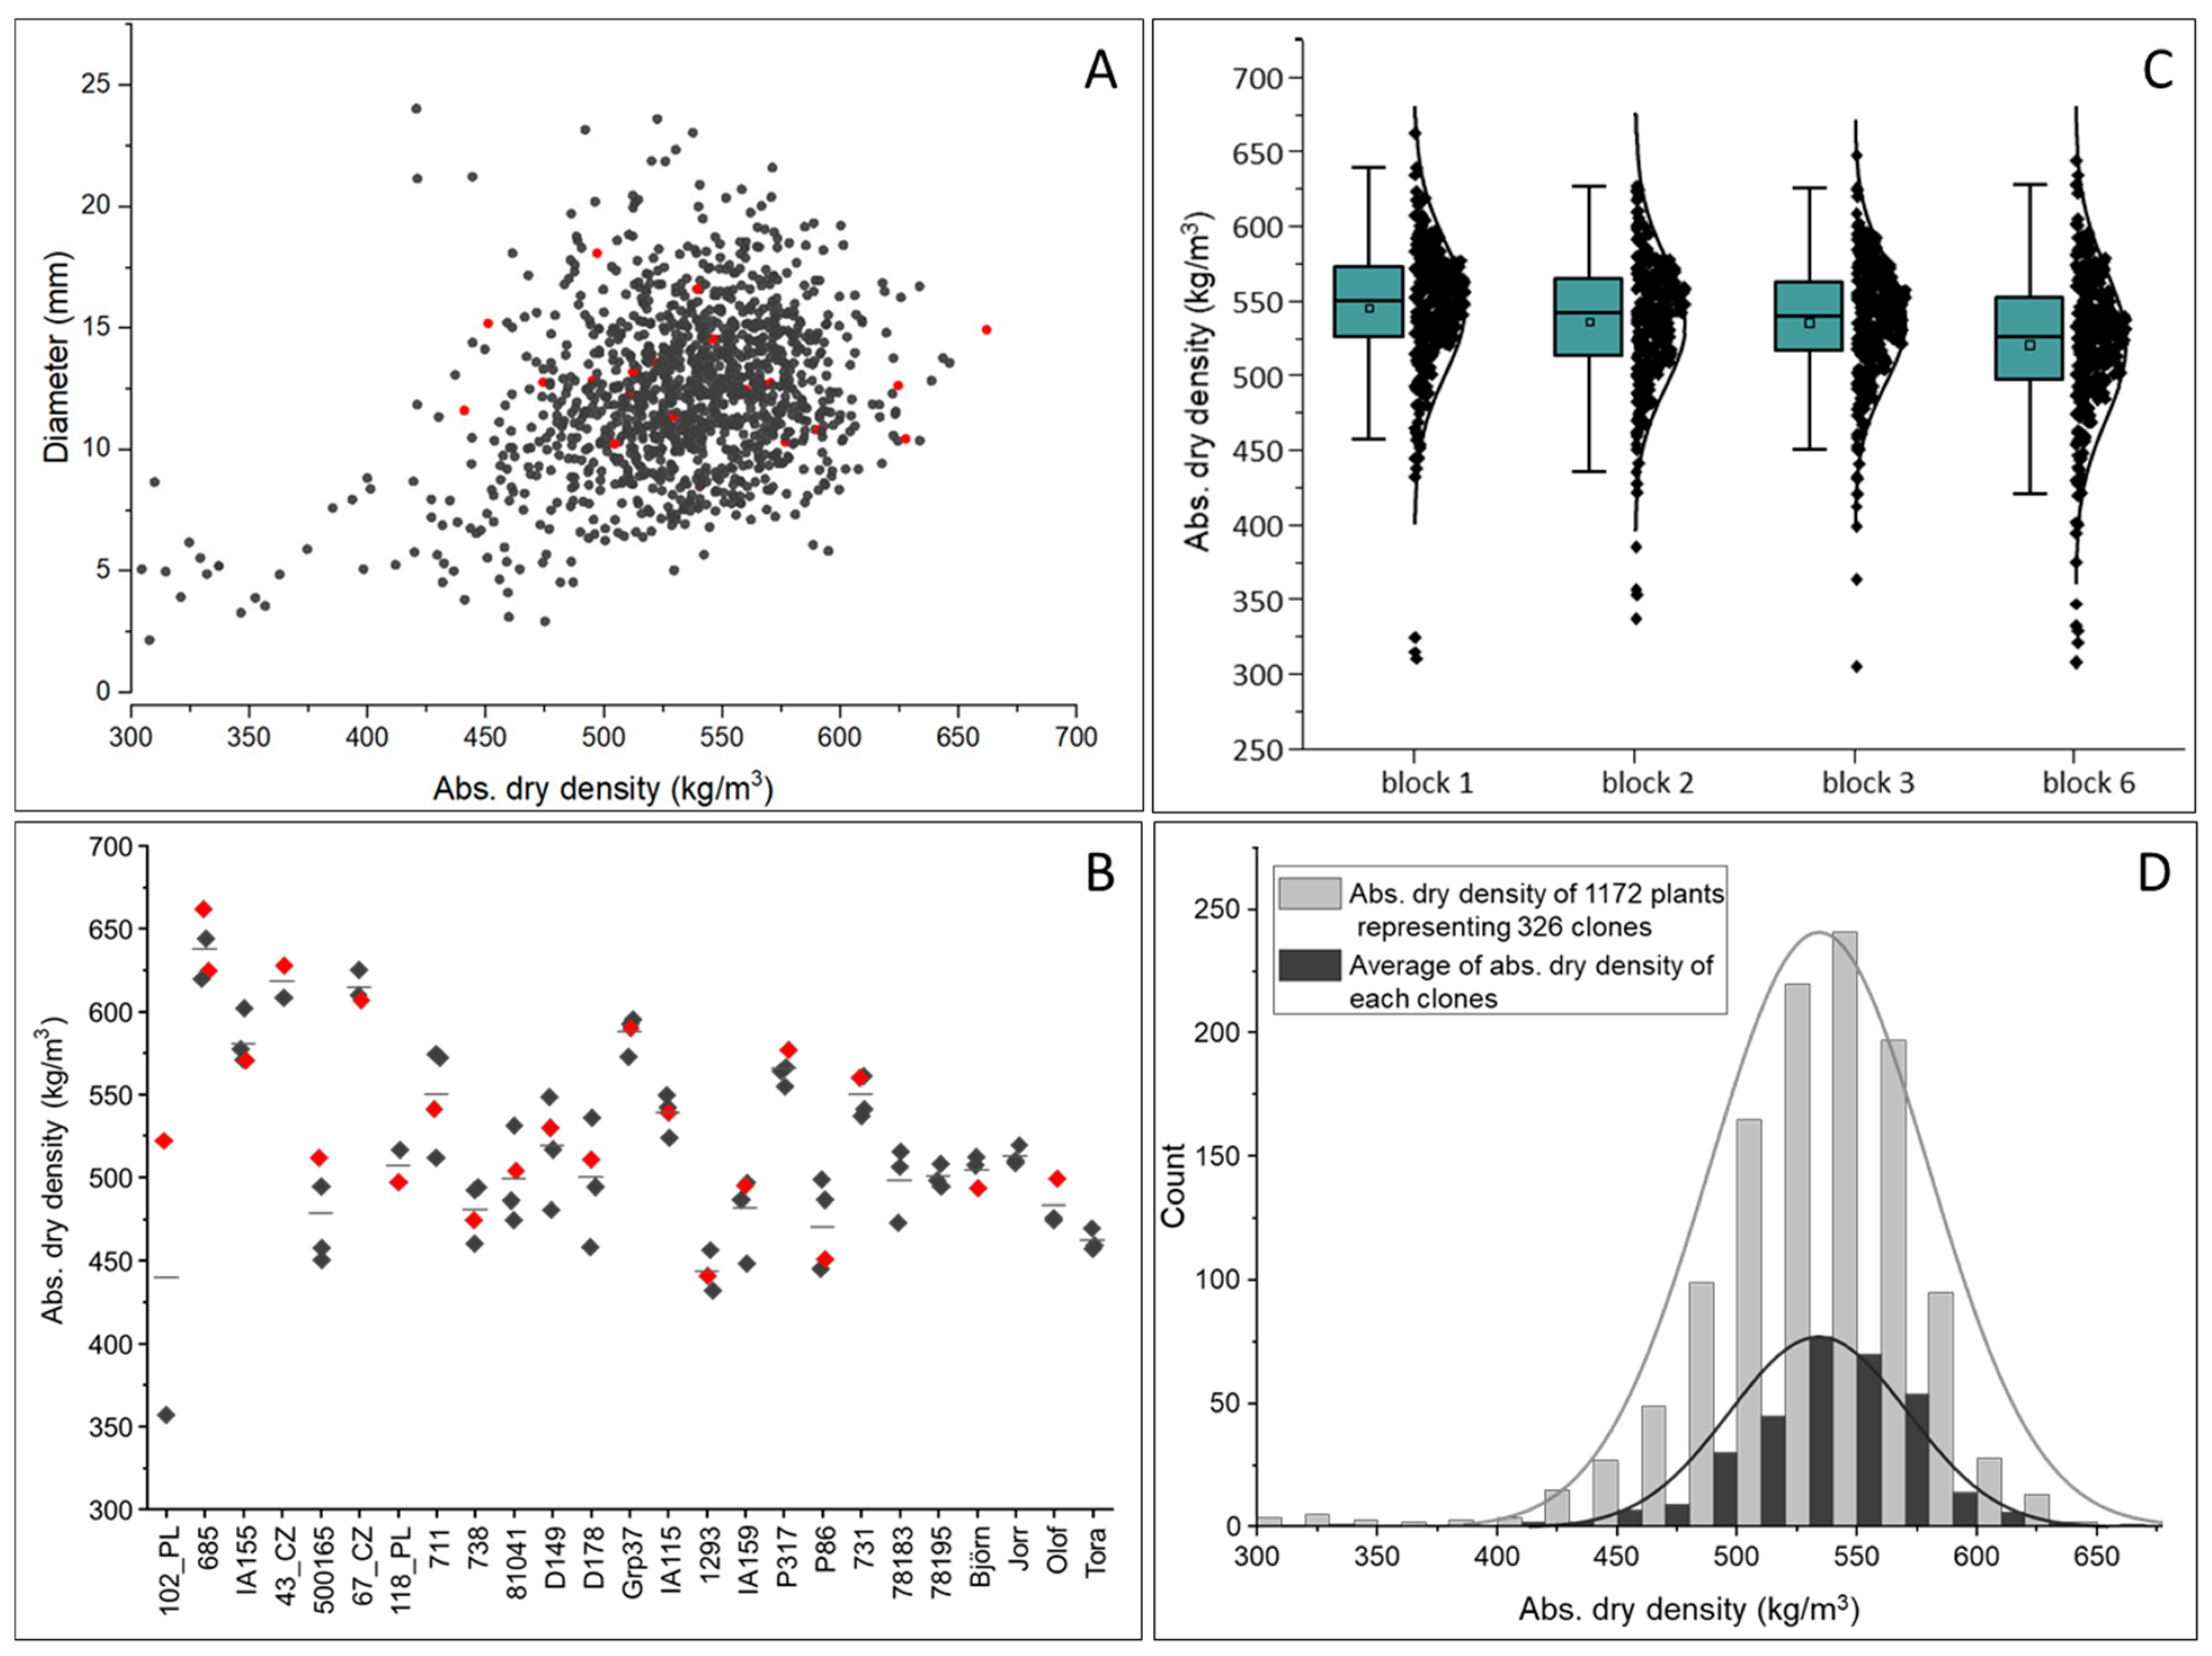
3.1. Density
3.2. Chemical Analyses
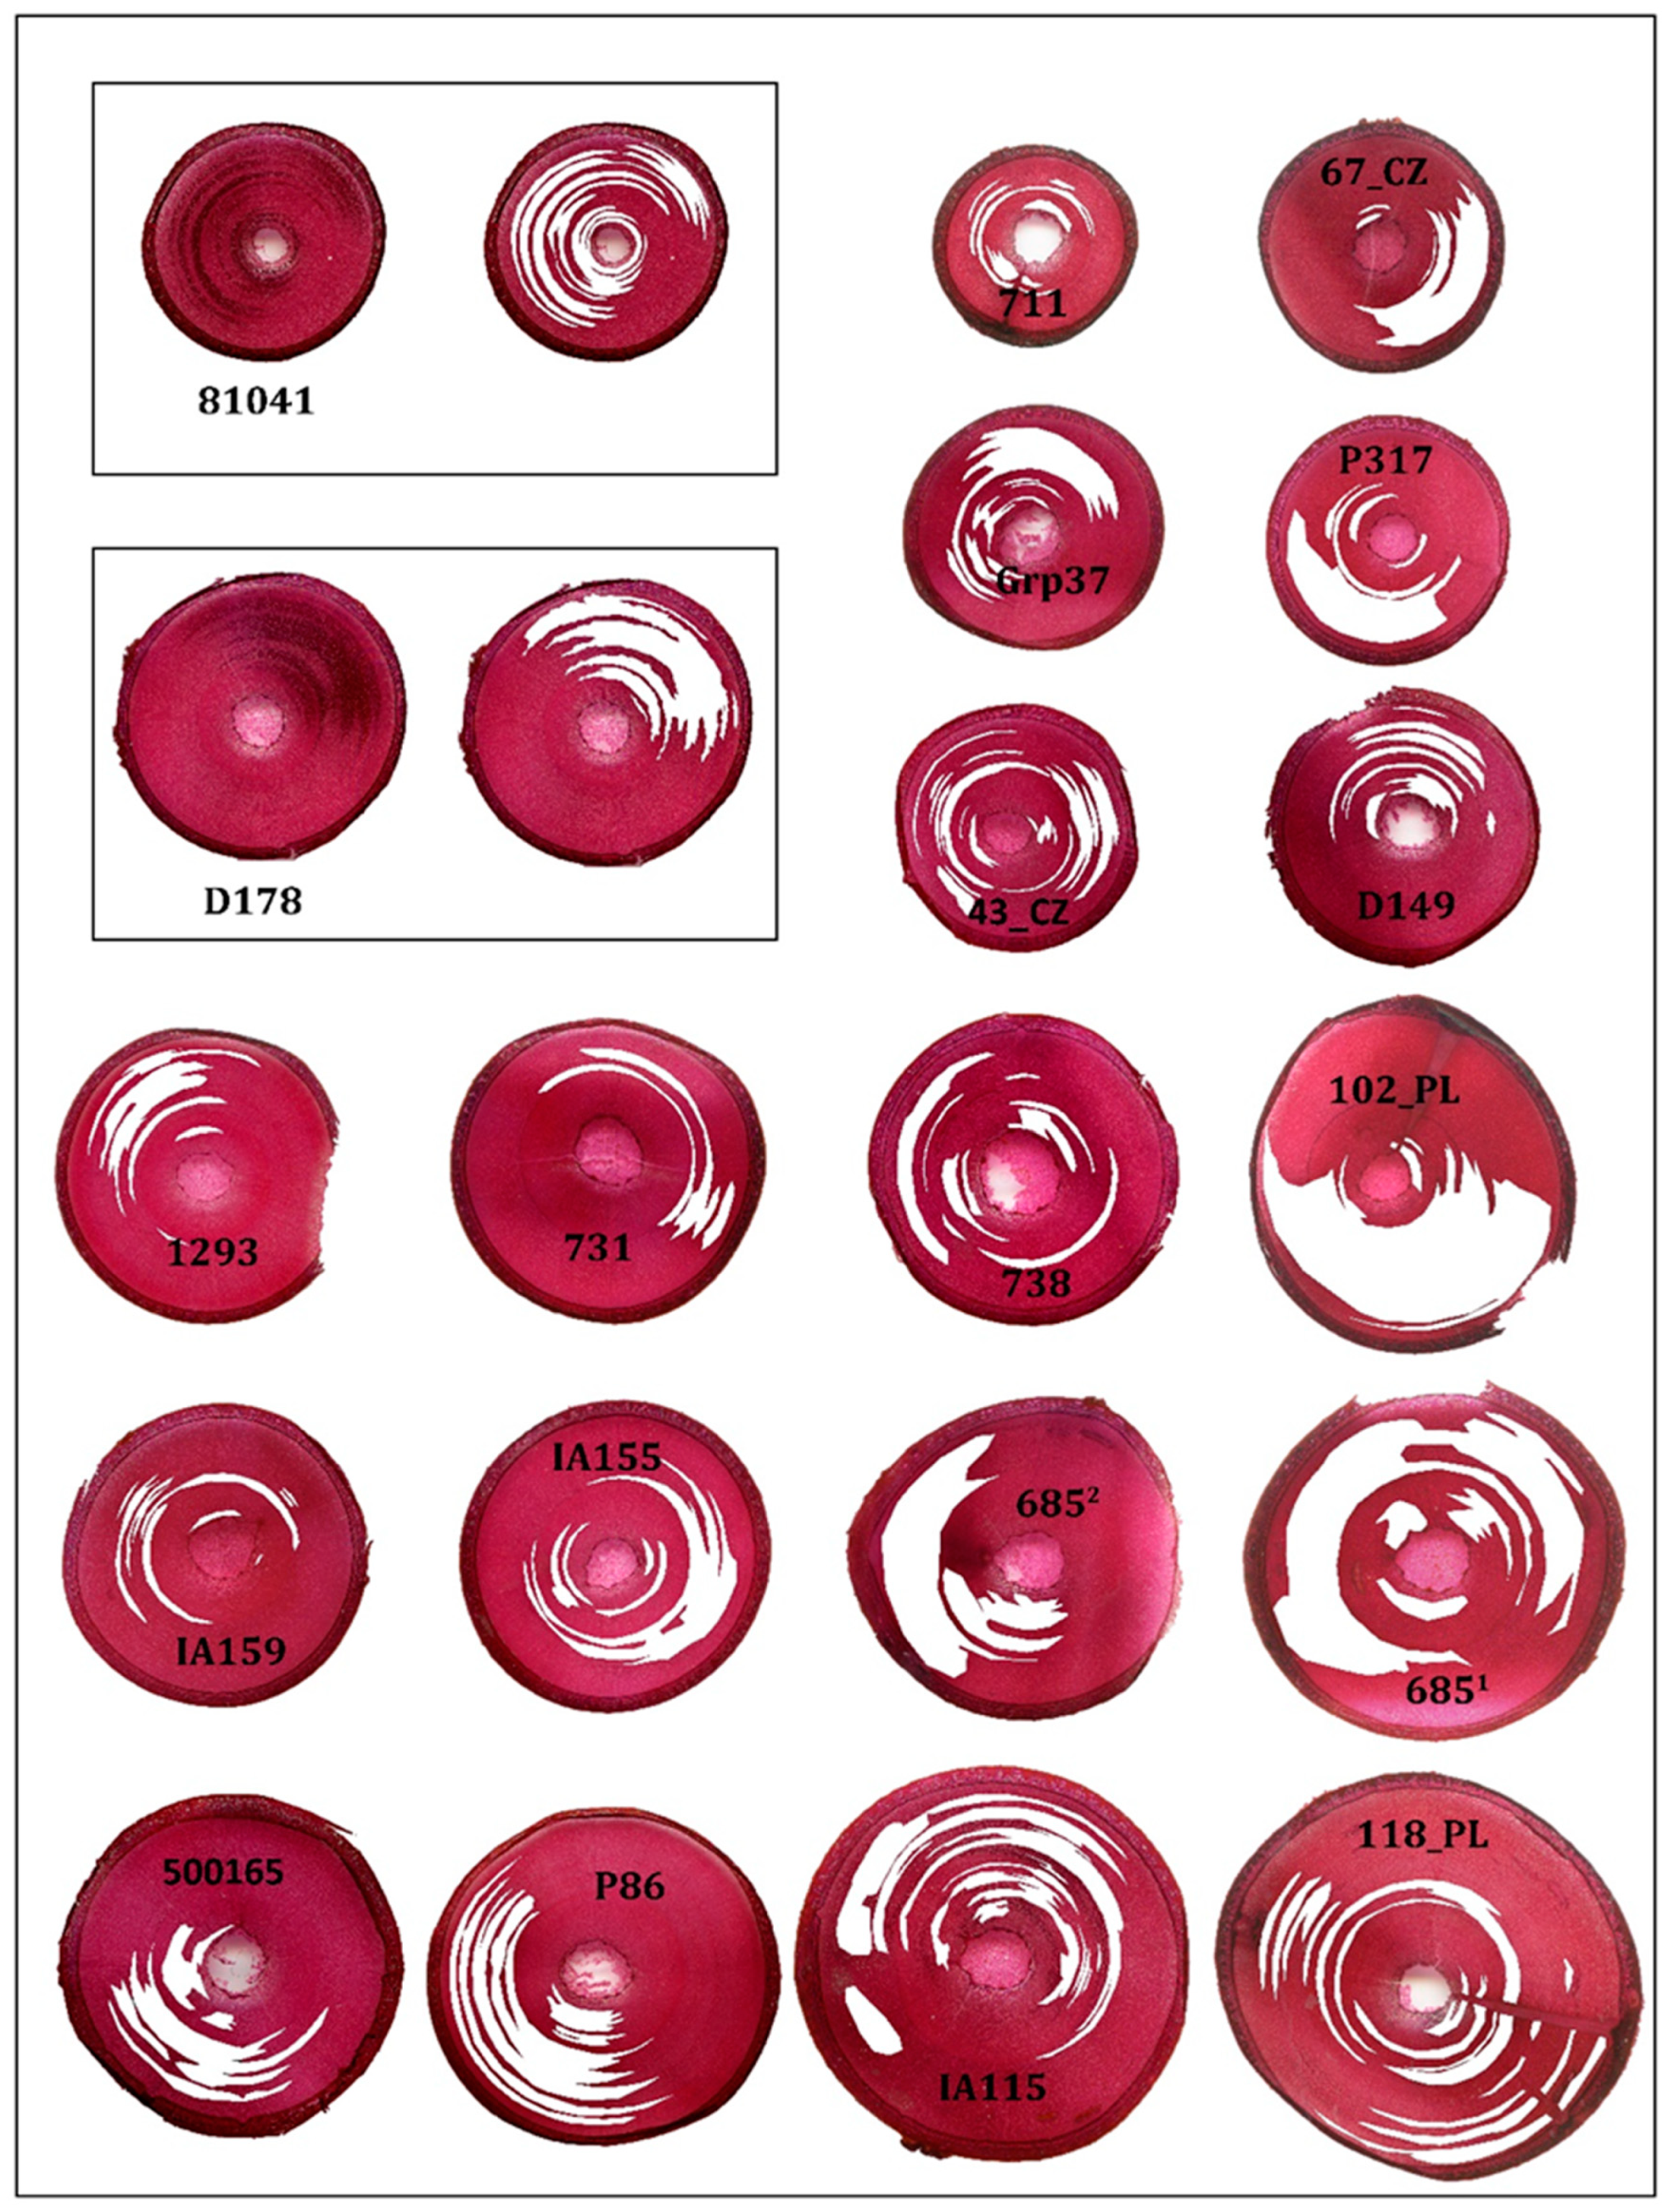
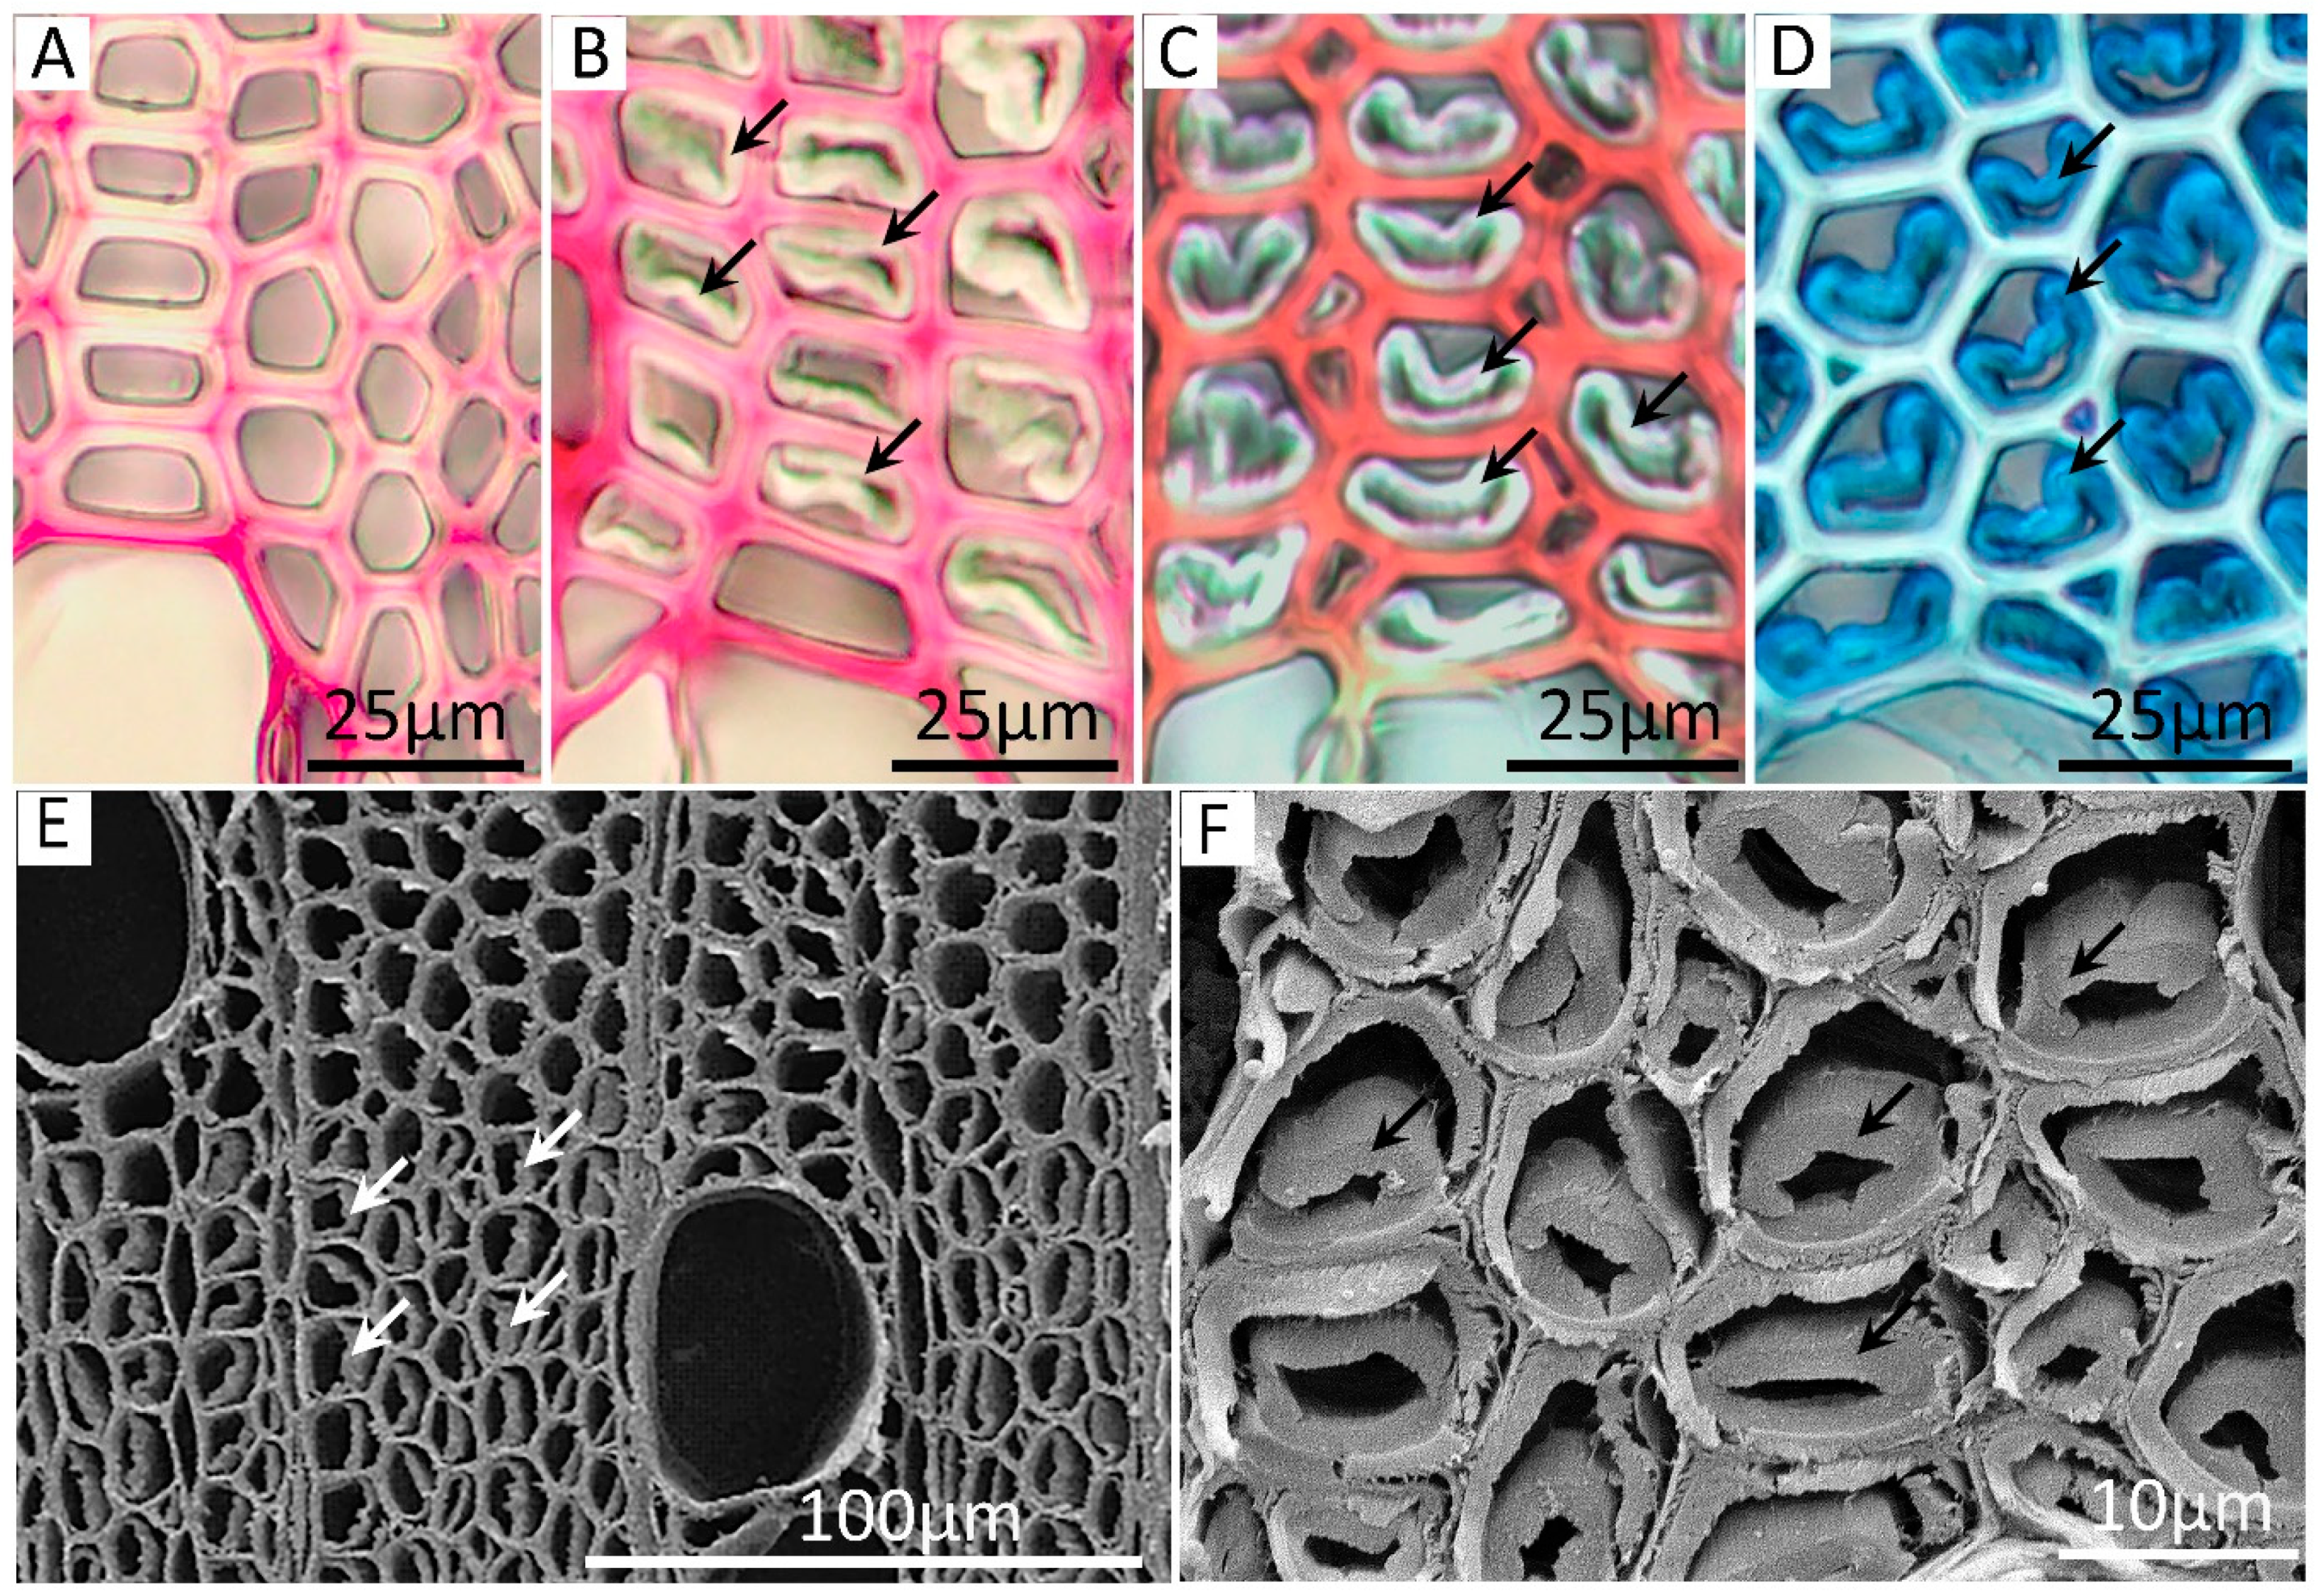
3.3. Analysis and Staining of Stem Cross-Sections for Growth Rings and Presence of Tension Wood
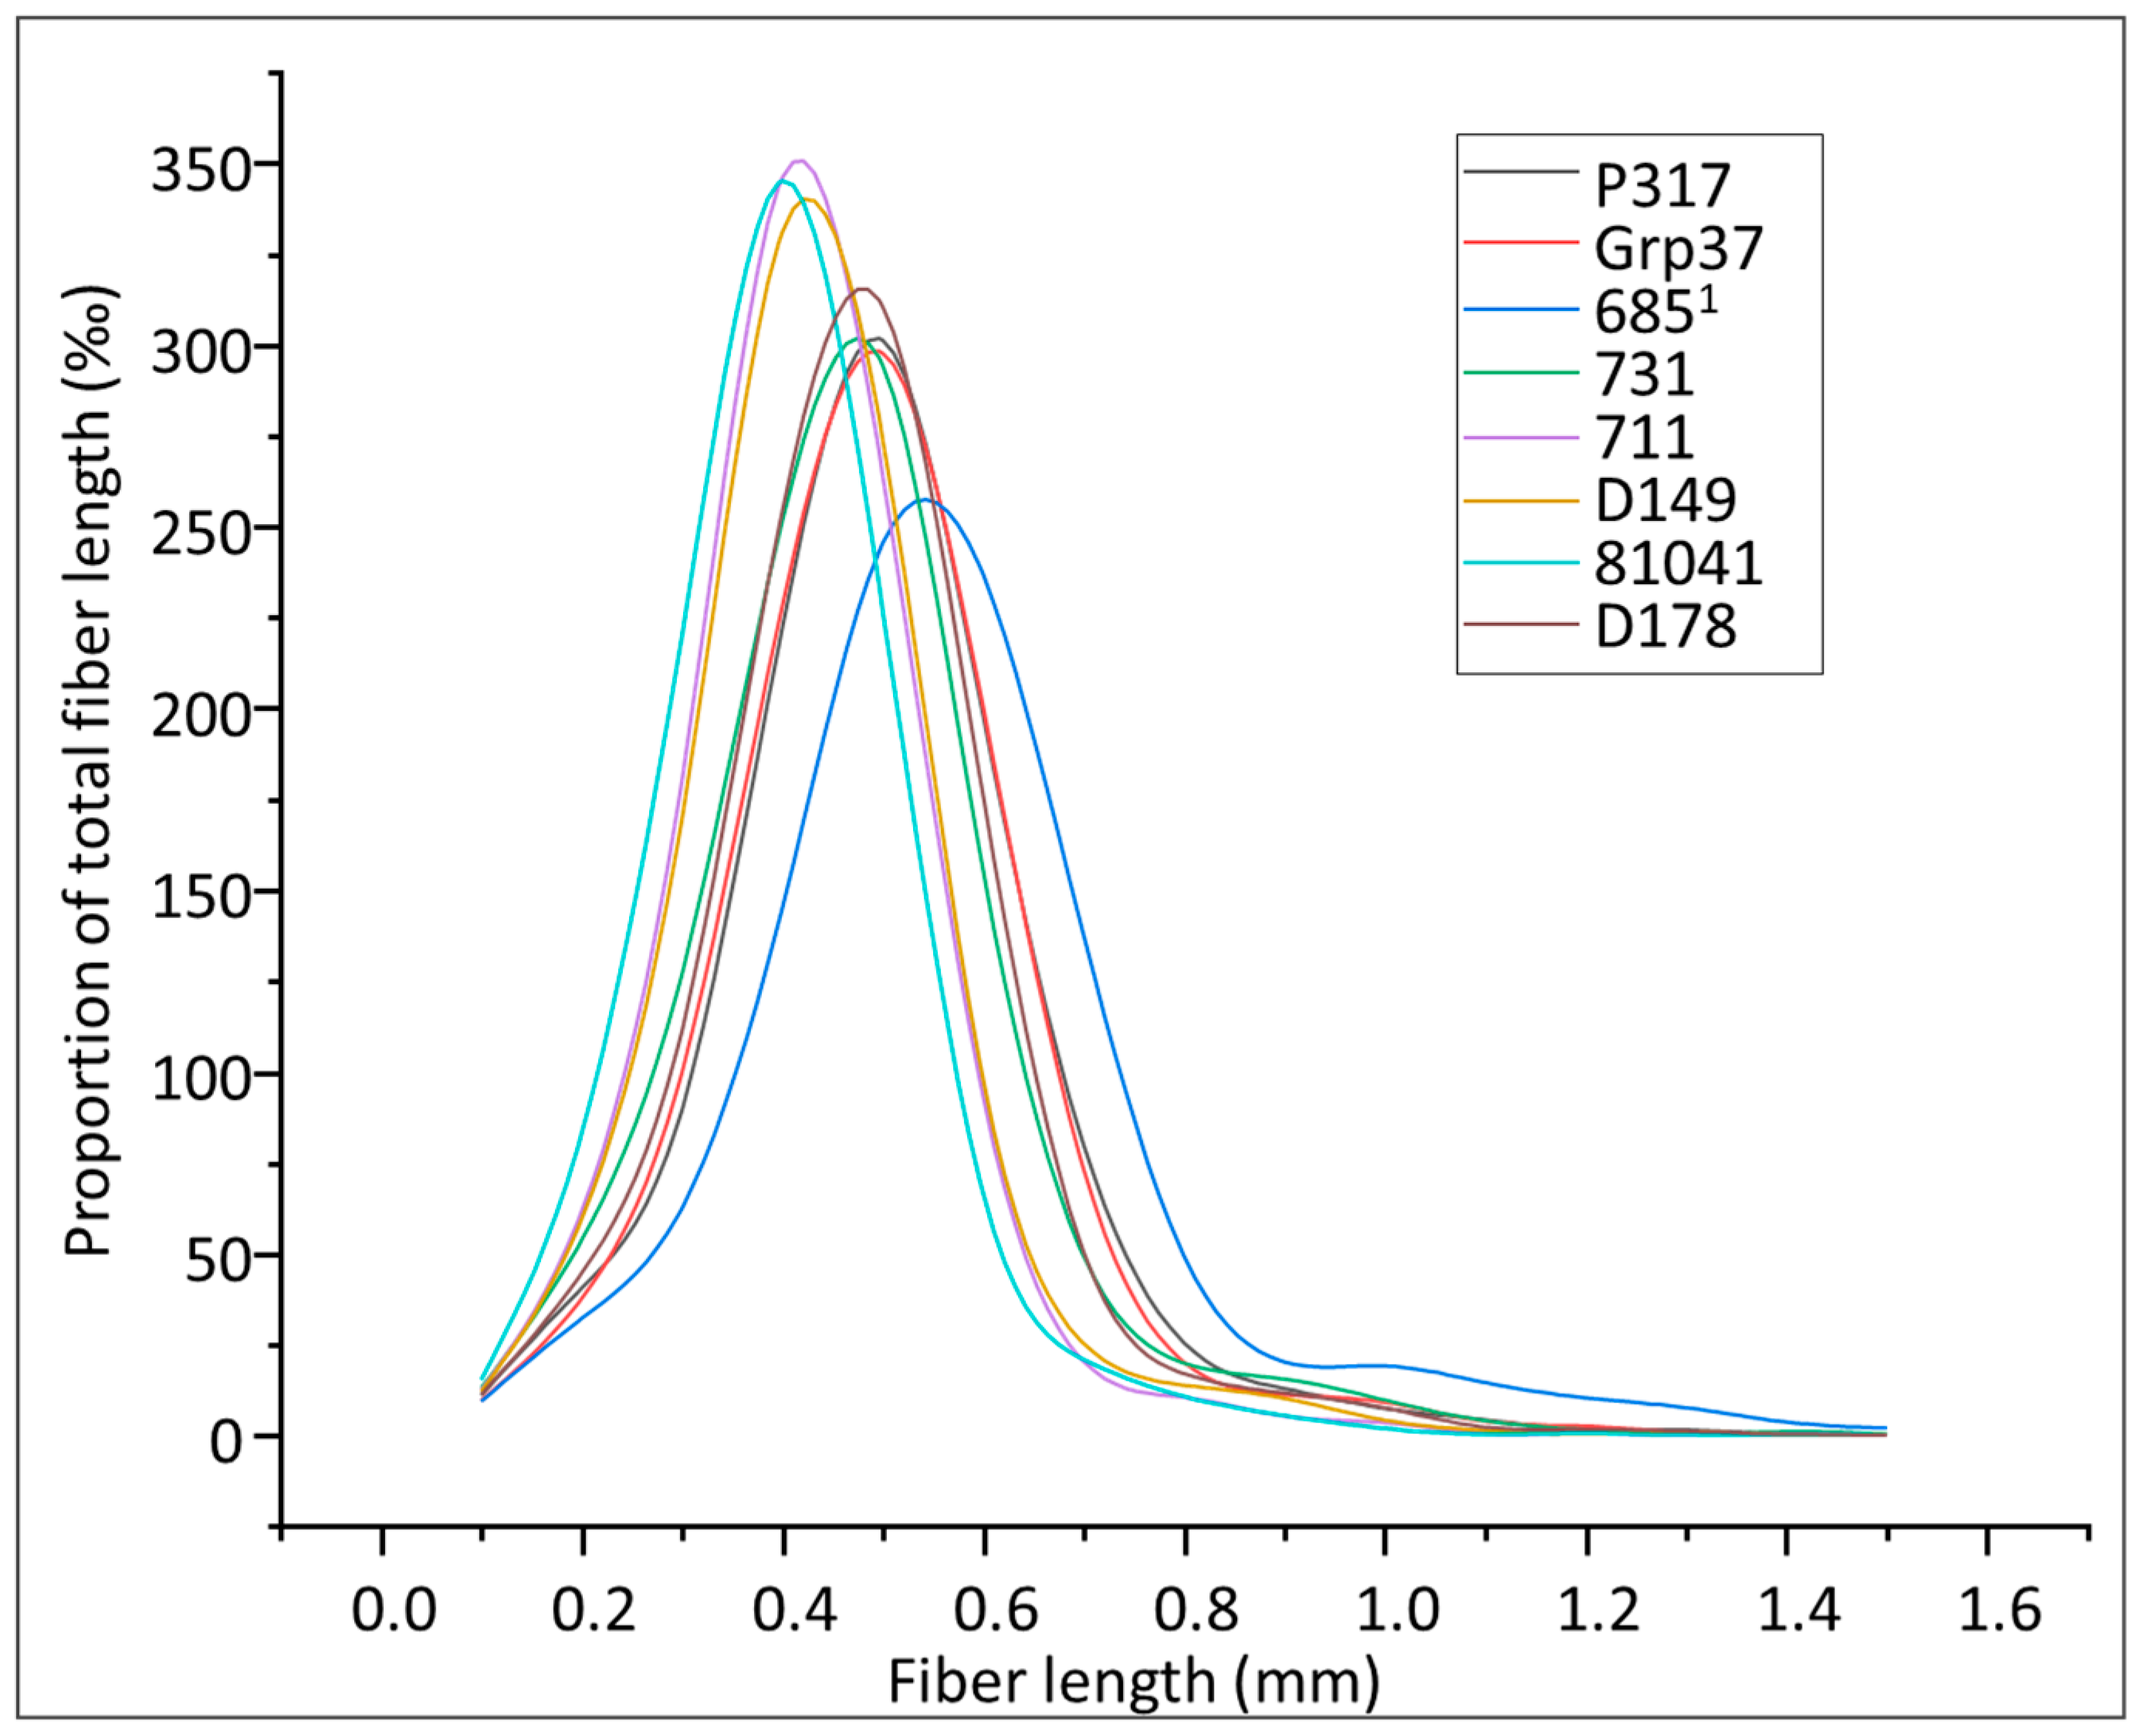
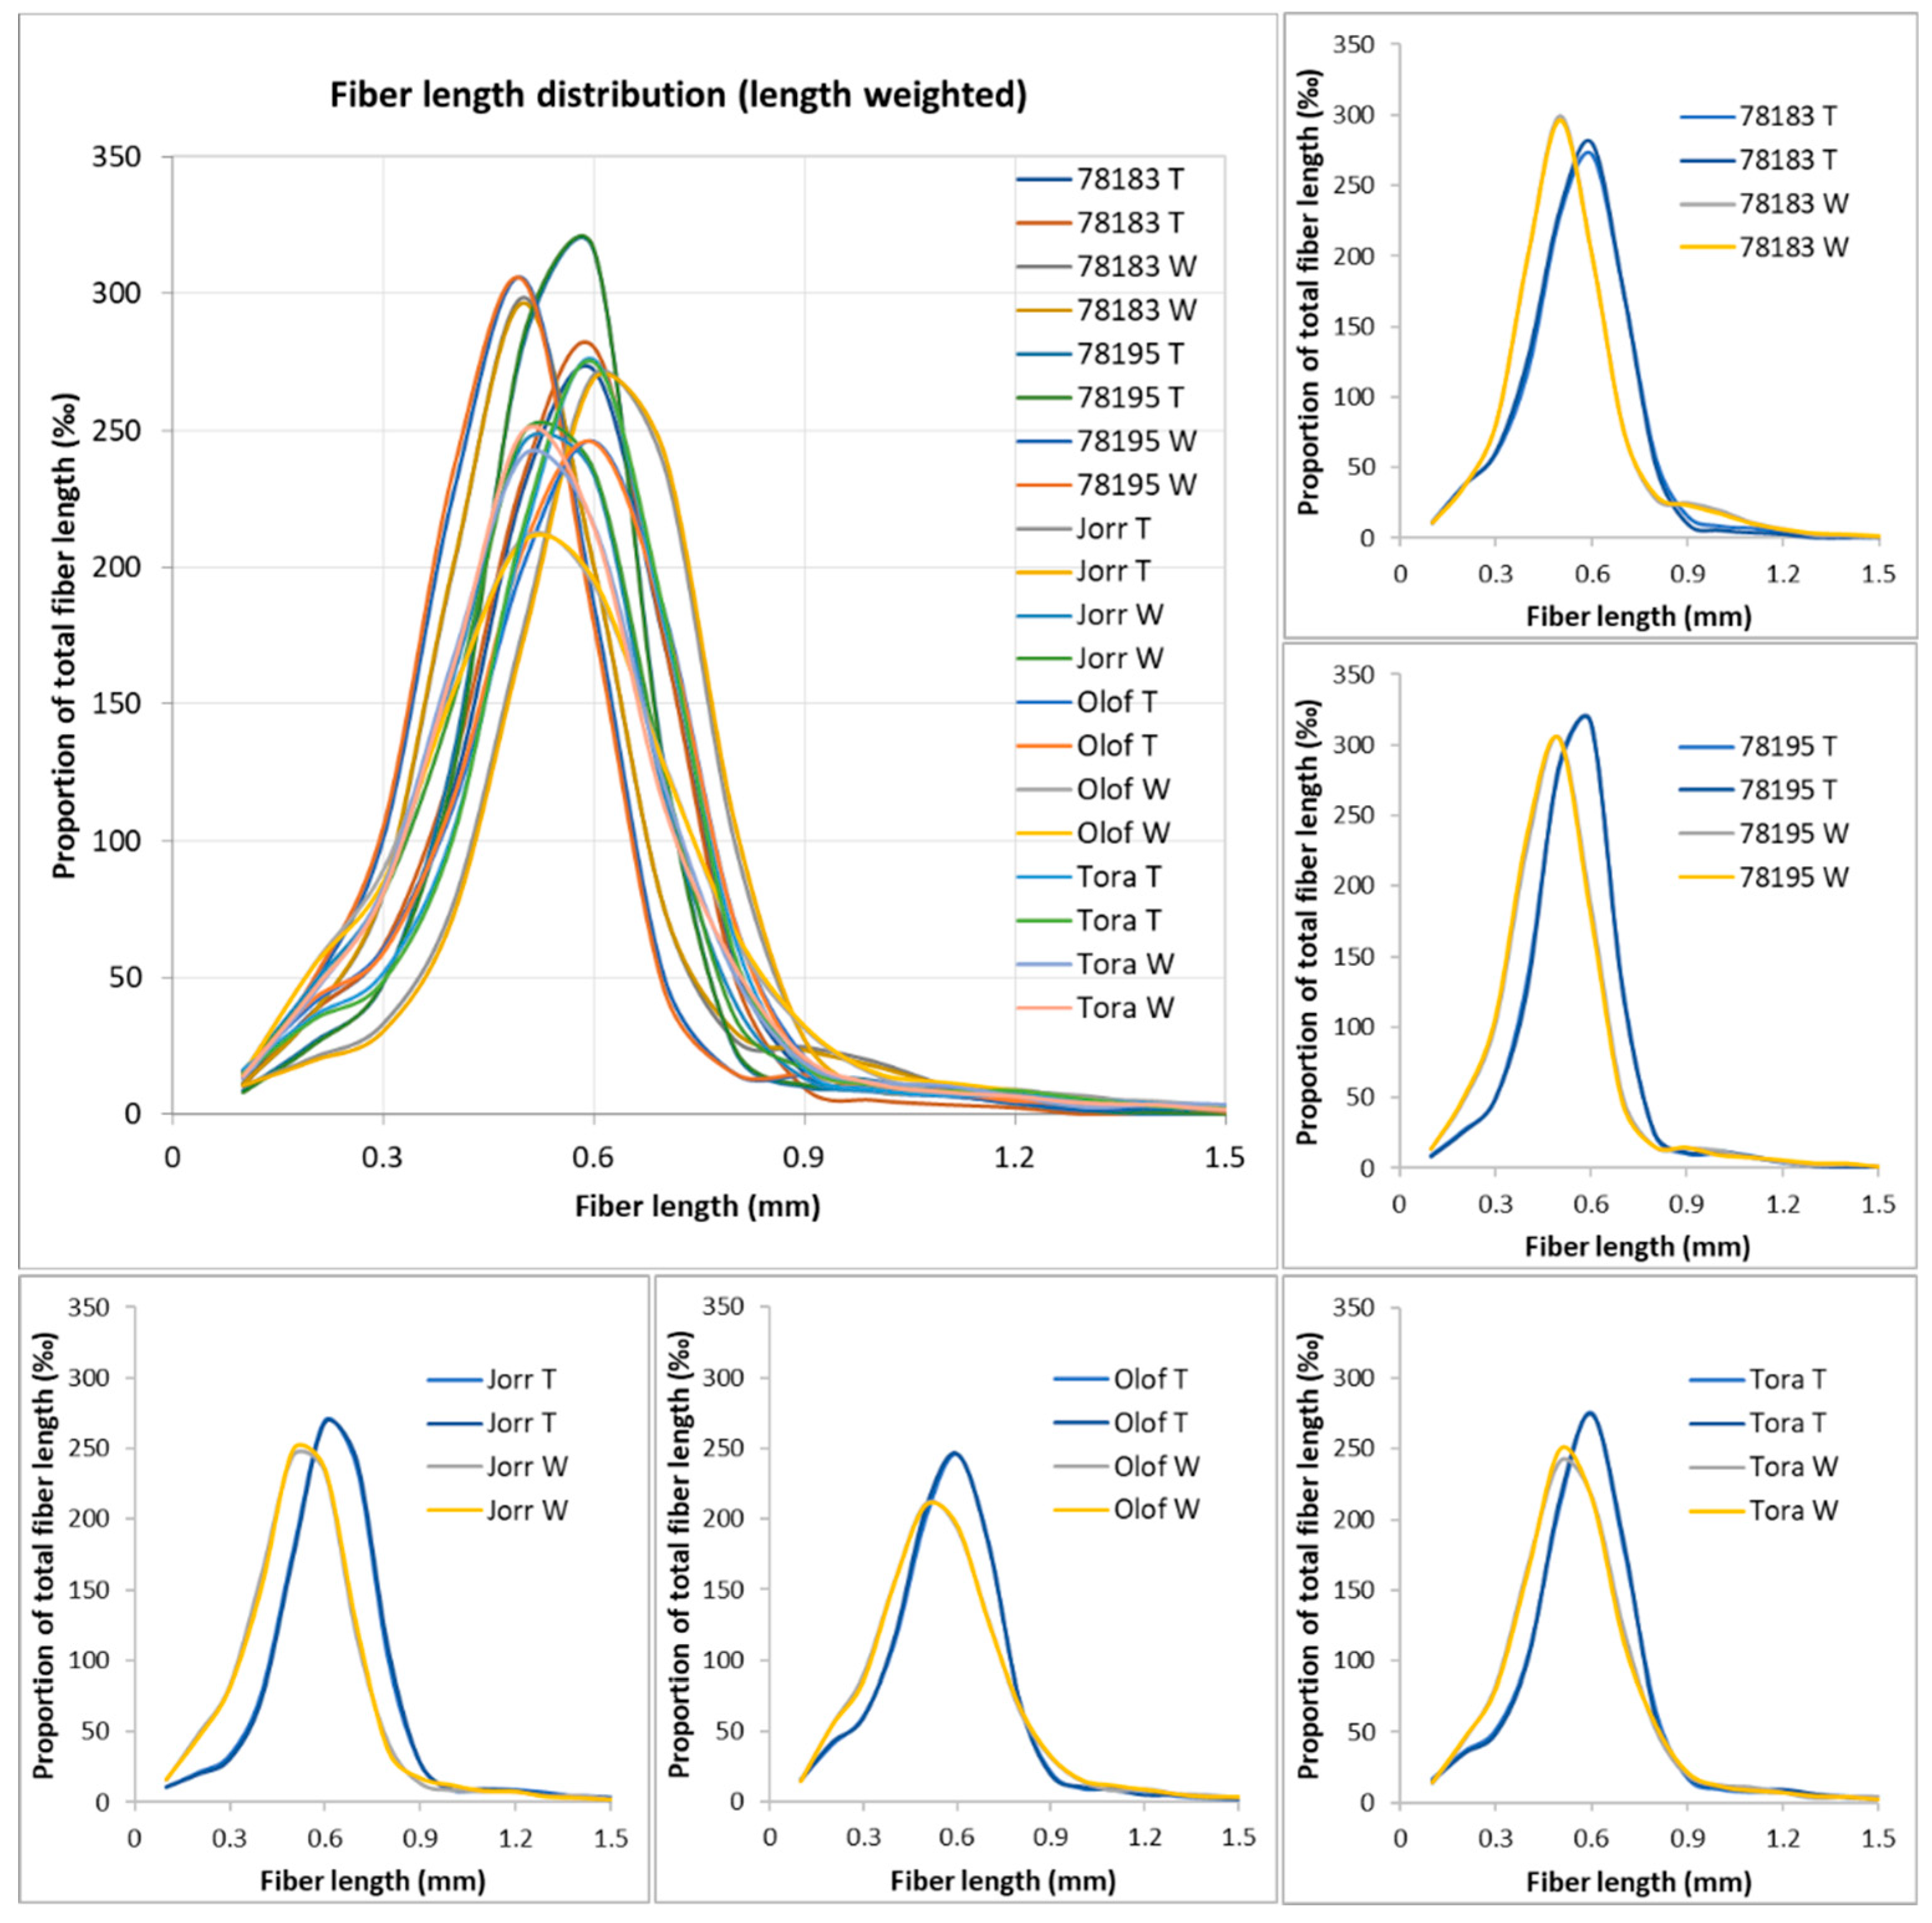
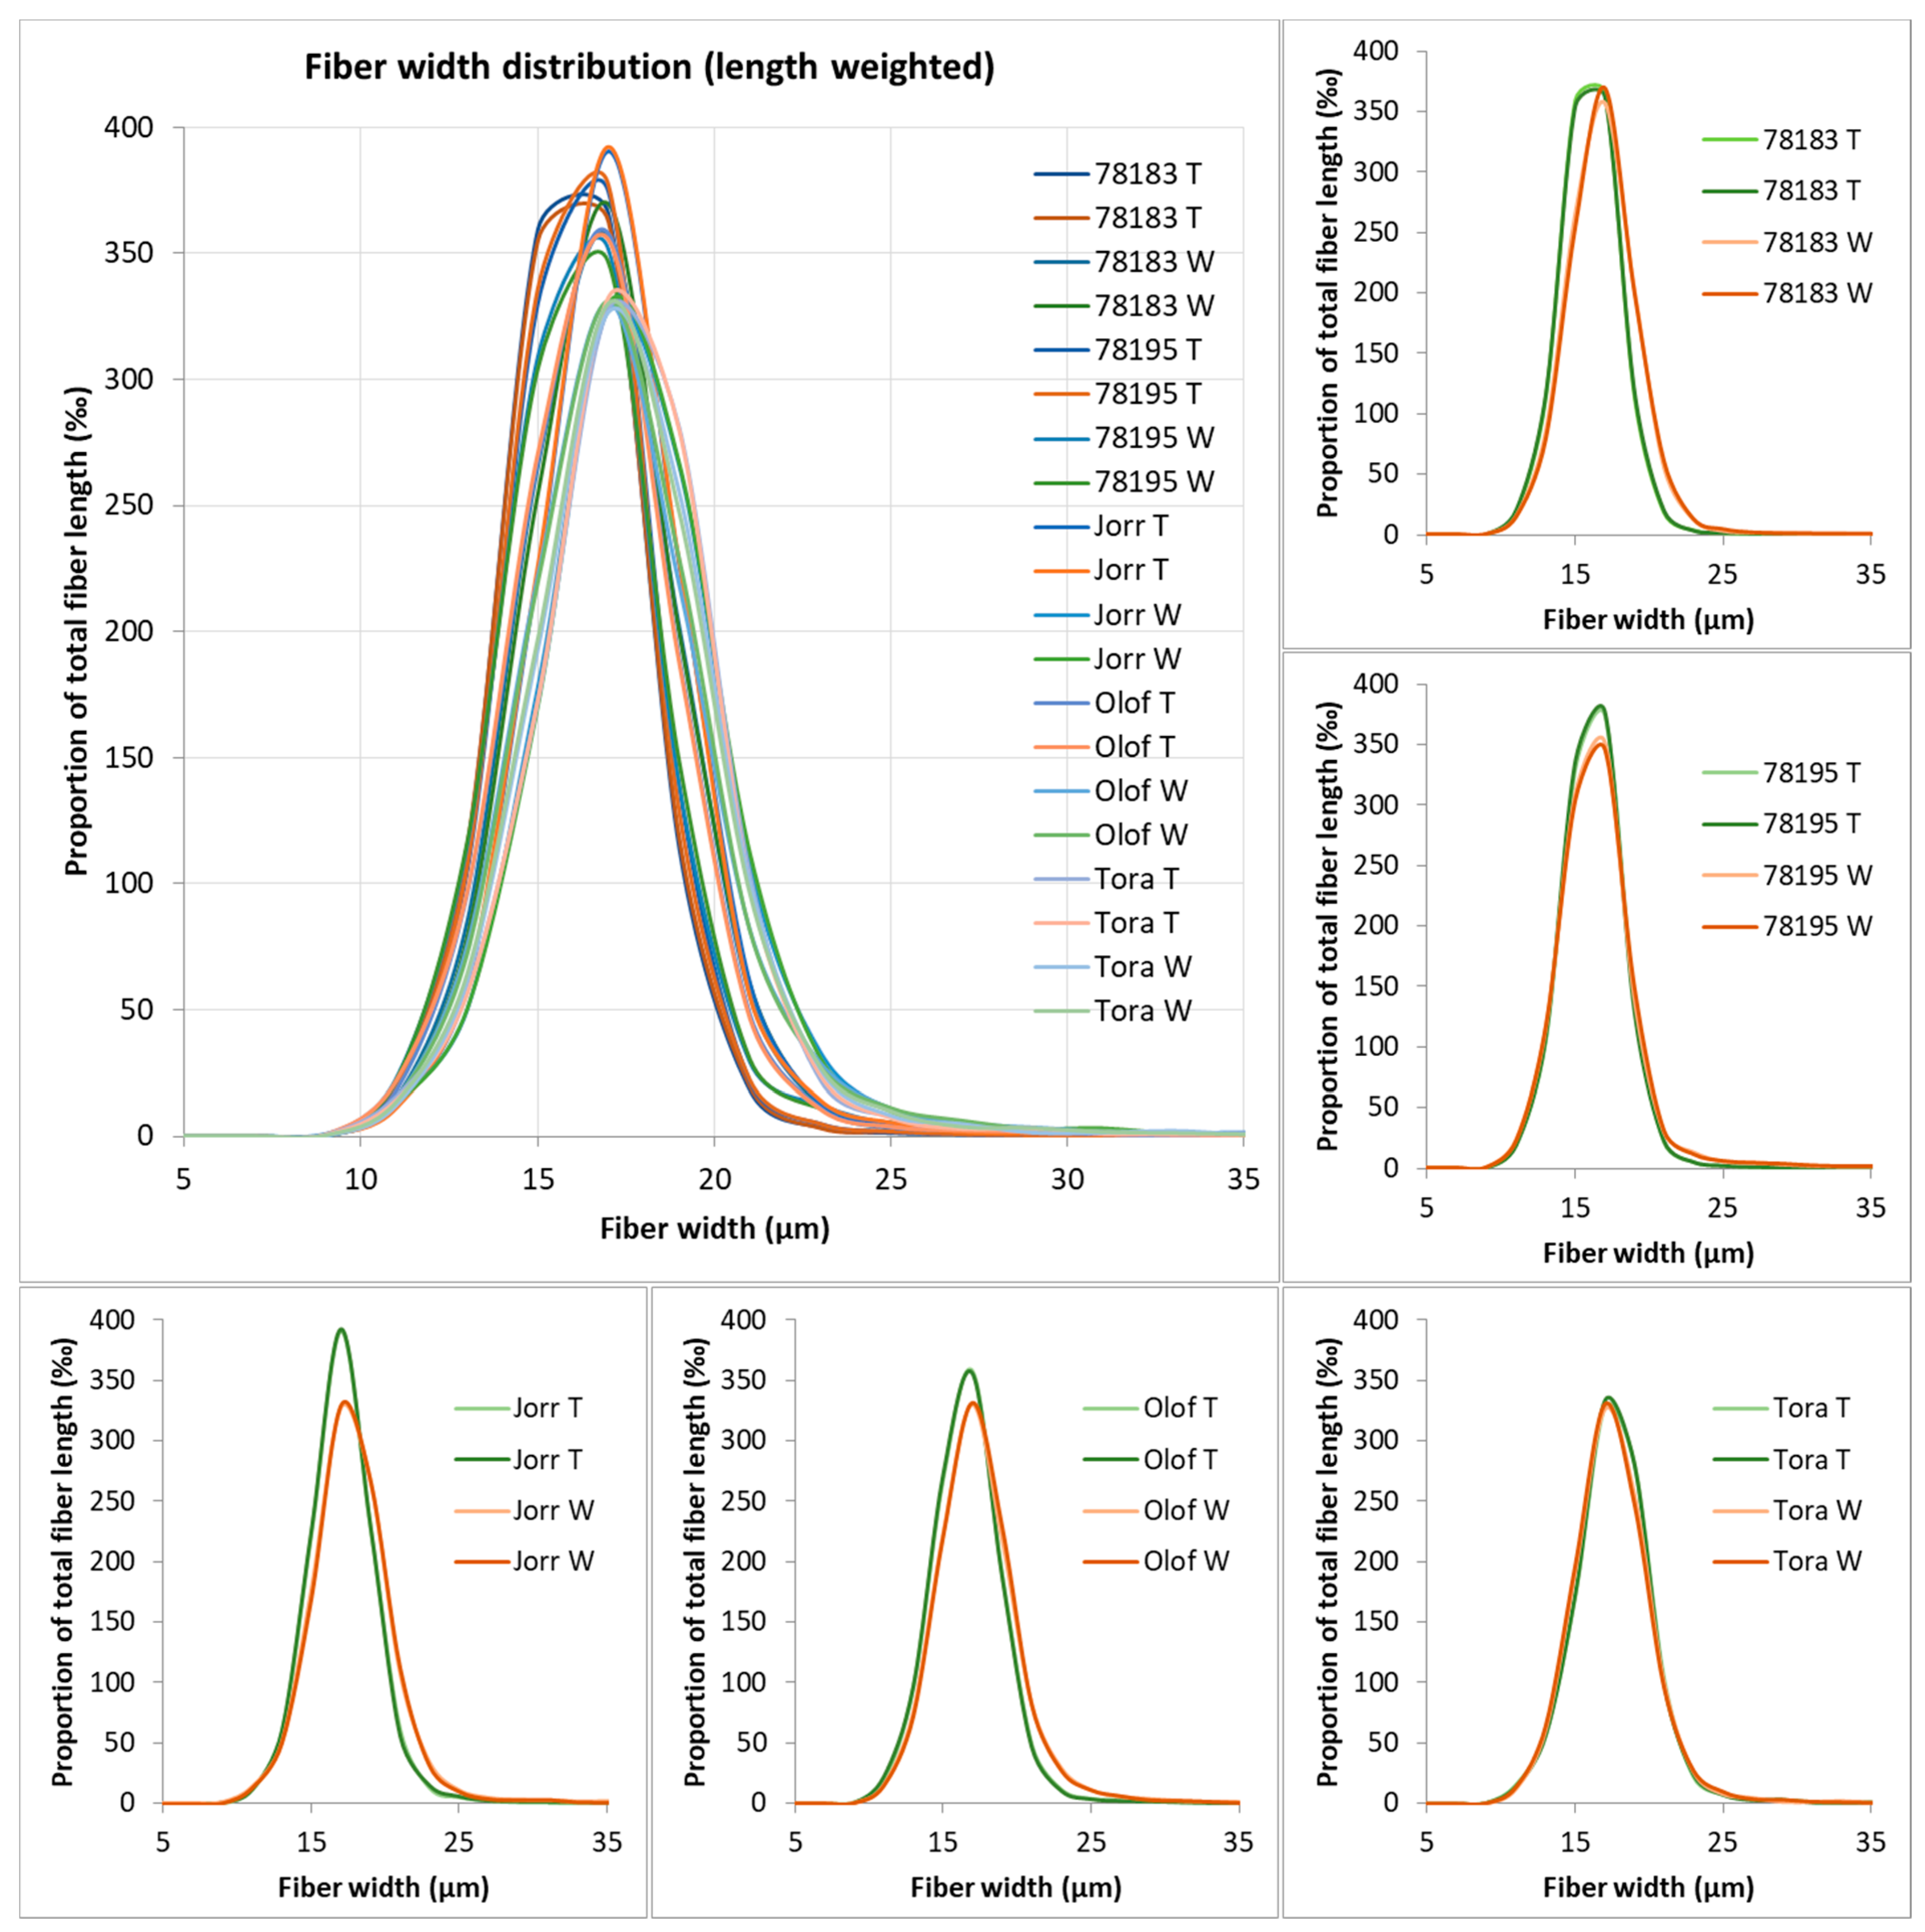
3.4. Morphometric Analyses of S. viminalis Clone Samples
4. Discussion
5. Conclusions
Author Contributions
Funding
Acknowledgments
Conflicts of Interest
References
- Pu, Y.; Zhang, D.; Singh, P.M.; Ragauskas, A.J. The new forestry biofuels sector. Biofuels Bioprod. Bioref. 2008, 2, 58–73. [Google Scholar] [CrossRef]
- Karp, A. Willows as a source of renewable fuels and diverse products. In Challenges and Opportunities for the World’s Forests in the 21st Century; Springer: Berlin, Germany, 2014; pp. 617–641. [Google Scholar]
- Sassner, P.; Galbe, M.; Zacchi, G. Techno-economic evaluation of bioethanol production from three different lignocellulosic materials. Biomass Bioenergy 2008, 32, 422–430. [Google Scholar] [CrossRef]
- Serapiglia, M.J.; Cameron, K.D.; Stipanovic, A.J.; Abrahamson, L.P.; Volk, T.; Smart, L.B. Yield and woody biomass traits of novel shrub willow hybrids at two contrasting sites. Bioenergy Res. 2013, 6, 533–546. [Google Scholar] [CrossRef] [Green Version]
- Pawar, P.M.-A.; Schnürer, A.; Mellerowicz, E.J.; Rönnberg-Wästljung, A.C. QTL mapping of wood FT-IR chemotypes shows promise for improving biofuel potential in short rotation coppice willow (Salix spp.). Bioenergy Res. 2018, 11, 351–363. [Google Scholar] [CrossRef] [Green Version]
- Horn, S.J.; Estevez, M.M.; Nielsen, H.K.; Linjordet, R.; Eijsink, V.G. Biogas production and saccharification of Salix pretreated at different steam explosion conditions. Bioresour. Technol. 2011, 102, 7932–7936. [Google Scholar] [CrossRef]
- Weih, M.; Hansson, P.A.; Ohlsson, J.A.; Sandgren, M.; Schnürer, A.; Rönnberg Wästljung, A. Sustainable production of willow for biofuel use. In Achieving Carbon-Negative Bioenergy Systems from Plant Materials; Saffron, C., Ed.; Burleigh Dodds Science Publishing Limited: Cambridge, UK, 2020; pp. 1–36. [Google Scholar]
- Materials Economics, M. EU Biomass Use in a Net-Zero Economy—A Course Correction for EU Biomass; Material Economic Sverige AB: Stockholm, Sweden, 2021. [Google Scholar]
- Stolarski, M.J.; Szczukowski, S.; Tworkowski, J.; Klasa, A. Yield, energy parameters and chemical composition of short-rotation willow biomass. Ind. Crop. Prod. 2013, 46, 60–65. [Google Scholar] [CrossRef]
- Hallingbäck, H.R.; Berlin, S.; Nordh, N.-E.; Weih, M.; Rönnberg-Wästljung, A.-C. Genome wide associations of growth, phenology, and plasticity traits in willow [Salix Viminalis (L.)]. Front. Plant Sci. 2019, 10, 753. [Google Scholar] [CrossRef]
- Karp, A.; Hanley, S.; Trybush, S.O.; Macalpine, W.; Pei, M.; Shield, I. Genetic improvement of willow for bioenergy and biofuels free access. J. Integr. Plant Biol. 2011, 53, 151–165. [Google Scholar] [CrossRef] [Green Version]
- Berlin, S.; Trybush, S.O.; Fogelqvist, J.; Gyllenstrand, N.; Hallingbäck, H.R.; Åhman, I.; Nordh, N.-E.; Shield, I.; Powers, S.J.; Weih, M.; et al. Genetic diversity, population structure and phenotypic variation in European Salix viminalis L. (Salicaceae). Tree Genet. Genomes 2014, 10, 1595–1610. [Google Scholar] [CrossRef] [Green Version]
- Ray, M.J.; Brereton, N.J.B.; Shield, I.; Karp, A.; Murphy, R.J. Variation in cell wall composition and accessibility in relation to biofuel potential of short rotation coppice willows. Bioenergy Res. 2012, 5, 685–698. [Google Scholar] [CrossRef]
- Berthod, N.; Brereton, N.J.B.; Pitre, F.E.; Labrecque, M. Five willow varieties cultivated across diverse field environments reveal stem density variation associated with high tension wood abundance. Front. Plant Sci. 2015, 6, 948. [Google Scholar] [CrossRef] [PubMed] [Green Version]
- Pilate, G.; Guiney, E.; Holt, K.; Petit-Conil, M.; Lapierre, C.; Leple, J.-C.; Pollet, B.; Mila, I.; Webster, E.A.; Marstorp, H.G.; et al. Field and pulping performances of transgenic trees with altered lignification. Nat. Biotechnol. 2002, 20, 607–612. [Google Scholar] [CrossRef]
- Himmel, M.E.; Ding, S.-Y.; Johnson, D.K.; Adney, W.S.; Nimlos, M.R.; Brady, J.W.; Foust, T.D. Biomass recalcitrance: Engineering plants and enzymes for biofuels production. Science 2007, 315, 804–807. [Google Scholar] [CrossRef] [Green Version]
- Davison, B.H.; Drescher, S.R.; Tuskan, G.; Davis, M.; Nghiem, N.P. Variation of S/G ratio and lignin content in a Populus family influences the release of xylose by dilute acid hydrolysis. Appl. Biochem. Biotechnol. 2006, 130, 427–435. [Google Scholar] [CrossRef]
- Chen, F.; Dixon, R.A. Lignin modification improves fermentable sugar yields for biofuel production. Nat. Biotechnol. 2007, 25, 759–761. [Google Scholar] [CrossRef]
- Chundawat, S.; Donohoe, B.S.; Sousa, L.D.C.; Elder, T.; Agarwal, U.P.; Lu, F.; Ralph, J.; Himmel, M.E.; Balan, V.; Dale, B.E. Multi-scale visualization and characterization of lignocellulosic plant cell wall deconstruction during thermochemical pretreatment. Energy Environ. Sci. 2011, 4, 973–984. [Google Scholar] [CrossRef]
- Anderson, N.A.; Tobimatsu, Y.; Ciesielski, P.N.; Ximenes, E.; Ralph, J.; Donohoe, B.S.; Ladisch, M.; Chapple, C. Manipulation of guaiacyl and syringyl monomer biosynthesis in an Arabidopsis cinnamyl alcohol dehydrogenase mutant results in atypical lignin biosynthesis and modified cell wall structure. Plant Cell 2015, 27, 2195–2209. [Google Scholar] [CrossRef]
- Lockhart, J. Altering lignin composition to improve biofuel production. Plant Cell 2015, 27, 2082. [Google Scholar] [CrossRef]
- McCann, M.C.; Carpita, N.C. Biomass recalcitrance: A multi-scale, multi-factor, and conversion-specific property. J. Exp. Bot. 2015, 66, 4109–4118. [Google Scholar] [CrossRef] [Green Version]
- Serapiglia, M.J.; Humiston, M.C.; Xu, H.; Hogsett, D.A.; De Orduña, R.M.; Stipanovic, A.J.; Smart, L.B.S. Enzymatic saccharification of shrub willow genotypes with differing biomass composition for biofuel production. Front. Plant Sci. 2013, 4, 57. [Google Scholar] [CrossRef] [Green Version]
- Ruelle, J. Morphology, anatomy and ultrastructure of reaction wood. In The Biology of Reaction Wood; Springer: Berlin, Germany, 2014; pp. 13–35. [Google Scholar]
- Gardiner, B.; Barnett, J.; Saranpää, P.; Gril, J. The Biology of Reaction Wood; Springer: Berlin, Germany, 2014. [Google Scholar]
- Daniel, G.; Filonova, L.; Kallas, Å.M.; Teeri, T.T. Morphological and chemical characterisation of the G-layer in tension wood fibres of Populus tremula and Betula verrucosa: Labelling with cellulose-binding module CBM1HjCel7A and fluorescence and FE-SEM microscopy. Holzforschung 2006, 60, 618–624. [Google Scholar] [CrossRef]
- Lehringer, C.; Daniel, G.; Schmitt, U. TEM/FE-SEM studies on tension wood fibres of Acer spp., Fagus sylvatica L. and Quercus robur L. Wood Sci. Technol. 2009, 43, 691–702. [Google Scholar] [CrossRef]
- Foston, M.; Hubbell, C.A.; Samuel, R.; Jung, S.; Fan, H.; Ding, S.-Y.; Zeng, Y.; Jawdy, S.; Davis, M.; Sykes, R.; et al. Chemical, ultrastructural and supramolecular analysis of tension wood in Populus tremula × alba as a model substrate for reduced recalcitrance. Energy Environ. Sci. 2011, 4, 4962–4971. [Google Scholar] [CrossRef]
- Brereton, N.J.; Ray, M.J.; Shield, I.; Martin, P.; Karp, A.; Murphy, R.J. Reaction wood–a key cause of variation in cell wall recalcitrance in willow. Biotechnol. Biofuels 2012, 5, 1–11. [Google Scholar] [CrossRef] [Green Version]
- Larsson, S. Genetic improvement of willow for short-rotation coppice. Biomass Bioenergy 1998, 15, 23–26. [Google Scholar] [CrossRef]
- Ohlsson, J.A.; Hallingbäck, H.R.; Jebrane, M.; Harman-Ware, A.E.; Shollenberger, T.; Decker, S.R.; Sandgren, M.; Rönnberg-Wästljung, A.-C. Genetic variation of biomass recalcitrance in a natural Salix viminalis (L.) population. Biotechnol. Biofuels 2019, 12, 1–12. [Google Scholar] [CrossRef]
- Stamm, A.J. Density of wood substance, adsorption by wood, and permeability of wood. J. Phys. Chem. 1929, 33, 398–414. [Google Scholar] [CrossRef]
- Sluiter, A.; Hames, B.; Ruiz, R.; Scarlata, C.; Sluiter, J.; Templeton, D.; Crocker, D.L.A.P. Determination of structural carbohydrates and lignin in biomass. Lab. Anal. Proced. 2012, 1617, 1–15. [Google Scholar]
- Robards, A.W.; Purvis, M.J. Chlorazol black E as a stain for tension wood. Stain Technol. 1964, 39, 309–315. [Google Scholar] [CrossRef]
- Gao, J.; Jebrane, M.; Terziev, N.; Daniel, G. Enzymatic hydrolysis of the gelatinous layer in tension wood of Salix varieties as a measure of accessible cellulose for biofuels. Biotechnol. Biofuels 2021, 14, 1–18. [Google Scholar] [CrossRef]
- Nakagawa, K.; Yoshinaga, A.; Takabe, K. Anatomy and lignin distribution in reaction phloem fibres of several Japanese hardwoods. Ann. Bot. 2012, 110, 897–904. [Google Scholar] [CrossRef] [Green Version]
- Kim, J.S.; Gao, J.; Terziev, N.; Cuccui, I.; Daniel, G. Chemical and ultrastructural changes of ash wood thermally modified using the thermo-vacuum process: I. Histo/cytochemical studies on changes in the structure and lignin chemistry. Holzforschung 2015, 69, 603–613. [Google Scholar] [CrossRef]
- Daniel, G. Microscope techniques for understanding wood cell structure and biodegradation. In Secondary Xylem Biology; Elsevier: Amsterdam, The Netherlands, 2016; pp. 309–343. [Google Scholar]
- Wise, L.E. Chlorite holocellulose, its fractionation and bearing on summative wood analysis and on studies on the hemicelluloses. Pap. Trade 1946, 122, 35–43. [Google Scholar]
- Klašnja, B.; Orlović, S.; Galić, Z. Comparison of different wood species as raw materials for bioenergy. South-East Eur. For. SEEFOR 2013, 4, 81–88. [Google Scholar] [CrossRef] [Green Version]
- Clair, B.; Thibaut, B.; Sugiyama, J. On the detachment of the gelatinous layer in tension wood fiber. J. Wood Sci. 2005, 51, 218–221. [Google Scholar] [CrossRef]
- Brereton, N.J.B.; Ahmed, F.; Sykes, D.; Ray, M.J.; Shield, I.; Karp, A.; Murphy, R.J. X-ray micro-computed tomography in willow reveals tissue patterning of reaction wood and delay in programmed cell death. BMC Plant Biol. 2015, 15, 1–12. [Google Scholar] [CrossRef] [Green Version]
- Ledin, S. Willow wood properties, production and economy. Biomass Bioenergy 1996, 11, 75–83. [Google Scholar] [CrossRef]
- Jeoh, T.; Ishizawa, C.I.; Davis, M.; Himmel, M.E.; Adney, W.S.; Johnson, D.K. Cellulase digestibility of pretreated biomass is limited by cellulose accessibility. Biotechnol. Bioeng. 2007, 98, 112–122. [Google Scholar] [CrossRef]
- Ohlsson, J.A.; Harman-Ware, A.E.; Sandgren, M.; Schnürer, A. Biomass recalcitrance in willow under two biological conversion paradigms: Enzymatic hydrolysis and anaerobic digestion. Bioenergy Res. 2020, 13, 260–270. [Google Scholar] [CrossRef] [Green Version]
- Gritsch, C.; Wan, Y.; Mitchell, R.A.C.; Shewry, P.R.; Hanley, S.J.; Karp, A. G-fibre cell wall development in willow stems during tension wood induction. J. Exp. Bot. 2015, 66, 6447–6459. [Google Scholar] [CrossRef] [Green Version]
- Obst, J.R. Lignins: Structure and distribution in wood and pulp. MRS Online Proc. Libr. 1990, 197, 11–20. [Google Scholar] [CrossRef]
- Ai, J.; Tschirner, U. Fiber length and pulping characteristics of switchgrass, alfalfa stems, hybrid poplar and willow biomasses. Bioresour. Technol. 2010, 101, 215–221. [Google Scholar] [CrossRef]
- Jourez, B.; Riboux, A.; Leclercq, A. Anatomical characteristics of tension wood and opposite wood in young inclined stems of poplar (Populus euramericana cv ‘Ghoy’). IAWA J. 2001, 22, 133–157. [Google Scholar] [CrossRef]
- Clair, B.; Ruelle, J.; Beauchêne, J.; Prévost, M.F.; Fournier, M. Tension wood and opposite wood in 21 tropical rain forest species. IAWA J. 2006, 27, 341–376. [Google Scholar] [CrossRef] [Green Version]
- Xu, F.; Sun, R.-C.; Lu, Q.; Jones, G.L. Comparative study of anatomy and lignin distribution in normal and tension wood of Salix gordejecii. Wood Sci. Technol. 2006, 40, 358. [Google Scholar] [CrossRef]


| Debarked S. viminalis Samples | Density (kg/m3) | Tension(%) | Lignin(%) | Carbohydrate (%) | ||||||
|---|---|---|---|---|---|---|---|---|---|---|
| AIL | ASL | Total Lignin | Glucose | Xylose | Galactose | Mannose | Total Sugar | |||
| 1293 | 441.0 | 10.5 | 16.0 | 2.4 | 18.4 | 47.3 | 12.6 | 0.5 | 4.0 | 64.4 |
| P86 | 451.1 | 20.8 | 18.4 | 2.1 | 20.5 | 52.5 | 11.0 | 0.4 | 2.2 | 66.1 |
| 738 | 474.3 | 13.6 | 16.0 | 2.0 | 18.0 | 53.1 | 11.2 | 0.4 | 1.2 | 66.0 |
| IA159 | 495.2 | 6.9 | 16.2 | 2.4 | 18.6 | 47.8 | 12.7 | 0.4 | 1.9 | 62.8 |
| 118_PL | 497.3 | 16.8 | 17.8 | 1.9 | 19.7 | 55.9 | 11.9 | 0.4 | 1.8 | 70.0 |
| 81041 | 504.1 | 31.1 | 15.1 | 2.2 | 17.3 | 58.6 | 8.4 | 0.4 | 1.9 | 69.3 |
| D178 | 510.9 | 23.2 | 19.9 | 1.8 | 21.7 | 48.9 | 9.4 | 0.4 | 2.3 | 61.0 |
| 500165 | 512.0 | 15.5 | 16.2 | 2.6 | 18.9 | 51.8 | 10.1 | 0.4 | 1.6 | 63.9 |
| 102_PL | 522.0 | 39.2 | 16.1 | 2.1 | 18.2 | 60.1 | 7.9 | 0.5 | 1.9 | 70.4 |
| D149 | 529.9 | 11.8 | 16.6 | 2.5 | 19.0 | 52.2 | 12.0 | 0.4 | 2.9 | 67.6 |
| IA115 | 539.4 | 21.6 | 16.8 | 2.5 | 19.3 | 54.3 | 12.1 | 0.4 | 1.5 | 68.3 |
| 711 | 541.3 | 10.8 | 20.3 | 1.7 | 22.0 | 51.3 | 11.2 | 0.4 | 1.9 | 64.8 |
| 67_CZ | 548.5 | 20.1 | 19.5 | 1.8 | 21.3 | 49.9 | 10.9 | 0.4 | 1.7 | 62.8 |
| 731 | 560.2 | 7.6 | 18.5 | 2.4 | 20.9 | 49.3 | 10.3 | 0.4 | 1.7 | 61.8 |
| IA155 | 570.7 | 18.4 | 14.9 | 2.4 | 17.3 | 53.6 | 9.2 | 0.5 | 2.8 | 66.1 |
| P317 | 576.8 | 25.6 | 17.3 | 2.4 | 19.7 | 51.6 | 10.4 | 0.4 | 2.0 | 64.4 |
| Grp37 | 590.2 | 20.5 | 18.9 | 1.9 | 20.8 | 49.4 | 9.7 | 0.4 | 1.9 | 61.4 |
| 6852 | 624.6 | 24.6 | 15.4 | 2.6 | 17.9 | 49.9 | 11.3 | 0.9 | 3.4 | 65.5 |
| 43_CZ | 627.7 | 20.2 | 18.9 | 2.2 | 21.1 | 51.8 | 9.9 | 0.4 | 1.6 | 63.8 |
| 6851 | 662.0 | 38.1 | 13.9 | 2.5 | 16.4 | 59.0 | 16.3 | 0.0 | 1.8 | 77.2 |
| Debarked S. viminalis Samples | Tension Area (%) | Density (kg/m3) | Total Lignin (%) | Total Sugar (%) |
|---|---|---|---|---|
| Tension area (%) | 1 | 0.395 * | −0.463 ** | 0.622 *** |
| -- | (0.085) | (0.040) | (0.003) | |
| Density (kg/m3) | 1 | −0.080 | 0.219 | |
| -- | (0.737) | (0.353) | ||
| Total lignin (%) | 1 | −0.657 *** | ||
| -- | (0.002) | |||
| Total sugar (%) | 1 | |||
| -- |
| Debarked S. viminalis Samples | Stem Diameter (mm) | Pith (%) | 1st Growth Ring (%) | 2nd Growth Ring (%) | Tension (%) | Density (kg/m3) |
|---|---|---|---|---|---|---|
| 1293 | 11.6 | 3.5 | 19.3 | 77.2 | 10.5 | 441.0 |
| P86 | 15.2 | 3.6 | 23.9 | 72.6 | 20.8 | 451.1 |
| 738 | 12.8 | 9.1 | 32.8 | 58.1 | 13.6 | 474.3 |
| IA159 | 12.8 | 5.3 | 21.7 | 73.0 | 6.9 | 495.2 |
| 118_PL | 18.1 | 1.7 | 17.3 | 81.0 | 16.8 | 497.3 |
| 81041 | 10.2 | 2.4 | 36.8 | 60.9 | 31.1 | 504.1 |
| D178 | 12.3 | 3.7 | 18.1 | 78.2 | 23.2 | 510.9 |
| 500165 | 13.8 | 3.7 | 26.8 | 69.5 | 15.5 | 512.0 |
| 102_PL | 13.6 | 2.3 | 22.9 | 74.8 | 39.2 | 522.0 |
| D149 | 11.4 | 5.1 | 31.3 | 63.6 | 11.8 | 529.9 |
| IA115 | 16.6 | 3.6 | 30.3 | 66.1 | 21.6 | 539.4 |
| 711 | 8.6 | 8.0 | 29.0 | 63.0 | 10.8 | 541.3 |
| 67_CZ | 10.9 | 4.9 | 24.3 | 70.8 | 20.1 | 548.5 |
| 731 | 12.5 | 5.3 | 32.6 | 62.2 | 7.6 | 560.2 |
| IA155 | 12.7 | 3.0 | 29.8 | 67.2 | 18.4 | 570.7 |
| P317 | 10.3 | 4.3 | 20.1 | 75.6 | 25.6 | 576.8 |
| Grp37 | 10.3 | 6.5 | 27.8 | 65.7 | 20.5 | 590.2 |
| 6852 | 12.6 | 4.4 | 37.0 | 58.5 | 24.6 | 624.6 |
| 43_CZ | 10.4 | 4.2 | 26.1 | 69.7 | 20.2 | 627.7 |
| 6851 | 14.9 | 4.1 | 27.3 | 68.5 | 38.1 | 662.0 |
| FWHM | Max Height | Center Grvty | Diameter (mm) | Density (kg/m3) | |
|---|---|---|---|---|---|
| P317 | 0.29 | 286.8 | 0.50 | 10.3 | 576.8 |
| Grp37 | 0.30 | 288.5 | 0.49 | 10.8 | 590.2 |
| 6851 | 0.33 | 247.8 | 0.55 | 14.9 | 662.0 |
| 731 | 0.29 | 286.1 | 0.46 | 12.5 | 560.2 |
| 711 | 0.25 | 338.4 | 0.42 | 8.6 | 541.3 |
| D149 | 0.26 | 330.1 | 0.43 | 11.4 | 529.9 |
| 81041 | 0.25 | 330.1 | 0.40 | 10.2 | 504.1 |
| D178 | 0.28 | 304.4 | 0.47 | 12.3 | 510.9 |
| FWHM | Max Height | Center Grvty | Diameter (mm) | Density (kg/m3) | |
|---|---|---|---|---|---|
| 78183 | 0.29 | 281.6 | 0.50 | 17.5 | 506.3 |
| 78195 | 0.27 | 291.6 | 0.48 | 14.4 | 508.2 |
| Jorr | 0.32 | 244.3 | 0.53 | 22.2 | 508.6 |
| Olof | 0.40 | 197.9 | 0.53 | 28.0 | 499.2 |
| Tora | 0.35 | 230.8 | 0.53 | 28.2 | 459.3 |
| Björn | 0.39 | 206.2 | 0.58 | 32.4 | 493.3 |
| S. viminalis Samples | Ratio of Vessels in OW and TW | |
|---|---|---|
| Result from OFA (minimum 100,000 particles) | 78183 | 1.51 |
| 78195 | 0.99 | |
| Jorr | 3.35 | |
| Olof | 1.21 | |
| Björn | 2.16 | |
| D178 | 2.59 | |
| 81041 | 1.21 | |
| Observations from SEM (ca. 4000 particles) | 81041 | 1.15 |
Publisher’s Note: MDPI stays neutral with regard to jurisdictional claims in published maps and institutional affiliations. |
© 2021 by the authors. Licensee MDPI, Basel, Switzerland. This article is an open access article distributed under the terms and conditions of the Creative Commons Attribution (CC BY) license (https://creativecommons.org/licenses/by/4.0/).
Share and Cite
Gao, J.; Jebrane, M.; Terziev, N.; Daniel, G. Evaluation of Wood Quality Traits in Salix viminalis Useful for Biofuels: Characterization and Method Development. Forests 2021, 12, 1048. https://doi.org/10.3390/f12081048
Gao J, Jebrane M, Terziev N, Daniel G. Evaluation of Wood Quality Traits in Salix viminalis Useful for Biofuels: Characterization and Method Development. Forests. 2021; 12(8):1048. https://doi.org/10.3390/f12081048
Chicago/Turabian StyleGao, Jie, Mohamed Jebrane, Nasko Terziev, and Geoffrey Daniel. 2021. "Evaluation of Wood Quality Traits in Salix viminalis Useful for Biofuels: Characterization and Method Development" Forests 12, no. 8: 1048. https://doi.org/10.3390/f12081048
APA StyleGao, J., Jebrane, M., Terziev, N., & Daniel, G. (2021). Evaluation of Wood Quality Traits in Salix viminalis Useful for Biofuels: Characterization and Method Development. Forests, 12(8), 1048. https://doi.org/10.3390/f12081048