Article

Allocation of Wood Density in European Oak (Quercus robur L.) Trees Grown under a Canopy of Scots Pine

by
Marcin Jakubowski
* and
Marek Dobroczyński
Department of Forest Utilisation, Faculty of Forestry and Wood Technology, Poznań University of Life Sciences, Wojska Polskiego 71 A, 60-625 Poznań, Poland
*
Author to whom correspondence should be addressed.
Forests 2021, 12(6), 712; https://doi.org/10.3390/f12060712
Submission received: 14 April 2021 / Revised: 27 May 2021 / Accepted: 27 May 2021 / Published: 30 May 2021
(This article belongs to the Section Wood Science and Forest Products)

Abstract

:
The allocation of wood density in trees depends on many factors, but mainly on the tree species. A great number of studies have analysed wood density in dominant or codominant trees, but only a few have focused on trees grown under canopy. We examined the basic wood density and fresh wood density of natural origin oaks growing under canopy of artificially planted Scots pine. The major purpose of the work was to study the wood density allocation in different parts of the trees such as the trunk and branches. From a total of 80 oaks we selected eight model trees and measured biometric features of their trunks and crowns. Wood samples from different parts of the trunk and crown were collected after the trees were felled. We observed significant differences between the average basic wood density (595 kg·m−3) and the average fresh wood density (1031 kg·m−3). The central part of the trunk and heartwood shows much higher density than the outer part of the trunk and sapwood, which corresponds to the model of ring-porous trees. Both types of wood density (basic and fresh) were also higher in the trunk than in the branches. The wood density of the branches differed between two zones: A1, which was closer to the trunk and had higher density; and A2, which was farther away from the trunk with lower density. Wood density shows positive correlation with crown length but not with crown width, which was more connected with diameter at breast height. We found lower value of slenderness than the value reported by other authors in oaks planted without canopy. The allocation of wood density in trees is associated with the potential mechanical load.

1. Introduction

Wood density is one of the most important quality predictors that is often used in various fields of research, such as biology, ecology [1,2,3], species population studies [4,5,6,7], forest biomass estimation [8,9,10] and even as predictor of tree mortality under drought [11].
There are several types of wood density, which are defined differently in different scientific works. Mostly, wood density is defined as density of oven-dry wood density [6,12,13,14], basic density or relative density [6,10], green density or fresh density (FD) [15], the density at 12% moisture content, according to various technical standards [16,17], or density calculated for unconventional levels of moisture content [18]. Some researchers have also used relative density based on various types of interpolation [19,20,21,22,23,24,25]. A completely novel approach is represented by X-ray densitometry [26,27,28]. Each type of wood density shows results on different scales, so comparing the results of various works is difficult and sometimes impossible. Predicting other wood properties based on various types of wood density is also complicated [29]. Many researchers have used another type of density-specific gravity, which is used as an equivalent to wood density. Williamson [30] reported on the correct definitions of specific gravity. The work of Gao [24,25] is also helpful for understanding types of wood density. In this work, we used two types of wood density as described below.
Because of its ring-porous structure, the wood density of oak is often determined by methods based on X-ray densitometry and computed tomography [31,32,33,34,35,36,37], resistance drilling [3] and other methods that calculate the density relatively [38]. The results of such measurements allow comparison among different populations [5,39,40] and explanations of reactions in the trees [31]. From the point of view of forestry and industrial practices, they are less useful. Wood density calculated using technical standards and with detailed methodological description is more useful for the wood industry and forestry [14,41,42,43,44].
Most of the research relating to oak wood density focuses on dominant or codominant trees [37,45,46,47], with clone studies occasionally conducted on seed orchards [48]. Studies on trees growing in different biosocial positions are less common [3] and there have been few studies on trees growing under canopy [49]. The general focus on dominant trees comes from the analysis of tree rings [46], which are typically collected from dominant trees.
For many years after the Second World War, the Scots pine planting model dominated in Poland as a commercial basis for the wood industry. Pine was also planted in locations where other, primarily deciduous, species occurred. These monoculture stands were sensitive to many factors, such as gradations, fires and strong winds. For the last 30 years, foresters have rebuilt many coniferous forests into mixed or broadleaved forests. Our experimental research area represents a mixture of pine and oak, which was established in an unusual way. Scots pine (115 years old) was planted on sites that prefer oaks and other deciduous trees. The under canopy oak forest was not planted with all trees being of natural origin, growing under the process of natural succession.
The principal aim of this study was to record wood density allocation in different parts of oak trees. As an additional goal, we wanted to provide estimated correlations between wood density and the biometric features of the trees. Biometric characteristics in combination with wood density can help predict tree behaviour after pine removal. We hypothesised that: (H1) the radial variability in wood density would follow the typical model for ring-porous trees, with the wood density decreasing from pith to bark; (H2) we expected the wood density to depend on the height and lower wood density in the branches due to juvenile character of the wood; and (H3) we also assumed that the wood density would be related to the light-dependent biometric features of trees.

2. Materials and Methods

2.1. Study Area, Tree Selection and Wood Sampling Procedure

The study area was in the central part of Poland, at latitude − 52°09′ N, 17°27′ E and an altitude 78 m a.s. The research was carried out in a mixed forest with 115-year-old Scots pine and younger oak under the canopy. The Scots pine was planted as a monoculture, and all the trees are of the same age. The oaks, however, occur as a naturally established forest, and are aged between 60 and 80 years. The overstory basal area was 28.9 m2/ha. Site index in the Polish classification was III on a six-grade scale, meaning average conditions. The forest is treated as water-protective, and the last thinning operations were carried out more than 20 years ago. A sample plot with 80 oaks was selected. The diameter of breast height (DBH) and height (H) of all the trees were measured. Measured traits were used to calculate slenderness as the ratio between H and DBH. Based on distribution and height curve, we selected eight as representative of the sample plot. The selected trees had regular healthy crowns. We measured the following biometric features of these model trees: DBH, H, length of living crown, width of crown and the direction of north (Table 1).
The selected trees were felled and the wood samples were collected according to the following methods. Four 2 cm thick discs were taken from each tree from: (1)—base of the trunk (at 0.2 m); (2) the level of the DBH (1.3 m); (3)—base of the crown (relative height); (4) the middle of the crown length; and (5) six discs from branches based on the scheme described in Figure 1. The first disc (from zone A1) was taken 10 cm from the trunk, the second (from zone A2) from the middle of the crown width. All the samples were collected in July 2019.

2.2. Measurement of Wood Density

The mass of fresh (green) wood was determined on site for complete discs (from the trunk and branches) after removing the bark. The dry wood mass was measured in two ways: from discs (but only from the branches, because they were too small to split into pieces) and from small samples after cutting (only from the trunk). Small cubed samples were cut from the discs in radial rows, oriented in the east–west and north–south directions (Figure 1). Not all the diameters of the samples were measured because the volume calculation was performed using a water displacement method, but they ranged between 1.4 cm and 1.6 cm in every direction. The number of samples from each radius depended on the diameter of the disk and ranged between four and eight (Figure 1). We collected 645 small samples in total. The samples were then dried in a laboratory dryer at 105 °C until they reached constant weight. The mass of each sample was measured by using two laboratory scales to provide accuracy of 0.1 g (for discs) and 0.01 g (for the small samples). Scales were also used to measure the volume of wood above the fibre saturation point by using the water displacement method [50]. For the volume measurement, wood samples were immersed in water for 72 h. BD and FD were measured using the following formulae:
BD = M 0 % V max  
where: BD = basic density (kg·m−3), M0% = mass of sample at 0% of moisture content and Vmax = volume of sample at maximum swelling.
  FD = M V max
where: FD = fresh density (kg·m−3), M = mass of sample as fresh wood (the moisture content refers to wood removed from just a fallen tree) and Vmax = volume of sample as fresh wood (as above).

2.3. Statistical Analysis

Statistical analyses were applied in two ways—to compare different groups of wood density and to correlate wood density with the biometric parameters. The basic statistics were plotted as graphs using a standard boxplot (frame = Q25 to Q75, centre line = median). We also used a violin chart to show the density of the values. In order to verify the statistical differences between the groups, we used nonparametric tests because of lack of a normal distribution in the wood density. The Mann–Whitney test was used for two groups, and the Kruskal–Wallis test for more than two groups. All the tests were performed at a level α = 0.05 using Statistica software. In order to estimate the relationships between the wood density and biometric features, we built a correlation matrix based on Spearman’s rank coefficient.

3. Results and Discussion

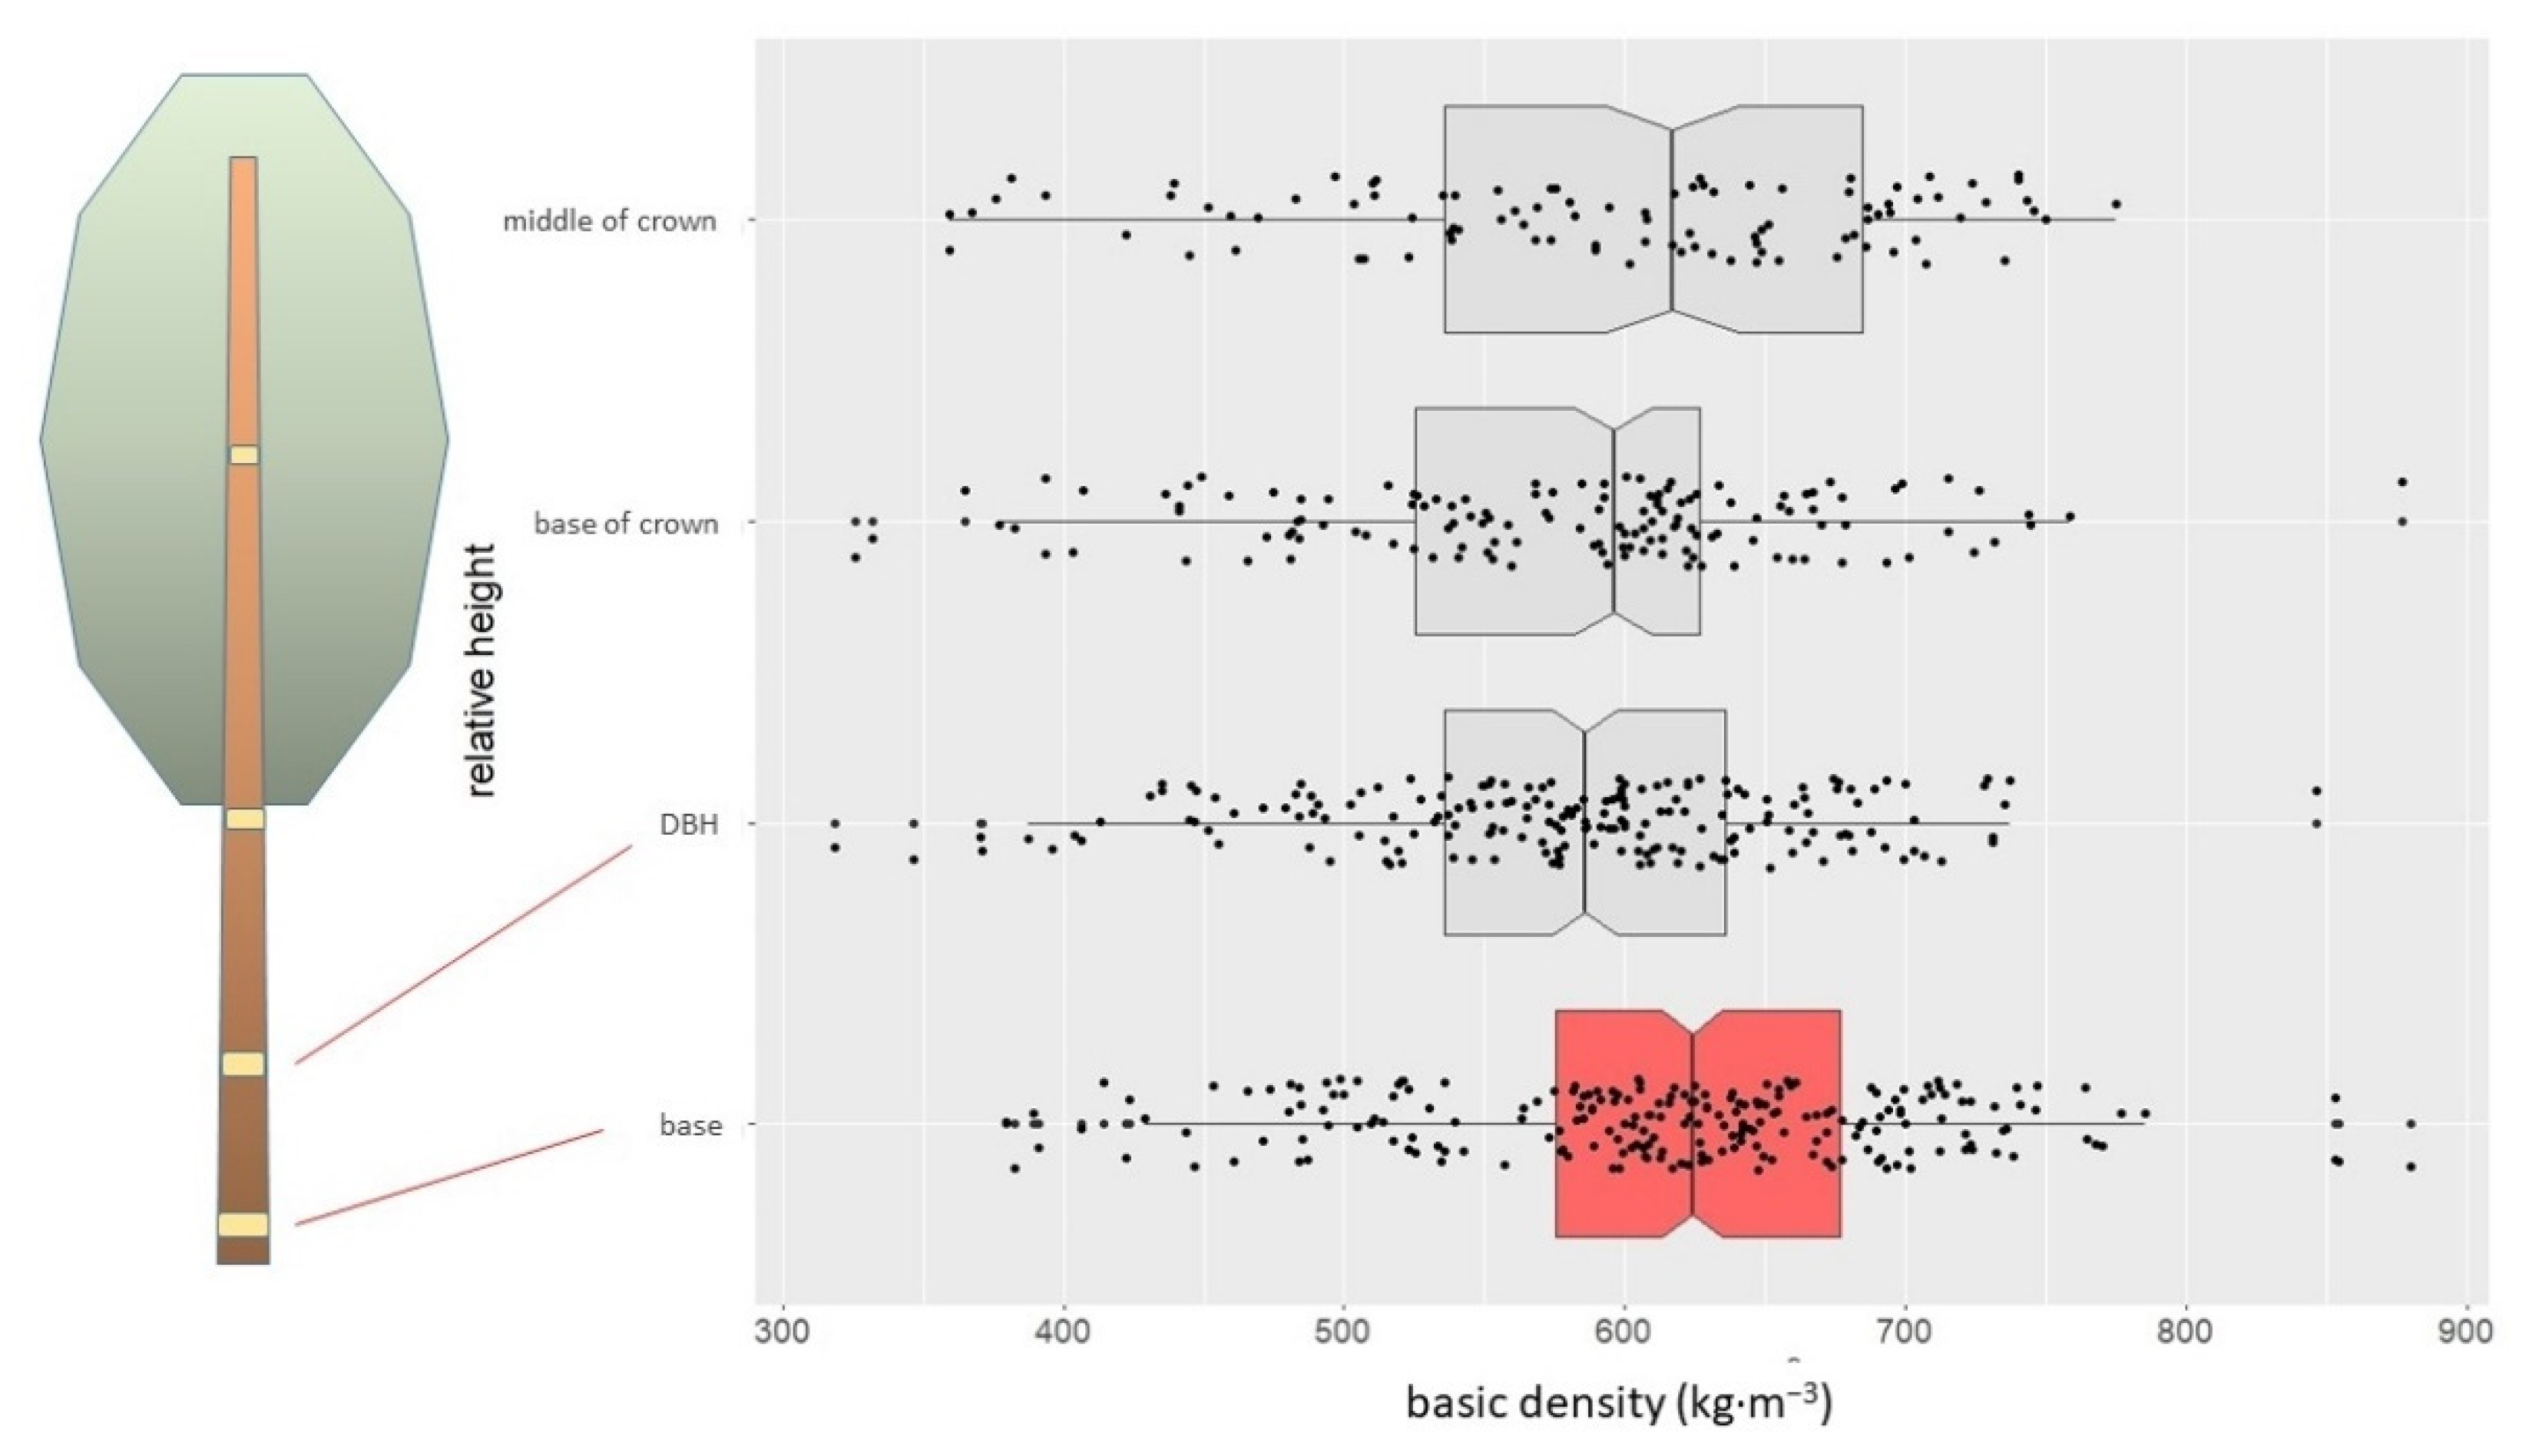
3.1. Wood Density of the Trunk

The mean BD value of the trunks was 595 kg·m−3 with a wide variation in range. The maximum value was 880 kg·m−3 while the minimum was only 318 kg·m−3. The mean FD was much higher, amounting to 1031 kg·m−3. The lower quartile (Q25) for the FD also had a high value (983 kg·m−3; Table 2). The difference between BD and FD oscillated around 40%. The average values for the branches were lower for both the BD at 573 kg·m−3 and the FD at 1007 kg·m−3 (Table 2). All of the differences between the trunk and branches were significant at a level of α = 0.05.
The radial allocation of the BD presented as typical distribution for ring-porous wood, where the wood density was higher close to the pith, decreasing towards the bark. In the central part of the stem, most samples had values above 600 kg·m−3. The median in the subsequent zones of trunk decreased in line with the cambial age, down to 500 kg·m−3 close to the bark (Figure 2a).
A similar pattern was apparent when the trunk was divided into heartwood and sapwood, with the mean value of the heartwood density being 624 kg·m−3, much higher than the sapwood density (538 kg·m−3). Sapwood represented a very narrow part of the cross-section but dominated in the uppermost discs. The broad width of the heartwood also resulted in higher values in most samples than in the sapwood, and not only the average value. The violin charts and boxplots showed that most samples were focused on the median in the heartwood rather than in the sapwood, which was more variable (Figure 2b). A comparison of wood densities in relation to compass directions (azimuth) showed no differences.
In the axial direction, the highest wood density occurred at the base of the trunk, where mean values equalled 632 kg·m−3 and, in most samples, exceeded the threshold of 600 kg·m−3. The lowest values were observed at 2 m high, the wood density increasing again at the top of the tree. However, the differences between the sample heights (except the basal level) were not significant (Figure 3). The boxes containing the values between Q25 and Q75 have a narrow range, with a tendency to expand at the top of the trunk. The rest of the sample population has a wide range.
The first hypothesis (H1) was confirmed by the results, supporting the model described in most publications. The decrease in wood density from pith to bark in ring-porous species was described a long time ago [41,51]; however, current research has suggested that this relationship is more complicated and depends on various factors. Bahmani et al. [44] reported a decrease in wood density for Persian oak, but only for small diameters (10–30 cm). For larger diameters, the relationship is not so clear. A decrease in density has been observed in European oak and is more obvious in the upper part of the trunk [31]. A greater difference between the central and outer parts of the trunk has been noted previously in classical silvicultural regimes more than in dynamic silvicultural regimes. Decreasing wood density with cambial age has also been observed in cork oak [35], the authors proving that wood density decreases from pith to bark most rapidly up to the 15th ring. The opposite correlation was found, surprisingly, during the testing of oven-dry wood density in Quercus. robur and Q. rubra [14]. The researchers also reported high variability in the wood density in the outermost part of the trunk. In a long-term series of annual rings taken from Q. petraea in France, a reduction in wood density was observed throughout the period of the study. In periods of both 50 and 100 years, the wood density decreased, while stability occurred only in small time intervals [33]. Decreasing wood density may be the result of the narrowing of annual rings. This has been a source of discussion among some scientists [47,51] who observed that narrowing rings correspond with cambial age. Lei et al. [51] also found an increase in vessel diameter with cambial age. The difficulty in determining how basic features affect wood density arises from the complicated relationships between wood elements such as vessels, fibres, wood rays, cell walls and various forms of parenchyma [52]. The correlation between the number of annual rings and wood density has not been clearly explained. In our tests, we found a very weak relationship among the tested wood samples (Figure 4), with correlation being negative, but not significant, and the slope of the lines being the result of the presence of a few very narrow rings in two of the trees.
Other authors have been sceptical about there being a clear connection between these two features and between the proportion of latewood and ring width. They have described these relationships as low intra-ring variability with slight differences between the densities of earlywood and latewood––known as the low ring heterogeneity index [35]. The correlation between ring width and mean density has also been recorded as being weak or insignificant in sessile oak in northern France, with the authors suggesting that early wood width varies between sample plots under the influence of various site conditions [33]. Some researchers have reported a unique point of view that involves species dependences. A very weak correlation between proportion of latewood and ring width has been observed in Q. rubra, but this occurs much more strongly in Q. robur [14]. The negative correlation between ring width and latewood density has been described by Mosedale et al. [48] for a clone of Q. robur and Q. petraea in Germany in a seed orchard.
A decrease in wood density with cambial age lowers the density of sapwood, as can be seen from our results (Figure 2b). A similar difference between heartwood and sapwood has been reported by Kiaei [42], in relation to oven-dry wood density in Q. castaneaefolia.
The second hypothesis (H2) was only partially confirmed in relation to the lower part of the trunk having higher wood density (Figure 3). We did not observe a decrease in wood density moving up the trunk; the data were variable. Probably the only part of the trunk that bears the most load reacts by increasing its density. King et al. [53], in studies on over 20 tropical species, indicated a strong correspondence between wood density and stem biomass, and a poor relationship between wood density and stem volume, which may suggest that the parts of the trunk carrying the most load may be denser.

3.2. Wood Density of the Branches

The wood density in the branches differed significantly in both the studied zones (A1 and A2). In zone A1 closest to the trunk, the branches had higher densities (both BD and FD) than those farther from the trunk (zone A2) (Figure 5). The differences were not great, but were distinct and significant. The average wood density for zone A1 equalled 595 (BD) and 1040 (FD) kg·m−3, and for zone A2, respectively, 551 (BD) and 974 (FD) kg·m−3. The violin displays had more focused values for BD and more scattered values for FD (Figure 5).
Wood density was much lower in the branches, and decreased with distance from the trunk (Figure 5), which may result from a biomechanical relationship in the tree. Yang et al. [54] studied competition in Liaodong oak, describing the reaction of biomass allocation to changes in the tree architecture depending on specific conditions. They found that the biomass was reduced in the branches rather than the stem when the diameter and length of the branches were reduced, but not their number.

3.3. Biometric Tree Relationships

A matrix heat map based on Spearman ranks highlighted a few interesting aspects, especially concerning the relationships between the crown parameters and wood density (Figure 6). Both densities, BD and FD, were related to length of crown (0.7 and 0.8), but only a weak correlation was observed between wood density and width of crown. Crown length was highly correlated with slenderness (0.8), which could be a key feature for explaining the growth under the canopy. Slenderness also showed a moderate correlation with wood density. The second element worth noting was the high correlation between width of crown and area of sapwood (0.8).
Heartwood area was highly related to DBH. The two parameters that showed the most relationships in the matrix table—DBH and wood density—did not correlate with each other. Likewise, the tree H did not correlate with wood density.
The correlation heat map resulting from the biometric features of the trees also provided some pointers to potential future work. There was a high correlation between heartwood area and DBH (Figure 6). A comparable correlation between heartwood width and stem diameter at DBH was described by Sousa et al. [47], who studied dependencies in Q. faginea. Heartwood width also depends on site conditions, as the authors emphasised [47]. Our results show a lack of correlation between wood density and DBH, which supports the findings of other authors, who have pointed out that the relationship between DBH and wood density in Q. robur is not clear [55]. Different results were provided by Kranjc et al. [3], who observed that pubescent oak diameter has a positive effect on wood density. In a specific study area, the competition between trees, potential gaps in the main pine forest and other relationships that exist in the living forest environment must be taken into account. Additionally, we calculated the slenderness of 80 trees (Figure 7) in order to compare that with a study carried out in the same region by Kaźmierczak et al. [56] (Table 3), who showed the variability in slenderness in oak growth in a basal overstory with full access to light. We obtained an average value of 0.81 for all the trees. All the oaks were grown in a mixed-aged forest, so calculations for 10-year intervals were not possible. Therefore, we present a histogram for the total area. Most trees had values below 1.0, with the slenderness being lower than reported by the abovementioned authors. It is likely that the shadow of the pine trees affected oak growth, causing lower values.

4. Conclusions

The basic wood density accounted for only 60% of the fresh wood density, so these two parameters represent two different scales. A visible decrease in density in the radial direction was observed. The central part of the trunk and heartwood had much higher density than the outer part and the sapwood. Both types of wood density (BD and FD) were also higher in the trunk than in the branches. The wood density of the branches differed between the two zones (i.e., closer to versus farther from the trunk), which could signal a mechanical relationship in the tree. The other biometric features of the tree elements correlated with different strength, with wood density showing a positive correlation with crown length, but not with crown width, which corresponds better with DBH. We found lower slenderness than the values reported by other authors in oaks planted without canopy. On one hand, low slenderness predicts better resistance to wind after removing the canopy, but on the other hand, the oaks had grown for many years in uncomfortable conditions, which may have caused problems, for example, related to health. These observations may be used to direct future research in a wider field.

Author Contributions

Conceptualisation and methodology, M.J. and M.D.; formal analysis, M.J.; writing—original draft preparation, M.J.; writing—review and editing, M.J. and M.D.; visualisation, M.J.; revising the manuscript M.D. and M.J. Both authors have read and agreed to the published version of the manuscript.

Funding

This research received no external funding.

Institutional Review Board Statement

Not applicable.

Informed Consent Statement

Not applicable.

Data Availability Statement

The study did not report any data.

Acknowledgments

The authors would like to thank the authorities of Jarocin Forest Inspectorate for their help with the experiment. The authors thank the three anonymous reviewers for commenting and improving the scientific quality of this paper.

Conflicts of Interest

The authors declare no conflict of interest.

References

  1. Hacke, U.G.; Sperry, J.S.; Pockman, W.T.; Davis, S.D.; McCulloh, K.A. Trends in wood density and structure are linked to prevention of xylem implosion by negative pressure. Oecologia 2001, 126, 457–461. [Google Scholar] [CrossRef]
  2. Hoffmann, W.A.; Marchin, R.M.; Abit, P.; Lau, O.L. Hydraulic failure and tree dieback are associated with high wood density in a temperate forest under extreme drought. Glob. Chang. Biol. 2011, 17, 2731–2742. [Google Scholar] [CrossRef]
  3. Krajnc, L.; Hafner, P.; Gričar, J. The effect of bedrock and species mixture on wood density and radial wood increment in pubescent oak and black pine. For. Ecol. Manag. 2021, 481, 118753. [Google Scholar] [CrossRef]
  4. Fries, A. Genetic parameters, genetic gain and correlated responses in growth, fibre dimensions and wood density in a Scots pine breeding population. Ann. For. Sci. 2012, 69, 783–794. [Google Scholar] [CrossRef]
  5. Nazari, N.; Bahmani, M.; Kahyani, S.; Humar, M.; Koch, G. Geographic Variations of the Wood Density and Fiber Dimensions of the Persian Oak Wood. Forests 2020, 11, 1003. [Google Scholar] [CrossRef]
  6. Jakubowski, M.; Tomczak, A.; Jelonek, T.; Grzywiński, W. Variations of wood properties of birch (betula pendula roth) from a 23-year old seed orchard. Wood Res. 2020, 65, 75–86. [Google Scholar] [CrossRef]
  7. Lachowicz, H.; Bieniasz, A.; Wojtan, R. Variability in the basic density of silver birch wood in Poland. Silva Fenn 2019, 53, 13. [Google Scholar] [CrossRef]
  8. Fearnside, P.M. Wood density for estimating forest biomass in Brazilian Amazonia. For. Ecol. Manag. 1997, 90, 59–87. [Google Scholar] [CrossRef]
  9. Baker, T.R.; Phillips, O.L.; Malhi, Y.; Almeida, S.; Arroyo, L.; Di Fiore, A.; Erwin, T.; Killeen, T.J.; Laurance, S.G.; Laurance, W.F.; et al. Variation in wood density determines spatial patterns in Amazonian forest biomass. Glob. Chang. Biol. 2004, 10, 545–562. [Google Scholar] [CrossRef]
  10. Nogueira, E.M.; Fearnside, P.M.; Nelson, B.W. Normalization of wood density in biomass estimates of Amazon forests. For. Ecol. Manag. 2008, 256, 990–996. [Google Scholar] [CrossRef]
  11. Liang, X.; Ye, Q.; Liu, H.; Brodribb, T.J. Wood density predicts mortality threshold for diverse trees. New Phytol. 2020, 229, 3053–3057. [Google Scholar]
  12. Pásztory, Z.; Börcsök, Z.; Ronyecz, I.; Mohácsi, K.; Molnár, S.; Kis, S. Oven dry density of sessile oak, turkey oak and hornbeam in different region of Mecsek Mountain. Wood Res. 2014, 59, 683–694. [Google Scholar]
  13. Inagaki, T.; Hartley, I.D.; Tsuchikawa, S.; Reid, M. Prediction of oven-dry density of wood by time-domain terahertz spectroscopy. Holzforschung 2014, 68, 61–68. [Google Scholar] [CrossRef]
  14. Zeidler, A.; Borůvka, V. Wood density of northern red oak and pedunculate oak grown in former brown coal mine in the Czech Republic. BioResources 2016, 11, 9373–9385. [Google Scholar] [CrossRef] [Green Version]
  15. Lundström, T.; Heiz, U.; Stoffel, M.; Stöckli, V. Fresh-wood bending: Linking the mechanical and growth properties of a Norway spruce stem. Tree Physiol. 2007, 27, 1229–1241. [Google Scholar] [CrossRef] [PubMed] [Green Version]
  16. Gryc, V.; Horáček, P. Variability in density of spruce (Picea abies [L.] Karst.) wood with the presence of reaction wood. J. For. Sci. 2007, 53, 129–137. [Google Scholar] [CrossRef] [Green Version]
  17. Gryc, V.; Vavrčik, H.; Horn, K. Density of juvenile and mature wood of selected coniferous species. J. For. Sci. 2011, 57, 123–130. [Google Scholar] [CrossRef] [Green Version]
  18. Niklas, K.J.; Spatz, H.C. Worldwide correlations of mechanical properties and green wood density. Am. J. Bot. 2010, 97, 1587–1594. [Google Scholar] [CrossRef]
  19. Goy, B.; Martin, P.; Leban, J.M. The measurement of wood density by microwave sensor. Holz als Roh-und Werkstoff. 1992, 50, 163–166. [Google Scholar] [CrossRef]
  20. Rinn, F.; Schweingruber, F.H.; Schär, E. Resistograph and x-ray density charts of wood. Comparative evaluation of drill-resistance profiles and x-ray density charts of different wood species. Holzforschung 1996, 50, 303–311. [Google Scholar] [CrossRef]
  21. Macedo, A.; Vaz, C.M.P.; Pereira, J.C.D.; Naime, J.M.; Cruvinel, P.E.; Crestana, S. Wood density determination by X-and gamma-ray tomography. Holzforschung 2002, 56, 535–540. [Google Scholar] [CrossRef]
  22. Gwaze, D.; Stevenson, A. Genetic variation of wood density and its relationship with drill resistance in shortleaf pine. South. J. Appl. For. 2008, 32, 130–133. [Google Scholar] [CrossRef] [Green Version]
  23. Chen, Z.Q.; Karlsson, B.; Lundqvist, S.O.; Gil, M.R.G.; Olsson, L.; Wu, H.X. Estimating solid wood properties using Pilodyn and acoustic velocity on standing trees of Norway spruce. Ann. For. Sci. 2015, 72, 499–508. [Google Scholar] [CrossRef] [Green Version]
  24. Gao, S.; Wang, X.; Brashaw, B.K.; Ross, R.J.; Wang, L. Rapid assessment of wood density of standing tre with nondestructive methods—A review. In Proceedings of the 2012 International Conference on Biobase Material Science and Engineering, Changsha, China, 21–23 October 2012; pp. 262–267. [Google Scholar] [CrossRef]
  25. Gao, S.; Wang, X.; Wiemann, M.C.; Brashaw, B.K.; Ross, R.J.; Wang, L. A critical analysis of methods for rapid and nondestructive determination of wood density in standing trees. Ann. For. Sci. 2017, 74, 27. [Google Scholar] [CrossRef] [Green Version]
  26. Mannes, D.; Lehmann, E.; Cherubini, P.; Niemz, P. Neutron imaging versus standard X-ray densitometry as method to measure tree-ring wood density. Trees 2007, 21, 605–612. [Google Scholar] [CrossRef] [Green Version]
  27. Jacquin, P.; Longuetaud, F.; Leban, J.M.; Mothe, F. X-ray microdensitometry of wood: A review of existing principles and devices. Dendrochronologia 2017, 42, 42–50. [Google Scholar] [CrossRef]
  28. Schönfelder, O.; Zeidler, A.; Borůvka, V.; Bílek, L.; Vítámvás, J. Effect of Shelterwood and Clear-Cutting Regeneration Method on Wood Density of Scots Pine. Forests 2020, 11, 868. [Google Scholar] [CrossRef]
  29. Larjavaara, M.; Muller-Landau, H.C. Still rethinking the value of high wood density. Am. J. Bot. 2012, 99, 165–168. [Google Scholar] [CrossRef] [Green Version]
  30. Williamson, G.B.; Wiemann, M.C. Measuring wood specific gravity… correctly. Am. J. Bot. 2010, 97, 519–524. [Google Scholar] [CrossRef] [Green Version]
  31. Zhang, S.Y.; Owoundi, R.E.; Nepveu, G.; Mothe, F.; Dhote, J.F. Modelling wood density in European Oak (Quercus petraea and Quercus robur) and simulating the silvicultural influence. Can. J. For. Res. 1993, 23, 2587–2593. [Google Scholar] [CrossRef]
  32. Degron, R.; Nepveu, G. Methodology of microdensitometric measurement for oak wood (Quercus robur L. and Quercus petraea Liebl): Proposal for a representative sampling of oak wood density within ring. Holzforschung 1996, 50, 491–496. [Google Scholar] [CrossRef]
  33. Bergès, L.; Dupouey, J.L.; Franc, A. Long-term changes in wood density and radial growth of Quercus petraea Liebl. in northern France since the middle of the nineteenth century. Trees 2000, 14, 398–408. [Google Scholar] [CrossRef]
  34. Fromm, J.H.; Sautter, I.; Matthies, D.; Kremer, J.; Schumacher, P.; Ganter, C. Xylem water content and wood density in spruce and oak trees detected by high-resolution computed tomography. Plant. Physiol. 2001, 127, 416–425. [Google Scholar] [CrossRef]
  35. Knapic, S.; Louzada, J.L.; Leal, S.; Pereira, H. Radial variation of wood density components and ring width in cork oak trees. Ann. For. Sci. 2007, 64, 211–218. [Google Scholar] [CrossRef] [Green Version]
  36. Genet, A.; Auty, D.; Achim, A.; Bernier, M.; Pothier, D.; Cogliastro, A. Consequences of faster growth for wood density in northern red oak (Quercus rubra Liebl.). Forestry 2013, 86, 99–110. [Google Scholar] [CrossRef] [Green Version]
  37. Sousa, V.B.; Louzada, J.L.; Pereira, H. Variation of ring width and wood density in two unmanaged stands of the Mediterranean Oak Quercus faginea. Forests 2018, 9, 44. [Google Scholar] [CrossRef] [Green Version]
  38. Humar, M.; Fabčič, B.; Zupančič, M.; Pohleven, F.; Oven, P. Influence of xylem growth ring width and wood density on durability of oak heartwood. Int. Biodeterior. Biodegrad. 2008, 62, 368–371. [Google Scholar] [CrossRef]
  39. Ackermann, F. Influence du type de station forestière sur les composantes intracernes de la densité du bois du chêne pédonculé (Quercus robur L) dans les chênaies de l’Adour et des coteaux basco-béarnais. In Annales Des Sciences Forestières; EDP Sciences: Les Ulis, France, 1995; Volume 52, pp. 635–652. [Google Scholar]
  40. Degron, R.; Nepveu, G. Prévision de la variabilité intra-et interarbre de la densité du bois de chêne rouvre (Quercus petraea Liebl) par modélisation des largeurs et des densités des bois initial et final en fonction de l’âge cambial, de la largeur de cerne et du niveau dans l’arbre. In Annales Des Sciences Forestières; EDP Sciences: Les Ulis, France, 1996; Volume 53, pp. 1019–1030. [Google Scholar]
  41. Kollmann, F.F.P.; Côté, W.A. Principles of Wood Science and Technology I Solid Wood; Springer: Berlin/Heidelberg, Germany; New York, NY, USA, 1968; p. 592. [Google Scholar]
  42. Kiaei, M. Wood density of naturally growing oak trees in north Iran. Res. Crop. 2012, 13, 776–777. [Google Scholar]
  43. Tomczak, A.; Jelonek, T.; Jakubowski, M. Changes in the structure and properties of wood as an effect of the impact of wind on trees. Sylwan 2012, 156, 776–783. [Google Scholar]
  44. Bahmani, M.; Saeedi, S.; Humar, M.; Kool, F.; Zabol, I. Effect of tree diameter classes on the properties of Persian oak (Quercus brantii Lindl.) wood. Wood Res. Slovak 2018, 63, 755–762. [Google Scholar]
  45. Guilley, E.; Hervé, J.C.; Nepveu, G. The influence of site quality, silviculture and region on wood density mixed model in Quercus petraea Liebl. For. Ecol. Manag. 2004, 189, 111–121. [Google Scholar] [CrossRef]
  46. Bergès, L.; Nepveu, G.; Franc, A. Effects of ecological factors on radial growth and wood density components of sessile oak (Quercus petraea Liebl.) in Northern France. For. Ecol. Manag. 2008, 255, 567–579. [Google Scholar] [CrossRef]
  47. Sousa, V.B.; Cardoso, S.; Pereira, H. Ring width variation and heartwood development in Quercus faginea. Wood Fiber Sci. 2013, 45, 405–414. [Google Scholar]
  48. Mosedale, J.R.; Charrier, B.; Janin, G. Genetic control of wood colour, density and heartwood ellagitannin concentration in European oak (Quercus petraea and Q. robur). For. Int. J. For. Res. 1996, 69, 111–124. [Google Scholar] [CrossRef] [Green Version]
  49. Kelly, D.L. The regeneration of Quercus petraea (sessile oak) in southwest Ireland: A 25-year experimental study. For. Ecol. Manag. 2002, 166, 207–226. [Google Scholar] [CrossRef]
  50. Olesen, P.O. Water displacement method; a fast and accurate method of determining the green volume of wood samples. For. Tree Improv. 1971, 3, 3–23. [Google Scholar]
  51. Lei, H.; Milota, M.R.; Gartner, B.L. Between-and within-tree variation in the anatomy and specific gravity of wood in Oregon white oak (Quercus garryana Dougl.). IAWA J. 1996, 17, 445–461. [Google Scholar] [CrossRef]
  52. Zheng, J.; Martínez-Cabrera, H.I. Wood anatomical correlates with theoretical conductivity and wood density across China: Evolutionary evidence of the functional differentiation of axial and radial parenchyma. Ann. Bot. 2013, 112, 927–935. [Google Scholar] [CrossRef] [PubMed] [Green Version]
  53. King, D.A.; Davies, S.J.; Tan, S.; Noor, N.S.M. The role of wood density and stem support costs in the growth and mortality of tropical trees. J. Ecol. 2006, 94, 670–680. [Google Scholar] [CrossRef]
  54. Yang, X.Z.; Zhang, W.H.; He, Q.Y. Effects of intraspecific competition on growth, architecture and biomass allocation of Quercus liaotungensis. J. Plant. Interact. 2019, 14, 284–294. [Google Scholar] [CrossRef] [Green Version]
  55. Alfaro-Sánchez, R.; Valdés-Correcher, E.; Espelta, J.M.; Hampe, A.; Bert, D. How do social status and tree architecture influence radial growth, wood density and drought response in spontaneously established oak forests? Ann. For. Sci. 2020, 77, 1–17. [Google Scholar] [CrossRef]
  56. Kaźmierczak, K.; Pazdrowski, W.; Mańka, K.; Szymański, M.; Nawrot, M. Forming slendernes of pedunculate oak stems (Quercus robur L.) in dependence of age of trees. Sylwan 2008, 7, 39–45. [Google Scholar]
Figure 1. Schematic visualisation of the process of crown measurement and wood sampling.
Forests 12 00712 g001
Figure 2. Variations in basic density with different distances from the pith (a) and between the heartwood and sapwood (b).
Forests 12 00712 g002
Figure 3. Basic density at different levels of height of the tree.
Forests 12 00712 g003
Figure 4. Correlation between number of rings per centimetre and basic trunk density.
Forests 12 00712 g004
Figure 5. Comparison between the basic density (BD) and fresh density (FD) of branches at different distances from the trunk (zones A1 and A2).
Forests 12 00712 g005
Figure 6. Correlation matrix based on Spearman’s ranks. DB—basic density, FD—fresh density, Crown_L—length of crown, Crown_W—width of crown, Sapwood—area of sapwood, Heartwood—area of heartwood, DBH—diameter at breast height, S—slenderness.
Forests 12 00712 g006
Figure 7. Distribution of slenderness in oaks grown under a canopy of Scots pine. The trees represent a forest aged between 60 and 80 years.
Forests 12 00712 g007
Table 1. Biometric features of selected trees.
Tree FeaturesMean ± SD
DBH (cm)17.8 ± 3.9
Tree height (m)13.6 ± 2.7
Heartwood area at DBH (cm2)163 ± 86
Sapwood area at DBH (cm2)48 ± 26
Crown width (m)5.8 ± 2.1
Crown length (m)9.6 ± 2.9
Number of rings in basal disc 65 ± 12
Table 2. Comparison of basic density and fresh density in trunk and branch samples.
Location Density Category MeanQ25 Median Q75SDCV (%)MaxMin
trunk (samples)basic (kg·m−3)5955376056559315.6880318
trunk (discs)fresh (kg·m−3)103198310321091 757.21183885
branches (discs)basic (kg·m−3)5735245586106811.9754433
branches (discs)fresh (kg·m−3)10079591011108110910.81247660
Table 3. Slenderness values of oak in consecutive years of trees after Kaźmierczak et al. [56].
Age (y)30405060708090100110120130140
Mean1.091.071.020.970.930.890.850.830.760.720.750.76
Min.0.500.560.590.540.530.570.60.600.610.590.580.61
Max.1.601.591.491.251.231.181.091.071.000.960.920.93
Publisher’s Note: MDPI stays neutral with regard to jurisdictional claims in published maps and institutional affiliations.

