Article

Comparative Dynamics of Above-Ground Litter Production and Decomposition from Eucalyptus grandis Hill ex Maiden and Pinus taeda L., and Their Contribution to Soil Organic Carbon

by
Andrés Baietto
1,*,
Jorge Hernández
2 and
Amabelia del Pino
2
1
Department of Forest Production and Wood Technology, Faculty of Agronomy, University of the Republic, Garzón 780, Montevideo P.O. Box 12900, Uruguay
2
Soil and Water Department, Faculty of Agronomy, University of the Republic, Garzón 780, Montevideo P.O. Box 12900, Uruguay
*
Author to whom correspondence should be addressed.
Forests 2021, 12(3), 349; https://doi.org/10.3390/f12030349
Submission received: 16 January 2021 / Revised: 5 March 2021 / Accepted: 14 March 2021 / Published: 16 March 2021
(This article belongs to the Special Issue Forest Litter Decomposition: An Integrative Approach)

Abstract

:
The replacement of native pasture by exotic commercial forest species is an infrequent situation worldwide. In these systems, a new component is introduced, forest litter, which constitutes one of the main ways of incorporating carbon into the soil–plant system. The present work seeks to establish a methodological approach to study the dynamics of litter production and decomposition in an integrated way. The general objective was to characterize and compare the litter production dynamics in 14-year-old Eucalyptus grandis Hill ex Maiden and Pinus taeda L. commercial plantations. During two years, seasonal evaluations of fall, decomposition and accumulation of litter were carried out in stands of both species. In turn, the contribution of carbon from forest species to the soil through isotopic analysis techniques was quantified. Litterfall in E. grandis showed maximums during the spring of the first year and in the spring and summer of the second. In P. taeda, the maximums occurred in summer of the first year and in autumn of the second. In relation to the decomposition rate, the results based on short periods of evaluation between 15 and 21 months did not show differences between species, nor for the different moments of beginning of the evaluation, obtaining average values of 0.0369 month−1 for E. grandis and 0.0357 month−1 for P. taeda. In turn, both the decomposition rate of the material as a whole and the estimates of accumulated biomass in equilibrium state did not show significant differences between the species. Additionally, there was a relevant incorporation of carbon into the soil by forest species, fundamentally in the first few centimeters, substituting an important proportion of the carbon inherited by the original cover of native pastures. Finally, it is necessary to specify that the scope of the findings obtained is greatly limited by the sample size used in this study.

1. Introduction

Above-ground forest litter constitutes an organic horizon that originates from the deposition and accumulation of forest plant material on the mineral soil surface [1]. The formation of this horizon depends mostly on the balance between the rate of litterfall and the decomposition rate of the accumulated material [2]. The accumulation of litter can be represented by exponential rise to maximum models, which allow the amount of material deposited at equilibrium state and a decomposition constant to be estimated [3].
The fall of litter usually presents a seasonal deposition behavior [4,5,6], being able to exhibit particularities according to the forest species considered [4,7,8,9]. In addition, the intrinsic characteristics of the plantation, such as the basal area, canopy closure, stand age, volume, above-ground biomass and mean annual increase [10], and the environmental conditions of the site [5,9] may influence litterfall.
On the other hand, the decomposition rate of the litter is dependent on its chemical composition [11,12], physical characteristics [13], previous degradation [14], and climatic conditions [15,16]. Likewise, the rate with which the litter is degraded tends to be variable among forest species [17,18,19]. The decomposition process of the litter can be explained by adjusting exponential decay models that allow a decomposition constant to be determined, the magnitude of which indicates the rate with which the remaining material decomposes [3].
Forest production systems have been identified as one of the highest terrestrial sinks of atmospheric CO2, with litter being an important carbon (C) reservoir [20] and, in turn, constituting a pathway for C entry into the soil [21] with an effect not only in the first few centimeters, but also in greater depths through the root decay and the migration of its decomposition products [22]. The introduction of forest plantations in sites originally occupied by native pastures implies a change in coverage characterized by the incorporation of forest litter as a new component of the soil–plant system, which would maintain the ecosystem benefits of sequestration and incorporation of organic C into the soil, as in natural forests [2]. The use of isotopic analysis techniques, based on the study of the natural abundance of 13C among native pasture and forest species, has made it possible to assess this process, enabling quantification of the real contribution of forest cover to soil organic carbon (SOC) [22,23].
Most of the previous studies related to this topic are usually focused on the determination of the production and decomposition of the litter independently, not having a comprehensive approach that represents its formation dynamics [14,24,25,26,27]. In response to this problem, the present work seeks to establish a methodological approach that allows study of the fall, decomposition and accumulation of litter between species at the same time. In this sense, the general objective of this study was to characterize and compare the above-ground litter production dynamics of 14-year-old Eucalyptus grandis Hill ex Maiden and Pinus taeda L. commercial plantations.
The hypotheses of this research were the following: (i) the seasonality of litterfall of E. grandis differs from that of P. taeda due differential biological responses to the climatic conditions of the site; (ii) litter decomposition rate varies between the studied species as well as for the evaluation starting moment; (iii) the biomass and C accumulated in the litter differ according to the considered species; (iv) the estimated decomposition rate and the amount of biomass accumulated at the steady state condition vary between species and; (v) the forest plantations make a relevant contribution to the SOC that is different between species.
The objectives of this work were: (i) quantify and compare the seasonal rate of litterfall in two commercial forest species: E. grandis and P. taeda and determine the existence of relationships between litterfall and different climatic variables in the temperate region; (ii) quantify and compare the decay rate of the litter and the remaining content of biomass and C by species after two years of decomposition; (iii) determine and contrast the biomass and C stock accumulated in the litter at the final of the study; (iv) estimate and compare the decomposition rate and the amount of biomass accumulated at the steady state condition between species and; (v) characterize the contribution of organic C to the soil as a result of the forest species introduction.

2. Materials and Methods

2.1. Characteristics of the Experimental Site

The study was carried out in the Department of Rivera, Uruguay (coordinates: 31°23′55.11″ S and 55°41′43.88″ W). At this site, in the year 2003 two first turn forest experiments were installed, one with E. grandis and the other with P. taeda, substituting the original vegetation of native pastures. In both, three treatments of planting densities (816, 1111 and 2066 trees ha−1) were arranged in a randomized complete block design with three replications. For the purposes of this study, the plots of E. grandis and P. taeda with 816 trees ha−1 were evaluated (three for each species), since they constituted the closest situation to plantations for quality wood production. At the beginning of the study (June 2017), the plantations were 14 years old.
The climate in the area is temperate, with an average annual temperature of 18.6 °C, an average of 12.4 °C in the coldest month (July) and 24.6 °C in the warmest month (January), and average annual rainfall of 1605 mm, with a main maximum in autumn and a secondary in spring, a main minimum in winter and a secondary minimum in summer, although with high interannual variation [28].
The original vegetation of the site consisted of native pastures, dominated mainly by perennial summer grasses of the photosynthetic cycle C4 (Axonopus spp., Schizachyrium spp., Paspalum spp., Chloris spp., Andropogon spp., Eragrostis spp. and Aristida spp.) and by some winter grasses (Briza spp. and Piptochaetium spp.) [22].
The experiment was installed on a thermic Humic Hapludult [29] from the Tres Cerros cartographic unit [30]. Table 1 includes the characterization of the soil under E. grandis and P. taeda as the average of nine profiles surveyed at the experimental site [22].

2.2. Litterfall, Decomposition and Accumulation Assessment

The study began in June 2017 (winter in the southern hemisphere). In each plot, a homogeneous area of 4 m long by 2 m wide (subplot) was located between two tree rows, where the canopy was totally closed and the present trees around this area had a height and diameter at breast height (DBH) representative of the average of the plantation (Table 2). The subplots were arranged equidistant from the tree rows.
In this area, the floor litter (O horizon) was carefully removed, revealing the mineral soil surface. Then, eight quadrants of 1 m2 each were marked, in which vertices wooden stakes were placed and fenced with 1 m high plastic mesh-shade fabric, constituting a subplot. The objective of this structure was to collect the litter that was shed from the trees in each season of the year, while studying and comparing its decomposition among the species under study. With this aim in the installation of the experiment, in each of the eight quadrants, a layer of 1 m2 of plastic mesh fabric (1 mm2 opening) was placed on the ground, in order to collect the falling material, allowing the passage of air and water.
On the first date of seasonal sampling (three months after installation), one of the eight quadrants was randomly removed with the material dropped during the season. In the remaining quadrants, the fallen material was not removed, but a layer of 1 m2 of the same mesh fabric used on the first date was placed again, in order to collect separately the fallen material corresponding to the next three-month period. At the end of the second three-month period, one of the remaining seven quadrants was randomly removed, separately collecting the material that had fallen during the first and second three-month period. The procedure was continued during the following periods, so that, at the end of each one of them, the existing material in the randomly selected sampling quadrant was removed, and meshes were placed in the remaining ones in order to separate the litter that had fallen in the season sampled from the material fell on the next one, and so on during two years.
The litter collected in each three-month period for the different separated layers was dried in an oven with air forcing at 65 °C until constant weight to determine its total dry weight and was stored for subsequent chemical analysis. In the sample, only the fractions of leaves/needles, bark and branches smaller than 5 mm in diameter were considered, given the randomness in the detachment of larger branches.
With the dry weight recorded at the time of the formation of each layer and the value obtained from its replications collected at each sampling period, the remaining dry weight proportion was calculated as follows:
D t   =   W t W i
where Dt is the remaining dry weight proportion for a particular layer and sampling moment; Wi the dry weight of the layer at the time of its formation and; Wt the dry weight of each replication collected at the remaining sampling periods. This allowed us to separate eight layers in different states of decomposition, including a range from fresh material dropped during the sampling season to litter exposed to 21 months of decomposition. In turn, the determination of the upper layer dry weight at each sampling moment allowed us to evaluate the litterfall at the same time, as well as the above-ground litter accumulation at the last sampling quadrant for each subplot.
During the execution of the evaluation, the relative humidity (%) and temperature (°C) were monitored. Rainfall data was recorded from an automatic meteorological station near the study site (coordinates: 31°42′32″ S and 55°49′36″ W). From this information, the accumulated monthly precipitation (mm); mean temperature (°C); mean relative humidity (%) and; a vapor pressure deficit (KPa), were determined (Figure 1 and Figure 2).
Additionally, the following climatic variables were calculated at the seasonal level: mean accumulated precipitation (mm) (AP), mean temperature (°C) (MT), mean minimum temperature (°C) (MMINT), mean maximum temperature (°C) (MMAXT), mean relative humidity (%) (MRH), mean minimum relative humidity (%) (MMINRH), mean maximum relative humidity (%) (MMAXRH), and mean vapor pressure deficit (KPa) (MVPD).
To evaluate the changes that occurred during the study in the surface layer of the soil in the C concentration and SOC stock, as well as its natural abundance of 13C, and contribution of tree species to the soil young C, composite samples (20 subsamples) were taken stratified at 0–3, 3–6, 6–9, 9–12 and 12–20 cm deep in each subplot. Sampling was carried out at the beginning (year 2017) and at the end of the experiment (year 2019) in the quadrant that was previously randomly assigned as the last one to be sampled. This had the aim to evaluate the effects of the accumulated litter on the variable.

2.3. Chemical Analyses

The dried litter samples were ground to a particle size <0.5 mm. Subsequently, the N content was determined by a Kjeldahl distillation, after mineralization with H2SO4 at 350 °C and a mixture of catalysts (CuSO4 and K2SO4) for 90 min. The determination of lignin was carried out by acid hydrolysis [31]. In the case of soluble polyphenols content, an extraction with H2O was carried out for 2 h at 100 °C and determination by colorimetry using Folin–Ciocalteu reagent [32]. The soluble C content was determined in the same extract by oxidation with K2Cr2O7 and H2SO4 at 150 °C and subsequent colorimetry. In turn, the litter samples were ground to a particle size <0.149 mm, determining their C content and 13C/12C isotopic ratio by using an elemental analyzer coupled to an INTEGRA-2 brand mass spectrometer [33].
The soil samples were dried at 40 °C and ground to a particle size <0.149 mm for the determination of total SOC and the 13C/12C ratio as previously described. The data corresponding to the bulk density of the soil, as well as the concentration of C and the 13C/12C ratio of the soil under native pastures, were obtained from works previously carried out at the same study site in three neighboring plots [22] due to the fact that this vegetation was considered as a system in steady state condition.

2.4. Calculation of δ13C in Soil and Litter

From the 13C/12C ratios of the soil and litter samples analyzed, the δ13C was determined using the following equation [34]:
δ 13 C   ( )   =   [ ( 13 C / 12 C ) m ( 13 C / 12 C ) r   1 ] × 1000
where 13C/12Cm is the isotopic ratio for the analyzed sample and 13C/12Cr is the isotopic ratio of the reference standard (Pee Dee Belemnite). In the samples taken at the beginning and at the end of the study, the determination of the SOC contribution by the forest component with respect to the initial condition of native pastures was calculated as follows [22]:
α   ( % )   = [ ( δ     δ 0 ) ( δ 1     δ 0 ) ] × 100
where α (%) is the proportion of young C; δ is the δ13C of the soil SOC at t = 1; δ0 is the δ13C of the SOC at t = 0 and; δ1 is the δ13C of the residues of the new vegetation. In this study two α (%) values were calculated: α (2017) (%) and α (2019) (%). The first of them corresponded to the proportion of young C that was incorporated by each forest species since the year 2003 until the first year of evaluation (2017), where: δ (2017) was the δ13C of the SOC under each forest species (E. grandis or P. taeda) at the beginning of the study (year 2017), δ0 the δ13C of the SOC under neighboring native pastures, and δ1 the δ13C of the forest litter of each species (E. grandis or P. taeda). On the other hand, the second value corresponded to the proportion of young C that was incorporated by each forest species since 2003 until the second year of evaluation (2019), where: δ (2019) was the δ13C of the SOC under each forest species (E. grandis or P. taeda) at the end of the study (2019), δ0 the δ13C of the SOC under neighboring native pastures, and δ1 the δ13C of the forest litter of each species (E. grandis or P. taeda). The δ13C of the residues of the new vegetation corresponded to the values obtained from the accumulated litter during the two years of evaluation in the last sampled quadrant (−29.99‰ in E. grandis and −29.36‰ in P. taeda). Additionally, the contribution of young C from both species during the two years of evaluation was determined as the difference between the contribution made until the end of the present study (α (2019)) and that evidenced until the beginning (α (2017)). Finally, with the proportion of young C obtained in each case for the considered soil depths, the equivalent amount (Mg ha−1) was calculated based on the C stock of each soil layer.

2.5. Statistical Analysis

The dry weight of seasonally deposited material of each species was analyzed by adjusting a linear mixed model in which the factors year and season nested in year were considered to have a fixed effect, and the subplot a random effect, since the weight determinations in each subplot constituted repeated measures in time. The statistical model used was the following:
Y ijk   =   μ   +   α i   +   β j   +   Z k   +   ε ijk
where Yijk is the litterfall biomass; µ the general mean; αi the fixed effect of year; βj the fixed effect of season nested in year; Zk the random effect of subplot, and εijk the experimental error. The variance structure was modeled by varIdent function. These analyses were performed with R (version 4.0.2, R Foundation for Statistical Computing, Vienna, Austria).
Since the climatic variables did not follow a normal distribution, the relationships between the seasonal climatic variables (AP, MT, MMINT, MMAXT, MRH, MMINRH, MMAXRH and MVPD) and the dry weight of litter collected each season were examined by a correlation analysis, using the Spearman correlation coefficient. The comparison of the dry weight of litter per year, by species, was carried out using paired t-tests. The comparison between species of the material deposited annually was carried out by t-tests for independent samples.
For the successive sampling dates and layers considered, the determination of the amount of biomass remaining in litter was based on the decomposition rate for the period. The decomposition rate for each species and layer of litter was estimated through the adjustment of an exponential decay model [3]:
X   =   X 0   e kt
where X is the proportion of residual litter at time t in months, X0 is the proportion of initial litter estimated by the model, and k the decomposition constant. The comparison of the adjusted models was carried out by means of the Extra Sum of Squares analysis with dummy variables [35] executed with SAS Studio (version 3.3, SAS Institute, Cary, NC, USA) through the NLIN procedure [36], and subsequent contrast of the k parameter between the evaluated species and for the different layers of litter separated by t-tests considering significant a p < 0.05. Only the litter layers in which the adjustment was statically significant were considered, which was achieved in three of them, where the number of observations was sufficient, corresponding to different times of the beginning of the evaluation, C1 (winter year 1), C2 (spring year 1) and C3 (summer year 1). For the discussion of the biological adequacy of the models, based on the criterion that the proportion of the initial mass should be equal to 1 [37], the comparison of the initial proportion estimated by the models with respect to this value was carried out by one-tailed t-tests.
In relation to the biomass accumulation in the litter during the study period for each species in the last sampled quadrant, a variable equivalent to the net balance between the decomposition rate and the litter incorporation, the adjusted model was [3]:
y   =   y ss   ( 1     e kt )
where y is the amount of litter (Mg ha−1) at time t in months, yss is the estimated amount of material accumulated in equilibrium state (Mg ha−1), and k is a decomposition constant (month−1), which magnitude indicates the rate at which litter decomposes. The adjustment of the models, their comparison and subsequent contrast of the yss and k parameters were performed using the same procedure described for the decomposition models.
The concentration of C, N, lignin, soluble polyphenols and soluble C, as well as the amount of initial biomass of the litter, the C:N ratio and Lignin:N (L:N), for each species individually, were analyzed by analysis of variance with subsequent Fisher’s least significant difference (LSD) multiple comparison test. The differences between species in the concentration and stock of C, δ13C and accumulated litter biomass were evaluated by t-tests for independent samples. For the comparisons of the concentration and stock of C in the litter layers analyzed at the beginning in relation to the end of the study, for each species and layer, paired t-tests were performed individually.
The comparison of the concentration and stock of C and δ13C in the soil at the beginning with respect to the end of the study, under each forest species individually, was carried out with paired t-tests. The differences in concentration and stock of C and δ13C in the soil between the vegetation covers considered were analyzed using t-tests for independent samples, as well as for the comparison between forest species regarding the contribution of young C to the soil (α). In all cases, a p < 0.05 was considered significant and the assumptions of normality and homogeneity of variances were verified. On the other hand, given that the climatic variables did not follow a normal distribution, the existing association between them and the proportion of remaining biomass was evaluated by means of a Spearman correlation analysis.
The analysis of variance performed, the paired t-tests, the t-tests for independent samples, the post-hoc tests as well as the correlation analyzes were performed using Infostat (version 2020; Grupo InfoStat, Cordoba, Argentina).

3. Results

3.1. Litter Production

The results of average fallen litter dry weight in E. grandis showed a significant differential effect (p < 0.0001) of the evaluation season in both analyzed years (Figure 3). A seasonal pattern of deposition in the first year was characterized by the occurrence of a main maximum in spring (40%), a secondary maximum in the summer season (34%), an intermediate value during winter (20%), and an absolute minimum in autumn (6%). During the second year, the variable showed a similar seasonality, although with some variations, with a main fall maximum in spring (38%) and summer (33%), and a minimum in autumn (15%) and winter (14%). On the other hand, in global terms, the total dry weight of material dropped from E. grandis during the first year of study (9.52 Mg ha−1) was not significantly different from the second (9.34 Mg ha−1) (p = 0.6941).
In P. taeda (Figure 4) the litter shedding showed significant differences according to the season in both analyzed years (p < 0.0001). In the first year, an absolute maximum occurred in summer that represented 47% of the total material fallen in the period, intermediate levels during spring (22%) and winter (20%) and an absolute minimum in autumn (11%). In the second year, a main maximum was recorded during autumn, reaching 44% of the total litter deposited, a secondary maximum in the summer (34%), a main minimum in spring (5%) and a secondary minimum during winter (17%). Regarding the total amount of litter produced per year, it was significantly higher during the first year (10.94 Mg ha−1) in relation to the second (7.35 Mg ha−1) (p = 0.0042).
The results of the comparison of the amount of material produced between species per year of evaluation, marked greater deposition of litter during the first year of study by P. taeda (10.94 Mg ha−1) compared to E. grandis (9.52 Mg ha−1) (p = 0.0258), the opposite occurring in the second, reaching 9.34 Mg ha−1 in E. grandis and 7.35 Mg ha−1 in P. taeda (p = 0.0412).
Regarding the relationship between seasonal litter production and climatic conditions during the study period, significant correlations were observed in both species (Table 3). The total dry weight of litter of E. grandis deposited seasonally evidenced direct and significant relationships for MT, MMINT and MVPD. In turn, inverse and significant relationships were obtained for the variables MRH, MMINRH and MMAXRH. On the other hand, both MMAXT and AP did not show a clear link with the dry weight of litter.
In the case of P. taeda, litter production showed an inverse, high and significant relationship with AP. In turn, it showed a high direct and significant correlation with MT and MMAXT. On the other hand, it presented a trend of the same nature with respect to the MVPD. In the case of climatic variables related to relative humidity, there were no clear relationships between them and litter production, although there was a certain trend towards an inverse relationship with the MMINRH.

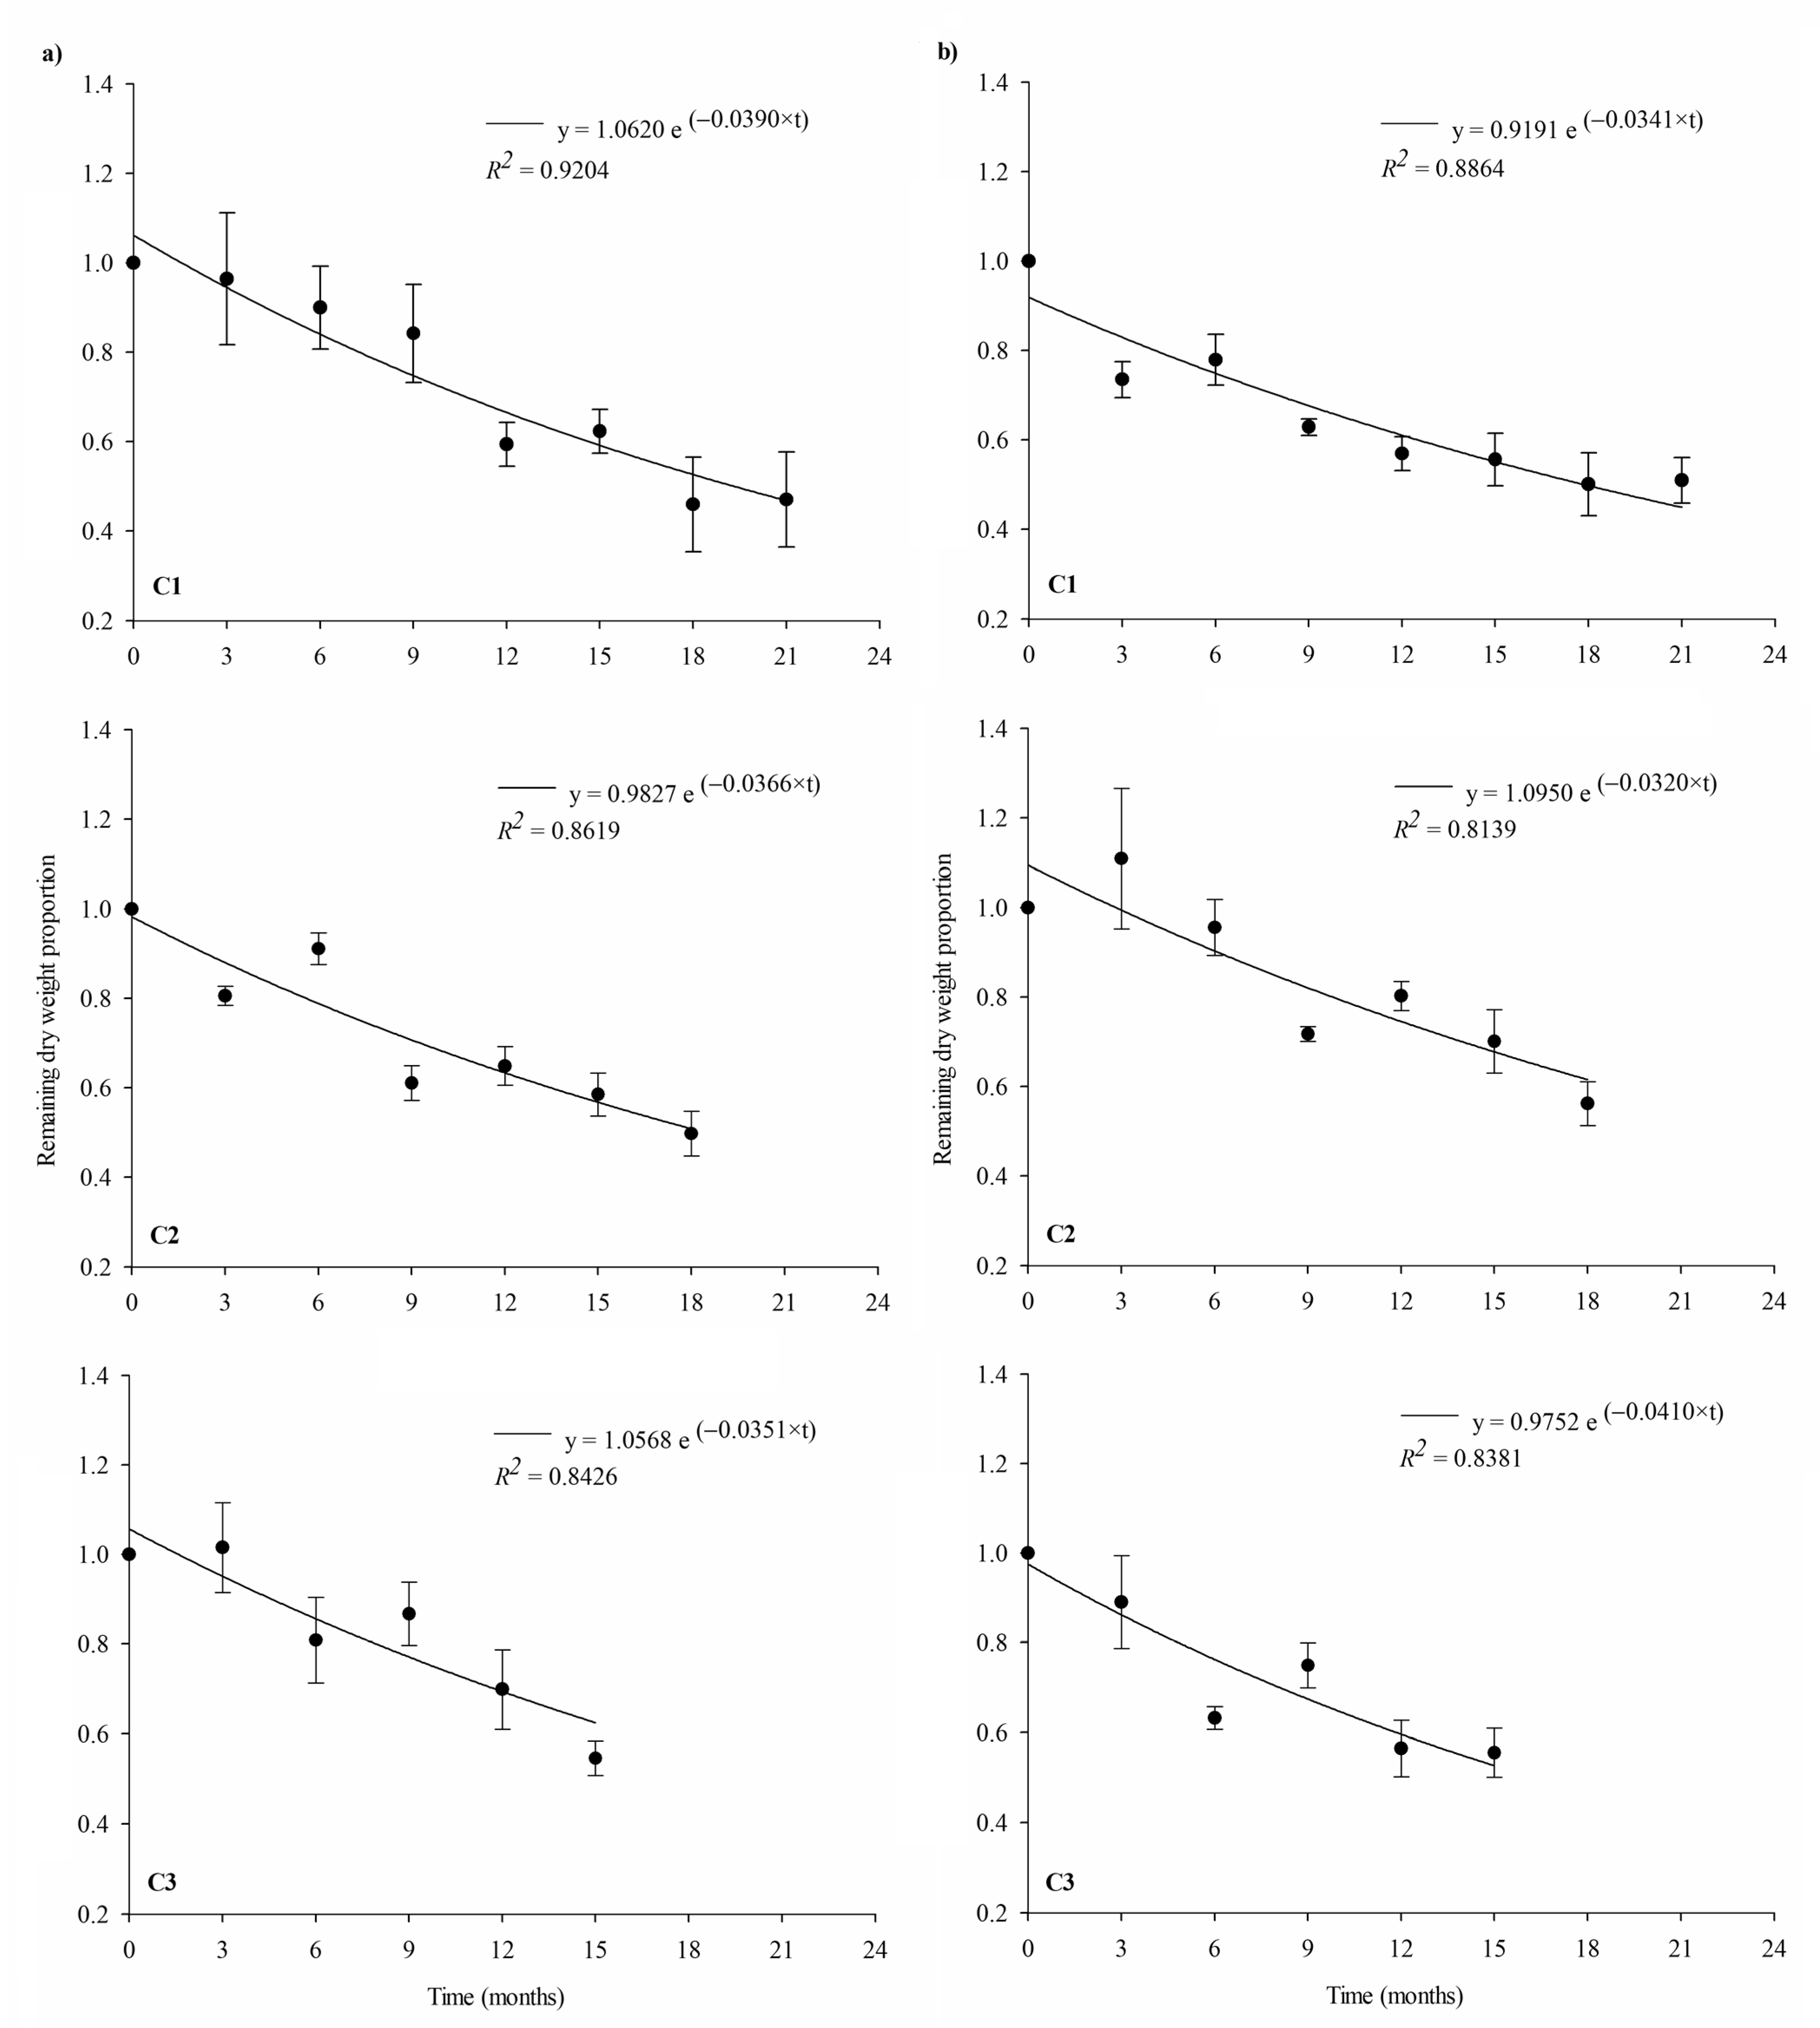
3.2. Litter Decomposition

The characteristics of the starting material in the different layers of E. grandis and P. taeda litter by season, in which the adjustment of the decomposition model was satisfactory, are presented in Table 4. In E. grandis the C:N ratio was 73% higher in the layer accumulated in summer of the first year compared to that deposited in winter, with an intermediate record in the case of the C2 layer. The concentration of N was 87 and 39% higher in the case of the layer formed in winter of the first year compared to that registered in C3 and C2 layers respectively, showing intermediate levels in the latter. In the case of C, the variable was slightly higher in C1 (7%) and C2 (6%) layers compared to that deposited during the summer (C3). Regarding soluble C, the layer deposited in the spring of the first year of study (C2) presented concentrations 39% and 46% lower than C1 and C3 layers respectively. In turn, for soluble polyphenols, no significant differences were observed between the layers analyzed. Finally, the lignin concentration was 11 and 7% higher in the layer deposited in winter (C1) compared to C2 and C3 layers, with the L:N ratio being significantly higher in the case of the layer originated during the summer of the first year of evaluation.
In P. taeda there were no significant differences in the C:N and L:N ratios, as well as in the concentration of lignin, C and N. For soluble polyphenols, the layer originated during the winter of the first year of evaluation (C1) showed a concentration significantly lower than that in the remaining layers considered. Finally, in the case of soluble C, the layer deposited in spring (C2) exhibited a significantly higher concentration than that formed during the winter season (C1), not differing in both cases from the material accumulated in the summer of the first year of evaluation.
In Figure 5 the regression models adjusted for E. grandis and P. taeda with respect to the proportion of remaining dry weight of the layers considered are presented.
The fit of the decay exponential model was significant for the loss of biomass from C1, C2 and C3 layers for both E. grandis (p = 0.0002; p = 0.0030, and p = 0.0098, respectively) and P. taeda (p = 0.0005; p = 0.0054, and p = 0.0104, respectively). The decomposition rates of the litter (k) obtained through the adjustment of the models did not show significant differences between the species in any of the layers considered for the beginning of evaluation studied (C1: p = 0.5024; C2: p = 0.6585; C3: p = 0.6380). Regarding the intercepts estimated in each model, no significant differences were identified with respect to an initial remaining proportion equal to 1 for both E. grandis (C1: p = 0.1104; C2: p = 0.3970; C3: p = 0.1986) and P. taeda (C1: p = 0.0561; C2: p = 0.0840; C3: p = 0.3549).
Regarding the proportion of remaining biomass, the variable reached on average 51% of the dry weight of the original material for C1 (21 months) in P. taeda, representing a significant decrease of 1.08 Mg ha−1 (p = 0.0165). On the other hand, in E. grandis it was 47%, showing a decrease equivalent to 1.03 Mg ha−1 (p = 0.0480). For the material deposited during spring (C2, 18 months), in the case of P. taeda, a proportion of remaining biomass of 56% was obtained, with a reduction of 1.04 Mg ha−1 compared to the initial record in this layer (p = 0.0134). In E. grandis, the residual biomass reached 50% of the material deposited in C2, which translated into a loss of 1.88 Mg ha−1 in dry weight (p = 0.0059). Finally, for the layer deposited in summer of the first year (C3, 15 months), it reached 56% in P. taeda, with a significant drop of 2.28 Mg ha−1 (p = 0.0181), while in E. grandis, the record obtained was 55%, which resulted in a decrease of 1.49 Mg ha−1 in relation to the initial dry weight of the material that gave rise to this layer (p = 0.0183).
On the other hand, there were no significant differences in the comparison between the decomposition rates (k) obtained at different beginning times, both for E. grandis (C1 vs. C2: p = 0.7805; C1 vs. C3: p = 0.6725 and; C2 vs. C3: p = 0.8898), as for P. taeda (C1 vs. C2: p = 0.8122; C1 vs. C3: p = 0.4953 and; C2 vs. C3: p = 0.4693).
Regarding the proportion of biomass remaining in the different layers of litter and the climatic variables recorded during the execution of the experiment, it was possible to identify significant relationships between these variables (Table 5). In the case of P. taeda, a negative and significant correlation was identified with MRH, MMINRH and MMAXRH, while, in the case of MVPD, the relationship was direct and significant. On the other hand, in E. grandis significant and inverse links were obtained for MRH, MMINRH and MMAXRH, while for MVPD a direct and statistically significant relationship with the remaining biomass of the litter was evidenced.

3.3. Carbon Stock Remaining in Litter

In relation to the decrease in the concentration and stock of C in the analyzed layers, the results are presented in Table 6. The differences in the concentration of C at the beginning and at the end in both species were not statistically significant (p < 0.05) for all the layers analyzed. In the case of the C stock, it was possible to identify a significant loss at the end of the study with respect to the initial condition, where for P. taeda it reached 0.50 Mg ha−1 in C1 layer (p = 0.0231), 0.50 Mg ha−1 in C2 layer (p = 0.0182) and 0.97 Mg ha−1 in C3 layer (p = 0.0268). In E. grandis, the decrease reached 0.49 Mg ha−1 in the layer deposited in winter (C1) (p = 0.0436), 0.95 Mg ha−1 in that originated in spring (C2) (p = 0.0020), and 0.65 Mg ha−1 in the one formed during the summer season of the first year of evaluation (C3) (p = 0.0272).

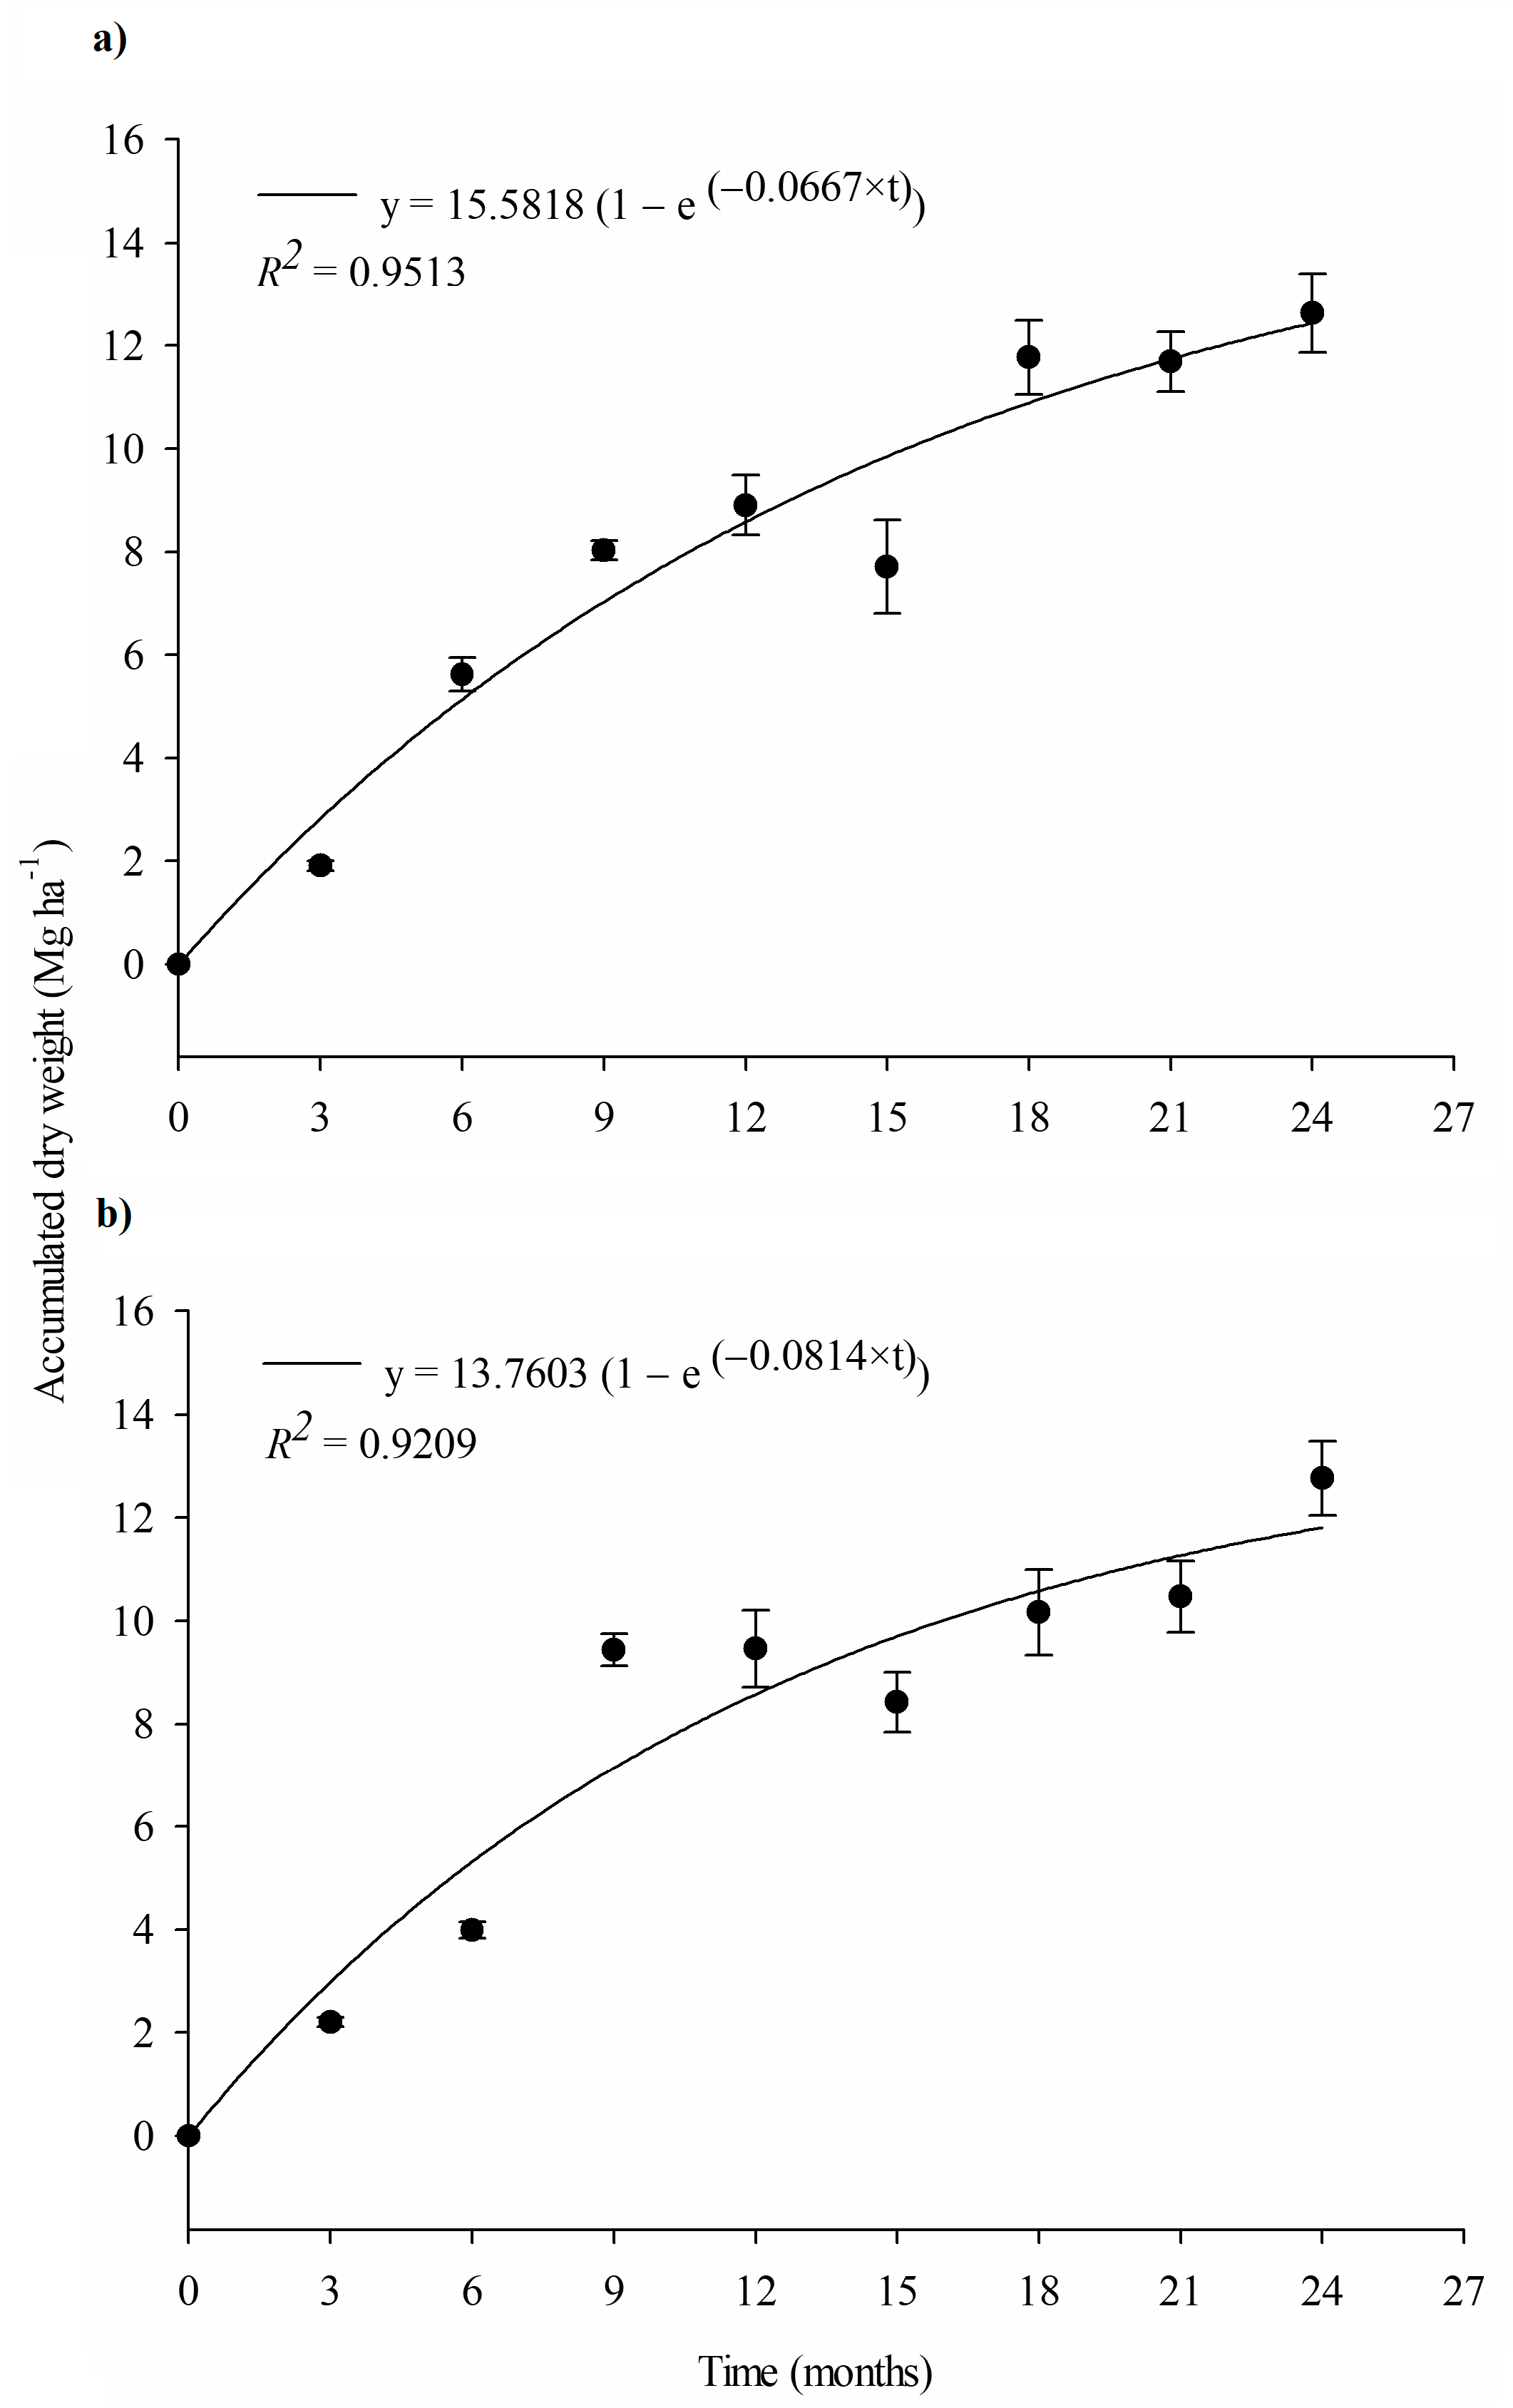
3.4. Litter Accumulation Dynamics

The adjustment of exponential rise to maximum models (Figure 6) could efficiently explain the accumulation process in both species (p < 0.0001). On the other hand, no differences were found between species in the litter decomposition rate (k) (p = 0.7012) or in the estimated amount of material to be accumulated at the equilibrium state (yss) (p = 0.6529).
Regarding the total accumulated biomass after two years, it reached 12.76 ± 0.72 Mg ha−1 in P. taeda and 12.63 ± 0.77 Mg ha−1 in the case of E. grandis, with no significant differences in weight among the species under study (p = 0.9056). The C concentration of the accumulated litter of E. grandis (438.72 ± 6.78 g kg−1) and P. taeda (441.08 ± 6.74 g kg−1) did not differ significantly from each other (p = 0.8173). In this sense, the total accumulated C stock in the P. taeda litter reached a value of 5.64 ± 0.40 Mg ha−1, while in the case of E. grandis it was 5.53 ± 0.27 Mg ha−1, with no significant differences between the evaluated species (p = 0.8307). On the other hand, the δ13C of the accumulated litter of P. taeda reached a value of −29.36 ± 0.11‰ while in E. grandis it was −29.99 ± 0.17‰, being statistically different between species (p = 0.0333).

3.5. Change in the Concentration and Stock of C and δ13C Values in the Soil

The comparisons of the δ13C values of the SOC under the forest species among themselves, and with respect to the records under native pastures are presented in Table 7. They show significant differences in most of the cases or strong trends, both characterized by lower δ13C of SOC under forest species in relation to native pastures for all depths analyzed. In the comparison between forest species, no significant differences were observed in the variable. In turn, for the period between the beginning and end of the evaluation, significant decreases of 0.83‰ were obtained under E. grandis in the 0 to 20 cm layer, and of 0.87‰ for the 3 to 6 cm layer for the case of P. taeda, without differences in the rest of the depths.
For SOC concentration, no significant differences were found under P. taeda and E. grandis with respect to those present under native pastures for any of the depths considered (Table 8). In turn, throughout the study period, no significant changes occurred in SOC for each individual forest species. However, when comparing this variable at each sampling moment, differences in concentration were obtained at the beginning and end of the study for the 12 to 20 cm layer, showing a 24% and 35% higher record under E. grandis with respect to P. taeda for the initial and final evaluation respectively. A similar behavior to that described before occurred at the beginning of the evaluation for the 9 to 12 cm layer, where the concentration under E. grandis was 30% higher compared to P. taeda, a difference that was compensated during the two years of evaluation, arriving at a statistically equivalent concentration at the end of the study. For the most superficial layer of soil, there were also significant differences in the concentration of SOC at the end of the study, being 100% higher under E. grandis with respect to P. taeda, as well as for the whole 20 cm soil layer, where it was 41% higher.
When comparing the total SOC stock under a native pasture adjacent to the experiment with that existing under both forest species at the end of the study (Table 9), no significant differences were recorded. Regarding the comparisons between forest species at the beginning of the study, in general, no differences were observed, however, the C stock was 30% higher under E. grandis in the 9 to 12 cm layer, and 24% higher for the layer from 12 to 20 cm. On the other hand, the SOC stock at the end of the study was 100% higher under E. grandis with respect to P. taeda in the first 3 cm of soil and 35% higher in the 12 to 20 cm layer. Finally, considering the total thickness of soil analyzed, the stock was 41% higher in E. grandis compared to that under P. taeda.
Regarding the contribution of young C during the two years of evaluation, and since the installation of the experiment, the results are presented in Table 10. A relevant incorporation of young C from 2003 until the final of the study (2019) was observed, reaching values of 6.92 and 5.05 Mg ha−1 for E. grandis and P. taeda respectively (from 0 to 20 cm depth). When comparing the contribution made by the forest species at the beginning (2017) and end of the study (2019) since the installation of the experiment (2003), significant differences were obtained only for the first 3 cm of soil at the end of the study, where the contribution of E. grandis was 2.05 Mg ha−1 higher than that evidenced in P. taeda. Considering the period between the years 2017 and 2019, a significant increase of 1.42 Mg ha−1 in the young C stock incorporated by E. grandis was evidenced (from 0 to 3 cm depth), not showing significant changes in P. taeda. On the other hand, the contribution of young C during the last two years of evaluation (between the years 2017 and 2019) was 1.80 and 1.95 Mg ha−1 higher in E. grandis with respect to P. taeda for the surface layer and the total depth of soil analyzed, respectively.

4. Discussion

In previous works, the Eucalyptus sp. litterfall was characterized by maximums during summer and/or spring and minimums in autumn and winter [8,38,39]. Local antecedents show similar results in E. grandis, with responses of a unimodal type, with a maximum in spring, or bimodal with peaks during spring and summer, with absolute minimums in autumn, winter or in both seasons [40]. This coincides with the seasonal pattern evidenced in this study, which, for the first year of evaluation, showed a main maximum in spring (3.77 Mg ha−1), a secondary peak in the summer season (3.26 Mg ha−1), an intermediate value during winter (1.91 Mg ha−1) and an absolute minimum in autumn (0.58 Mg ha−1). During the second year, litter production showed some variations with respect to the first, although within the behavior usually reported for Eucalyptus sp., with a main peak of fall in spring and summer (3.52 and 3.08 Mg ha−1 respectively) and a minimum in the autumn and winter (1.44 and 1.31 Mg ha−1 respectively).
In spring and summer, the highest levels of deficit in vapor pressure, relative humidity and temperatures were recorded, moments in which the largest litterfall also occurred, which can be related to the increase in temperature and the occurrence of dry periods [5,8,38,39]. Specifically, in the spring of the first year, which was relatively drier than that of the second, the amount of fallen material was significantly higher, evidencing an effect of the year of evaluation on the shedding of litter. The results of the correlation analysis support this, mainly through relationships which indicate that, in general terms, when the temperature rises, the relative humidity decreases, and when the vapor pressure deficit increases, the litterfall is increased, which coincides with what was observed in Eucalyptus dunnii in Brazil [41].
Regarding the annual averages of litterfall, the records obtained (9.52 and 9.34 Mg ha−1 for the first and second year of the study, respectively) are different from those reported in the same site for E. grandis aged 8 years old at a planting density of 816 and 2066 trees ha−1, which on average reached 6.0 Mg ha−1 [40]. This discrepancy can be attributed to differences in the age of the stands (8 vs. 14 years in the present work) since, in some Eucalyptus species, increases in the amount of fallen material have been evidenced as a function of increasing age until the canopy closes [42,43].
The results obtained in P. taeda during the first year showed a maximum fall in summer (5.12 Mg ha−1), similar to what was observed in the same site for an 8-year-old plantation with the same species and density but producing a lower amount of material (2.80 Mg ha−1) [40]. This type of behavior may be linked to the low rainfall and relative humidity evidenced from mid-spring to summer of the first year, a situation that would have caused the greatest drop in litter, coinciding with the increase in drop during periods of water deficit and high temperatures observed by Erkan et al. [10]. The correlation analyzes showed direct relationships between litterfall and variables related to temperature, behavior usually evidenced in Pinus sp. [10,44]. In turn, accumulated precipitation showed an inverse relationship with litterfall, explained by a greater fall during the spring and summer of the first year, seasons that were very dry. This behavior is similar to that reported in Pinus radiata in Australia with maximum needle drop due to low rainfall during the summer [45,46].
In the second year, the maximum litterfall of P. taeda occurred in autumn (3.27 Mg ha−1), a secondary peak in summer (2.51 Mg ha−1), an intermediate winter record (1.22 Mg ha−1) and an absolute minimum in spring (0.36 Mg ha−1). It is possible that these events are related to the abundance of rainfall and high relative humidity recorded from spring to summer of the second year in relation to the first. This condition could determine the displacement of the summer peak evidenced in the first year towards autumn in the second. This is supported by antecedents in which delays of between 3 and 6 months have been reported in the maximum shedding of needles in the absence of summer water stress in P. radiata in Australia [47], shifting the peak of litterfall from summer to autumn [45].
The average annual amount of P. taeda litter produced in the second year (7.35 Mg ha−1) was significantly lower than that of the first (10.94 Mg ha−1), possibly due to the highly favorable climatic conditions for the detachment of material during the first year and the delay of the peak of litterfall during the second year of evaluation [45,47], which could even lead to the fact that part of the material did not detach within the study period. On the other hand, previously at this site, the average annual litter drop in 8-year-old P. taeda planted at a density of 816 and 2066 trees ha−1 reached 5.8 Mg ha−1 on average [40], a substantially lower amount to those obtained in this work, mainly during the first year, a difference attributable to increases in the fall of litter with the age of the plantation [48].
The largest litter depositions by E. grandis during the second year with respect to P. taeda coincide with that previously reported in Ethiopia for plantations of different Eucalyptus species, which exhibited higher annual litter production compared to plantations of coniferous species [9]. A similar response was observed in Australia, where the litter deposition for a group of Eucalyptus species was significantly higher than that produced in plantations of P. radiata of equivalent density [46]. The higher litter production of the present study by P. taeda compared to E. grandis during the first year of evaluation could be related to a differential response between the species to the conditions of scarce rainfall, low relative humidity, high vapor pressure deficit and high temperatures that occurred from spring to summer of the first year of evaluation.
In relation to the decomposition of the fallen litter in the period, it was observed that the adjustment of decay exponential models to the remaining biomass for the different layers of litter in relation to the decomposition time turned out to be significant in both species and explanatory of the process. This is consistent with results from works that studied litter decomposition in various tree species and regions [26,27,49,50,51]. The estimation of the initial material proportion from the model intercept was satisfactory in all cases, which constitutes an indicator of the adequacy of the models adjusted to the decomposition kinetics [37]. In turn, this constitutes an indicator of the absence of significant accelerations in the loss of mass or slowdowns in decomposition during the early stages of the process [52].
The different decomposition rates obtained in this study were slightly higher than those previously registered at the local level for litter of E. dunnii collected from an 8-year-old plantation (0.0276 month−1) [14] and a 22-year-old P. taeda plantation (0.0108 month−1) [53]. The discrepancies may be attributable to the existing differences in the initial state of the litter examined in these studies, which consisted of mixed material with some prior degradation instead of fresh litter, a condition associated with slower decomposition [14,54]. This variable tends to decrease in residues in which an advanced degree of decomposition leads to the enrichment of recalcitrant compounds such as lignin, determining the slowdown of this process [16]. The decomposition of the litter resulted in a significant decrease in the C stock in the analyzed layers, which is in line with previous reports for litter from different species of Eucalyptus and Pinus [55,56,57].
There were no significant differences in the decomposition rate between species, a result that was unexpected, since the litter of broadleaf species usually tends to decompose faster than that of conifers [58] due to the lower quality of needles [59], and the presence of waxes that cover its surface, which delay the entry of water and thus the degradation process [60]. In turn, litter removal at the beginning of the evaluation could limit the decomposition rate in both species, particularly during early-stage phase of the process [61]. This behavior is related to the slowdown of microbial activity, which in turn causes decreases in the rate of respiration of the soil due to the litter removal [62,63,64] reducing its decomposition rate [65]. However, similar results to that obtained in the present study were reported in different species of Eucalyptus sp. and Pinus sp. [9,27]. On the other hand, the presence of different amounts of material during the formation of each layer, or their absence (C1), could influence their decomposition, since the addition of material leads to increases in this variable [61,66]. However, it seems that this effect was not enough to promote differences in the decomposition rate, given the coincidence of increases in the amount of accumulated material with more favorable moments for decomposition.
In turn, no differences were found in the decomposition rate for different seasons of the beginning of the evaluation. This differs from results reported in simulations that indicate that the rate of decomposition of the litter would vary depending on the time of year that the study begins [67]. Nevertheless, the inverse relationships evidenced for the variables MMINRH and MMAXRH with respect to the remaining biomass in P. taeda, and links of the same nature in E. grandis with MRH, MINRH, MAXRH, and direct with MVPD, would explain possible slowdowns in the decomposition of the litter layers deposited during the spring (C2) and summer (C3) of the first year, given the low relative humidity recorded in these seasons, followed by limiting moments for the process (autumn and winter). Additionally, these antecedents are based on the assumption of the use of the same starting material, which does not occur in the present test, given the variations of the material corroborated in the C:N and L:N relationships that result in different quality and changes in the rate of decomposition of the litter [2,18]. These changes in the quality of the residues could counterbalance the differences, given the coincidence of higher C:N and L:N ratios in more favorable periods for decomposition (spring and/or summer) and lower during limiting moments (winter). This was particularly marked in the case of E. grandis litter, although showing a similar trend in P. taeda. In addition, for P. taeda, the concentration of polyphenols followed a similar behavior, being markedly higher for the layers that originated at the most favorable moments for decomposition (spring and summer), which may be related to slowdowns in the decomposition rate [68,69,70].
These aspects together could explain the absence of differences in the litter decomposition rate between the species and the moments of beginning of evaluation considered, with an effect that lasted for a large part of the period of study, particularly in the case of adverse environmental conditions for decomposition, which could explain the absence of significant deviations in the intercept of the estimated models.
The decomposition of the litter in both species caused a significant reduction in biomass in the layers considered. This result coincides with that previously reported for P. taeda in North Carolina, United States, where average biomass losses of 55% were obtained after 26 months of decomposition [71], records very similar to those found in the present study. For E. grandis, similar behaviors have also been reported in Entre Ríos, Argentina, with decreases in litter biomass close to 50% of the initial weight after 600 days of decomposition [26]. In turn, there was a relevant reduction in the amount of C stock in the layers of decomposing litter, which has been evidenced for numerous species of Eucalyptus and Pinus in various regions of the world [9,26,49,55,57,71,72]. Since the concentration of C did not vary significantly in any of the analyzed layers, this reduction of the C stock in the litter layers is mainly attributable to the loss of biomass during the study.
Regarding the dynamics of formation of the litter of the studied species as a function of time, the adjustment of exponential rise to maximum models explained the process, not obtaining significant differences between the species considered in the accumulation of material estimated at the state of equilibrium, as well as the decomposition rate of the material as a whole. A similar approach is cited for the accumulation of litter after fire events for numerous species of Eucalyptus in Australia, where a rapid increase of the material deposited at the beginning was observed, to later stabilize at an equilibrium level in which the decomposition rate is equivalent to the rate of litterfall [73,74,75]. The result obtained follows the same trend observed for the decomposition of the layers analyzed individually, showing no significant differences in the decomposition rate between the species considered. On the other hand, the differences found in litter production between years and species were compensated by a very similar annual average (9.15 Mg ha−1 year−1 in P. taeda and 9.43 Mg ha−1 year−1 in E. grandis). This situation, together with the absence of differences in the rate of decomposition of the litter, translated into equivalent amounts of biomass accumulated in each species individually during the study period. Previous studies indicate that in various species of Eucalyptus the accumulation of litter after fire events reaches the steady state condition in a period of between 4 and 8 years [73,75]. This means that estimates made based on short-term studies should be taken with precaution, especially if it is not possible to identify signs of a slowdown in the amount of accumulated material. In this case, a clear tendency of a slowdown in the accumulated material at the final of the study was verified, obtaining a good fit of these models to the data set.
The total C stock located in the litter was not significantly different between the evaluated species, which is related to a similar C concentration and litter production of the same nature [76]. Nevertheless, these results could be affected by the removal of the litter before the start of the study, since this practice causes reductions in the decomposition rate, particularly in the early stages of the process, altering the amount of remaining biomass [61,65]. In turn, the δ13C of the accumulated litter of P. taeda and E. grandis was very similar to that obtained in 19-year-old commercial plantations in the Congo, where the variable averaged −30.4‰ for Eucalyptus and −29.7‰ in Pinus [23]. This result shows higher absolute values in Pinus compared to Eucalyptus; a similar behavior to that observed in the present work. Finally, under the assumption that the C concentration in litter (average of several seasonal samplings) is of the order of 464 g kg−1, and 449 g kg−1 for E. grandis and P. taeda, respectively [40], the C incorporated annually to the forest floor due to the fall of litter varied between 4.33 and 4.42 Mg ha−1 for E. grandis and between 3.30 and 4.91 Mg ha−1 for P. taeda, which represents a relevant contribution of this element.
Analyzing the results obtained, the proposed methodology allowed us to evaluate and compare the fall, decomposition and accumulation of litter between species, however, the use of a larger sample size would increase the accuracy of the estimation of above-ground litter production [77]. In turn, this could cause an intrinsic improvement in the adjustment of the decomposition models, since the remaining biomass is estimated from this information. In this sense, future studies should determinate a minimum number of replicates according to temporal and spatial variations on litterfall for each study area.
Regarding the δ13 of the SOC, there were no differences under the forest species among themselves, however, these differed significantly from the native pasture coverage, which showed a significantly higher δ13C. In P. taeda and E. grandis, for the first 3 cm of soil, the records were −23.72 and −22.75‰ at the beginning, and −23.37 and −24.15‰ at the end of the study for each species respectively, while the δ13 of SOC under native pastures was −18.28‰. The results for native vegetation reflect the average corresponding to a mixture of C3 and C4 species and, in the case of forest cover, a value close to the average for C3 species [34]. Previous studies in the same site, with the same forest species, although with 8 years of age, showed average values of δ13C at 5 cm depth of −20.44‰ in E. grandis and −21.37‰ for P. taeda, which are significantly higher than those arrived at in the present work [22]. In turn, the results obtained in the present study are very similar to those reported for Pinus sp. and Eucalyptus sp. in the Congo on soils originally occupied by savannas, which indicate that for the first 5 cm of soil, the δ13C under Pinus sp. reached a value of −23.2‰ and −26.2‰ for the case of Eucalyptus sp. [23]. The decrease in the δ13 of the SOC under the forest covers would be related to the incorporation of remains, such as litter and roots, in the first centimeters of the soil [78], a variable that tends to decline with the increase in the age of the plantation [23]. These results show that the longer the period of time in which the forest species contributes to SOC, the more distant its isotopic composition will be with respect to the initial condition under native pastures.
Regarding the concentration of C in the soil, no significant differences were observed between forest vegetation and native pastures, a similar result to that obtained previously in the same study site [22]. However, when contrasting this variable between forest species, significant differences were evidenced, marked by higher concentrations under E. grandis in the 9 to 12 and 12 to 20 cm depth layer with respect to P. taeda at the beginning of this study (year 2017). Although the results indicated the non-existence of significant changes in the C concentration between the records at the beginning (year 2017) and the end of the study (year 2019) under each species individually, when comparing the forest species at the end of the evaluation period, higher levels were obtained under E. grandis for the 0 to 3 cm and 0 to 20 cm soil layers, being compensated the initial difference recorded in the 9 to 12 cm portion. This indicates the existence of a differential change in the concentration of C in the soil, characterized by the increase of this variable under E. grandis with respect to P. taeda. These results mark differences with respect to the main available antecedent, where no significant differences were reported between the forest species, although with 8 years of age [22]. Nevertheless, in Australia, results were in line with those obtained in this experiment, given by higher concentrations under E. grandis compared to P. radiata [79].
When considering the SOC stock, the results obtained follow similar trends of the variations observed in the concentration of C. The total SOC stock did not present significant differences between the forest species and native pastures for any of the analyzed depths. However, the great variability in the concentration and SOC stock observed in the upper layer of the soil under pasture could lead to the absence of significant differences, fundamentally with respect to P. taeda. The same tendency was found in plantations of Eucalyptus sp. in Congo on soils the original vegetation on which corresponded to savannas [23]. Nevertheless, in Australia, 20% decreases in soil C stock are reported for 1 m depth under plantations of 16-year-old Pinus radiata at sites originally occupied by pastures [80]. On the other hand, in plantations established on soils from degraded pastures in Brazil, significant increases were demonstrated [81].
The fact that, for the same study site, decreases in the C stock were evidenced in the first 15 cm of the soil under P. taeda and E. grandis of 8 years of age with respect to the original condition of native pastures [22], indicates that the forest cover managed to compensate these losses during the following 8 years until the end of this study. However, considering the period between the years 2017 and 2019 and the comparison of the forest species and native pastures at each year individually, both the C concentration and the SOC stock did not show significant changes. This situation may be related to the limited time of study, since changes in the soil carbon content occur slowly [82].
On the other hand, the differences in the concentration and C stock between the forest species that were evidenced at the final of the study period, would be showing a differential change characterized by higher increments under E. grandis with respect to P. taeda. Nevertheless, the humification of C from the litter could increase between the years 2017 and 2019 by the removal of the accumulated material at the beginning of the study, since this process is favored in those situations that limit the decomposition rate [83,84]. This condition could promote the humification of part of the litter shed increasing the SOC stock in a different way between species. These findings coincide with what was reported for Eucalyptus and Pinus plantations in Australia, where a lower SOC stock was evidenced under the latter [79]. In turn, they are in line with what was observed under Eucalyptus sp. which tend to host a larger C stock at depths greater than 10 cm than P. radiata plantations, being slightly higher for surface strata [85].
Regarding the contribution of young organic C to the soil made by the forest species since the installation of the experiment (year 2003), the results show a strong substitution of C inherited from native pastures for that incorporated by the forest cover of both species. This finding is consistent with that previously reported in the study carried out in the same experimental site, where a significant contribution was registered by the forest component to the SOC, mainly the 0–30 cm layer, although with a strongly marked effect on the surface layer of 0 to 5 cm, reaching a contribution of 28% and 24% for E. grandis and P. taeda, respectively [22]. In turn, a similar trend is mentioned for plantations of Eucalyptus sp. and Pinus sp. on soils originally occupied by savannas in the Congo [23,86]. In relation to the differences between species, they showed greater incorporation by E. grandis with respect to P. taeda in the first 3 cm of the soil only at the end of the study, a result that is consistent with that evidenced in the local antecedent [22] and possibly linked to the largest stock of SOC observed at the end of the study under this species.
Based on the contribution evidenced, and assuming a linear behavior of the incorporation of C into the soil, the forest component made a contribution of 0.43 Mg ha−1 year−1 under E. grandis and 0.32 Mg ha−1 year−1 under P. taeda for the total depth analyzed (20 cm). Hernández et al. [22] reported an incorporation of 0.37 Mg ha−1 year−1 for E. grandis and P. taeda in the first 20 cm of soil at the eighth year from the installation of the experiment. Based on the above, it can be established that the contribution of SOC by E. grandis was greater during the 8 years after that evaluation.
Finally, when considering the incorporation carried out exclusively during the last two years of evaluation of the experiment, the contribution of young organic C to the soil by E. grandis was higher in the surface layer of 0 to 3 cm with respect to P. taeda, which would explain the differential change mentioned above for this stratum. In turn, for the total depth of soil analyzed, the incorporation of young C was higher in E. grandis with respect to P. taeda, although its magnitude was not significant enough to translate into a statistically significant change in the contribution of young organic C to the soil in the last two years of the study, even though it could result in the highest stock of SOC recorded in the 20 cm depth analyzed at the end of the study.

5. Conclusions

This study shows the existence of a seasonal pattern of litterfall that can be affected by climatic conditions depending on the species considered. In the case of Eucalyptus sp., the seasonal pattern was barely altered, the opposite occurring in Pinus sp., where the annual distribution of fall was strongly disturbed. The existence of relationships between litterfall and climatic variables was evidenced, with higher litter production under conditions of increased temperature and dry periods in both species. In relation to the total amount of material, variable behaviors were found during the study, although considering the average of both years the litter production was similar.
Regarding the decomposition of the litter, the results obtained suggest the absence of differences in the decomposition rate between Eucalyptus sp. and Pinus sp., as well as regarding the time of the year the evaluation began.
In relation to the dynamics of litter accumulation, the adjustment of exponential rise to maximum models which explained the process in Eucalyptus sp. and Pinus sp., provides relevant information to estimate the sequestered C in forest systems, allowing a state of dynamic equilibrium to be determined in which the material input given by the litterfall is equivalent to the loss of biomass by its decomposition. The use of databases obtained from long-term studies could improve the precision of the estimations.
Considering the results obtained in this work, it is possible to conclude that the use of the proposed sampling methodology allows the litterfall and its decomposition and accumulation process to be evaluated at the same time with success. Additionally, it enables the above-ground litter production and decomposition between species to be quantified and compared. However, it is possible that a higher number of replications improves the accuracy of the results obtained, it being necessary to study the spatial and temporal variation of litterfall to establish a minimum sample size for each study area.
Regarding the δ13 of SOC, this variable did not show differences between Eucalyptus sp. and Pinus sp.; however, both showed a significantly lower δ13 of the SOC with respect to that present under native pastures, a decrease attributable to the incorporation of remains derived from the decomposition of forest litter resulting in a significant incorporation of C to the soil.
The commercial plantations installed on soils originally occupied by native pastures can make a significant contribution to SOC, replacing a large part of the C inherited from this vegetation in the first 20 cm of depth, remaining stable the concentration and the SOC stock. This substitution effect determines the existence of a significant incorporation of C into the soil without important changes in their stocks, at least in short time periods, which constitutes a relevant aspect to consider in the dynamics of C in these systems.
Finally, it is necessary to specify that the scope of the findings obtained in this study is greatly limited by the utilized sample size.

Author Contributions

A.B. carried out the sampling activities, statistical and laboratory analyses, and led the writing of the article with revision from all authors. J.H. was involved in the development of the methodology, litter and soil sampling activities, and in the revision process. A.d.P. participated in the development of the sampling methodology, the activities related to chemical analyses and the review of the article. All authors have read and agreed to the published version of the manuscript.

Funding

This research was funded by Lumin S.A. and the Agencia Nacional de Investigación e Innovación (ANII) [POS_NAC_2016_1_130479].

Institutional Review Board Statement

Not applicable.

Informed Consent Statement

Not applicable.

Data Availability Statement

Data are available upon request to corresponding author.

Acknowledgments

The authors wish to especially thank the technicians and operational personnel of Lumin S.A. for providing the necessary logistical support for the evaluations that were carried out in the field.

Conflicts of Interest

No author is involved in competing interests.

References

  1. Thompson, L.M.; Troeh, F.R. Los Suelos y Su Fertilidad, 4th ed.; Reverté: Barcelona, Spain, 1982; ISBN 978-84-291-9001-4. [Google Scholar]
  2. Goma-Tchimbakala, J.; Bernhard-Reversat, F. Comparison of Litter Dynamics in Three Plantations of an Indigenous Timber-Tree Species (Terminalia Superba) and a Natural Tropical Forest in Mayombe, Congo. For. Ecol. Manag. 2006, 229, 304–313. [Google Scholar] [CrossRef]
  3. Olson, J.S. Energy Storage and the Balance of Producers and Decomposers in Ecological Systems. Ecology 1963, 44, 322–331. [Google Scholar] [CrossRef] [Green Version]
  4. Theodorou, C.; Bowen, G.D. Effects of Fertilizer on Litterfall and N and P Release from Decomposing Litter in a Pinus radiata Plantation. For. Ecol. Manag. 1990, 32, 87–102. [Google Scholar] [CrossRef]
  5. Pook, E.W.; Gill, A.M.; Moore, P.H.R. Long-Term Variation of Litter Fall, Canopy Leaf Area and Flowering in a Eucalyptus maculata Forest on the South Coast of New South Wales. Aust. J. Bot. 1997, 45, 737. [Google Scholar] [CrossRef]
  6. Li, Z.A.; Zou, B.; Xia, H.; Ren, H.; Mo, J.; Weng, H. Litterfall Dynamics of an Evergreen Broadleaf Forest and a Pine Forest in the Subtropical Region of China. For. Sci. 2005, 51, 608–615. [Google Scholar] [CrossRef]
  7. Baker, T.G. Dry Matter, Nitrogen, and Phosphorus Content of Litterfall and Branchfall in Pinus radiata and Eucalyptus Forests. N. Z. J. For. Sci. 1983, 13, 205–221. [Google Scholar]
  8. Abelho, M.; Graça, M.A.S. Effects of Eucalyptus Afforestation on Leaf Litter Dynamics and Macroinvertebrate Community Structure of Streams in Central Portugal. Hydrobiologia 1996, 324, 195–204. [Google Scholar] [CrossRef]
  9. Demessie, A.; Singh, B.R.; Lal, R.; Strand, L.T. Leaf Litter Fall and Litter Decomposition under Eucalyptus and Coniferous Plantations in Gambo District, Southern Ethiopia. Soil Plant Sci. 2011, 1–10. [Google Scholar] [CrossRef]
  10. Erkan, N.; Comez, A.; Aydin, A.C.; Denli, O.; Erkan, S. Litterfall in Relation to Stand Parameters and Climatic Factors in Pinus brutia Forests in Turkey. Scand. J. For. Res. 2018, 33, 338–346. [Google Scholar] [CrossRef]
  11. Swift, M.J.; Heal, O.W.; Anderson, J.M.; Anderson, J.M. Decomposition in Terrestrial Ecosystems; University of California Press: Oakland, CA, USA, 1979; ISBN 978-0-520-04001-4. [Google Scholar]
  12. Prescott, C.E.; Zabek, L.M.; Staley, C.L.; Kabzems, R. Decomposition of Broadleaf and Needle Litter in Forests of British Columbia: Influences of Litter Type, Forest Type, and Litter Mixtures. Can. J. For. Res. 2000, 30, 1742–1750. [Google Scholar] [CrossRef]
  13. Canhoto, C.; Graça, M.A.S. Leaf Barriers to Fungal Colonization and Shredders (Tipula lateralis) Consumption of Decomposing Eucalyptus globulus. Microb. Ecol. 1999, 37, 163–172. [Google Scholar] [CrossRef]
  14. Hernández, J.; del Pino, A.; Salvo, L.; Arrarte, G. Nutrient Export and Harvest Residue Decomposition Patterns of a Eucalyptus dunnii Maiden Plantation in Temperate Climate of Uruguay. For. Ecol. Manag. 2009, 258, 92–99. [Google Scholar] [CrossRef]
  15. Aerts, R. Climate, Leaf Litter Chemistry and Leaf Litter Decomposition in Terrestrial Ecosystems: A Triangular Relationship. Oikos 1997, 79, 439. [Google Scholar] [CrossRef]
  16. Berg, B. Litter Decomposition and Organic Matter Turnover in Northern Forest Soils. For. Ecol. Manag. 2000, 133, 13–22. [Google Scholar] [CrossRef]
  17. Xuluc-Tolosa, F. Leaf Litter Decomposition of Tree Species in Three Successional Phases of Tropical Dry Secondary Forest in Campeche, Mexico. For. Ecol. Manag. 2003, 174, 401–412. [Google Scholar] [CrossRef]
  18. Hättenschwiler, S. Effects of Tree Species Diversity on Litter Quality and Decomposition. In Forest Diversity and Function; Scherer-Lorenzen, M., Körner, C., Schulze, E.-D., Eds.; Springer: Berlin/Heidelberg, Germany, 2005; Volume 176, pp. 149–164. ISBN 978-3-540-22191-3. [Google Scholar]
  19. Tateno, R.; Tokuchi, N.; Yamanaka, N.; Du, S.; Otsuki, K.; Shimamura, T.; Xue, Z.; Wang, S.; Hou, Q. Comparison of Litterfall Production and Leaf Litter Decomposition between an Exotic Black Locust Plantation and an Indigenous Oak Forest near Yan’an on the Loess Plateau, China. For. Ecol. Manag. 2007, 241, 84–90. [Google Scholar] [CrossRef]
  20. Laclau, P. Biomass and Carbon Sequestration of Ponderosa Pine Plantations and Native Cypress Forests in Northwest Patagonia. For. Ecol. Manag. 2003, 180, 317–333. [Google Scholar] [CrossRef]
  21. Wang, H.; Liu, S.; Wang, J.; Shi, Z.; Lu, L.; Guo, W.; Jia, H.; Cai, D. Dynamics and Speciation of Organic Carbon during Decomposition of Leaf Litter and Fine Roots in Four Subtropical Plantations of China. For. Ecol. Manag. 2013, 300, 43–52. [Google Scholar] [CrossRef]
  22. Hernández, J.; del Pino, A.; Vance, E.D.; Califra, Á.; Del Giorgio, F.; Martínez, L.; González-Barrios, P. Eucalyptus and Pinus Stand Density Effects on Soil Carbon Sequestration. For. Ecol. Manag. 2016, 368, 28–38. [Google Scholar] [CrossRef]
  23. Trouve, C.; Mariotti, A.; Schwartz, D.; Guillet, B. Soil Organic Carbon Dynamics under Eucalyptus and Pinus Planted on Savannas in the Congo. Soil Biol. Biochem. 1994, 26, 287–295. [Google Scholar] [CrossRef]
  24. Bubb, K.A.; Xu, Z.H.; Simpson, J.A.; Saffigna, P.G. Some Nutrient Dynamics Associated with Litterfall and Litter Decomposition in Hoop Pine Plantations of Southeast Queensland, Australia. For. Ecol. Manag. 1998, 110, 343–352. [Google Scholar] [CrossRef]
  25. Blanco, J.A.; Imbert, J.B.; Castillo, F.J. Nutrient Return via Litterfall in Two Contrasting Pinus sylvestris Forests in the Pyrenees under Different Thinning Intensities. For. Ecol. Manag. 2008, 256, 1840–1852. [Google Scholar] [CrossRef]
  26. Goya, J.F.; Frangi, J.L.; Pérez, C.; Tea, F.D. Decomposition and Nutrient Release from Leaf Litter in Eucalyptus grandis Plantations on Three Different Soils in Entre Ríos, Argentina. Bosque 2008, 29, 217–226. [Google Scholar] [CrossRef] [Green Version]
  27. Olsson, B.A.; Guedes, B.S.; Dahlin, A.S.; Hyvönen, R. Predicted Long-Term Effects of Decomposition of Leaf Litter from Pinus taeda, Eucalyptus cloeziana and Deciduous Miombo Trees on Soil Carbon Stocks. Glob. Ecol. Conserv. 2019, 17, e00587. [Google Scholar] [CrossRef]
  28. Castaño, J.P.; Giménez, A.; Ceroni, M.; Furest, J.; Aunchayna, R.; Bidegain, M. Caracterización Agroclimática Del Uruguay 1980-2009; INIA Serie Técnica; Instituto Nacional de Investigación Agropecuaria: Montevideo, Uruguay, 2011; ISBN 978-9974-38-330-2. [Google Scholar]
  29. Soil Survey Staff. Keys to Soil Taxonomy, 12th ed.; Department of Agriculture, Natural Resources Conservation Service: Washington, DC, USA, 2014. [Google Scholar]
  30. Altamirano, A.; Da Silva, H.; Durán, A.; Echeverría, A.; Panario, D.; Puentes, R. Carta de Reconocimiento de Suelos del Uruguay: Clasificación de Suelos; Ministerio de Ganadería Agricultura y Pesca: Montevideo, Uruguay, 1976. [Google Scholar]
  31. Schwanninger, M.; Hinterstoisser, B. Klason Lignin: Modifications to Improve the Precision of the Standardized Determination. Holzforschung 2002, 56, 161–166. [Google Scholar] [CrossRef]
  32. Corbeels, M.; O’Connell, A.M.; Grove, T.S.; Mendham, D.S.; Rance, S.J. Nitrogen Release from Eucalypt Leaves and Legume Residues as Influenced by Their Biochemical Quality and Degree of Contact with Soil. Plant Soil. 2003, 250, 15–28. [Google Scholar] [CrossRef]
  33. Michener, R.H.; Lajtha, K. (Eds.) Ecological Methods and Concepts Series, 2nd ed.; Blackwell Pub: Malden, MA, USA, 2007; ISBN 978-1-4051-2680-9. [Google Scholar]
  34. Balesdent, J.; Mariotti, A. Measurement of Soil Organic Matter Turnover Using 13C Natural Abundance. In Mass Spectrometry of Soils; CRC Press: Boca Raton, FL, USA, 1996; pp. 83–111. [Google Scholar]
  35. Draper, N.R.; Smith, H. Applied Regression Analysis, 3rd ed.; Wiley Series in Probability and Statistics; John Wiley & Sons: Hoboken, NJ, USA, 1998; ISBN 978-0-471-17082-2. [Google Scholar]
  36. SAS Institute. SAS® Studio 3.3: User’s Guide; SAS Institute Inc.: Cary, NC, USA, 2015. [Google Scholar]
  37. Harmon, M.E.; Silver, W.L.; Fasth, B.; Chen, H.; Burke, I.C.; Parton, W.J.; Hart, S.C.; Currie, W.S. LIDET Long-Term Patterns of Mass Loss during the Decomposition of Leaf and Fine Root Litter: An Intersite Comparison. Glob. Chang. Biol. 2009, 15, 1320–1338. [Google Scholar] [CrossRef] [Green Version]
  38. Schlatter, J.E.; Gerding, V.; Calderón, S. Aporte de la Hojarasca al Ciclo Biogeoquímico en Plantaciones de Eucalyptus nitens, X Región, Chile. Bosque 2006, 27. [Google Scholar] [CrossRef]
  39. De Vargas, G.R.; Marques, R.; Bianchin, J.E.; Teixeira, W.W.R.; Blum, H. Biomass Deposition and Chemical Composition of Litterfall in Clonal Eucalyptus Plantations. Floresta E Ambiente 2019, 26. [Google Scholar] [CrossRef] [Green Version]
  40. Hernández, J.; del Pino, A.; Califra, A. Eucalyptus and Pine Stand Spacing Density Study and Its Implications for Carbon Sequestration Processes. Final Report; Faculty of Agronomy: Montevideo, Uruguay, 2014. [Google Scholar]
  41. Momolli, D.R.; Schumacher, M.V.; Viera, M.; Ludvichak, A.A.; do Couto Guimarães, C.; de Souza, H.P. Litterfall and Nutrient Return in Eucalyptus dunnii Maiden in the Pampa Biome, Brazil. J. Agric. Sci. 2019, 11, 362. [Google Scholar] [CrossRef]
  42. O’Connell, A.M.; Menage, P.M.A. Litter Fall and Nutrient Cycling in Karri (Eucalyptus diversicolor F. Muell.) Forest in Relation to Stand Age. Austral Ecol. 1982, 7, 49–62. [Google Scholar] [CrossRef]
  43. Nouvellon, Y.; Epron, D.; Marsden, C.; Kinana, A.; Le Maire, G.; Deleporte, P.; Saint-André, L.; Bouillet, J.-P.; Laclau, J.-P. Age-Related Changes in Litter Inputs Explain Annual Trends in Soil CO2 Effluxes over a Full Eucalyptus Rotation after Afforestation of a Tropical Savannah. Biogeochemistry 2012, 111, 515–533. [Google Scholar] [CrossRef]
  44. Berg, B.; Meentemeyer, V. Litter Fall in Some European Coniferous Forests as Dependent on Climate: A Synthesis. Can. J. For. Res. 2001, 31, 292–301. [Google Scholar] [CrossRef]
  45. Cromer, R.N.; Tompkins, D.; Barr, N.J.; Williams, E.R.; Stewart, H.T.L. Litter-Fall In a Pinus radiata Forest: The Effect of Irrigation and Fertilizer Treatments. J. Appl. Ecol. 1984, 21, 313. [Google Scholar] [CrossRef]
  46. Crockford, R.H.; Richardson, D.P. Litterfall, Litter and Associated Chemistry in a Dry Sclerophyll Eucalypt Forest and a Pine Plantation in South-Eastern Australia: 1. Litterfall and Litter. Hydrol. Process. 1998, 12, 20. [Google Scholar] [CrossRef]
  47. Raison, R.J.; Myers, B.J.; Benson, M.L. Dynamics of Pinus radiata Foliage in Relation to Water and Nitrogen Stress: I. Needle Production and Properties. For. Ecol. Manag. 1992, 52, 139–158. [Google Scholar] [CrossRef]
  48. Wienand, K.T.; Stock, W.D. Long-Term Phosphorus Fertilization Effects on the Litter Dynamics of an Age Sequence of Pinus elliottii Plantations in the Southern Cape of South Africa. For. Ecol. Manag. 1995, 75, 135–146. [Google Scholar] [CrossRef]
  49. Ribeiro, C.; Madeira, M.; Araújo, M.C. Decomposition and Nutrient Release from Leaf Litter of Eucalyptus globulus Grown under Different Water and Nutrient Regimes. For. Ecol. Manag. 2002, 171, 31–41. [Google Scholar] [CrossRef]
  50. Trofymow, J.A.; Moore, T.R.; Titus, B.; Prescott, C.; Morrison, I.; Siltanen, M.; Smith, S.; Fyles, J.; Wein, R.; Camiré, C.; et al. Rates of Litter Decomposition over 6 Years in Canadian Forests: Influence of Litter Quality and Climate. Can. J. For. Res. 2002, 32, 789–804. [Google Scholar] [CrossRef] [Green Version]
  51. Xu, S.; Liu, Y.; Cui, Y.; Pei, Z. Litter Decomposition in a Subtropical Plantation in Qianyanzhou, China. J. For. Res. 2011, 16, 8–15. [Google Scholar] [CrossRef]
  52. Harmon, M.E.; Naddlehoffer, K.J.; John, M. Blair Measuring decomposition, nutrient turnover and stores in plant litter. In Standard Soil Methods for Long Term Ecological Research; Robertson, G.P., Bledsoe, C.S., Coleman, D.C., Sollins, P.S., Eds.; Oxford University Press: New York, NY, USA, 1999. [Google Scholar]
  53. del Pino, A.; Hernández, J.; Arrarte, G. Descomposición de Residuos de Pinus taeda En Uruguay. In Jornadas de Actualización Técnica; Departamento de Suelos y Aguas: Sayago, Uruguay, 2010. [Google Scholar]
  54. Berg, B.; Johansson, M.-B.; Meentemeyer, V. Litter Decomposition in a Transect of Norway Spruce Forests: Substrate Quality and Climate Control. Can. J. For. Res. 2000, 30, 1136–1147. [Google Scholar] [CrossRef]
  55. Kim, C.; Jeong, J.; Cho, H.-S.; Son, Y. Carbon and Nitrogen Status of Litterfall, Litter Decomposition and Soil in Even-Aged Larch, Red Pine and Rigitaeda Pine Plantations. J. Plant Res. 2010, 123, 403–409. [Google Scholar] [CrossRef]
  56. Kiser, L.; Fox, T.; Carlson, C. Foliage and Litter Chemistry, Decomposition, and Nutrient Release in Pinus taeda. Forests 2013, 4, 595–612. [Google Scholar] [CrossRef]
  57. Chen, Y.; Zhang, Y.; Cao, J.; Fu, S.; Hu, S.; Wu, J.; Zhao, J.; Liu, Z. Stand Age and Species Traits Alter the Effects of Understory Removal on Litter Decomposition and Nutrient Dynamics in Subtropical Eucalyptus Plantations. Glob. Ecol. Conserv. 2019, 20, e00693. [Google Scholar] [CrossRef]
  58. Gholz, H.L.; Wedin, D.A.; Smitherman, S.M.; Harmon, M.E.; Parton, W.J. Long-Term Dynamics of Pine and Hardwood Litter in Contrasting Environments: Toward a Global Model of Decomposition. Glob. Change Biol. 2000, 6, 751–765. [Google Scholar] [CrossRef]
  59. Zhang, M.; Cheng, X.; Geng, Q.; Shi, Z.; Luo, Y.; Xu, X. Leaf Litter Traits Predominantly Control Litter Decomposition in Streams Worldwide. Glob. Ecol. Biogeogr. 2019, 28, 1469–1486. [Google Scholar] [CrossRef]
  60. Woo, K.-S.; Fins, L.; McDonald, G.I.; Wenny, D.L.; Eramian, A. Effects of Nursery Environment on Needle Morphology of Pinus monticola Dougl. and Implications for Tree Improvement Programs. New For. 2002, 24, 113–129. [Google Scholar] [CrossRef]
  61. Sayer, E.J.; Tanner, E.V.J.; Lacey, A.L. Effects of Litter Manipulation on Early-Stage Decomposition and Meso-Arthropod Abundance in a Tropical Moist Forest. For. Ecol. Manag. 2006, 229, 285–293. [Google Scholar] [CrossRef]
  62. Leff, J.W.; Wieder, W.R.; Taylor, P.G.; Townsend, A.R.; Nemergut, D.R.; Grandy, A.S.; Cleveland, C.C. Experimental Litterfall Manipulation Drives Large and Rapid Changes in Soil Carbon Cycling in a Wet Tropical Forest. Glob. Chang. Biol. 2012, 18, 2969–2979. [Google Scholar] [CrossRef]
  63. Vasconcelos, S.S.; Zarin, D.J.; Capanu, M.; Littell, R.; Davidson, E.A.; Ishida, F.Y.; Santos, E.B.; Araújo, M.M.; Aragão, D.V.; Rangel-Vasconcelos, L.G.T.; et al. Moisture and Substrate Availability Constrain Soil Trace Gas Fluxes in an Eastern Amazonian Regrowth Forest. Glob. Biogeochem. Cycles 2004, 18. [Google Scholar] [CrossRef]
  64. Li, Y.; Xu, M.; Sun, O.J.; Cui, W. Effects of Root and Litter Exclusion on Soil CO2 Efflux and Microbial Biomass in Wet Tropical Forests. Soil Biol. Biochem. 2004, 36, 2111–2114. [Google Scholar] [CrossRef]
  65. Sayer, E.J. Using Experimental Manipulation to Assess the Roles of Leaf Litter in the Functioning of Forest Ecosystems. Biol. Rev. 2005, 81, 1–31. [Google Scholar] [CrossRef] [PubMed]
  66. Chen, H.; Gurmesa, G.A.; Liu, L.; Zhang, T.; Fu, S.; Liu, Z.; Dong, S.; Ma, C.; Mo, J. Effects of Litter Manipulation on Litter Decomposition in a Successional Gradients of Tropical Forests in Southern China. PLoS ONE 2014, 9, e99018. [Google Scholar] [CrossRef]
  67. Hui, D.; Zhang, D.; Norby, R.J. Field Litter Decomposition Rate Estimation: Does Incubation Starting Time Matter? In Proceedings of the 2011 International Conference on Multimedia Technology, Hangzhou, China, 26–28 July 2011; pp. 1558–1560. [Google Scholar]
  68. Constantinides, M.; Fownes, J. Nitrogen Mineralization from Leaves and Litter of Tropical Plants: Relationships to Nitrogen, Lignin and Soluble Polyphenol Concentrations. Soil Biol. Biochem. 1994, 26, 49–55. [Google Scholar] [CrossRef]
  69. Hättenschwiler, S.; Vitousek, P.M. The Role of Polyphenols in Terrestrial Ecosystem Nutrient Cycling. Trends Ecol. Evol. 2000, 15, 238–243. [Google Scholar] [CrossRef]
  70. Palm, C.A.; Gachengo, C.N.; Delve, R.J.; Cadisch, G.; Giller, K.E. Organic Inputs for Soil Fertility Management in Tropical Agroecosystems: Application of an Organic Resource Database. Agric. Ecosyst. Environ. 2001, 83, 27–42. [Google Scholar] [CrossRef]
  71. Piatek, K.B.; Allen, H.L. Are Forest Floors in Mid-Rotation Stands of Loblolly Pine (Pinus taeda) a Sink for Nitrogen and Phosphorus? Can. J. For. Res. 2001, 31, 1164–1174. [Google Scholar] [CrossRef]
  72. Chae, H.M.; Choi, S.H.; Lee, S.H.; Cha, S.; Yang, K.C.; Shim, J.K. Effect of Litter Quality on Needle Decomposition for Four Pine Species in Korea. Forests 2019, 10, 371. [Google Scholar] [CrossRef] [Green Version]
  73. Raison, R.J.; Woods, P.V.; Khanna, P.K. Dynamics of Fine Fuels in Recurrently Burnt Eucalypt Forests. Aust. For. 1983, 46, 294–302. [Google Scholar] [CrossRef]
  74. Raison, R.J.; Woods, P.V.; Khanna, P.K. Decomposition and Accumulation of Litter after Fire in Sub-Alpine Eucalypt Forests. Austral Ecol. 1986, 11, 9–19. [Google Scholar] [CrossRef]
  75. Gould, J.S.; Lachlan McCaw, W.; Phillip Cheney, N. Quantifying Fine Fuel Dynamics and Structure in Dry Eucalypt Forest (Eucalyptus marginata) in Western Australia for Fire Management. For. Ecol. Manag. 2011, 262, 531–546. [Google Scholar] [CrossRef]
  76. Kozlowski, T.T.; Pallardy, S.G.; Kramer, P.J. Physiology of Woody Plants, 2nd ed.; Academic Press: San Diego, CA, USA, 1997; ISBN 978-0-12-424162-6. [Google Scholar]
  77. Finotti, R.; Freitas, S.R.; Cerqueira, R.; Vieira, M.V. A Method to Determine the Minimum Number of Litter Traps in Litterfall Studies. Biotropica 2003, 35, 419–421. [Google Scholar] [CrossRef]
  78. Hu, Y.-L.; Zeng, D.-H.; Ma, X.-Q.; Chang, S.X. Root Rather than Leaf Litter Input Drives Soil Carbon Sequestration after Afforestation on a Marginal Cropland. For. Ecol. Manag. 2016, 362, 38–45. [Google Scholar] [CrossRef]
  79. Turner, J.; Lambert, M. Change in Organic Carbon in Forest Plantation Soils in Eastern Australia. For. Ecol. Manag. 2000, 133, 231–247. [Google Scholar] [CrossRef]
  80. Guo, L.B.; Cowie, A.L.; Montagu, K.D.; Gifford, R.M. Carbon and Nitrogen Stocks in a Native Pasture and an Adjacent 16-Year-Old Pinus radiata D. Don. Plantation in Australia. Agric. Ecosyst. Environ. 2008, 124, 205–218. [Google Scholar] [CrossRef]
  81. Lima, A.M.N.; Silva, I.R.; Neves, J.C.L.; Novais, R.F.; Barros, N.F.; Mendonça, E.S.; Smyth, T.J.; Moreira, M.S.; Leite, F.P. Soil Organic Carbon Dynamics Following Afforestation of Degraded Pastures with Eucalyptus in Southeastern Brazil. For. Ecol. Manag. 2006, 235, 219–231. [Google Scholar] [CrossRef]
  82. Smith, P. How Long before a Change in Soil Organic Carbon Can Be Detected? Glob. Change Biol. 2004, 10, 1878–1883. [Google Scholar] [CrossRef]
  83. Berg, B.; McClaugherty, C.; Santo, A.V.D.; Johnson, D. Humus Buildup in Boreal Forests: Effects of Litter Fall and Its N Concentration. Can. J. For. Res. 2011. [Google Scholar] [CrossRef]
  84. Prescott, C.E. Litter Decomposition: What Controls It and How Can We Alter It to Sequester More Carbon in Forest Soils? Biogeochemistry 2010, 101, 133–149. [Google Scholar] [CrossRef]
  85. Paul, K.I.; Polglase, P.J.; Nyakuengama, J.G.; Khanna, P.K. Change in Soil Carbon Following Afforestation. For. Ecol. Manag. 2002, 168, 241–257. [Google Scholar] [CrossRef]
  86. Epron, D.; Marsden, C.; Thongo M’Bou, A.; Saint-André, L.; d’Annunzio, R.; Nouvellon, Y. Soil Carbon Dynamics Following Afforestation of a Tropical Savannah with Eucalyptus in Congo. Plant Soil 2009, 323, 309–322. [Google Scholar] [CrossRef]
Figure 1. Evolution of monthly accumulated precipitation (mm) (left Y axis) and vapor pressure deficit (KPa) (right Y axis) for the study period.
Forests 12 00349 g001
Figure 2. Evolution of mean relative humidity (%) (left Y axis) and mean temperature (°C) (right Y axis) for the study period.
Forests 12 00349 g002
Figure 3. Average dry weight of litter of E. grandis that fell seasonally during both years of evaluation. The vertical bars indicate the standard error of the mean (n = 3). Different letters indicate significant differences within the same year by Fisher’s least significant difference (LSD) test (p < 0.05).
Forests 12 00349 g003
Figure 4. Average dry weight of litter of P. taeda that fell seasonally during both years of evaluation. The vertical bars indicate the standard error of the mean (n = 3). Different letters indicate significant differences within the same year by Fisher’s LSD test (p < 0.05).
Forests 12 00349 g004
Figure 5. Models adjusted for litter remaining dry weight proportion of E. grandis (a) and P. taeda (b) for the different evaluation initiation moments considered, C1 (winter year 1), C2 (spring year 1) and C3 (summer year 1). The vertical bars indicate the standard error of the mean (n = 3).
Forests 12 00349 g005
Figure 6. Adjusted models for litter accumulation of E. grandis (a) and P. taeda (b). The vertical bars indicate the standard error of the mean (n = 3).
Forests 12 00349 g006
Table 1. Characteristics of A, AB and B horizons from nine soil profiles (mean and standard deviation) 1.
Hor. DepthClaySandSiltCpH aAlCaMgKNaTotal BasesCECeBase Sat.
(cm)(g kg−1)H2OKCl(cmolc kg−1)(%)
AMean0–48126548209.364.73.81.601.330.780.260.352.734.3363
Std. D.----(1.82)(0.1)(0.1)(0.45)(0.32)(0.17)(0.05)(0.05)(0.51)(0.61)(9)
ABMean48–66233876817.374.73.82.141.390.770.220.402.784.9258
Std. D.----(2.21)(0.1)(0.1)(0.87)(0.32)(0.21)(0.05)(0.02)(0.52)(1.04)(12)
BtMean66–903421165437.154.73.74.012.081.310.260.434.088.0951
Std. D.----(1.23)(0.1)(0.1)(1.36)(0.33)(0.34)(0.06)(0.07)(0.67)(1.71)(9)
1 Reprinted from Forest Ecology and Management, Volume 368, Jorge Hernández; Amabelia del Pino; Eric D. Vance; Álvaro Califra; Fabián del Giorgio; Leticia Martínez; Pablo González-Barrios, Eucalyptus and Pinus stand density effects on soil carbon sequestration, 28–38, Copyright (2016), with permission from Elsevier. Note: SOC: Soil organic C by Walkley–Black method; Extractable Al: extracted by KCl 1 M; Extractable bases: extracted by ammonium acetate 1 M; CECe: effective cation exchange capacity; Base Sat.: (total bases/CECe)/100. a pH: soil: solution relation v/v 1:2.5.
Table 2. Basic characteristics of trees and plantation area (mean of the three plots considered).
CharacteristicEucalyptus grandis Hill ex MaidenPinus taeda L.
Spacing 1 (m)3.5 × 3.53.5 × 3.5
Initial density (trees ha−1)816816
DBH 2 (cm)29.7031.70
Total Height (m)36.3022.50
1 Distance between rows and trees respectively. 2 DBH: diameter at breast height.
Table 3. Spearman’s correlation coefficients between the dry weight of seasonally fallen litter and seasonal climatic variables (n = 24).
VariableE. grandisP. taeda
Accumulated precipitation0.19 p = 0.3627−0.45 p = 0.0277
Mean relative humidity−0.75 p < 0.0001−0.28 p = 0.1791
Mean minimum relative humidity−0.60 p = 0.0019−0.36 p = 0.0865
Mean maximum relative humidity−0.59 p = 0.0026−0.11 p = 0.5992
Mean temperature0.65 p = 0.00060.41 p = 0.0467
Mean minimum temperature0.64 p = 0.00080.34 p = 0.1024
Mean maximum temperature0.25 p = 0.24470.80 p < 0.0001
Mean vapor pressure deficit0.72 p = 0.00010.38 p = 0.0663
Table 4. Initial characterization of the E grandis and P. taeda litter from the different layers evaluated.
CNSoluble CSoluble Pol.LigninC:NL:N
(g kg−1) 1
E. grandis
C1472.53 a (6.24)10.63 a (0.62)114.37 a (10.62)67.32 a (2.24)488.80 a (5.06)45 c (2)46 b (3.03)
C2468.79 a (4.50) 7.63 b (0.50)82.18 b (9.76)67.32 a (7.09)440.67 b (2.79)62 b (4)58 b (3.39)
C3441.04 b (6.10) 5.70 c (0.40)120.33 a (6.61)69.39 a (2.25)455.20 b (14.67)78 a (5)80 a (3.89)
P. taeda
C1421.34 a (18.47) 8.07 a (0.52)90.04 b (4.69)8.33 b (2.42)450.00 a (9.00)53 a (4)56 a (2.74)
C2451.12 a (8.44)9.27 a (0.92)126.77 a (12.88)22.31 a (2.90)469.07 a (1.54)50 a (4)51 a (5.39)
C3431.61 a (9.51)7.07 a (0.62)108.88 ab (8.91)23.45 a (3.35)475.87 a (13.96)62 a (4)68 a (6.28)
1 Different letters in the same column indicate significant differences within each species by Fisher’s LSD test (p < 0.05). C1: winter layer year 1, C2: spring layer year 1, C3: summer layer year 1, L:N: Lignin:N ratio, Soluble pol.: soluble polyphenols. The value in parentheses indicates the standard error of the mean (n = 3).
Table 5. Spearman’s correlation coefficients between the proportion of remaining litter and seasonal climatic variables (n = 63).
VariableE. grandisP. taeda
Accumulated precipitation−0.24 p = 0.0540−0.23 p = 0.0694
Mean relative humidity−0.41 p = 0.0007−0.46 p = 0.0002
Mean minimum relative humidity−0.61 p < 0.0001−0.64 p < 0.0001
Mean maximum relative humidity−0.48 p = 0.0001−0.50 p < 0.0001
Mean temperature0.04 p = 0.77940.13 p = 0.3184
Mean minimum temperature−0.07 p = 0.55990.03 p = 0.9815
Mean maximum temperature0.02 p = 0.88950.07 p = 0.5841
Mean vapor pressure deficit0.37 p = 0.00270.41 p = 0.0010
Table 6. Concentration and initial and final carbon stock (Ci and Cf) for the analyzed litter layers of E. grandis and P. taeda.
E. grandis1P. taeda1
LayersCiCfCiCfCiCfCiCf
(g kg−1)(Mg ha−1)(g kg−1)(Mg ha−1)
C1472.53 a (18.47)463.37 a (10.90)0.90 a (0.05)0.41 b (0.03)421.34 a (6.24)384.79 a (3.80)0.93 a (0.04)0.43 b (0.08)
C2468.79 a (8.44)435.68 a (25.53)1.77 a (0.01)0.82 b (0.08)451.12 a (4.50)421.30 a (9.97)1.07 a (0.06)0.57 b (0.09)
C3441.04 a (9.51)443.53 a (21.95)1.44 a (0.01)0.79 b (0.16)431.61 a (6.10)433.91 a (3.85)2.21 a (0.09)1.24 b (0.03)
1 Different letters in the same row indicate significant differences by paired t-test (p < 0.05) for each species individually. C1: winter layer year 1, C2: spring layer year 1, C3: summer layer year 1. The value in parentheses indicates the standard error of the mean (n = 3).
Table 7. δ13C values of the SOC under P. taeda, E. grandis and native pastures at the beginning and end of the study.
DepthNPE. grandisP. taedaComparisons
InitialFinalInitialFinalNP vs. EI 1NP vs. PI 1NP vs. EF 1NP vs. PF 1EI vs. PI 1EF vs. PF 1EI vs. EF 2PI vs. PF 2
(cm)(‰)
0–3−18.03 (0.07)−22.75 (0.56)−24.15 (0.22)−23.72 (0.06)−23.37 (0.25)0.0141<0.0001<0.0001<0.00010.22900.07930.06790.2707
3–6−17.53 (0.06)−19.22 (0.48)−19.83 (0.32)−19.91 (0.37)−20.78 (0.39)0.07440.00330.00220.01450.31950.13410.52710.0020
6–9−16.78 (0.26)−18.60 (0.10)−18.83 (0.27)−18.92 (0.32)−19.38 (0.43)0.00290.00650.00550.00670.38560.33790.31610.2173
9–12−16.26 (0.42)−17.69 (0.32)−17.92 (0.46)−18.46 (0.60)−18.64 (0.23)0.05340.04000.05580.00770.32040.23160.28190.6665
12–20−14.87 (0.11)−17.14 (0.23)−17.47 (0.43)−17.89 (0.51)−17.99 (0.48)0.00080.00450.00440.00320.25330.46400.37470.7397
0–20−16.24 (0.05)−18.95 (0.16)−19.78 (0.20)−19.63 (0.44)−19.75 (0.31)0.00010.01650.00010.00040.21590.92460.03200.5496
1 Values in bold indicate significant differences by t-tests for independent samples (p < 0.05). 2 Values in bold indicate significant differences by paired t-tests (p < 0.05). NP: native pastures; EI: initial records for E. grandis; EF: final records for E. grandis; PI: initial records for P. taeda; PF: final records for P. taeda. The value in parentheses indicates the standard error of the mean (n = 3).
Table 8. Soil organic C concentration under P. taeda, E. grandis and native pastures at the beginning and end of the study.
DepthNPE. grandisP. taedaComparisons
InitialFinalInitialFinalNP vs. EI 1NP vs. PI 1NP vs. EF 1NP vs. PF 1EI vs. PI 1EF vs. PF 1EI vs. EF 2PI vs. PF 2
(cm)(g kg−1)
0–315.43 (3.06)15.77 (1.94)18.91 (1.05)10.71 (1.84)9.44 (1.13)0.92990.25650.34250.13980.13170.00360.21130.3282
3–613.80 (3.13)9.86 (1.35)10.13 (0.70)7.53 (0.60)6.98 (1.13)0.31170.12060.31640.10960.19070.07680.73680.5198
6–911.35 (3.24)9.00 (0.79)8.93 (0.81)7.08 (0.87)7.65 (0.62)0.51950.27160.50860.32500.17630.28070.67180.4496
9–1210.26 (3.14)8.42 (0.11)8.34 (0.40)6.50 (0.46)6.91 (0.95)0.61770.35800.60580.36460.01530.23870.86030.5885
12–208.57 (2.07)7.74 (0.19)8.64 (0.53)6.25 (0.48)6.39 (0.45)0.72820.33580.97550.36170.04530.03200.12810.4123
0–2011.13 (2.79)9.43 (0.60)10.18 (0.63)7.28 (0.65)7.23 (0.75)0.58340.25020.75690.24790.07190.04000.10500.6468
1 Values in bold indicate significant differences by t-tests for independent samples (p < 0.05). 2 Values in bold indicate significant differences by paired t-tests (p < 0.05). NP: native pastures; EI: initial records for E. grandis; EF: final records for E. grandis; PI: initial records for P. taeda; PF: final records for P. taeda. The value in parentheses indicates the standard error of the mean (n = 3).
Table 9. SOC stock under P. taeda, E. grandis and native pastures at the beginning and end of the study.
Depth NPE. grandisP. taedaComparisons
InitialFinalInitialFinalNP vs. EI 1NP vs. PI 1NP vs. EF 1NP vs. PF 1EI vs. PI 1EF vs. PF 1EI vs. EF 2PI vs. PF 2
(cm)(Mg ha−1)
0–36.07 (1.20)6.20 (0.76)7.43 (0.41)4.21 (0.72)3.71 (0.44)0.92990.25620.28760.23470.13170.00360.21130.3282
3–65.54 (1.29)3.60 (0.61)3.57 (0.30)3.04 (0.25)2.82 (0.46)0.24530.12950.24310.14060.44580.24680.93760.5199
6–94.85 (1.42)3.83 (0.33)3.79 (0.36)3.04 (0.37)3.28 (0.27)0.52320.28310.49710.34320.18200.32470.59530.4496
9–124.31 (1.33)3.55 (0.05)3.51 (0.18)2.73 (0.19)2.90 (0.40)0.62570.35960.52620.32590.01380.23950.82000.5901
12–208.51 (2.10)7.62 (0.19)8.49 (0.52)6.15 (0.48)6.30 (0.45)0.71480.33410.53190.20470.03300.04600.12370.3978
0–2029.28 (7.33)24.80 (1.58)26.79 (1.67)19.17 (1.70)19.01(1.99)0.58340.25020.63100.23030.07190.04000.10500.6468
1 Values in bold indicate significant differences by t-tests for independent samples (p < 0.05). 2 Values in bold indicate significant differences by paired t-tests (p < 0.05). NP: native pastures; EI: initial records for E. grandis; EF: final records for E. grandis; PI: initial records for P. taeda; PF: final records for P. taeda. The value in parentheses indicates the standard error of the mean (n = 3).
Table 10. Young SOC stock under P. taeda, E. grandis and native pastures at the beginning and end of the study.
Depth E. grandisP. taedaComparisons 1
α (2017)α (2019)Dif.α (2017)α (2019)Dif.EI vs. PI 1EF vs. PF 1EI vs. EF 2PI vs. PF 2E Dif vs. P Dif 1
(cm)(Mg ha−1)
0–32.37 (0.05)3.78 (0.11)1.42
(0.15)
2.12 (0.37)1.73 (0.15)−0.38
(0.22)
0.56880.00040.01120.22700.0026
3–60.46 (0.10)0.66 (0.13)0.21
(0.22)
0.62 (0.13)0.77 (0.16)0.15
(0.09)
0.37240.63300.43890.23960.8116
6–90.52 (0.03)0.58 (0.02)0.06
(0.03)
0.51 (0.10)0.69 (0.19)0.18
(0.10)
0.92980.61100.22900.19910.2957
9–120.37 (0.07)0.43 (0.09)0.06
(0.05)
0.45 (0.05)0.53 (0.11)0.08
(0.10)
0.39060.50310.36300.50710.8921
12–201.14 (0.14)1.46 (0.32)0.32
(0.19)
1.24 (0.14)1.32 (0.14)0.08
(0.11)
0.64900.70620.23650.53850.3298
0–204.86 (0.15)6.92 (0.64)2.06
(0.49)
4.95 (0.71)5.05 (0.53)0.11
(0.23)
0.90860.08730.05270.68510.0232
1 Values in bold indicate significant differences by t-tests for independent samples (p < 0.05). 2 Values in bold indicate significant differences by paired t-tests (p < 0.05). EI: initial records for E. grandis; EF: final records for E. grandis; PI: initial records for P. taeda; PF: final records for P. taeda; α (2017): young SOC contributed from 2003 to 2017; α (2019): young SOC contributed from 2003 to 2019; Dif.: difference between α (2019) and α (2017). The value in parentheses indicates the standard error of the mean (n = 3).
Publisher’s Note: MDPI stays neutral with regard to jurisdictional claims in published maps and institutional affiliations.

