Abstract
Robinia pseudoacacia L. has been widely planted worldwide for a variety of purposes, but it is a nonindigenous species currently invading the central part of Japanese river terraces. To understand and control this invasion, we investigated how this species invests nitrogen resources in different functions depending on the leaf location, and how these resources are used in physiological reactions such as photosynthesis. The Tama river terrace was examined in Tokyo, Japan. The leaf nitrogen (N) concentration, chlorophyll (Chl) concentration, Chl a/b ratio, leaf mass per unit area (LMA) and ribulose-1,5-bisphosphate carboxylase oxygenase (RuBisCo) concentration were all significantly lower in shade leaves than in leaves exposed to the sun. Conversely, the net photosynthetic rate in saturated light conditions (Pmax), the net photosynthetic rate under enhanced CO2 concentration and light saturation (Amax), the maximum carboxylation rate of RuBisCo (Vcmax) and the maximum rate of electron transport driving RUBP regeneration (Jmax) were all significantly lower in shade leaves than in leaves exposed to the sun. We also found that RuBisCo/N and Chl/N were significantly less in shade leaves, and values of Jmax/N, Vcmax/N less in shade leaves than in sun leaves, but not significantly. Allocation of nitrogen in leaves to photosynthetic proteins, RuBisCo (NR) was broadly less in shade leaves, and NL (light-harvesting complex: LHC, photosystem I and II: PSI and PSII) and NE (electron transport) were also lower. The N remaining was much greater in shade leaves than in sun leaves. We suggest that N remobilization from RuBisCo is more efficient than remobilization from proteins of NE, and from NL. This study shows that R. pseudoacacia has an enhanced ability to adapt to environmental changes via characteristic changes in N allocation trade-offs and physiological traits in its sun and shade leaves.
1. Introduction
Robinia pseudoacacia L. (the black locust) is a deciduous legume and is a native tree species in North America. This is one of the most widely planted woody species in the world used as a pioneer during the early stage of succession, because of its adaptability to environmental stress, its high photosynthetic rate and its rapid growth [1,2]. Furthermore, R. pseudoacacia is a nitrogen (N) fixing tree, which is able to fix N2 from the atmosphere with the help of N-fixing bacteria. In forest ecosystems it can therefore increase the soil N concentration and N cycling by producing N-rich litter [3,4,5]. For these reasons, this species has been frequently planted in Japan in degraded areas, roadsides, seacoasts and riverbanks for greening since 1873, when Japanese encountered it at the 1873 Vienna International Exposition [6,7,8]. It is also used today as the main source of nectar, providing half of the domestic honey production in Japan.
R. pseudoacacia has high growth and distribution potential, and its habitat area has been expanding through natural regeneration in recent years in Japan and elsewhere [6,9,10]. Since R. pseudoacacia not only fixes N2 with large carbon (C) and N soil deposition, but also produces allelochemicals, where R. pseudoacacia forests have been introduced there is usually low biodiversity. R. pseudoacacia propagates by seeds and root suckers, and it has become a large-sized naturalized invasive plant having large interconnected colonies in untended areas and river terraces, leading to a negative impact on biodiversity in the Japanese ecosystem [11,12,13]. A reduction in plant species richness in coastal pine forests and river terraces has been observed after invasion by R. pseudoacacia [6]. Similar phenomena have been described worldwide [5,14,15]. This species reduces biodiversity in river terrace forest ecosystems, narrows river width and changes the original landscape, leading to difficulties in river management [6,13]. R. pseudoacacia is listed as one of the 100 most invasive alien species in Japan [16].
A decrease in biodiversity has been reported in the Tama river basin in the central part of Japan [17,18]. The Tama river is a class A river and forms a 1240 km2 watershed along its 138 km length, flowing through suburban and urban areas of Tokyo Metropolis and Kanagawa Prefecture having a population of about 5 million. R. pseudoacacia was planted in the headwaters of the upper Tama river before World War II as part of a soil conservation project for land damaged by the Great Kanto Earthquake of 1923 [17,19]. In this area, wood land expansion and afforestation have progressed rapidly since the 1980s due to R. pseudoacacia [20,21]. Since the construction of the Ogochi Dam on the Tama River in 1957, the invasion of exotic plants has accelerated in the floodplains downstream, and many pioneering native species have disappeared [22]. This early successional tree spreads rapidly, creates dark shade stands and has interesting biological properties that surpass nearby plants. Expansion of R. pseudoacacia’s area of distribution is expected to be even faster under environmental changes such as increasing atmospheric CO2 concentration [23]. So, the invasive spread of R. pseudoacacia is not just a problem in Japan, but more widely.
There is growing awareness of the seriousness of the biodiversity decline and of the dominance of R. pseudoacacia in the Tama river basin, but only limited understanding of its ecophysiological traits in natural environments. Solar radiation under natural conditions is a limiting resource for many trees, as photosynthesis and growth depend on light. The spectral quality of photosynthetically active radiation (PAR) and irradiance inevitably change in the natural environment. The energy capture of a whole single tree depends on the photosynthetic reactions in its various leaves and on their inclusion in an effective canopy and the cost of generating and maintaining their photosynthetic capacity under limited nitrogen resources. Multiple studies have reported that differences between sun and shade leaves in leaf nitrogen (N) concentration, chlorophyll (Chl) concentration and a/b ratios, leaf architecture and anatomy such as leaf mass per area (LMA) and photosynthetic rates are all strongly correlated with the vertical light gradient within tree canopies [24,25,26,27]. Sun leaves often have higher LMA and N concentration, thicker palisade parenchyma tissues, and more mesophyll cells, which together support higher photosynthetic rates on an area basis than shade leaves. The results of these studies therefore support the optimal resource partitioning hypothesis of maximized canopy photosynthetic production. Additionally, this may be associated with the changes in the internal structure of the leaf (to permit a rapid rate of gas exchange) and less investment of carbon and nitrogen into RuBisCo. Consequently, it is also important that trees partition resources between sun and shade leaves optimally and arrange for these leaves to have differing traits. The effect upon leaf N allocation of differing irradiance regimes within similar canopies has scarcely been studied [28].
The purpose of this study is to investigate the physiological responses of sun and shade leaves in R. pseudoacacia in the Tama river basin, depending on irradiance. This study focuses on the physiological traits of sun leaves and shade leaves in R. pseudoacacia, looking at LMA, leaf N concentration, photosynthetic parameters relating to RuBisCo, chlorophyll and N concentration, and N allocation patterns in the whole single tree. We hypothesized that sun leaves would have the greater photosynthetic capacity due to higher Chl, RuBisco and N concentrations, whereas, shade leaves would have the lower net photosynthetic capacity, because of very low Chl, RuBisCo and N concentrations. In addition, sun and shade leaves are expected to change leaf morphological traits and to have different N utilization properties to effectively use limited resources such as light and N effectively.
2. Materials and Methods
2.1. Study Site and Plant Material
The study was conducted on the river terrace forest of Tama river in Fuchu city, Tokyo, Japan (35°39′10″N, 139°28′20″E). The Tama river is one of the Japanese national class A river running through Kanagawa prefecture and Tokyo metropolitan, and the headwaters are on Mt. Kasatori in Yamanashi prefecture. The mean annual temperature and mean annual precipitation at the study site for the last 5 years were 15.7 °C and 1608.5 mm. The mean atmospheric CO2 concentration in Japan for the previous 5 years was 403.6 ppm [29]. In the upper reaches of the Tama river was afforested with Pinus thunbergii and R. pseudoacacia ca. 50 years ago, although the ratio of planting density of P. thunbergii to R. pseudoacacia was not recorded. In recent years, there has been a remarkable expansion of the distribution R. pseudoacacia in this study site.
In early September of 2018, six healthy R. pseudoacacia trees with no visible damage (e.g., disease, yellowing or defoliation) were randomly selected at the river terrace. The selected six R. pseudoacacia trees were similar in tree height (about 4.5 m) and diameter at breast height (5.2 ± 0.5 cm), and estimated to have spread naturally about 10 years ago. We collected sun-exposed leaves and shade leaves from randomly selected three branches of six individual R. pseudoacacia trees. For each measurement, three sun leaves and three shaded leaves from the upper and lower leaves of the canopy in each tree, and six trees were selected. Sun leaves and shade leaves in the canopy received over 1500 µmol m−2 s−1 and up to 200 µmol m−2 s−1 of the photosynthetic photon flux density (PPFD). Sampling and measurements on the sun and shade leaves of six individual R. pseudoacacia trees were made on clear rainless days after measuring the net photosynthetic rate. Leaves grown at each sunlight condition were collected for chemical analysis. We determined the N, Chl and RuBisCo concentration, and made morphological measurements, namely the LMA and observation of transverse sections from the six individual trees in early September.
2.2. Photosynthetic Rate
The photosynthetic light response curves (PN/PPFD curves) were studied for sun-exposed leaves and shade leaves from three branches of six individual R. pseudoacacia trees using an open gas exchange system (Li-6400, Li-Cor, Lincoln, NE, USA) combined with an integrated fluorescence chamber head (Li-6400-40, Li-Cor) between 09:00 and 14:00 local time. The PN/PPFD curves for sun exposed leaves and shade leaves were measured under chamber conditions of 25 °C, a CO2 concentration of 400 μmol·mol−1, and relative humidity 60–70%. We changed the photosynthetic photon flux density (PPFD) from high to low (1800, 1500, 1000, 700, 350, 200, 100, 50 and 0 µmol m−2s−1). PN/PPFD curves and the net photosynthetic rate at light saturate (Pmax) were constructed from the resulting data, using the formula [30].
where PN is the net photosynthetic rate, Pmax is the maximum photosynthetic rate at light saturation, α is the initial gradient of the curve, I is the PPFD, θ is the convexity of the light response curve and Rd is the respiration rate at 0 µmol m−2 s−1 PPFD [31].
The same samples were used to measure net photosynthetic rate/intercellular CO2 concentration (PN/Ci) curves, after confirming that no photoinhibition had occurred during the measurements of the PN/PPFD curve by remeasuring the photosynthetic rate at 1500 μmol m−2s−1, which is considered to be optimal for RuBisCo activity [23,31,32,33,34]. The PN/Ci curve was measured with a CO2 mixer for the sequence of concentrations 400, 300, 200, 100, 50, 100, 200, 400, 600, 800, 1200 and 1500 μmol·mol−1. Measurements were performed under chamber conditions at a relative humidity of 60–70% and leaf temperature 25 °C. The stomatal conductance to water vapor (gs, mmol m−2s−1) was measured after ca. 20 min of exposure to saturating irradiance (1500 µmol m−2s−1) when the stomata had fully opened. From the PN/Ci curves, we calculated the maximum carboxylation rate of RuBisCo (Vcmax), the maximum rate of electron transport (Jmax), the net photosynthetic rate under enhanced CO2 concentration and light saturation (Amax) and other relevant parameters were using the Farquhar–von Caemmerer–Berry (FvCB) model [35,36,37,38,39]. Additionally, Vcmax was calculated to the initial slope of the PN/Ci curves (Ci < 300 µmol m−2 s−1) with the least square method using Kaleida Graph software (Ver 4.11, Synergy Software, PA, USA). After measurement of the photosynthetic rate, three disk samples (1 cm2) were punched out of each leaf, avoiding the midrib, for determination of the LMA, nitrogen content and total Chl. The rest of the leaves were immediately stored in a portable liquid nitrogen tank and placed in a deep freeze (−85 °C) prior to measurement of the RuBisCo concentration.
2.3. Chlorophyll Fluorescence
After the photosynthetic rate measurements on individual sun-exposed and shade leaves from three branches of six R. pseudoacacia trees, chlorophyll fluorescence was measured. The minimum fluorescence (Fo) and maximum fluorescence (Fm) were determined following 30 min of acclimation to darkness. The maximal quantum yield of photosystem II (Fv/Fm) was calculated (where Fv = Fm − Fo). Thirty measurements were made for each of sun and shade leaves. Chlorophyll fluorescence was measured with a white leafclip to prevent overheating of leaf tissue upon dark acclimation, together with a chlorophyll fluorometer (OS-30P, OptiSciences, Hudson, NH, USA) [40].
2.4. LMA and Leaf Nitrogen Concentration
After measurement of the photosynthetic rate, the 1 cm2 disks were used to determine the leaf mass per unit area (LMA, g(leaf)·m−2(leaf)). Leaf N concentration per unit leaf area (N, g(N) m−2(leaf)) was determined using a N-C analyzer (NC-900, Shimadzu, Kyoto, Japan) after the samples had been dried at 60 °C for one week. The N concentration was calibrated and checked again a known standard (acetanilide: N = 10.36%, C = 71.09%; Wako Chemical, Osaka, Japan). In most data sets, leaf N and LMA were determined using the same leaf as was used in the photosynthesis measurements.
2.5. Chlorophyll and RuBisCo Concentration in Leaves
Chlorophyll in the sun and shade leaves from three branches of six R. pseudoacacia trees was extracted with dimethyl sulfoxide (DMSO) and measured using a spectrophotometer (1800U, Hitachi, Tokyo, Japan). The following formula was used to calculate the concentration of chlorophyll a and b [41,42]:
Chl a (µg·mg−1) = (14.85 A665 − 5.14 A648) × (a/b)
Chl b (µg·mg−1) = (25.48 A665 − 7.36 A648) × (a/b)
Chl b (µg·mg−1) = (25.48 A665 − 7.36 A648) × (a/b)
The RuBisCo content was determined by sodium dodecyl sulfate-polyacrylamide gel electrophoresis (SDS-PAGE) from eighteen leaf disks [23,43,44,45]. The leaves were stored at −85 °C prior to this observation. Leaf disks (4 cm2) were punched out of sun and shade leaves, and were homogenized in 10 mM Na-phosphate buffer (pH 7.5) containing 0.4 M sorbitol, 2 mM magnesium chloride (MgCl2), 10 mM sodium chloride (NaCl), 5 mM iodoacetic acid (C2H3IO2), 1% (w/v) β-mercaptoethanol (C2H6OS) and 2% (w/v) polyvinylpyrrolidone ((C6H9NO)n), together with acid-washed quartz sand. The homogenate was centrifuged at 10,000× g for 1 min at 4 °C. The resulting supernatant fluid was treated with SDS solution for 1 min at 100 °C. The gel was stained with Coomassie Brilliant Blue R-250 (CBB), and the RuBisCo large subunit was extracted with formamide, facilitating spectrophotometric determination of RuBisCo. A calibration curve was made with bovine albumin (Sigma-Aldrich, St. Louis, MO, USA) [23,46].
2.6. N Allocation Pattern
Nitrogen allocation to NL (light-harvesting complex (LHC), PSI and PSII), NE (electron transport proteins except NL and the carbon cycle proteins except NR) and NR (RuBisCo) as components of the total N concentration were calculated using the formula of Kitaoka and Koike [44]:
where [Chl] is the calculated Chl a + b concentration (mmol m−2) [47],
NL = [Chl] × 37.1 × 14
NE = Jmax/156 × 10 − 3 × 9530 × 14
Here, NE is calculated according to the method of Hikosaka and Terashima [48] and Niinemets and Tenhunen [49].
The value of Jmax is calculated from Farquhar et al. [35] as follows:
where PN is the net photosynthetic rate, J is the potential electron transport rate, Ci is the intercellular concentration of CO2 (μmol mol−1), Г* is the CO2 compensation point (μmol mol−1), Rd denotes day respiration (μmol mol−1) and Г* = 3.69(kPa) [50]. Additionally,
In this formula α is the quantum utilization light conversion efficiency, Q is the photosynthetic photon flux density of light saturation (μmol mol−1) and α = 0.18 [51]. Finally,
where N is calculated by the method of Evans and Seemann [47].
NR = RuBisCo (g m−2) × 0.204
The method of calculation of N allocation was described in detail in our previous paper [23].
2.7. Statistical Analysis
Statistical analyses were performed using the R software (version 4.0.3; RStudio Desktop 1.4.1103; http://cran.r-project.org/). The effects of leaf position (sun and shade leaves) on N, Chl and RuBisCo concentration, LMA and other leaf traits were analyzed through the analysis of variance (ANOVA). The ANOVA procedure (proc ANOVA) and lm command were used for R, and test results are displayed as mean ± SE.
3. Results
3.1. Nitrogen, RuBisCo and Chl Concentration, and Structural Characteristic in Sun and Shade Leaves
Significantly higher N and RuBisCo concentrations were observed in sun leaves than in shade leaves (Figure 1). Sun leaves had 23% greater N concentration than shade leaves (p < 0.001). Sun leaves contained 2.8 times greater RuBisCo concentration than shade leaves (p < 0.001). Sun leaves tended to have higher RuBisCo concentration at the same level of leaf N concentration. Sun leaves tended to have 2856 mg m−2 additional RuBisCo content in given N content than shade leaves, but the slopes of the regression lines between sun and shade leaves were not different (p = 0.190; Figure 2a). Significant differences were found between sun and shade leaves in Chl a, b, their sum, and the a/b ratio (Table 1; Figure 2b). Sun leaves had significantly higher Chl a, b and higher Chl a/b ratio than shade leaves (p < 0.05). The LMA for sun leaves was 146.53 g m−2, and for shade leaves was 115.31 g m−2 (22% less than sun leaves, p < 0.001).
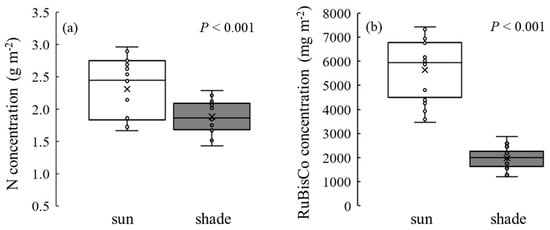
Figure 1.
(a) N and (b) RuBisCo contents in sun and shade leaves of Robinia pseudoacacia. Values represent mean ± SE. ANOVA was used to test the difference between the leaf position at the 0.05 alpha level.
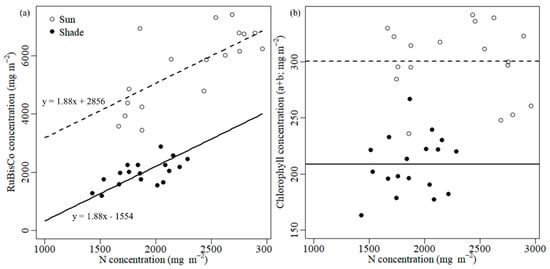
Figure 2.
Relationship between N vs. (a) RuBisCo and N vs. (b) Chl concentrations in sun and shade leaves of Robinia pseudoacacia. Dashed and solid lines stand for (a) estimated regression lines and (b) means of sun and shade leaves, respectively.

Table 1.
Chlorophyll (Chl) content (a, b, a + b), Chl a/b ratio, maximal quantum yield of photosystem II (Fv/Fm), and leaf mass per area (LMA) for sun and shade leaves of Robinia pseudoacacia. Values represent mean (SE in parentheses). ANOVA was used to test the difference between the leaf position at the 0.05 alpha level.
3.2. Photosynthetic Responses and Physiological Traits
The photosynthetic light response curve (PN/PPFD curve) for sun and shade leaves of R. pseudoacacia are shown in Figure 3, and parameter estimates are set out in Table 2. Based on these parameter estimates, the Pmax value for sun and for shade leaves were respectively 25.84 and 13.49 μmol m−2s−1 (48% less, p < 0.001); see Table 2. At saturated PPFD, Pmax was linearly correlated (Pmax = 0.0437gs; R2 = 0.98) with maximum stomatal conductance (gs), as shown in Figure 4. The gs values of sun leaves were always significantly higher than for shade leaves. The value of Rd for sun leaves was 1.81 μmol m−2 s−1, and for shade leaves was 0.74 μmol m−2 s−1 (59% less than sun leaves, p < 0.001). The net photosynthetic rate under enhanced CO2 concentration and light saturation (Amax) for sun and shade leaves was respectively 35.43 and 25.02 μmol m−2s−1 (p < 0.001) (Table 2; Figure 5). The Vcmax values estimated from the PN/Ci curve for sun and shade leaves were 15.92 and 10.37 μmol m−2 s−1, respectively. The Jmax values were estimated as 148.26 and 103.67 μmol m−2 s−1 for sun and shade leaves, respectively. Differences between sun and shade leaves in the estimates of Vcmax and Jmax were statistically significant (p < 0.001 in each case).
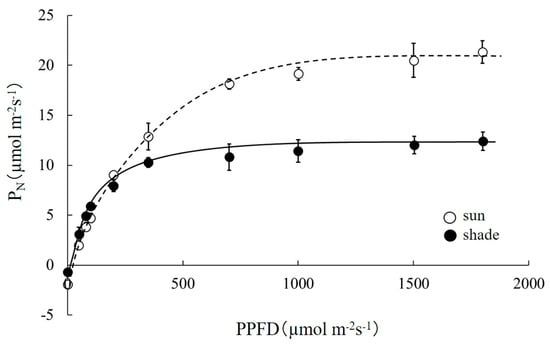
Figure 3.
Response of the net photosynthetic rate to photosynthetic photo flux density (PPFD) for sun and shade leaves of Robinia pseudoacacia. Values represent mean ± SE.
Table 2.
Estimated parameters of the photosynthetic rate curves for sun and shade leaves of Robinia pseudoacacia. Values represent mean (SE in parentheses). ANOVA was used to test the difference between the leaf position at the 0.05 alpha level.
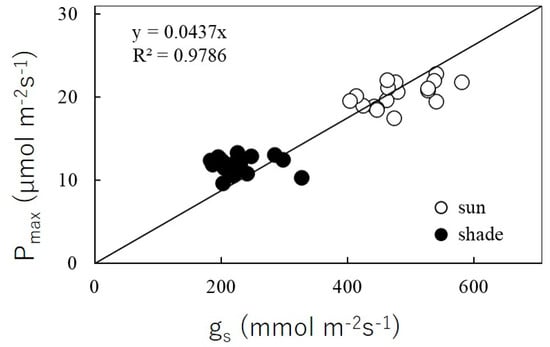
Figure 4.
Relationship between maximum CO2 assimilation rate (Pmax) and maximum stomatal conductance (gs) at saturated photosynthetic photon flux density (PPFD = 1500 µmol m−2s−1).
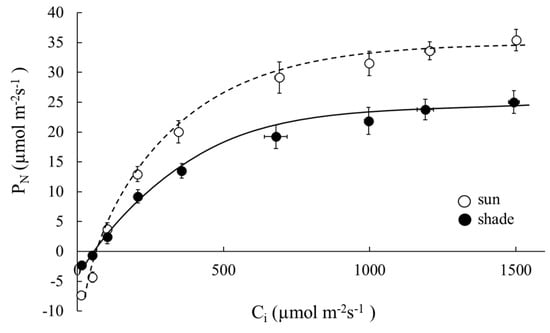
Figure 5.
Response of the net photosynthetic rates to intercellular CO2 concentration for sun and shade leaves of Robinia pseudoacacia. Values represent mean ± SE.
Table 3 shows the RuBisCo/N, Chl/N, Jmax/N, Vcmax/N and Jmax/Vcmax of sun and shade leaves of R. pseudoacacia. The RuBisCo/N of R. pseudoacacia for sun leaves was 2.45 g m−2/g m−2, and for shade leaves was 1.05 g m−2/g m−2. The RuBisCo/N in shade leaves was significantly less (by 57%) than in sun leaves (p < 0.001). Values of Jmax/N and Vcmax/N were sharply higher in sun leaves than in shade leaves, but the difference was not significant. Conversely, Chl/N was significantly lower (by 22%) in shade leaves than in sun leaves (p = 0.012). The ratio of the capacities of RuBP regeneration to RuBP carboxylation (Jmax/Vcmax) was similar value in sun and shade leaves. A higher maximal quantum yield of photosystem II (Fv/Fm) was also observed in sun leaves than shade leaves (p = 0.006).
Table 3.
RuBisCo/N, Chl/N, Vcmax/N, Jmax/N and Jmax/Vcmax of Robinia pseudoacacia in sun and shade leaves, and relative changes between these leaf positions. Values represent mean (SE in parentheses). The significance of the leaf position is indicated by the p value (ns = nonsignificant). ANOVA was used to test the difference between the leaf position at the 0.05 alpha level.
3.3. Nitrogen Allocation Patterns
The total N concentration in sun and shade leaves was 2.3 and 1.9 g m−2 respectively. The most notable difference in N allocation patterns was observed in the proportion of RuBisCo and remaining N (Figure 6). N allocated to RuBisCo was less in shade leaves than in sun leaves, from 49.9% to 21.5%. Remaining N was greater in shade leaves (66.4%) than in sun leaves (35.8%). Slightly lower proportions of N were allocated for chlorophyll and electron transport (5.4% and 7.0%, respectively) in shade leaves than sun leaves (6.0% and 8.3% for NL and NE, respectively).
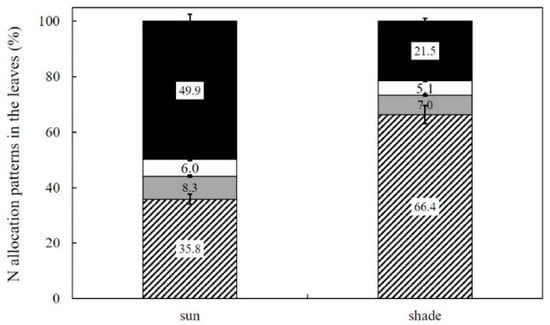
Figure 6.
N allocation patterns in sun and shade leaves (%) of Robinia pseudoacacia. The black part of the column denotes N allocated to RuBisCo (NR); the white portion denotes N allocated to the light-harvesting complex (LHC), PSI and PSII (NL); the dark-gray part denotes N allocated to electron transport proteins (NE), and the diagonally hatched box denotes the rest. Values represent mean ± SE.
4. Discussion
Leaf traits change due to the light gradient from the top to the lower parts of the crown and a variety of traits have evolved for efficient light harvesting and utilization. The leaf structure changes represented by LMA is very responsive to the light gradient set up within the canopy, and is positively correlated with the leaf N concentration of the sun and shade leaves calculated on a leaf area basis. Our results show that the sun leaves of R. pseudoacacia are characterized by higher levels of LMA and N concentration (Figure 1, Table 1) than shade leaves. Similar observations have been made in N-fixing trees and other broadleaf tree species, in which the LMA decreases in specimens in shaded light conditions [28,43,52,53]. High LMA is a leaf property that regulates light suppression under full irradiance in the sunlight canopy layer (sun leaves), whereas low LMA assists in maintaining and optimizing the light absorbing surface of leaves grown in the shaded environment of the low canopy layer (shade leaves) [54,55]. As well as LMA, the Chl concentrations (a, b and a+b) and Chl a/b ratio on a leaf area basis were significantly greater in sun leaves than in shade leaves of R. pseudoacacia (p < 0.05) (Figure 2, Table 1). Significantly higher values of the Chl a/b ratio were also found in sunlit leaves at the upper canopy level of four broadleaf tree species, relative to leaves in the lower canopy level [56,57].
Additionally, sun leaves had higher rates of physiological activity than shade leaves (Figure 3, Figure 4 and Figure 5; Table 2). Differences in the photosynthetic rate and the light-saturated photosynthetic rate (Pmax) between sun and shade leaves per unit leaf area matched those in several other broadleaf tree species [56,57,58,59,60] and coniferous tree species [61,62]. In general, the photosynthetic rate in sun leaves is consistent with a greater amount of N per unit leaf area in sun leaves than in shade leaves, and these contain a high level of Chl per leaf area (Figure 2 and Figure 3). Leaf Chl concentration is also a key factor in determining the photosynthetic rate [31,63]. On a leaf area basis, sun leaves have significantly higher Chl concentration than shade leaves. It is suggested that because the leaf structure of the sun and shade leaves is different. The reductions we observed in the Chl a/b ratio in shade leaves relative to sun leaves are due mainly to significant decreases in Chl a (34%) rather than Chl b (14%), most likely caused by changes in the organization of light harvesting and electron transport components; see Table 2 [64]. Additionally, the Chl concentration was less in shade leaves, suggesting that light intensities greater than that of shaded conditions may seriously impair or totally inactivate the photosynthetic system [65]. A further point is that Rd is significantly less in shade leaves than in sun leaves. Modification of Rd has been widely proposed as part of acclimation to light availability [66]. Leaves grown under shaded conditions are known to optimize their effectiveness of light absorption by increasing their pigment density per unit leaf area, and suffer lower carbon losses via Rd than sun leaves [66,67]. It has also been suggested that the associated advantages of high photosynthetic capacity (high metabolic potential) cannot be realized in shaded conditions [68,69]. It is further possible that the higher N level per unit leaf area in sun leaves results in a higher RuBisCo and Chl concentration than in shade leaves, and subsequently in the stimulation of the CO2 assimilation rate with higher stomatal conductance at high irradiance (Figure 1, Figure 2 and Figure 3), consistent with previous findings [27,57,70,71]. Moreover, sun leaves have a much higher maximum stomatal conductance (gs) than shade leaves (Figure 4). This may indicate that they can open their stomata much more than shade leaves. Leaf temperature is determined by ambient temperature and light intensity, but also under control of leaf physical traits and transpiration (e.g., stomatal conductance). When leaves are exposed to sunlight, they can avoid high light damage by reducing the amount of radiation they receive via heat convection and transpiration. As a result, sun leaves had higher gs and Pmax than shade leaves. This is of course an essential prerequisite for higher photosynthetic rates.
Analysis of leaf physiological parameters such as Jmax, Vcmax, etc., for sun and shade leaves is crucial to understanding the physiological properties of R. pseudoacacia. Values of Vcmax, Jmax and photosynthetic activity are strongly correlated with RuBisCo concentration, leaf structure (LMA), cytochrome and particularly leaf N concentration [23,30,72,73,74]. RuBisCo is the rate limiting enzyme in photosynthetic carbon assimilation and in photorespiratory oxygen reduction [23]. In this study, Jmax was 30% less in shade leaves than in sun leaves, and Vcmax was 35% less. Moreover, Amax was 29% less in shade leaves than in sun leaves. It is showed that the decrease in the photosynthetic rate, inclusive of Vcmax and Jmax, Chl and RuBisCo concentration in shade leaves, is due to a decrease in leaf N concentration with stomatal conductance (gs) (Figure 4 and Figure 5; Table 2). However, shade leaves have a low photosynthetic rate, but given the low gs, shade leaves are expected to be more undisturbed to water stress than sun leaves. These characteristics of sun and shade leaves of R. pseudoacacia are considered to be an important factor in adapting to the changing environment. Additionally, it is indicated that the increase in Jmax/Vcmax reduces the stimulation of photosynthesis by CO2, and that the photosynthetic rate is limited by RuBP carboxylation rather than RuBP regeneration in R. pseudoacacia in its shade leaves. Furthermore, RuBisCo/N in shade leaves was 57% less than in sun leaves (Table 3). Additionally, Vcmax/N and Jmax/N were respectively reduced in shade leaves by 29% and 17% relative to their values, with corresponding RuBisCo content. This observation illustrates that the reason for the reduction in RuBisCo content is that leaf N is not allocated in sufficient quantities to RuBisCo in shade leaves (Table 3; Figure 2).
As a result of the acclimation response to low irradiance, shade leaves of R. pseudoacacia with changed N allocation pattern considerably reduce PN on a leaf area basis compared with sun leaves. Changes in the N allocation patterns within the photosynthetic apparatus are an important mode of acclimation to changes in light, temperature and atmospheric CO2 ([23,75,76]. The N allocation to RuBisCo (NR) in shade leaves decreased dramatically from 49.9% to 21.5% compared to sun leaves; this is not true for N allocation to other photosynthetic proteins such as NE and NL (Figure 5). Shade leaves often have a lower LMA and N on an area basis, but a greater amount of N is allocated to Chl to enhance light capture and compensate for the lower irradiance in maintaining photosynthetic capability; N allocated to Chl (NL) decreased slightly, however [43,77,78]. The explanation is that R. pseudoacacia leaves grown in low irradiance conditions allocate N less rapidly to RuBisCo (NR; 49.9–21.5%) than to other photosynthetic proteins, such as NE (8.3–7.0%) and NL (6.0–5.1%). The N remaining in shade leaves was 66.4%, far greater than the value of 35.8% in sun leaves. The N allocation pattern within leaves suggests that RuBisCo is negatively correlated with low irradiance under natural environmental conditions, due to a trade-off between CO2 fixation and remaining proteins [47,48].
These results indicate that less N is allocated to RuBisCo in shade leaves. The shade leaves did not produce RuBisCo in low irradiance conditions and are left as remaining N. As a result, the RuBisCo concentration in shade leaves was significantly lower than sun leaves. RuBisCo is a soluble protein that is easily degraded, but the reaction center and LHC protein are thylakoid membrane proteins [45,75]. Remobilizing the N from RuBisCo may therefore be more efficient than remobilizing it from light harvesting proteins. These responses indicate that shade leaves of R. pseudoacacia have decreased RuBisCo and leaf N content, resulting in a low carbon gain under low irradiance conditions, since there is not enough light energy to maintain the same photosynthetic carbon assimilation rate as in sun leaves. These observations imply that shade leaves of R. pseudoacacia are well prepared for sudden changes in environmental conditions, such as changes in light, temperature or atmospheric CO2, with N stored in soluble form in soluble proteins. The consequent rapid response of R. pseudoacacia to environmental stressors increases its adaptability, so that this is a superior species at regenerating itself after disturbance.
5. Conclusions
We found clear differences in the physiological characteristics and morphological leaf traits of sun and shade leaves of R. pseudoacacia. This species has very different patterns of N utilization in sun and shade leaves. Since shade leaves do not receive enough light energy to assimilate photosynthetic carbon, the proportion of N invested in RuBisCo is less. We also believe that R. pseudoacacia has increased the proportion of water-soluble proteins in shade leaves, increasing its adaptability to various environmental changes. As well as the N2-fixing ability of R. pseudoacacia, the strategic uses of N in sun and shade leaves play a major role in expanding the area of distribution in changing environments.
Author Contributions
Conceptualization, D.C.; Methodology and Formal Analysis, D.C., H.T., M.Y.; software, D.C., W.J.; writing—original draft preparation, D.C., W.J.; writing—review and editing, D.C., W.J., H.T., M.Y.; funding acquisition, D.C., H.T., M.Y. All authors have read and agreed to the published version of the manuscript.
Funding
This study was supported partly by a Grant-in-Aid for Scientific Research (Type C: K120K06339 to M. Yoshikawa) from Japan Society for the Promotion of Science (JSPS) in Japan.
Data Availability Statement
Data available on request from the corresponding author.
Conflicts of Interest
The authors declare no conflict of interest. The funders had no role in the design of the study; in the collection, analyses, or interpretation of data; in the writing of the manuscript, or in the decision to publish the results.
References
- Keresztesi, B. The Black Locust. Forestry Monograph Series of the Agricultural Science Department of the Hungarian Academy of Science; Keresztesi, B., Ed.; Akademiai Kiado: Budapest, Hungary, 1988; p. 197. [Google Scholar]
- Kurokochi, H.; Toyama, K.; Hogetsu, T. Regeneration of Robinia pseudoacacia riparian forests after clear-cutting along the Chikumagawa River in Japan. Plant Ecol. 2010, 210, 31–41. [Google Scholar] [CrossRef]
- Lopez, M.L.; Mizota, C.; Nobori, Y.; Sasaki, T.; Yamanaka, T. Temporal changes in nitrogen acquisition of Japanese black pine (Pinus thunbergii) associated with black locust (Robinia pseudoacacia). J. For. Res. 2014, 25, 585–589. [Google Scholar] [CrossRef]
- Malcolm, G.M.; Bush, D.S.; Rice, S.K. Soil Nitrogen Conditions Approach Preinvasion Levels following Restoration of Nitrogen—Fixing Black Locust (Robinia pseudoacacia) Stands in a Pine–Oak Ecosystem. Restor. Ecol. 2007, 16, 70–78. [Google Scholar] [CrossRef]
- Rice, S.; Westerman, B.; Federici, R. Impacts of the exotic, nitrogen-fixing black locust (Robinia pseudoacacia) on nitrogen-cycling in a pine-oak ecosystem. Plant Ecol. 2004, 174, 97–107. [Google Scholar] [CrossRef]
- Maekawa, M.; Nakagoshi, N. Impact of biological invasion of Robinia pseudo-acacia on zonation and species diversity of dune vegetation in Central Japan. Jpn. J. Ecol. 1997, 47, 131–143. [Google Scholar]
- Takahashi, A. Habitat expansion of Robinia pseudoacacia L. and role of seed—Seed heteromorphism and its importance. J. Jpn. For. Soc. 2007, 781, 8–11. [Google Scholar]
- Usui, E. Robinia pseudoacacia—Hanafuru kokage (Cultural history of plant 157). Iden 1993, 47, 58. [Google Scholar]
- Taniguchi, T.; Tamai, S.; Yamanaka, N.; Futai, K. Inhibition of the regeneration of Japanese black pine (Pinus thunbergii) by black locust (Robinia pseudoacacia) in coastal sand dunes. J. For. Res. 2007, 12, 350–357. [Google Scholar] [CrossRef]
- Yamada, K.; Masaka, K. Present distribution and historical background of the invasive alien species Robinia pseudoacacia on former coalmine land in Hokkaido. Jpn J. Conserv. Ecol. 2007, 12, 94–102. [Google Scholar]
- Chang, C.S.; Bongarten, B.; Hamrick, J. Genetic structure of natural populations of black locust (Robinia pseudoacacia L.) at Coweeta. North Carolina. J. Plant Res. 1998, 111, 17–24. [Google Scholar] [CrossRef]
- Morimoto, J.; Kominami, R.; Koike, T. Distribution and characteristics of the soil seed bank of the black locust (Robinia pseudoacacia) in a headwater basin in northern Japan. Landsc. Ecol. Eng. 2010, 6, 193–199. [Google Scholar] [CrossRef]
- Sakio, H. Why did the black locust expand broadly at the river basin in Japan? J. Jpn. Soc. Reveg. Technol. 2015, 40, 465–471. [Google Scholar] [CrossRef]
- Lee, C.; Cho, H.; Yi, H. Stand dynamics of introduced black locust (Robinia pseudoacacia L.) plantation under different disturbance regimes in Korea. For. Ecol. Manag. 2004, 189, 281–293. [Google Scholar] [CrossRef]
- Richardson, D. Forestry trees as invasive aliens. Conserv. Biol. 1998, 12, 18–26. [Google Scholar] [CrossRef]
- Ecological Society of Japan (Ed.) Handbook of Alien Species in Japan; Chijinshokan: Tokyo, Japan, 2002. (In Japanese) [Google Scholar]
- Hoshino, Y.; Fukamachi, A.; Hasegawa, N. Girdling of young Robinia pseudoacacia trees on the Tama River terrace, central Japan. Landsc. Ecol. Eng. 2021. [Google Scholar] [CrossRef]
- Uraguchi, S.; Watanabe, I.; Kuno, K.; Hoshino, Y.; Fujii, Y. Allelopathy of floodplain vegetation species in the middlecourse of Tama river. J. Weed Sci. Technol. 2003, 48, 117–129. [Google Scholar] [CrossRef]
- Ogura, N.; TRRG (Tama River Research Group in River Ecological Scientific Study Society). Let’s Talk to the Heart of the Water; Japan River Front Research Center: Tokyo, Japan, 2003. [Google Scholar]
- Lee, S.H.; Fujita, K.; Tsukahara, T.; Watanabe, S.; Yamamoto, K.; Mochizuki, T. Roles of floods and fine sediment transport to wood land expansion on a gravel river-bed. Proc. Hydraul. Eng. 1998, 42, 433–438. [Google Scholar] [CrossRef][Green Version]
- Lee, S.H.; Fujita, K.; Yamamoto, K. A scenario of area expansion of stable vegetation in a gravel-bed river based on the upper Tama river case. Proc. Hydraul. Eng. 1999, 43, 977–982. [Google Scholar] [CrossRef][Green Version]
- Asaeda, T.; Rashid, M.H.; Kotagiri, S.; Uchida, T. The role of soil characteristics in the succession of two herbaceous lianas in a modified river floodplain. River Res. Appl. 2011, 27, 591–601. [Google Scholar] [CrossRef]
- Choi, D.; Watanabe, Y.; Guy, R.D.; Sugai, T.; Toda, H.; Koike, T. Photosynthetic characteristics and nitrogen allocation in the black locust (Robinia pseudoacacia L.) grown in a FACE system. Acta Physiol. Plant. 2017, 39, 71. [Google Scholar] [CrossRef]
- Farquhar, G.D. Models of integrated photosynthesis of cells and leaves. Philos. Trans. R. Soc. Lond. 1989, B323, 357–367. [Google Scholar] [CrossRef]
- Niinemets, Ü.; Kull, O.; Tenhunen, J.D. Variability in leaf morphology and chemical composition as a function of canopy light environment in coexisting deciduous trees. Int. J. Plant Sci. 1999, 160, 837–848. [Google Scholar] [CrossRef]
- Poorter, L.; Oberbauer, S.F.; Clark, D.B. Leaf optical properties along a vertical gradient in a tropical rain forest canopy in Costa Rica. Am. J. Bot. 1995, 82, 1257–1263. [Google Scholar] [CrossRef]
- Terashima, I.; Hanba, Y.T.; Tazoe, Y.; Vyas, P.; Yano, S. Irradiance and phenotype: Comparative eco-development of sun and shade leaves in relation to photosynthetic CO2 diffusion. J. Exp. Bot. 2006, 57, 343–354. [Google Scholar] [CrossRef]
- Martin, R.E.; Asner, G.P.; Bentley, L.P.; Shenkin, A.; Salinas, N.; Huaypar, K.Q.; Pillco, M.M.; Ccori Álvarez, F.D.; Enquist, B.J.; Diaz, S.; et al. Covariance of sun and shade leaf traits along a tropical forest elevation gradient. Front. Plant Sci. 2020, 10, 1810. [Google Scholar] [CrossRef]
- Japan Meteorological Agency; Japan Meteorological Agency. Past Weather Data of Fuchu City. 2002. Available online: https://www.data.jma.go.jp/obd/stats/etrn/view/annually_a.php?prec_no=44&block_no=1133&year=2019&month=&day=&view=p1 (accessed on 16 January 2021).
- Thornley, J.H.M. Mathematical Models in Plant Physiology; Academic Press: London, UK, 1976. [Google Scholar]
- Choi, D.S.; Kayama, M.; Jin, H.O.; Lee, C.H.; Izuta, T.; Koike, T. Growth and photosynthetic responses of two pine species (Pinus koraiensis and Pinus rigida) in a polluted industrial region in Korea. Environ. Pollut. 2006, 139, 421–432. [Google Scholar] [CrossRef] [PubMed]
- Choi, D.S.; Quoreshi, A.M.; Maruyama, Y.; Jin, H.O.; Koike, T. Effect of ectomycorrhizal infection on growth and photosynthetic characteristics of Pinus densiflora seedlings grown under elevated CO2 concentrations. Photosynthetica 2005, 43, 223–229. [Google Scholar] [CrossRef]
- Han, Q.; Kawasaki, T.; Katahata, S.; Mukai, Y.; Chiba, Y. Horizontal and vertical variations in photosynthetic capacity in a Pinus densiflora crown in relation to leaf nitrogen allocation and acclimation to irradiance. Tree Physiol. 2003, 23, 851–857. [Google Scholar] [CrossRef]
- Larcher, W. Physiological Plant Ecology, 4th ed.; Springer: New York, NY, USA, 2003; p. 534. [Google Scholar]
- Farquhar, G.D.; von Caemmerer, S.; Berry, J.A. A biochemical model of photosynthetic CO2 assimilation in leaves of C3 species. Planta 1980, 149, 78–90. [Google Scholar] [CrossRef]
- Harley, P.C.; Sharkey, T.D. An improved model of C3 photosynthesis at high CO2: Reversed O2 sensitivity explained by lack of glycerate reentry into the chloroplast. Photosynth. Res. 1991, 27, 169–178. [Google Scholar]
- Harley, P.C.; Loreto, F.; Marco, G.D.; Sharkey, T.D. Theoretical considerations when estimating the mesophyll conductance to CO2 flux by analysis of the response of photosynthesis to CO2. Plant Physiol. 1992, 98, 1429–1436. [Google Scholar] [CrossRef]
- Sharkey, T.D. Photosynthesis in intact leaves of C3 plants: Physics, physiology and rate limitations. Bot. Rev. 1985, 51, 53–105. [Google Scholar] [CrossRef]
- von Caemmerer, S.; Farquhar, G.D. Some relationships between the biochemistry of photosynthesis and the gas exchange of leaves. Planta 1981, 153, 376–387. [Google Scholar] [CrossRef] [PubMed]
- Choi, D.S.; Toda, H.; Kim, Y. Effect of sulfur dioxide (SO2) on growth and physiological activity in Alnus sieboldiana at Miyakejima Island in Japan. Ecol. Res. 2014, 29, 103–110. [Google Scholar] [CrossRef]
- Barnes, J.D.; Balaguer, L.; Manrique, E.; Elvira, S.; Davison, A.W. A reappraisal of the use of DMSO for the extraction and determination of chlorophylls a and b in lichens and higher plants. Environ. Exp. Bot. 1992, 32, 85–100. [Google Scholar] [CrossRef]
- Shinano, T.; Lei, T.T.; Kawamukai, T.; Inoue, M.T.; Koike, T.; Tadano, T. Dimethyl sulfoxide method for the extraction of chlorophyll a and b from the leaves of wheat, field bean, dwarf bamboo, and oak. Photosynthetica 1996, 32, 409–415. [Google Scholar]
- Hikosaka, K.; Terashima, I. Nitrogen partitioning among photosynthetic components and its consequence in sun and shade plants. Funct. Ecol. 1996, 10, 335–343. [Google Scholar] [CrossRef]
- Kitaoka, S.; Koike, T. Invasion of broad-leaf tree species into a larch plantation: Seasonal light environment, photosynthesis and nitrogen allocation. Physiol. Plant 2004, 121, 604–611. [Google Scholar] [CrossRef]
- Makino, A.; Mae, T.; Ohira, K. Differences between wheat and rice in the enzymic properties of ribulose-1,5-bisphosphate carboxylase/oxygenase and the relationship to photosynthetic gas exchange. Planta 1988, 174, 30–38. [Google Scholar] [CrossRef]
- Makino, A.; Mae, T.; Ohira, K. Enzymic properties of ribulose-1,5-bisphosphate carboxylase/oxygenase purified from rice leaves. Plant Physiol. 1985, 79, 57–61. [Google Scholar] [CrossRef]
- Evans, J.R.; Seemann, J.R. The allocation of protein nitrogen in the photosynthetic apparatus: Cost, consequences and control. In Photosynthesis; Brigs, W.R., Ed.; Alan R. Liss: New York, NY, USA, 1989; pp. 171–203. [Google Scholar]
- Hikosaka, K.; Terashima, I. A model of the acclimation of photosynthesis in the leaves of C-3 plants to sun and shade with respect to nitrogen use. Plant Cell Environ. 1995, 18, 605–618. [Google Scholar] [CrossRef]
- Niinemets, Ü.; Tenhunen, J.D. A model separating leaf structural and physiological effects on carbon gain along light gradients for the shade-tolerant species Acer saccharum. Plant Cell Environ. 1997, 20, 845–866. [Google Scholar] [CrossRef]
- Von Caemmerer, S.; Evans, J.R.; Hudson, G.S.; Andrews, T.J. The kinetics of ribulose-1,5-bisphosphate carboxylase/oxygenase in vivo inferred from measurements of photosynthesis in leaves of transgenic tobacco. Planta 1994, 195, 88–97. [Google Scholar] [CrossRef]
- Wang, W.; Kayama, M.; Kitaoka, S.; Osaki, M.; Koike, T. Photosynthetic characteristics of Sasa senanensis grown under low nitrogen, potassium and phosphorus nutrient conditions. Bamboo 2001, 18, 23–36. [Google Scholar]
- Ishii, H.; Asano, S. The role of crown architecture, leaf phenology and photosynthetic activity in promoting complemen- tary use of light among coexisting species in temperate forests. Ecol. Res. 2010, 25, 715–722. [Google Scholar] [CrossRef]
- García-Plazaola, J.J.; Hernµndez, A.; Becerril, J.M. Antioxidant and pigment composition during autumnal leaf senescence in woody deciduous species differing in their ecological traits. Plant Biol. 2003, 5, 557–566. [Google Scholar] [CrossRef]
- Niinemets, Ü. A review of interception in plant stands from leaf to canopy in different plant functional types and in species with varying shade tolerance. Ecol. Res. 2010, 25, 693–714. [Google Scholar] [CrossRef]
- Szöllösi, E.; Oläh, V.; Kanalas, P.; Kis, J.; Fenyvesi, A.; Mëszáros, I. Seasonal variation of leaf ecophysiological traits within the canopy of Quercus petraea (Matt.) Liebl. trees. Acta Biol. Hung. 2010, 61, 172–188. [Google Scholar] [CrossRef] [PubMed]
- Holscher, D. Leaf traits and photosynthetic parameters of saplings and adult trees of co-existing species in a temperate broad-leaved forest. Basic App. Ecol. 2004, 5, 163–172. [Google Scholar] [CrossRef]
- Kubiske, M.E.; Pregitzer, K.S. Ecophysiological responses to simulated canopy gaps of two tree species of contrasting shade tolerance in elevated CO2. Funct. Ecol. 1997, 11, 24–32. [Google Scholar] [CrossRef]
- Lichtenthaler, H.K.; Babani, F.; Langsdorf, G.; Buschmann, C. Measurement of differences in red chlorophyll fluorescence and photosynthetic activity between sun and shade leaves by fluorescence imaging. Photosynthetica 2000, 38, 521–529. [Google Scholar] [CrossRef]
- Lichtenthaler, H.K.; Alexander, A.; Marek, M.V.; Kalina, J.; Urban, O. Differences in pigment composition, photosynthetic rates and chlorophyll fluorescence images of sun and shade leaves of four tree species. Plant Physiol. Biochem. 2007, 45, 577–588. [Google Scholar] [CrossRef] [PubMed]
- Pandey, S.; Kumar, S.; Nagar, P.K. Photosynthetic performance of Ginkgo biloba, L. grown under high and low irradiance. Photosynthetica 2003, 41, 505–511. [Google Scholar] [CrossRef]
- Priwitzer, T.; Urban, O.; Sprtova, M.; Marek, M.V. Chloroplastic carbon dioxide concentration of Norway spruce (Picea abies [L.] Karst) needles relates to the position within the crown. Photosynthetica 1998, 34, 109–112. [Google Scholar] [CrossRef]
- Spunda, V.; Cÿajanek, M.; Kalina, J.; Lachetov, I.; Sprtova, M.; Marek, M.V. Mechanistic differences in utilization of absorbed excitation energy within photosynthetic apparatus of Norway spruce induced by the vertical distribution of photosynthetically active radiation through the tree crown. Plant Sci. 1998, 133, 155–165. [Google Scholar] [CrossRef]
- Mao, L.Z.; Lu, H.F.; Wang, Q.; Cai, M.M. Comparative photosynthesis characteristics of Calycanthus chinensis and Chimonanthus praecox. Photosynthetica 2007, 45, 601–605. [Google Scholar] [CrossRef]
- Schiefthaler, U.; Russell, A.W.; Bolhàr-Nordenkampf, H.R.; Critchley, C. Photoregulation and photodamage in Schefflera arboricola leaves adapted to different light environments. Aust. J. Plant Physiol. 1997, 26, 485–494. [Google Scholar] [CrossRef]
- Dai, Y.; Shen, Z.; Liu, Y.; Wang, L.; Hannaway, D.; Lu, H. Effects of shade treatments on the photosynthetic capacity, chlorophyll fluorescence, and chlorophyll content of Tetrastigma hemsleyanum Diels et Gilg. Environ. Exp. Bot. 2009, 65, 177–182. [Google Scholar] [CrossRef]
- Lusk, C.H.; Reich, P.B. Relationships of leaf dark respiration with light environment and tissue nitrogen content in juveniles of 11 cold-temperate tree species. Oecologia 2000, 123, 318–329. [Google Scholar] [CrossRef]
- Wittmann, C.; Aschan, G.; Pfanz, H. Leaf and twig photosynthesis of young beech (Fagus sylvatica) and aspen (Populus tremula) trees grown under different light regime. Basic Appl. Ecol. 2001, 2, 145–154. [Google Scholar] [CrossRef]
- Givnish, T.J. Adaptation to sun and shade: A whole-plant perspective. Aust. J. Plant Physiol. 1988, 15, 63–92. [Google Scholar] [CrossRef]
- Grime, J.P. Shade tolerance in flowering plants. Nature 1965, 208, 161–163. [Google Scholar] [CrossRef]
- Herrick, J.D.; Thomas, R.D. Effects of CO2 enrichment on the photosynthetic light response of sun and shade leaves of canopy sweetgum trees (Liquidambar styraciflua) in a forest ecosystem. Tree Physiol. 1999, 19, 779–786. [Google Scholar] [CrossRef] [PubMed]
- Sun, B.; Dilcher, D.L.; Beerling, D.J.; Zhang, C.; Yan, D.; Kowalski, E. Variation in Ginkgo biloba, L. leaf characters across a climate gradient in China. Proc. Natl. Acad. Sci. USA 2003, 100, 7141–7146. [Google Scholar] [CrossRef]
- Evans, J.R. The relationship between electron transport components and photosynthetic capacity in pea leaves grown at different irradiances. Aust. J. Plant Physiol. 1987, 14, 157–170. [Google Scholar] [CrossRef]
- Onoda, Y.; Hikosaka, K.; Hirose, T. Seasonal change in the balance between capacities of RuBP carboxylation and RuBP regeneration affects CO2 response of photosynthesis in Polygonum cuspidatum. J. Exp. Bot. 2005, 56, 755–763. [Google Scholar] [CrossRef]
- Yamori, W.; Noguchi, K.; Hikosaka, K.; Terashima, I. Phenotypic plasticity in photosynthetic temperature acclimation among crop species with different cold tolerances. Plant Physiol. 2010, 152, 388–399. [Google Scholar] [CrossRef]
- Katahata, S.; Naramoto, M.; Kakubari, Y.; Mukai, Y. Seasonal changes in photosynthesis and nitrogen allocation in leaves of different ages in evergreen understory shrub Daphniphyllum humile. Trees 2007, 21, 619–629. [Google Scholar] [CrossRef]
- Lambers, H.; Chapin, F.S., III; Ponds, T.L. Plant Physiological Ecology, 2nd ed.; Springer: New York, NY, USA, 2008; p. 605. [Google Scholar]
- Boardman, N.K. Comparative photosynthesis of sun and shade plants. Annu. Rev. Plant Physiol. 1977, 28, 355–377. [Google Scholar] [CrossRef]
- Poorter, H.; Niinemets, U.; Poorter, L.; Wright, I.J.; Villar, R. Causes and consequences of variation in leaf mass per area (LMA): A meta-analysis. New Phytol. 2009, 182, 565–588. [Google Scholar] [CrossRef]
Publisher’s Note: MDPI stays neutral with regard to jurisdictional claims in published maps and institutional affiliations. |
© 2021 by the authors. Licensee MDPI, Basel, Switzerland. This article is an open access article distributed under the terms and conditions of the Creative Commons Attribution (CC BY) license (http://creativecommons.org/licenses/by/4.0/).