
Assessing Soil Organic Carbon Stock Dynamics under Future Climate Change Scenarios in the Middle Qilian Mountains


Key Laboratory of Ecohydrology of Inland River Basin, Northwest Institute of Eco-Environment and Resources, Chinese Academy of Sciences, Lanzhou 730000, China
*
Author to whom correspondence should be addressed.
Forests 2021, 12(12), 1698; https://doi.org/10.3390/f12121698
Submission received: 16 August 2021
/
Revised: 30 November 2021
/
Accepted: 1 December 2021
/
Published: 4 December 2021
(This article belongs to the Topic Estimating Carbon Stocks in Forest Ecosystems: From Allometric Equations to Remote Sensing-Based Methods)
Abstract
:Soil organic carbon (SOC) simply cannot be managed if its amounts, changes and locations are not well known. Thus, evaluations of the spatio-temporal dynamics of SOC stock under future climate change are crucial for the adaptive management of regional carbon sequestration. Here, we evaluated the dynamics of SOC stock to a 60 cm depth in the middle Qilian Mountains (1755–5051 m a.s.l.) by combining systematic measurements from 138 sampling sites with a machine learning model. Our results reveal that the combination of systematic measurements with the machine learning model allowed spatially explicit estimates of SOC change to be made. The average SOC stock in the middle Qilian Mountains was expected to decrease under future climate change, while the size and direction of SOC stock changes seemed to be elevation-dependent. Specifically, in comparison with the 2000s, the mean annual precipitation was projected to increase by 18.37, 19.80 and 30.80 mm, and the mean annual temperature was projected to increase by 1.9, 2.4 and 2.9 °C under the Representative Concentration Pathway (RCP) 2.6 (low-emissions pathway), RCP4.5 (low-to-moderate-emissions pathway), and RCP8.5 (high-emissions pathway) scenarios by the 2050s, respectively. Accordingly, the area-weighted SOC stock and total storage for the whole study area were estimated to decrease by 0.43, 0.63 and 1.01 kg m–2 and 4.55, 6.66 and 10.62 Tg under the RCP2.6, RCP4.5 and RCP8.5 scenarios, respectively. In addition, the mid-elevation zones (3100–3900 m), especially the subalpine shrub-meadow Mollic Leptosols, were projected to experience the most intense carbon loss. However, the higher elevation zones (>3900 m), especially the alpine desert zone, were characterized by significant carbon accumulation. As for the low-elevation zones (<2900 m), SOC was projected to be less varied under future climate change scenarios. Thus, the mid-elevation zones, especially the subalpine shrub-meadows and Mollic Leptosols, should be given priority in terms of reducing CO2 emissions in the Qilian Mountains.
1. Introduction
In alpine regions, elevation-dependent warming probably results in a higher temperature increase over higher elevation regions. Consequently, the patterns and dynamics of soil organic carbon (SOC) in alpine ecosystems are being markedly reshaped [1,2,3]. In addition, a large amount of SOC is stored in alpine ecosystems due to the cold and humid climate conditions, thus even small changes in temperature and precipitation could greatly affect SOC stock dynamics [4,5,6]. However, the size and direction of SOC dynamics under future climate change scenarios in alpine regions are still scarcely understood due to limited site-level measurements under such harsh environments and complex topography [7,8]. Thus, a comprehensive evaluation of the spatio-temporal patterns of SOC stocks in alpine regions may enable us to better understand the carbon–climate feedback [9,10,11]. This knowledge will help us to take dedicated adaptive measures to improve the soil carbon stock in alpine regions under future climate change [12,13].
The quantification of the spatio-temporal patterns of SOC stocks under future climate change scenarios mainly relies on model simulations, including process-based biogeochemical models and data-driven empirical models [14,15]. Soil carbon models currently in use mainly include the CENTURY model, the Rothamsted Carbon (RothC) model, the Denitrification-Decomposition (DNDC) model, and the Carbon and Nitrogen Dynamics (CANDY) model [6]. Most soil carbon models were suitable for single-point or typical ecosystem simulations, and could be used to simulate higher-resolution SOC dynamics at regional or watershed scales with the help of GIS techniques. This was the case in Caddeo et al. [16], who simulated the SOC dynamics of Italian forest and farmland ecosystems under the Representative Concentration Pathway (RCP) 4.5 (low-to-moderate emission pathway) and RCP8.5 (high emission pathway) scenarios from the 2000s to the 2100s by the CENTURY 5.0 model and GIS techniques at a 500 m resolution, and they found that the SOC was projected to experience a moderate carbon loss. In general, the mechanisms of process-based models are clear, and thus the simulation accuracy at site level is quite high [17]. However, for large-scale simulations, tremendous grid inputs in process-based models may result in massive calculation resources consumption, especially at higher resolutions [18].
Data-driven empirical models were also applied to simulate SOC across temporal scales by developing the predictive relationships between SOC and spatially varying environmental covariates including topographic, climatic, vegetative, geographic and pedological factors [19,20]. The basis of data-driven empirical models in simulating SOC temporal dynamics is the space-for-time substitution (SFTS) assumption [14,21,22], i.e., the data-driven empirical models being established between SOC measurements and spatially varying environmental covariates at current periods could be extrapolated to future SOC estimation by substituting the current covariates with that of future periods. In the past few decades, with the rapid development of satellite remote sensing and machine learning techniques, a large number of the latest machine learning algorithms and spatial-explicit environmental covariates have been employed to build empirical models for regional SOC mapping [23]. These advances enabled the SFTS approach to be successfully applied in mapping SOC dynamics over time [24,25].
The Qilian Mountains, as a typical semiarid alpine region in northwestern China, are of great importance in supplying water resources for the Hexi Corridor [26]. Previous research indicated that the soils in the Qilian Mountains are characterized by very high standing organic carbon stock, especially in the forests, shrublands and meadows [8,13]. The climates in the Qilian Mountains have experienced cold-to-warm (0.3 °C 10a–1) and dry-to-wet transformations (15.4 mm (10a)–1) over the past four decades [27]. Temperature increase may accelerate the decomposition rate of SOC, while precipitation increase is likely to stimulate vegetation productivity and subsequently enhance litter inputs from plants to soils, especially in mid- and low-elevation zones in the Qilian Mountains, where ecosystem productivity is mainly shaped by soil water availability [28]. The contrary effects between temperature and precipitation may lead to diverse responses of SOC to climate change in different elevation zones. However, knowledge concerning the SOC dynamics in the Qilian Mountains is still very scarce, especially the co-effects of climate warming and wetting on SOC.
Considering the diverse heat and water conditions as affected by elevation in the Qilian Mountains [29], we hypothesized that the size and direction of SOC changes may be elevation-dependent, i.e., the SOC in different elevation zones responded diversely to climate change. To test this hypothesis, we combined systematic measurements from 138 sampling sites with a machine learning technique to build a data-driven empirical model, and further explored the spatial-temporal dynamics of SOC in the Qilian Mountains under three climate change scenarios. The primary objectives of this study were to: (1) characterize the patterns of climate and vegetation changes, (2) predict the SOC in the 2050s under different climate change scenarios, and (3) to quantify the responses of SOC to climate change along the elevation gradient.
2. Materials and Methods
2.1. Study Area
The study was carried out in the middle Qilian Mountains, i.e., the Yingluoxia basin (37.75°–39.09° N, 98.57°–101.18° E) in the upper reaches of the Heihe River basin (Figure 1). The Yingluoxia basin extends over an area of 10,500 km2, with an average elevation of 3658 m (1755–5051 m a.s.l.). The area-weighted mean annual temperature and precipitation were –3.3 °C and 345.0 mm, respectively, with a lapse rate of 0.58 °C and an increase rate of 15.5 to 22.1 mm per 100 m at the vertical direction, respectively [13]. In the study area, elevation markedly shaped the spatial patterns of precipitation and temperature, which further stratified vegetation zones along the elevation gradient. In addition, due to the aspect-induced microclimates at local scales, the vegetation type exhibited strong aspect-induced variation within the same elevation zone, e.g., the shrubs and forests tended to occupy the north-facing hillslopes, while steppes were mainly distributed on the south-facing hillslopes [30].
Overall, from summit to piedmont plain, the main vegetation types included alpine desert, alpine meadow, subalpine shrub, subalpine meadow, montane forest, montane shrub, montane meadow steppe, montane steppe, and montane desert steppe. Correspondingly, the main soil types were classified as alpine frigid desert soils, alpine meadow soils, subalpine shrubby meadow soils, subalpine meadow soils, gray cinnamon, chernozems, kastanozems, and sierozems according to the Chinese soil genetic classification [31], which were roughly referred to as Glacic Cryosols, Leptosols (Gelic), Eutric Leptosols, Mollic Leptosols, Greyzemic Umbrisols, Haplic Chernozems, Haplic Kastanozems, and Haplic Calcisols according to the World Reference Base for Soil Resources (WRB) [32]. For middle- and high-elevation zones, soil depths generally ranged from 20 to 60 cm, and there were clear rock compositions in deeper soil layers. Considering the fundamental functions for regional ecological security, the Qilian Mountains were classified as a national nature reserve and a national park in 1980 and 2017, respectively [33]. Thus, the anthropogenic disturbances were relatively limited, and vegetation and soil dynamics were mainly controlled by climate change.
2.2. Site-Level Measurements
We conducted soil sampling campaigns along the topography and vegetation type gradients in the study area from 2012 to 2015 during the growing seasons (Figure 1). In total, 138 sampling sites were investigated, and 138, 133, 117 and 91 composite soil samples were obtained for soil depths of 0–10, 10–20, 20–40 and 40–60 cm, respectively, and the topographic, geographic and vegetative variables for each sampling site were recorded. SOC concentration and bulk density were determined by the wet Walkley–Black method and the core ring method, respectively. Detailed field investigation and sample analysis processes can also be found in Zhu et al. [13]. The SOC stock was calculated using the following equation according to Ding et al. [5]:
where SOCS is the SOC stock (kg m–2), BDi is the bulk density (g cm–3), Di is the soil thickness (cm), SOCCi is the SOC concentration (g kg–1), k is the number of layers divided in a soil profile, and Ci is the volume percentage of the gravel > 2 mm in diameter at layer i.
2.3. Model Predictors
It has been suggested by previous studies that the topographic, climatic, pedological and vegetative variables are good predictors in modelling SOC spatial distribution across the Qilian Mountains [13,34]. Generally, the environmental covariates used for modelling SOC were highly self-correlated, and redundant inputs probably lowered model computational efficiency, especially at a high spatial resolution. Thus, only ten covariates, i.e., the elevation, aspect, slope gradient, topographic position index (TPI), longitude, latitude, temperature, precipitation, soil type, and normalized difference vegetation index (NDVI), were finally employed to develop the data-driven prediction model for SOC. Topography and locations were assumed to be stable at the time scale, whereas temperature, precipitation and NDVI varied on a decadal basis. Mean annual temperature and precipitation datasets from WordClim (https://worldclim.org/ (accessed on 20 February 2021)) were available at a 1 km resolution for the 2000s (1970–2000) and the 2050s (2041–2060). The future climate data of the 2050s were the averages of five global climate models (GCMs), i.e., the BCC-CSM1-1 [35], NorESM1-M [36,37], HadGEM2-AO [38], IPSL-CM5A-LR [39] and GISS-E2-R [40], and data under the RCP2.6 (low emission pathway), RCP4.5 (low-to-moderate emission pathway) and RCP8.5 (high emission pathway) scenarios were employed for SOC dynamics prediction. The elevation, aspect, slope and TPI were derived from the ASTGTM 30 m digital elevation model (DEM) using ArcGIS 10.2 (ESRI Inc., RedLands, CA, USA) and SAGA GIS (http://www.saga-gis.org/ (accessed on 13 February 2021)). The soil type data at a 1 km resolution were derived from the Harmonized World Soil Database (HWSD 1.2) product (https://www.fao.org/soils-portal/data-hub/en/ (accessed on 27 Novmber 2021)), and was reclassified according to the international standard soil classification WRB [32]. In addition, we obtained the vegetation type map at a 1:100,000 scale for the upper reaches of the Heihe River basin from the National Tibetan Plateau Data Center (http://www.tpdc.ac.cn/ (accessed on 23 February 2021)).
2.4. Data-Driven Model
We employed a machine learning technique, i.e., the random forest algorithm [41], to construct a data-driven model which could simulate the nonlinear relationships between site-level SOC stock and time-stable (e.g., elevation, aspect, slope, TPI, longitude, latitude) as well as time-varying covariates (e.g., temperature, precipitation and NDVI). During the training, we set the number of trees (ntree) to 1000 and the minimum size of terminal nodes (nodesize) at 5, according to previous studies focusing on SOC mapping in the middle Qilian Mountains with the random forest algorithm [13,42]. To minimize the uncertainty in extracting NDVI values from raster products for each of the sampling sites, we employed the averages of 30 m monthly NDVI layers (20 images in total) during the growing seasons (from May to September) of 2012–2015 (i.e., the soil sampling period). In addition, the temperature and precipitation values for each sampling site were not extracted from the raster products at a resolution of 1 km, and this was mainly because the climate in the Qilian Mountains was markedly shaped by elevation, and direct extraction from coarse resolution climate products may bring high levels of uncertainty to the simulation of carbon–environment relationships. We finally calculated mean annual precipitation and temperature at each sampling site according to the multiple linear regression equations expressed as functions of elevation, longitude, and latitude, as shown by Zhao et al. [43,44]. It should be noted that although Zhao et al. [43] also demonstrated that ordinary kriging (OK) yielded smaller prediction errors in growing-season temperature simulation than multiple linear regression did, we still employed the regression method to estimate the site-level annual temperature and precipitation. This was mainly because the OK method was more suitable for climatic variables interpolation in plains or regions with large spatial extents, while it was less suitable in mountainous regions where climates could vary sharply along the elevation gradient within a very short distance.
The ‘randomForest’ package was employed to conduct the data-driven model by the R language (R version 3.5.1, R Development Core Team, 2018). To further validate the accuracy of the random forest algorithm in modelling the non-linear relationships for site-level measurements, the ten-fold cross-validation procedure was conducted, and the coefficient of determination (R2) and root mean square error (RMSE) were used to indicate the performance of the model. For details about the ten-fold cross-validation procedure and statistics calculation, see Zhu et al. [13]. It should be noted that soil depth in Glacis Cryosols was generally less than 20 cm, and thus the SOC stock in this soil was only modeled and projected with measurements from depths pf 0–20 cm. For other soils, we modeled SOC dynamics at a depth of 60 cm. The final SOC maps were actually produced by merging the 0–20 cm SOC stock in Glacis Cryosols and the 0–60 cm SOC stock in other soil types.
2.5. SOC Prediction
The data-driven model that simulated the non-linear relationships between SOC and environmental variables at a spatial scale was further used to project the SOC changes over time, and such an approach is called space-for-time substitution. However, the efficiency of this approach largely relies on the extents of environmental gradients of site-level measurements, i.e., the values of SOC and other environmental covariates should cover wide varying ranges. The huge elevation range (>3000 m) in the study area markedly shaped the water and heat conditions, and created diverse vegetation communities and soil types, thus making the Qilian Mountains an ideal region to conduct the space-for-time substitution procedure for SOC dynamics modelling. To create spatially explicit estimates of the SOC stock for both the 2000s (regarded as the baseline period) and the 2050s as affected by climate change, the data-driven model was rerun for the study area using the same topographic and geographic and pedological raster layers except for temperature, precipitation and NDVI data. The climate datasets for the 2000s and the 2050s were derived from the same source (i.e., the WorldCim datasets) so as to make the predictions comparable.
The soil type will most likely not change within 30 to 50 years, while the vegetation community and species composition may change significantly over time, especially for steppes and meadows. Thus, the vegetation type maps for the study area by the 2050s under the three RCP scenarios were also predicted. In this study, we developed predictive relationships between vegetation type map and climatic, topographic, and geographic covariates using a random forest model. The vegetation type was coded as 1 to 10 according to elevation before further modelling, which subsequently represented montane desert steppe, montane steppe, montane meadow steppe, montane shrub, montane forest, subalpine meadow, subalpine shrub, subalpine meadow, alpine desert and no vegetation. The predictive relationships were modeled based on all 10,500 grid cell attributes extracted from the vegetation type and other covariates (i.e., temperature, precipitation, topography and locations) maps at a resolution of 1 km × 1 km. Then, the vegetation type maps for the 2000s and the 2050s under the three RCP scenarios were subsequently modeled by the predictive relationships combined with covariates during corresponding periods. Similar procedures were also employed to estimate NDVI in 2050s. Specifically, we used NDVI averages of 1990–2000 for the 2000s, and calculated NDVI changes until the 2050s, which were then added to the NDVI spatial layer of the 2000s to obtain the NDVI for the 2050s. It should be noted that the vegetation type maps for different periods were also used as environmental covariates in projecting NDVI changes over time.
We also calculated the difference between the SOC stock of the 2000s and 2050s under different climate change scenarios for each 1 km × 1 km pixel, and further obtained the spatial distribution of SOC stock changes. In addition, we overlaid the vegetation type maps of both the 2000s and the 2050s and the soil type map over the SOC maps to summarize the means and standard deviations of SOC changes for different vegetation and soil types.
3. Results
3.1. Future Climate and Vegetation Change Characteristics
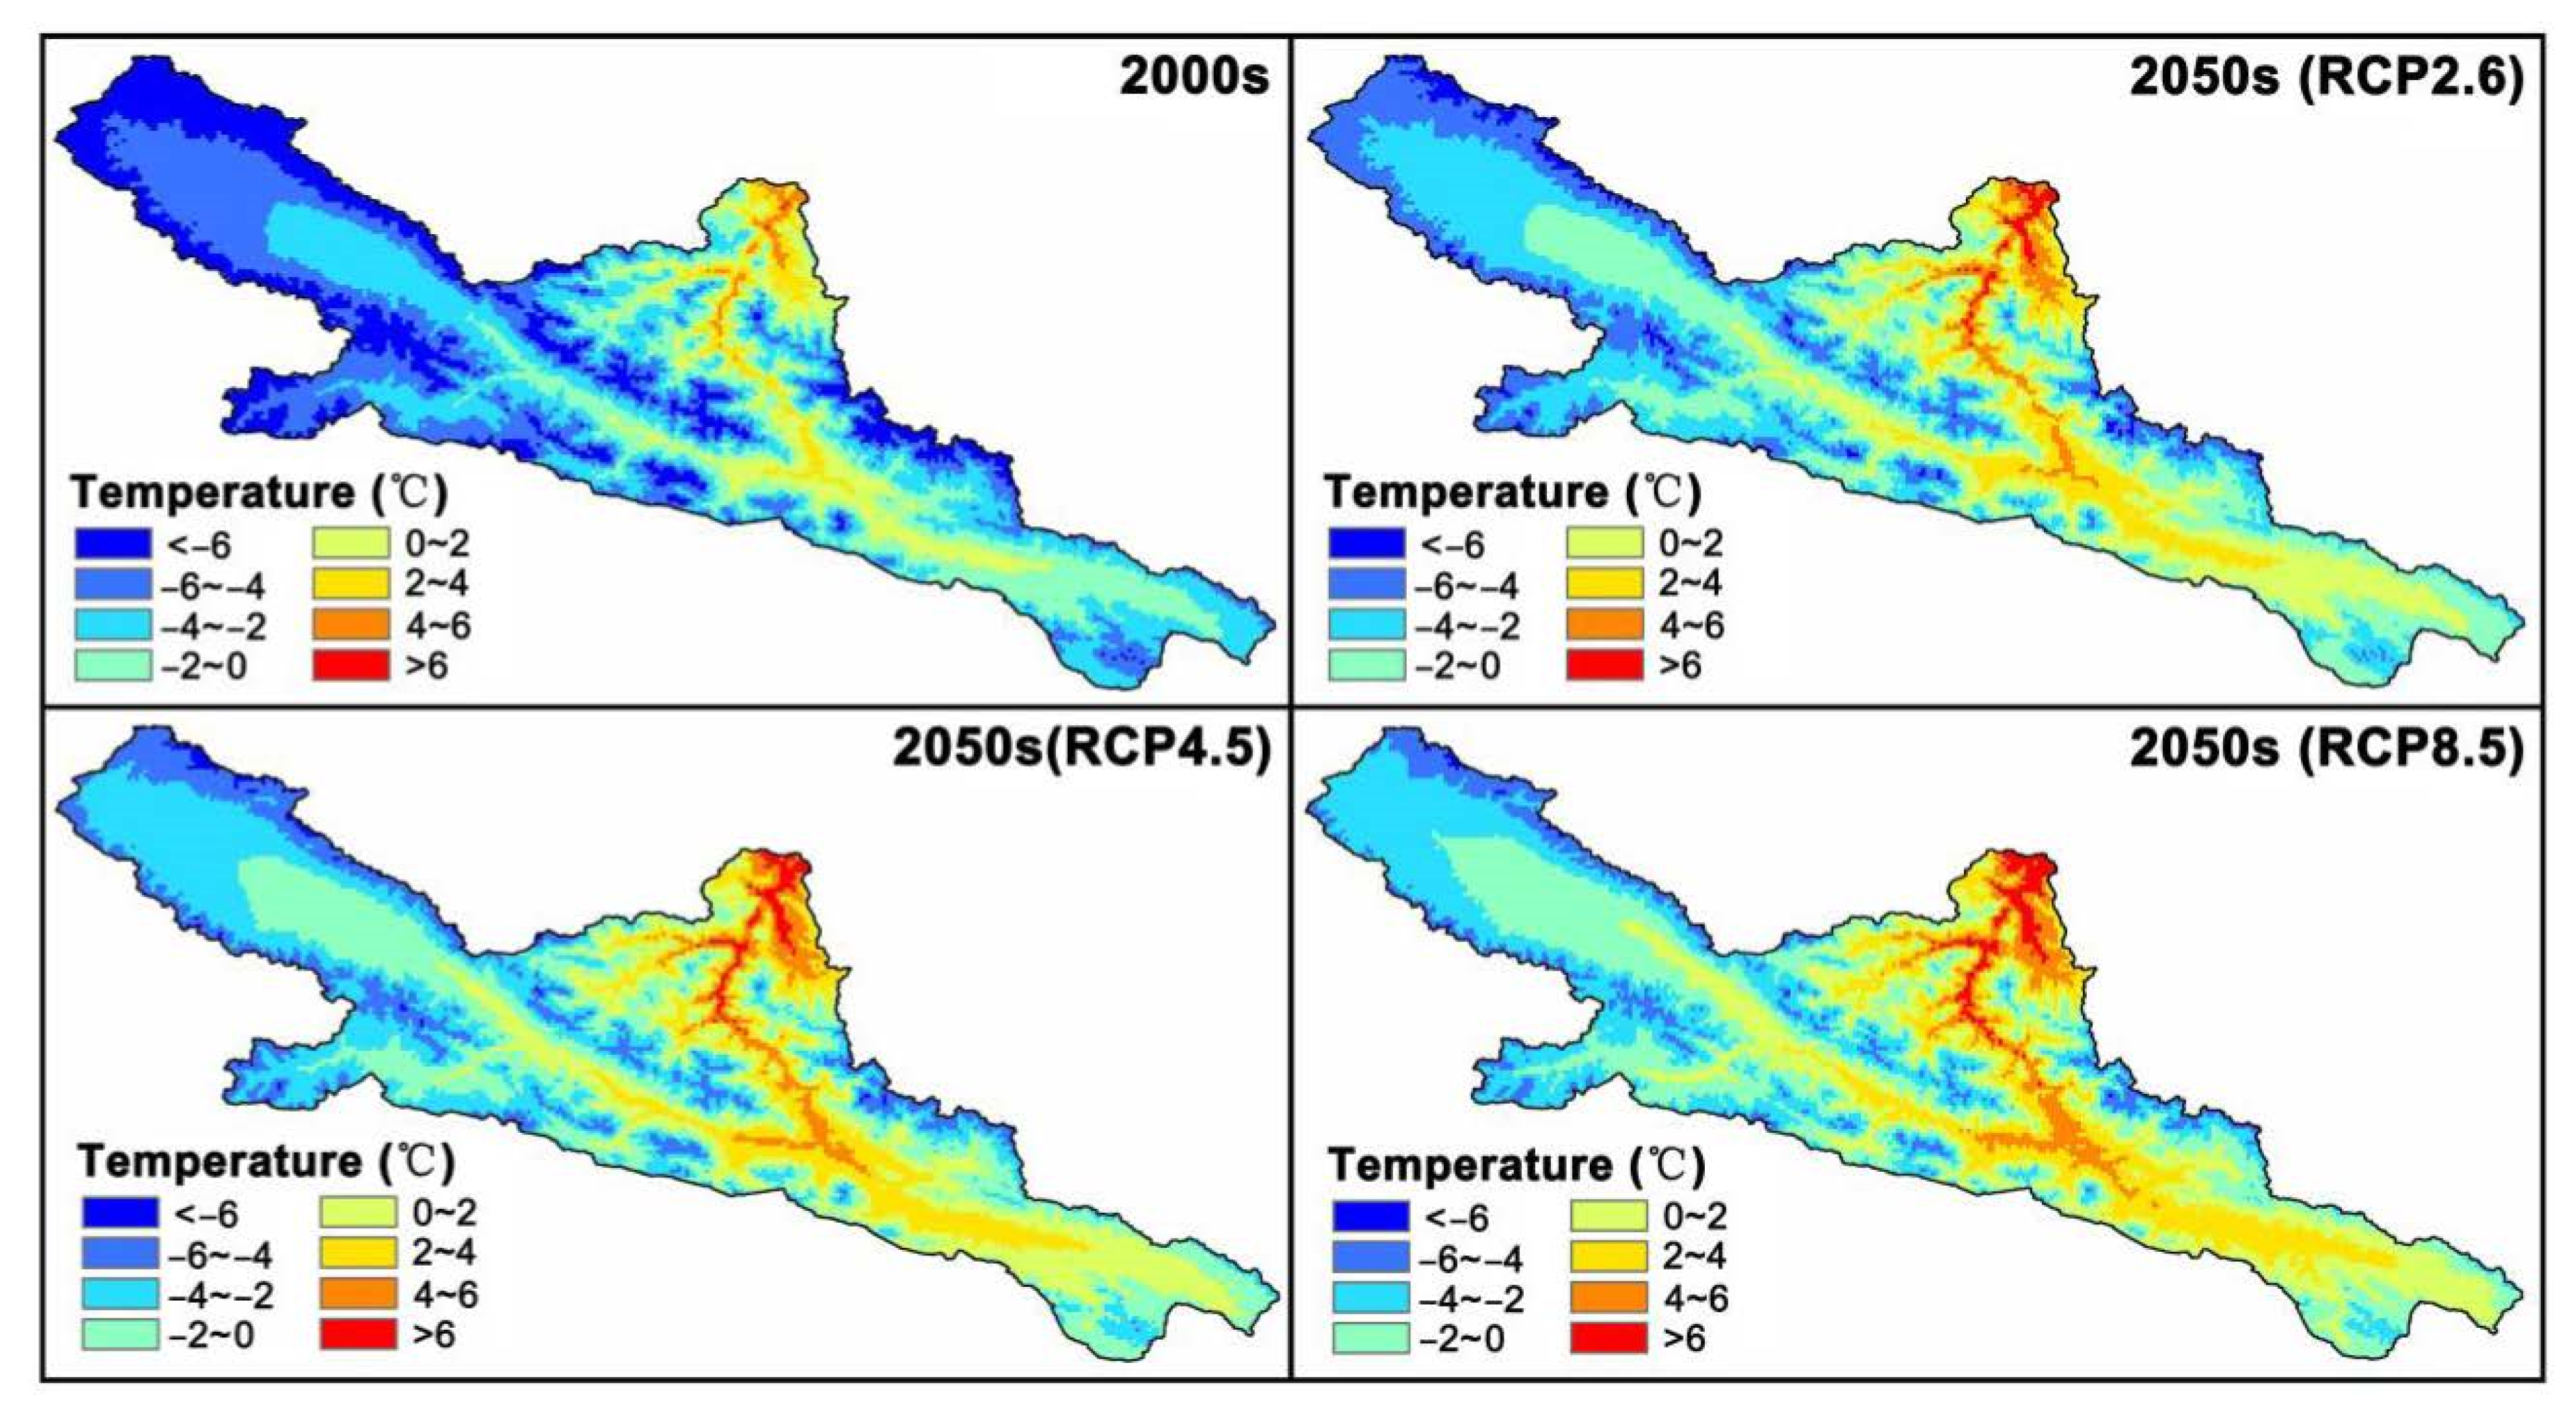
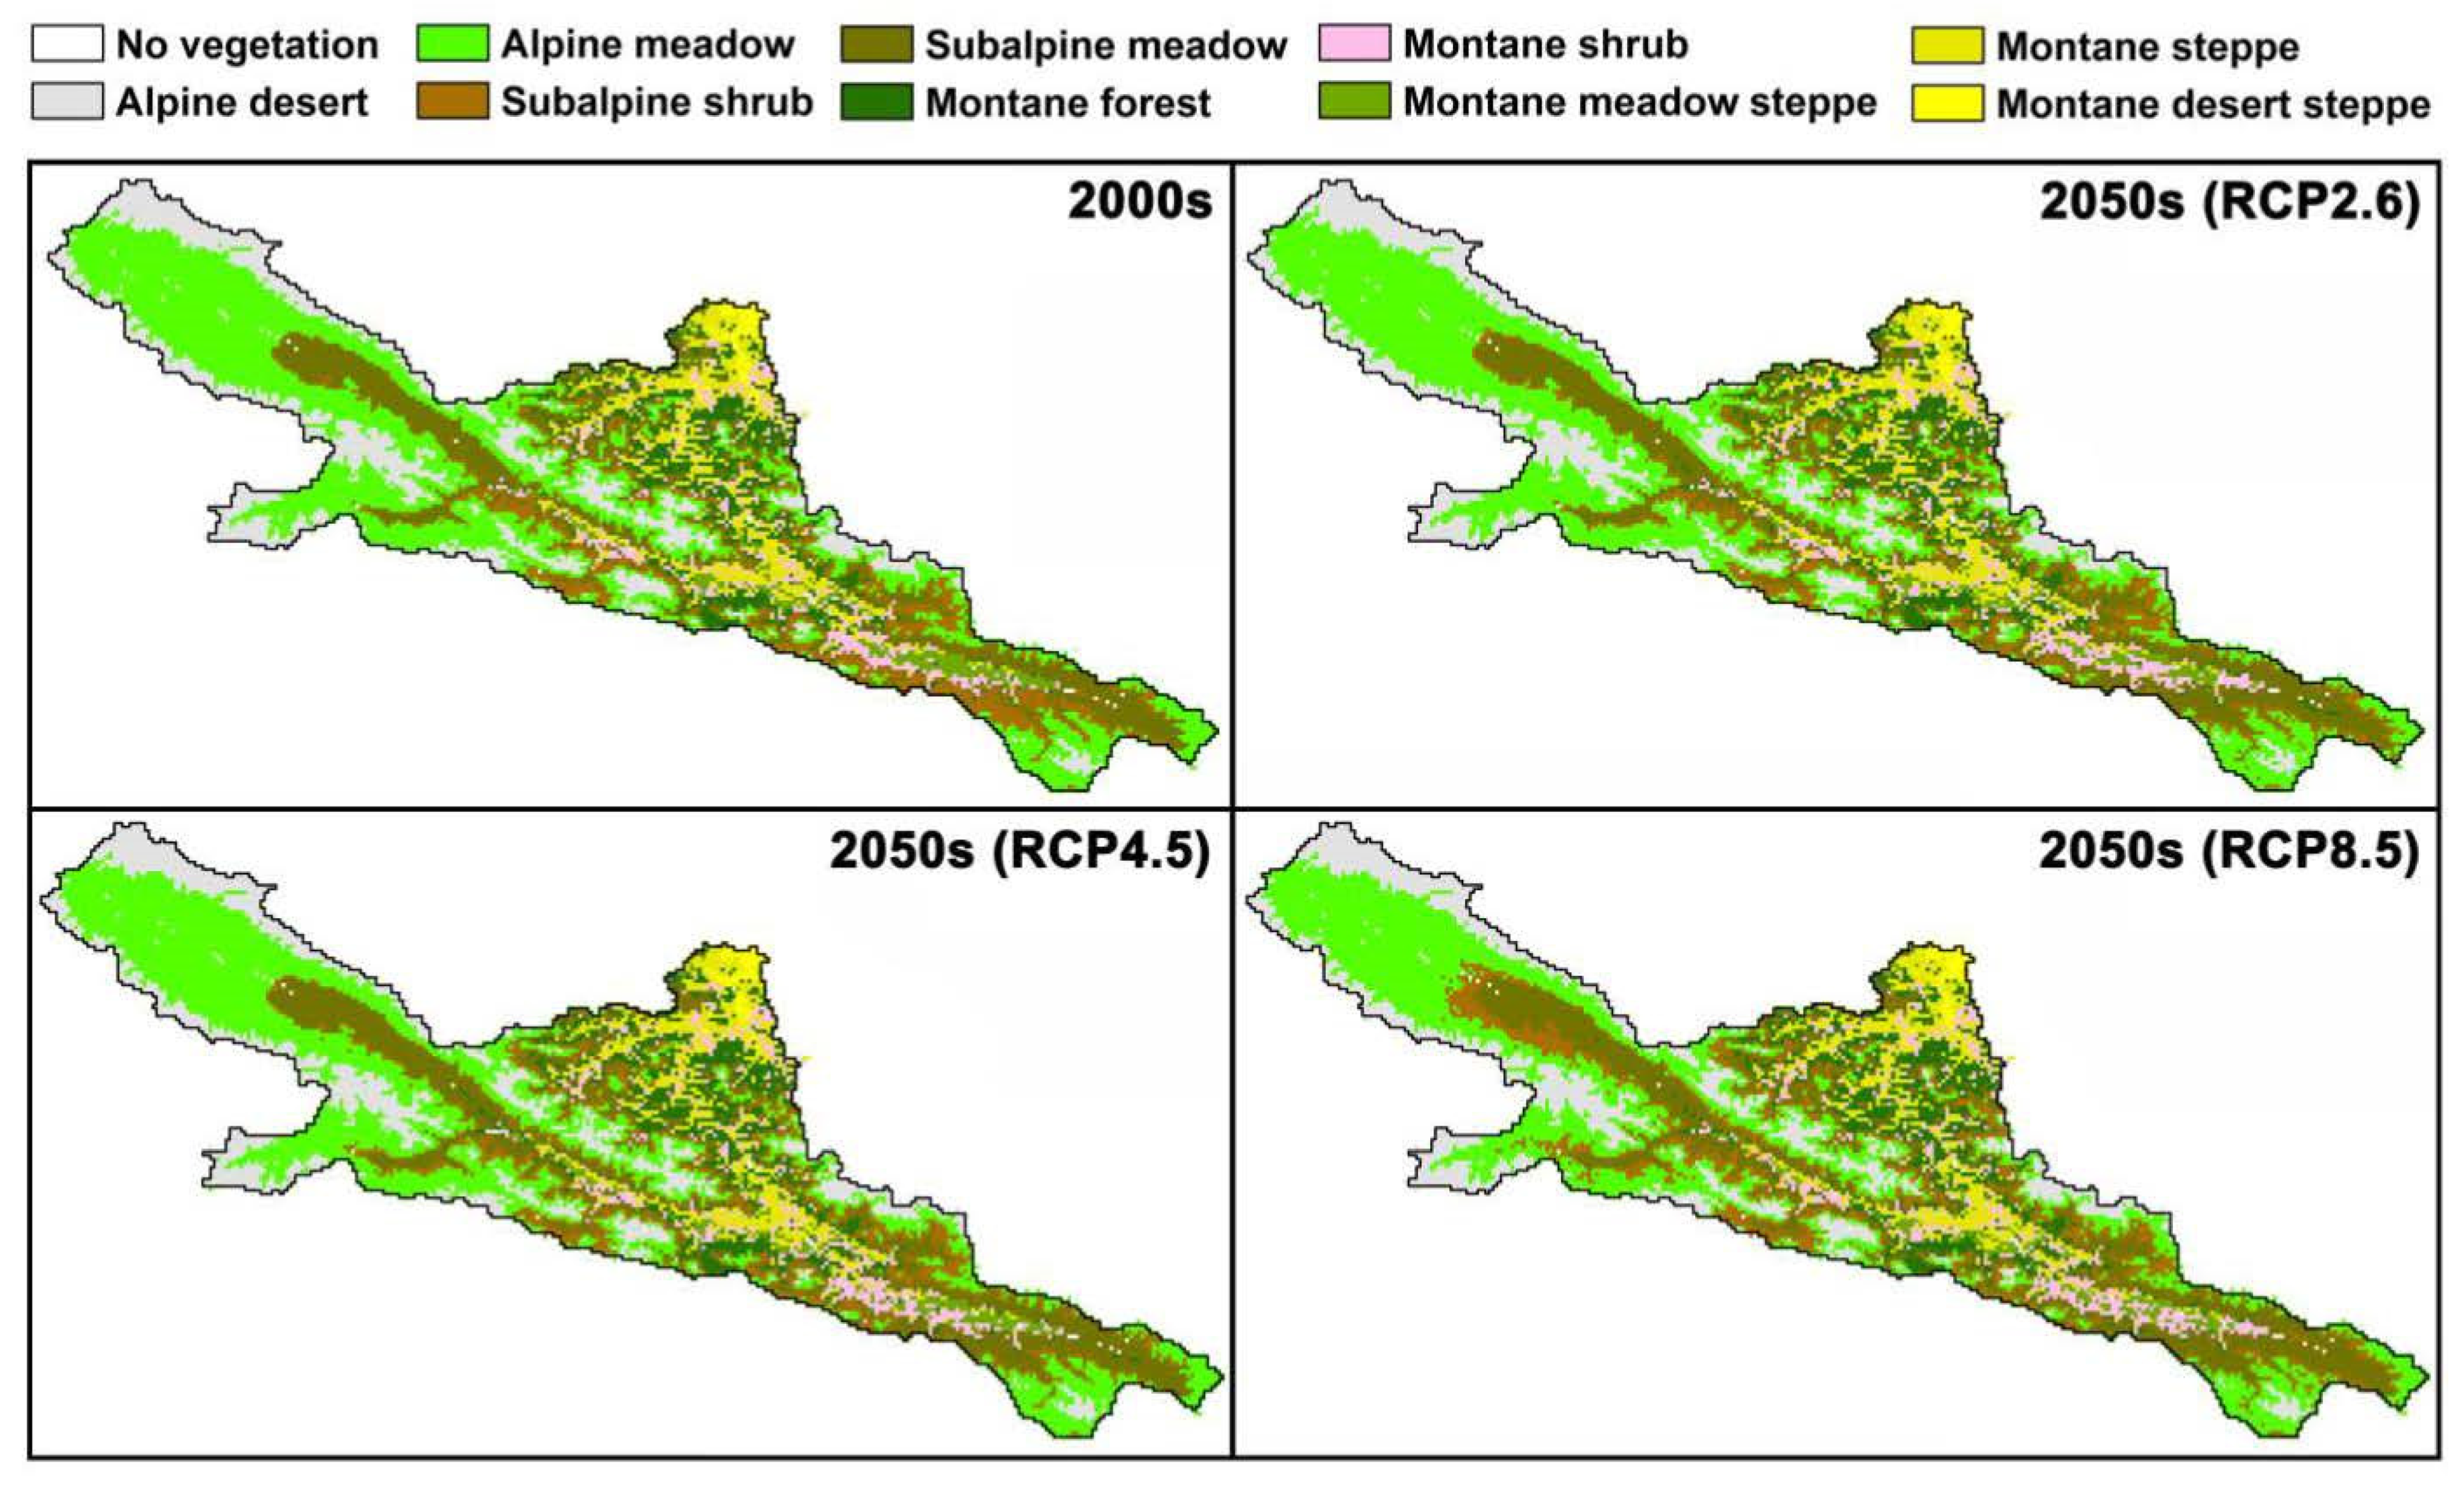
The climate in the middle Qilian Mountains was expected to getting warmer and wetter from the 2000s to the 2050s (Figure 2 and Figure 3). Specifically, the area-weighted temperature was −3.3 °C for the 2000s, while increased by 1.9 °C, 2.4 °C and 2.9 °C to the 2050s under the RCP2.6, RCP4.5 and RCP8.5 scenarios, and higher elevation regions seemed to be characterized by a slightly larger increase in comparison with the lower elevation zones, especially under the RCP8.5 scenario (Figure 4). As for the precipitation, it was 344.70 mm in the 2000s, while it increased by 18.37, 19.80 and 30.80 mm to the 2050s under the three scenarios, and precipitation in higher elevation regions tended to experience greater increases (Figure 5). The vegetation type distribution tended to be less varied over time (Figure 6). The area of subalpine meadow, montane shrub and montane forest increased by 199.29, 40.46 and 3.47 km2, respectively, from the 2000s to the 2050s, while the area of alpine meadow and alpine desert shrank by 124.37 and 57.69 km2 under the RCP2.6 scenario, respectively. By contrast, the spatial distribution of NDVI varied significantly from the 2000s to the 2050s (Figure 7), and NDVI was estimated to increase in high-elevation zones while decrease in mid-elevation zones (Table 1). Overall, the mean NDVI in the 2050s was 0.500, 0.507 and 0.492 under the RCP2.6, RCP4.5 and RCP8.5 scenarios, which was higher than that in the 2000s by 0.012, 0.019 and 0.004, respectively.
3.2. SOC Prediction under Different Climate Change Scenarios
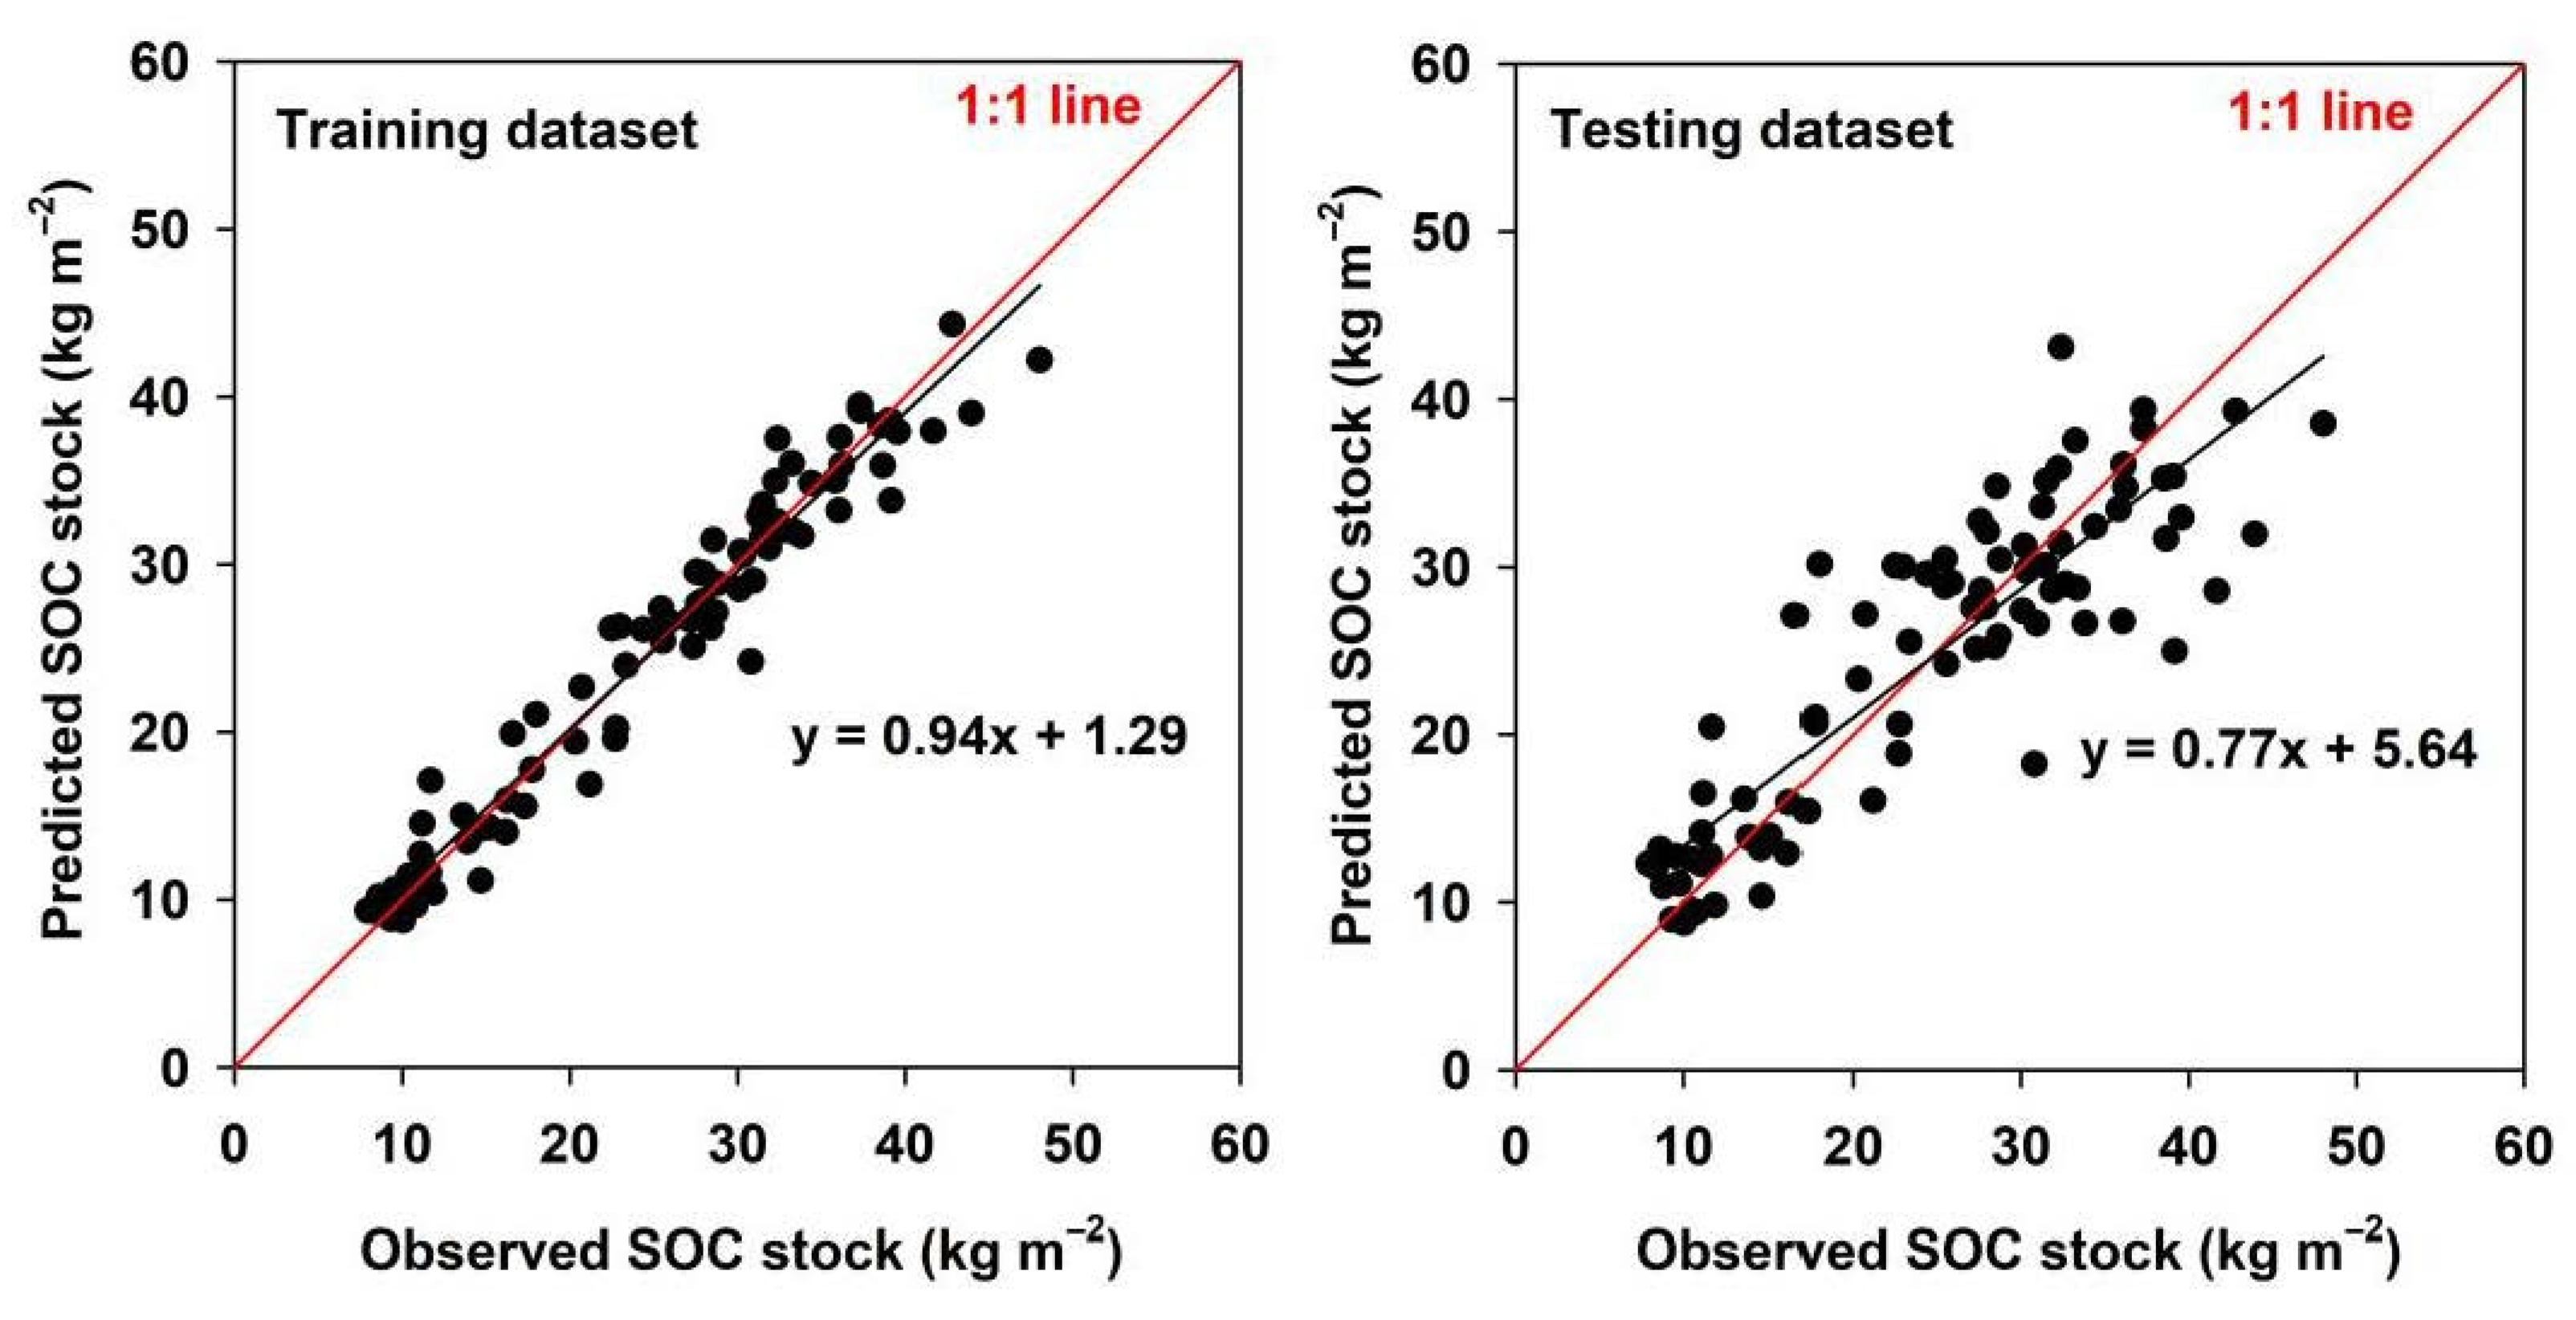
The data-driven model based on the random forest algorithm could accurately simulate the non-linear relationships between SOC stock and temperature, precipitation, vegetation, terrain attributes, soil type and geographic positions, with a slope of 0.77 and an intercept of 5.64 kg m–2 between the measured and predicted values for the test datasets (Figure 8). The ten-fold cross-validation results further show that the R2 and RMSE values of the model were 0.78 and 5.10 kg m−2, respectively (Table 2). The estimated SOC stock maps demonstrated large heterogeneity of SOC in alpine regions, ranging from 0 to 38.97 kg m−2 in the 2000s, and 0 to 38.77 kg m−2, 0 to 38.62 kg m−2 and 0 to 36.27 kg m−2 in the 2050s for the RCP2.6, RCP4.8 and RCP8.5 scenarios, respectively (Figure 9). In addition, the spatial patterns of SOC stock as predicted by the model were closely related to elevation in both the 2000s and the 2050s, i.e., the SOC stock in mid-elevation zones was significantly higher than that in lower and higher elevation zones (Figure 9).
3.3. Elevation-Dependent SOC Dynamics in the Qilian Mountains
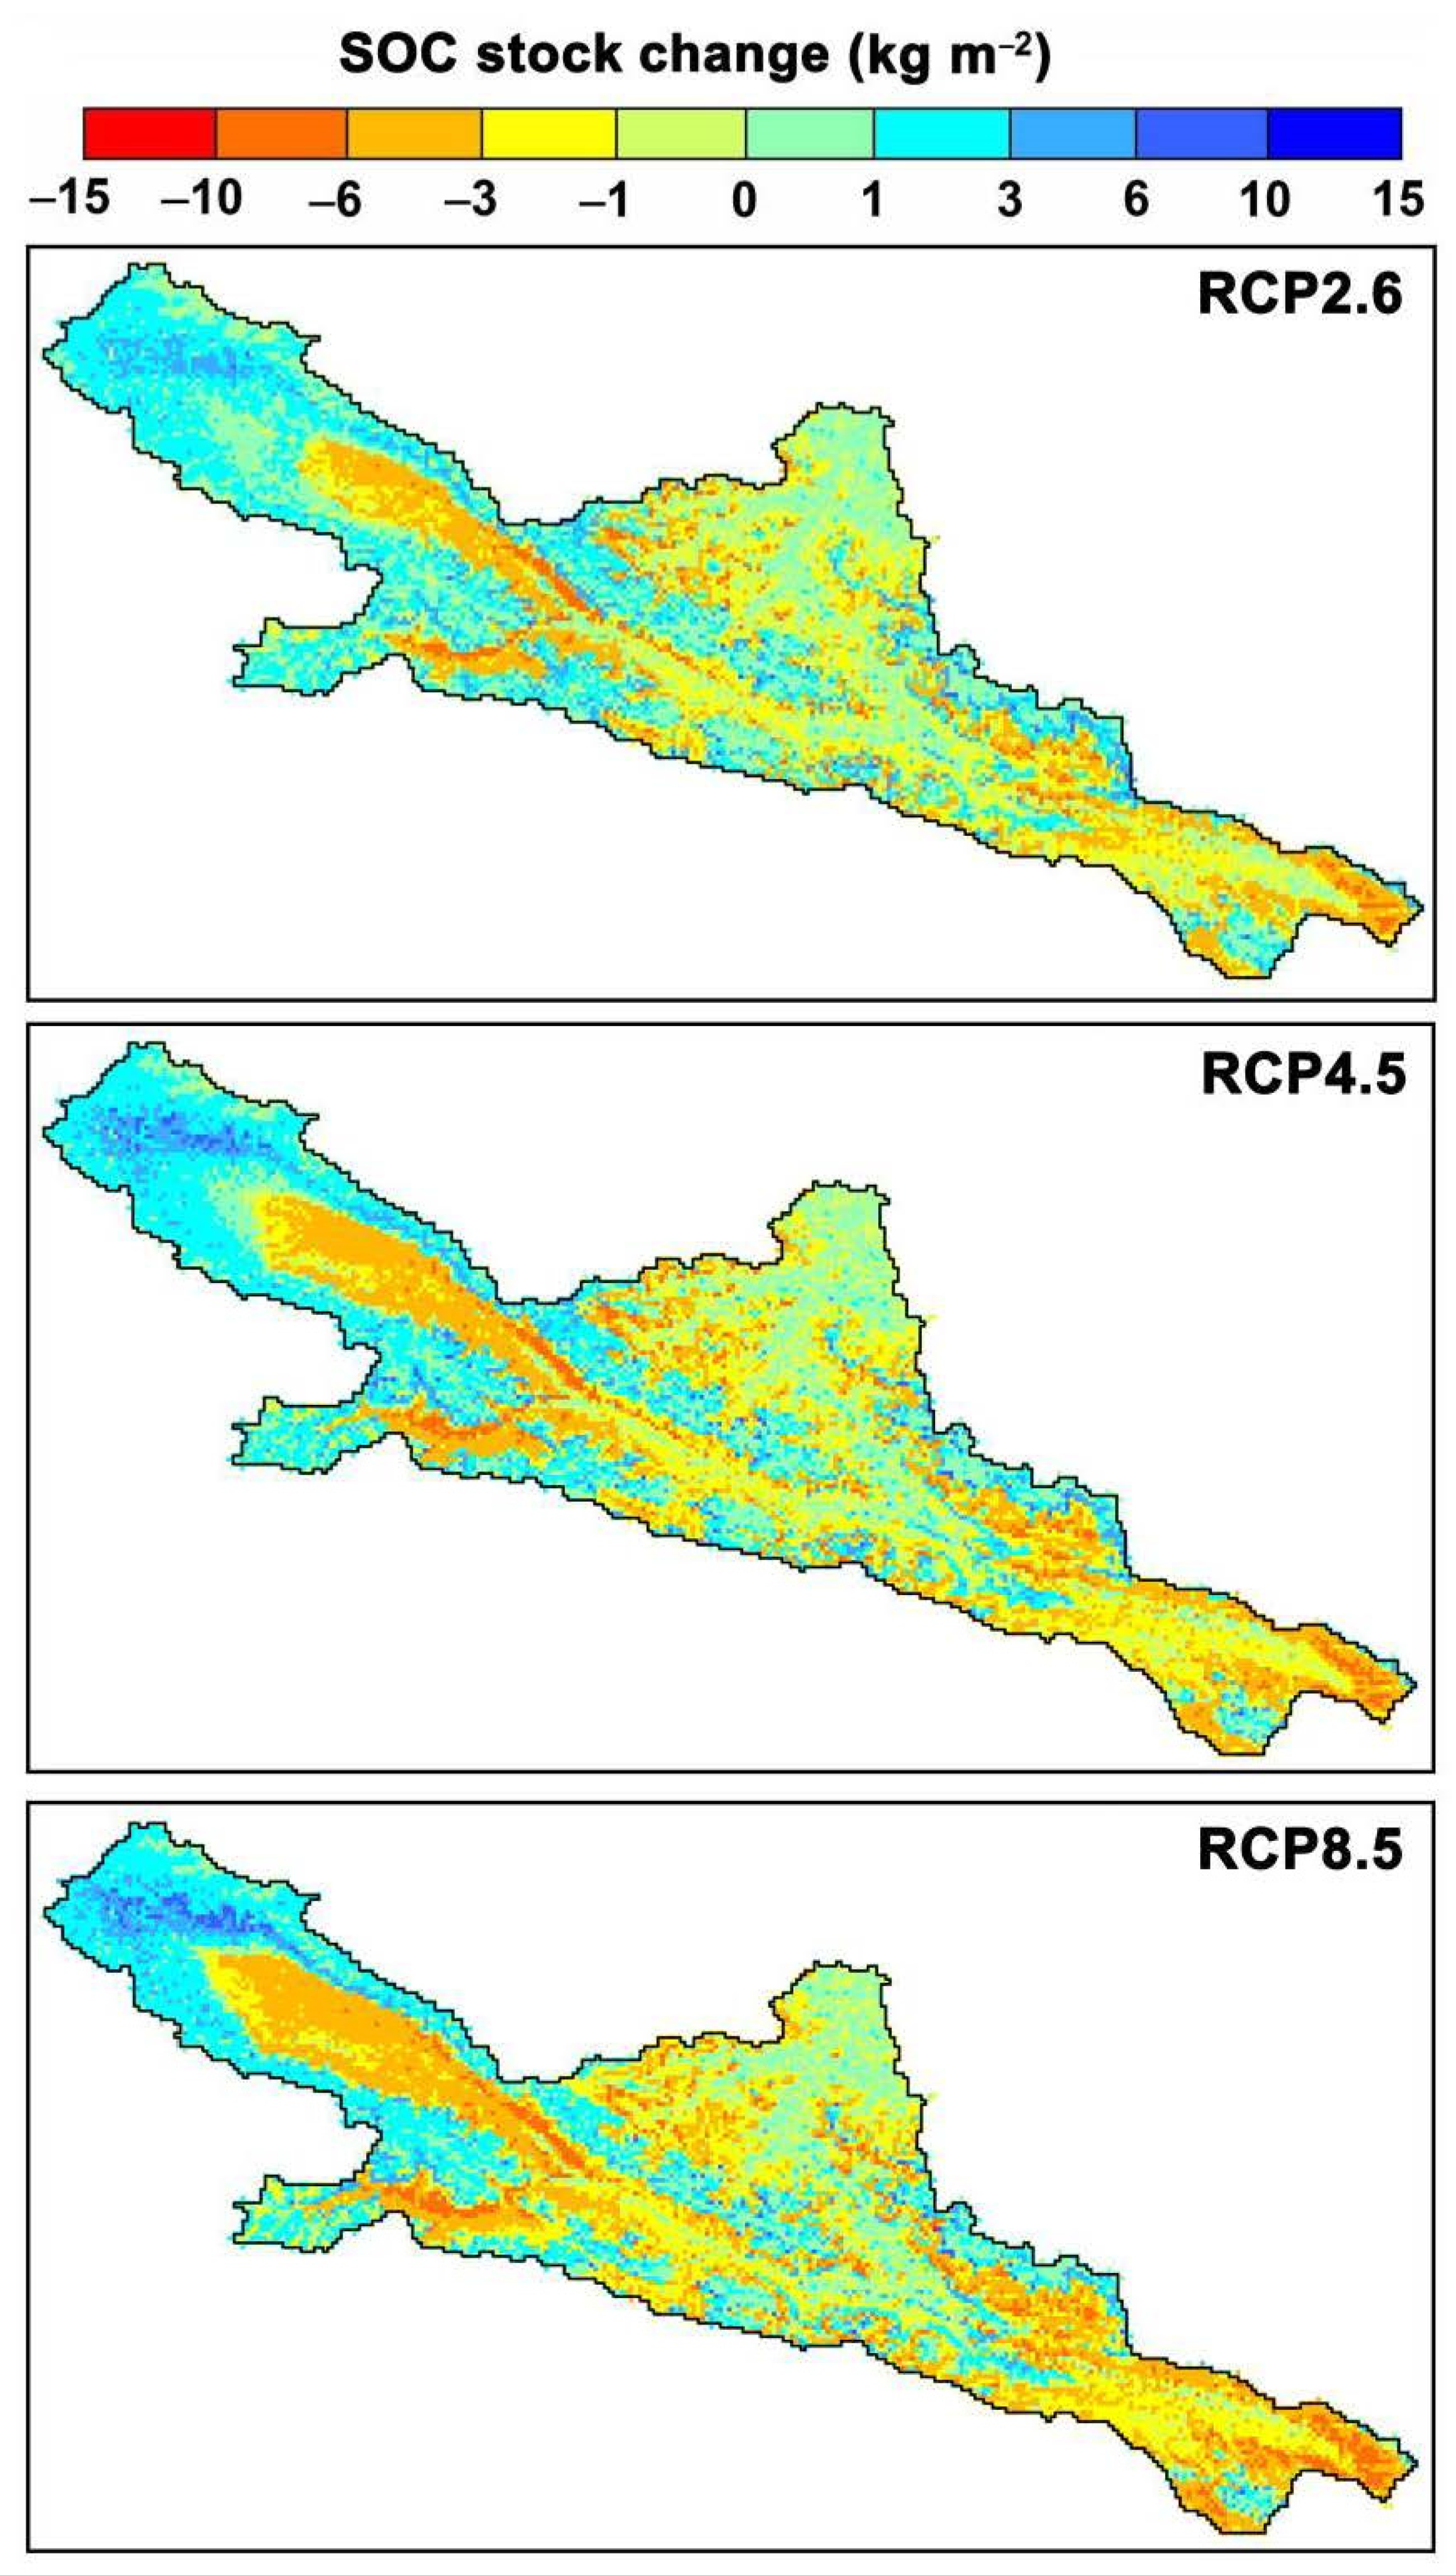
The area-weighted SOC stock was predicted to decrease significantly from the 2000s to the 2050s, with a loss of 0.43, 0.63 and 1.01 kg m–2 carbon (i.e., 4.55, 6.66 and 10.62 Tg for SOC storage over the basin) under the RCP2.6, RCP4.5 and RCP8.5 scenarios, respectively (Table 3 and Table 4). However, the direction of SOC changes varied a lot at the basin scale, i.e., SOC losses mainly occurred at the mid-west and east parts of the basins (Figure 10). Further analysis showed that the size and direction of SOC changes seemed to be elevation-dependent (Figure 11). As for the RCP2.6 scenario, the SOC stock increased in regions with an elevation <3100 m or >3900, while it decreased at 3100–3900 m and varied less below 2900 m. Similar distribution patterns for SOC dynamics along the elevation gradient were also found under the RCP4.5 and RCP8.5 scenarios.
SOC changes also varied significantly with vegetation and soil types. The subalpine meadow was estimated to experience a decrease of 2.85, 3.24 and 3.64 kg m–2 for SOC stock (i.e., 5.03, 5.76 and 6.60 Tg for SOC storage) under the RCP2.6, RCP4.5 and RCP8.5 scenarios, respectively (Table 3 and Table 4). However, the alpine desert tended to significantly accumulate organic carbon in soils, reaching 0.76, 0.99 and 1.06 kg m–2 for SOC stock, and 1.32, 1.72 and 1.86 Tg for SOC storage. As for soil types, the SOC stock in the Eutric Leptosols was expected to be characterized by the largest decrease, reaching 1.90, 1.96 and 2.38 kg m–2 for the RCP2.6, RCP4.5 and RCP8.5 scenarios, respectively (Table 5). Nevertheless, the largest total amount of carbon loss was contributed by the Mollic Leptosols, which were projected to lose 4.15, 5.33 and 6.71 Tg of carbon under the three scenarios by the 2050s. By contrast, the Glacic Cryosols were estimated to significantly accumulate organic carbon, reaching 0.83, 0.95 and 0.84 kg m–2 for SOC stock, and 1.60, 1.83 and 1.62 Tg for SOC storage by the 2050s under the three scenarios (Table 5).
4. Discussion
4.1. SOC Prediction
Considering the ideal performance of the random forest algorithm in capturing the non-linear relationships between the SOC and other environmental covariates, we employed this algorithm to construct the data-driven model for future SOC dynamics projection based on the space-for-time substitution method [45,46]. Similar method was also employed by Gray et al. [14] and Adhikari et al. [24]. However, it should be noted that although land use change was also an important variable in modelling SOC dynamics in previous studies [16,21,47], we did not include it in the model for this study. This was mainly because the anthropogenic disturbances were relatively limited after the National Nature Reserve of the Qilian Mountains was established in 1988, and the human-induced land use change was not intense [48]. Furthermore, the vegetation activity in alpine regions was mainly affected by precipitation and temperature [27], and its effect on SOC dynamics was also considered in the model by using the dynamic NDVI datasets as model inputs in SOC projection.
SOC changes over time may also be affected by other environmental factors such as nitrogen deposition, climate extremes, CO2 enrichment, and ecological restoration practices [22]. However, in regions such as the middle Qilian Mountains characterized by a semiarid alpine climate, water and heat conditions may be the dominant factors affecting ecosystem productivity over time, in comparison with factors such as nitrogen deposition, climate extremes, and CO2 enrichment. As for ecological restoration practices, the complex topography and limited accessibility made it impossible to conduct large-scale reforestation or oversowing in high-elevation zones. Hence, current ecological restoration practices in the middle Qilian Mountains mainly seek to maintain the authenticity of zonal ecosystems through excluding human disturbances [8,33]. In addition, the objective of this study was to determine the potential responses of the SOC temporal dynamics to future climate change scenarios. Although omitting these factors in modelling may lend uncertainty to these predictions to some degree [23,24,49], we believed that our results about SOC changes in response to future climate change were instructive for future carbon management in the Qilian Mountains. Overall, the sharp changes in precipitation and temperature and limited anthropogenic disturbances in the Qilian Mountains enabled us to use the space-for-time substitution method to model SOC dynamics over time with the carbon–environment relationships derived at the spatial scale. In this study, the ten-fold cross-validation presented a quite high R2 value of 0.74 for the test dataset, which was slightly higher than that of previous studies focusing on modelling the spatio-temporal patterns of SOC in nearby regions [5,22,34]. Thus, our results indicate that the combination of systematic measurements with the machine learning model allowed spatially explicit estimates of SOC changes to be made.
4.2. Elevation-Dependent SOC Dynamics
Our model suggests that the SOC stock in the middle Qilian Mountains is expected to experience overall losses under the three climate change scenarios. Our results coincide with those from previous studies [24,50]. However, as we hypothesized, we found that the size and direction of SOC changes seemed to be elevation-dependent, i.e., the SOC stock decreased significantly in mid-elevation zones, while it increased in high-elevation zones and varied less in low-elevation zones in the study area. Similar results were also demonstrated by Chen et al. [2], who found that soils in the Yunnan province experienced intense carbon losses at 3000–3500 m while significant accumulation above 4500 m during the period of 1986–2015. In addition, Ding et al. [51] found that soils of alpine grasslands of the Tibetan Plateau (>4000 m) were also characterized by significant carbon accumulation from the 2000s to the 2010s. It was widely acknowledged that the increase in temperature could stimulate the activity of soil microorganisms, thus accelerating the loss rate of carbon from the soil into the atmosphere [20,52,53]. However, for high-elevation zones, the increase in temperature could also enhance the accumulated temperature, which prolongs the growing season and further stimulates the vegetation productivity. These effects finally lead to increased carbon inputs into soils from both aboveground biomass and roots. As a result, the warming-induced enhancement in productivity may offset the potential decrease in SOC as affected by increased microbial activities in high-elevation zones. Furthermore, considering the arid climate conditions in the middle Qilian Mountains, the increase in precipitation under the three climate change scenarios could significantly enhance the ecosystem net primary production, which also contributes to carbon accumulation in alpine soils.
The mid-elevation zones, which were mainly occupied by subalpine shrubs, subalpine meadows, and montane forests, were predicted to experience the most intense carbon losses under future climate change scenarios. Presumably, this was associated with the high initial standing SOC stock in the three vegetation types, which were larger than 24 kg m−2 (Table 3). Crowther et al. [54] demonstrated that the effect of warming on SOC losses depend on the initial standing carbon stock and considerable carbon losses occurred in soils with high carbon stock, based on assembling data from field experiments in the Northern Hemisphere. In this study, due to the very high SOC values of alpine ecosystems, increased temperature will strongly enhance the activity of microorganisms, leading to accelerated SOC decomposition and intense carbon losses. In addition, as the water and heat conditions in the mid-elevation zones were relatively favorable, both vegetation productivity and SOC stock were at a very high level, and a large amount of humus was accumulated in topsoils. In this case, the effects of precipitation change on vegetation productivity were less significant in comparison with those in low-elevation zones, where the vegetation growth was strongly affected by water conditions. As a result, the positive effects of wetting were much trivial in comparison with those of warming in the mid-elevation zones. Our results are similar to the findings of Prietzel et al. [50] in the German Alps, who demonstrated that warming significantly accelerated the release of carbon from soils with a high initial carbon content, especially for forest soils. In this study, the low-elevation zones were characterized by a relatively high temperature and limited precipitation, and thus water availability was the dominant environmental factor affecting vegetation productivity. The positive effects of precipitation increase may offset the negative effects induced by warming, and thus the SOC stock changes in low-elevation zones were relatively trivial.
The SOC spatio-temporal dynamics were hypothesized to be closely related to soil types. As an important pedological factor, the soil type was generally considered as a predictor for modelling SOC in previous studies [14,45]. In this study, we found that the inclusion of soil types could improve the R2 values of random forest models by 4% and reduce the RMSE by 0.40 kg m−2, suggesting an important role of soil types in shaping the spatio-temporal pattern of SOC. Considering the thin soil layers in alpine regions, we separately calculated the SOC stock at 0–20 cm for Glacic Cryosols, while calculating it at 0–60 cm for other soil types. Such efforts could avoid the overestimation of SOC stocks in Glacic Cryosols, and make the SOC projections in alpine regions more reasonable. In addition, we found that the size and direction of SOC changes under the three climate change scenarios differed by soil type. Specifically, the SOC stock tended to decrease significantly in Leptosols, especially in Eutric Leptosols and Mollic Leptosols, while it increased significantly in Glacic Cryosols. This was mainly because the Leptosols in the study area were located at 3000–3900 m, where the standing carbon stocks were very high (>24 kg m−2). In addition, the Leptosols were generally characterized by a thin soil layer, and thus topsoil SOC tended to be more prone to experiencing rapid loss due to climate warming. By contrast, the Glacic Cryosols were generally located in regions close to glaciers, where the heat conditions were the main drivers of vegetation activity. Climate warming could accelerate glaciers retreat, and carbon in Glacic Cryosols may significantly accumulate due to enhanced vegetation activity and litter input. The SOC stocks in Haplic Chernozems, Haplic Kastanozems and Haplic Calcisols were less varied, and this was probably associated with the opposite effects of climate warming and wetting in low-elevation zones, where the precipitation was generally less than 300 mm.
4.3. Implications for SOC Management under Climate Change
The elevation-dependent SOC dynamics implied that the carbon management strategy in the Qilian Mountains should vary with elevation zones. Soil carbon stocks in mid-elevation zones (3100–3900 m), especially in the subalpine shrub-meadow zone, should be given first priority in terms of carbon management under future climate change conditions. The adaptive management practices for carbon pools should mainly aim at effectively reducing carbon losses from soils into the atmosphere. In addition, considering the potential carbon accumulation in high-elevation zones in the future, the adaptive management practices should focus on lowering the intensity of anthropogenic disturbances such as coal mining, overgrazing, and illegal construction, which may reduce the carbon sequestration function of undisturbed alpine soils [33]. SOC in the low-elevation zones was estimated to be less varied under future climate change conditions. Hence, to enhance the carbon stock in the low-elevation zones, additional ecological construction projects instead of simple enclosure or conservation, should be implemented in the future. As the initial standing carbon stocks at low elevations were relatively low due to limited vegetation activity induced by less precipitation, soils here may have large carbon sequestration potential if the vegetation could be well irrigated by additional water [28].
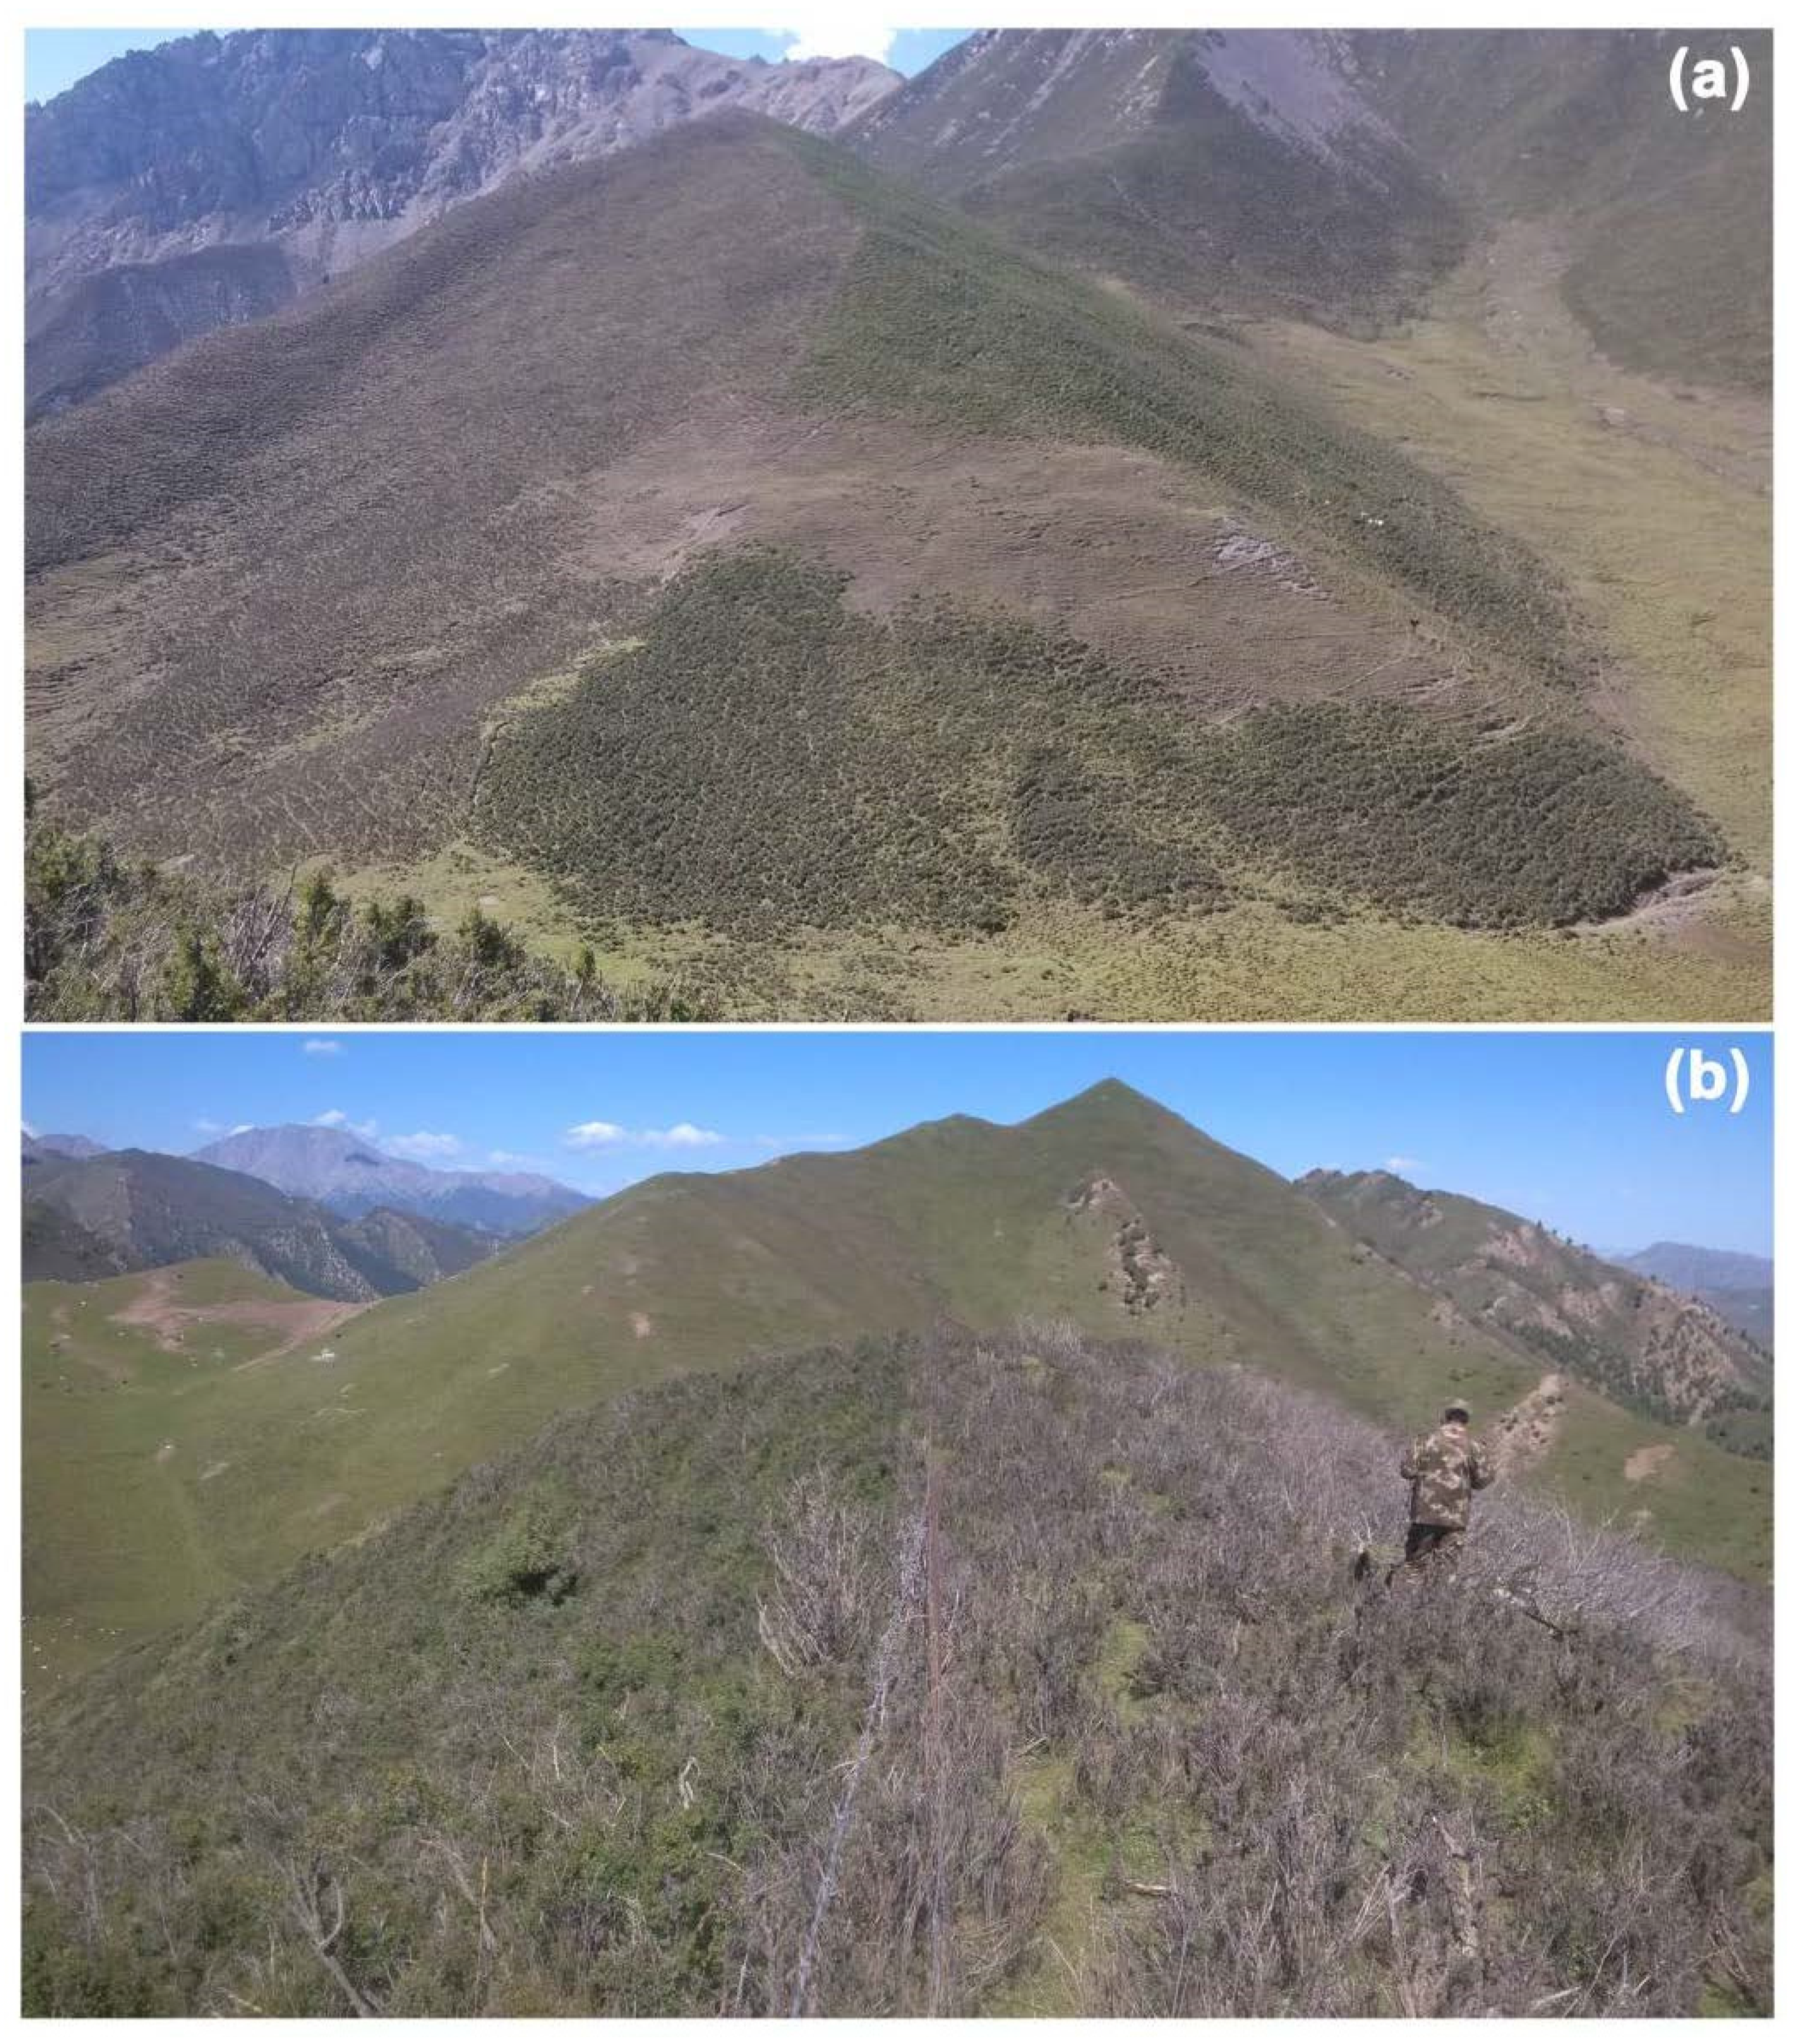
The specific management practices should also differ by elevation zone. For the mid-elevation zones, the rapid losses of SOC were mainly related to the warming-induced increase in soil temperature, and thus measures that could hinder soil temperature increase should be given priority. A previous study showed that the shelter effect of the shrub canopy could significantly lower soil temperature and facilitate SOC accumulation in comparison with that of grasslands under similar topographic conditions in the Qilian Mountains [28]. Therefore, native shrub species such as Caragana jubata, Salix gilashanica and Potentilla fruticosa could be selected for afforestation in grasslands where the climatic and topographic conditions were also suitable for shrub growth. In addition, the number of large livestock should also be further reduced in the Qilian Mountains. The feeding behavior of large livestock such as yaks causes great damage to shrub branches and causes large areas of subalpine shrubs to wither (Figure 12). As a result, the shelter effects of the shrub canopy were weakened, and the high initial standing carbon stocks of subalpine shrubs became more vulnerable under climate warming. In addition, the restoration of degraded grasslands as well as returning cultivated lands to grasslands could also contribute to the carbon sequestration in mid-elevation zones. For the high-elevation zones, SOC dynamics were mainly shaped by climate change, thus conservation may be a better choice considering the harsh climates and limited accessibility in alpine regions. Carbon sequestration in low-elevation zones was essentially an issue related to the trade-off of water resources. In other words, an effective balance between the agricultural and ecological water demand is fundamental for future carbon management. In addition, considering the lower amount of total water resources under such arid climates, on the one hand, unconventional water resources such as seasonal floods in gullies should be utilized through a series of water conservancy projects, and on the other hand, high-efficiency water-saving measures such as drip irrigation should also be taken into account during ecological construction projects in low-elevation zones in the Qilian Mountains.
5. Conclusions
The area-weighted SOC stock in the middle Qilian Mountains was more than 22 kg m–2, and was predicted to decrease significantly from the 2000s to the 2050s with a loss of 0.43, 0.63 and 1.01 kg m−2 under the RCP2.6, RCP4.5 and RCP8.5 scenarios, respectively. As for the whole basin, the total carbon storage loss was 4.55, 6.66 and 10.62 Tg, respectively. However, SOC dynamics were estimated to be elevation-dependent, i.e., the SOC stock increased in regions with an elevation <3100 m or >3900, while it decreased at 3100–3900 m and varied less below 2900 m. SOC changes also varied significantly with vegetation and soil types. The subalpine meadow was projected to experience the most intense carbon loss, reaching to 2.85, 3.24 and 3.64 kg m−2, while the alpine desert tended to significantly accumulate organic carbon in soils, reaching to 0.76, 0.99 and 1.06 kg m−2 under the three scenarios. The largest total amount of carbon loss was contributed by the Mollic Leptosols, which were projected to lose 4.15, 5.33 and 6.71 Tg carbon, while the Glacic Cryosols could possibly sequester 1.60, 1.83 and 1.62 Tg carbon under the three scenarios by the 2050s.
Thus, SOC management practices should also differ by elevation zone and vegetation and soil type. The mid-elevation zones, especially the subalpine shrub-meadow and Mollic Leptosols, should be given priority in terms of reducing CO2 emissions, and the main goal for this region should focus on slowing down the carbon loss rates. Native shrub species such as Caragana jubata, Salix gilashanica and Potentilla fruticosa could be selected for afforestation in grasslands where the climatic and topographic conditions were also suitable for shrub growths. The high-elevation zones, especially the alpine desert and Glacic Cryosols, were expected to experience significant carbon accumulation under future climate change scenarios. Thus, vegetation and soils here should be protected from anthropogenic disturbances to keep the authenticity of the zonal ecosystems. SOC sequestration in low-elevation zones should rely on additional ecological construction projects. Unconventional water resources such as seasonal floods in gullies should be utilized through a series of water conservancy projects, and high-efficiency water-saving measures such as drip irrigation should also be taken into account during ecological construction projects in low-elevation zones in the Qilian Mountains.
Overall, our results highlight the important roles of elevation, vegetation and soil types in soil carbon management under future climate change conditions in the Qilian Mountains.
Author Contributions
W.L. and M.Z. conceived and designed the experiments; M.Z. and Y.L. performed the experiments; J.Z. and L.Y. analyzed the data; W.L. and M.Z. wrote the first draft of the manuscript; C.Z. helped edit the manuscript prior to submission. All authors have read and agreed to the published version of the manuscript.
Funding
This work was supported by the National Natural Science Fund of China (Grant No. 41771252, 42001035, 41801015), the Gansu Science and Technology Association Youth Science and Technology Talent Support Project (GXH20210611-09), the Opening Fund of the Technology Innovation Center for Mine Geological Environment Rehabilitation Engineering in Alpine and Arid Regions, Ministry of Natural Resources (No. HHGGKK2102), the Forestry and Grassland Science and Technology Innovation Program of Gansu Province (Grant No. GYCX [2020]01), Key R&D Program of Gansu Province, China (Grant No. 20YF8FA002), the XPCC Science and Technique Foundation (Grant No. 2021AB021), and the Think Tank Platform Construction Program of Gansu Association for Science and Technology (Grant No. GSAST-ZKPT[2020]01).
Data Availability Statement
The data presented in this study are available on request from the corresponding author for research purposes.
Conflicts of Interest
The authors declare no conflict of interest.
References
- Bangroo, S.A.; Najar, G.R.; Achin, E.; Truong, P.N. Application of predictor variables in spatial quantification of soil organic carbon and total nitrogen using regression kriging in the North Kashmir forest Himalayas. Catena 2020, 193, 104632. [Google Scholar] [CrossRef]
- Chen, D.Y.; Xue, M.Y.; Duan, X.W.; Feng, D.T.; Huang, Y.; Rong, L. Changes in topsoil organic carbon from 1986 to 2010 in a mountainous plateau region in Southwest China. Land Degrad. Develop. 2019, 31, 734–747. [Google Scholar] [CrossRef]
- Pepin, N.; Bradley, R.S.; Diaz, H.F.; Baraer, M.; Caceres, E.B.; Forsythe, N.; Fowler, H.; Greenwood, G.; Hashmi, M.Z.; Liu, X.D.; et al. Elevation-dependent warming in mountain regions of the world. Nat. Clim. Chang. 2015, 5, 424–430. [Google Scholar] [CrossRef] [Green Version]
- Chen, L.Y.; Smith, P.; Yang, Y.H. How has soil carbon stock changed over recent decades? Glob. Chang. Biol. 2015, 21, 3197–3199. [Google Scholar] [CrossRef]
- Ding, J.Z.; Li, F.; Yang, G.B.; Chen, L.Y.; Zhang, B.B.; Liu, L.; Fang, K.; Qin, S.Q.; Chen, Y.L.; Peng, Y.F.; et al. The permafrost carbon inventory on the Tibetan Plateau: A new evaluation using deep sediment cores. Glob. Chang. Biol. 2016, 22, 2688–2701. [Google Scholar] [CrossRef]
- Stockmann, U.; Adams, M.A.; Crawford, J.W.; Field, D.J.; Henakaarchchi, N.; Jenkins, M.; Minasny, B.; McBratney, A.B.; de Courcelles, V.D.R.; Singh, K.; et al. The knowns, known unknowns and unknowns of sequestration of soil organic carbon. Agric. Ecosyst. Environ. 2013, 164, 80–99. [Google Scholar] [CrossRef]
- Bangroo, S.A.; Najar, G.R.; Rasool, A. Effect of altitude and aspect on soil organic carbon and nitrogen stocks in the Himalayan Mawer Forest Range. Catena 2017, 158, 63–68. [Google Scholar] [CrossRef]
- Chen, L.F.; He, Z.B.; Du, J.; Yang, J.J.; Zhu, X. Patterns and environmental controls of soil organic carbon and total nitrogen in alpine ecosystems of northwestern China. Catena 2016, 137, 37–43. [Google Scholar] [CrossRef]
- Bellamy, P.H.; Loveland, P.J.; Bradley, R.I.; Lark, R.M.; Kirk, G.J.D. Carbon losses from all soils across England and Wales 1978–2003. Nature 2005, 437, 245–248. [Google Scholar] [CrossRef] [PubMed] [Green Version]
- Melillo, J.M.; Frey, S.D.; DeAngelis, K.M.; Werner, W.J.; Bernard, M.J.; Bowles, F.P.; Pold, G.; Knorr, M.A.; Grandy, A.S. Long-term pattern and magnitude of soil carbon feedback to the climate system in a warming world. Science 2017, 358, 101–104. [Google Scholar] [CrossRef] [Green Version]
- Wang, S.; Xu, L.; Zhuang, Q.L.; He, N.P. Investigating the spatio-temporal variability of soil organic carbon stocks in different ecosystems of China. Sci. Total Environ. 2021, 758, 143644. [Google Scholar] [CrossRef] [PubMed]
- Hong, S.B.; Yin, G.D.; Piao, S.L.; Dybzinski, R.; Cong, N.; Li, X.Y.; Wang, K.; Penuelas, J.; Zeng, H.; Chen, A.P. Divergent responses of soil organic carbon to afforestation. Nat. Sustain. 2020, 3, 694–700. [Google Scholar] [CrossRef]
- Zhu, M.; Feng, Q.; Zhang, M.X.; Liu, W.; Deo, R.C.; Zhang, C.Q.; Yang, L.S. Soil organic carbon in semiarid alpine regions: The spatial distribution, stock estimation, and environmental controls. J. Soils Sediments 2019, 19, 3427–3441. [Google Scholar] [CrossRef]
- Gray, J.M.; Bishop, T.F.A. Change in soil organic carbon stocks under 12 climate change projections over New South Wales, Australia. Soil Sci. Soc. Am. J. 2016, 80, 1296–1307. [Google Scholar] [CrossRef] [Green Version]
- Luo, Y.Q.; Ahlstrom, A.; Allison, S.D.; Batjes, N.H.; Brovkin, V.; Carvalhais, N.; Chappell, A.; Ciais, P.; Davidson, E.A.; Finzi, A.C.; et al. Toward more realistic projections of soil carbon dynamics by Earth system models. Glob. Biogeochem. Cycles 2016, 30, 40–56. [Google Scholar] [CrossRef]
- Caddeo, A.; Marras, S.; Sallustio, L.; Spano, D.; Sirca, C. Soil organic carbon in Italian forests and agroecosystems: Estimating current stock and future changes with a spatial modelling approach. Agric. For. Meteorol. 2019, 278, 107654. [Google Scholar] [CrossRef]
- Luo, Z.K.; Eady, S.; Sharma, B.; Grant, T.; Liu, D.L.; Cowie, A.; Farquharson, R.; Simmons, A.; Crawford, D.; Searle, R.; et al. Mapping future soil carbon change and its uncertainty in croplands using simple surrogates of a complex farming system model. Geoderma 2019, 337, 311–321. [Google Scholar] [CrossRef]
- Todd-Brown, K.E.O.; Randerson, J.T.; Hopkins, F.; Arora, V.; Hajima, T.; Jones, C.; Shevliakova, E.; Tjiputra, J.; Volodin, E.; Wu, T.; et al. Changes in soil organic carbon storage predicted by Earth system models during the 21st century. Biogeosciences 2014, 11, 2341–2356. [Google Scholar] [CrossRef] [Green Version]
- McBratney, A.B.; Santos, M.L.M.; Minasny, B. On digital soil mapping. Geoderma 2003, 117, 3–52. [Google Scholar] [CrossRef]
- Wang, S.; Zhuang, Q.L.; Yang, Z.J.; Yu, N.; Jin, X.X. Temporal and spatial changes of soil organic carbon stocks in the forest area of northeastern China. Forests 2019, 10, 1023. [Google Scholar] [CrossRef] [Green Version]
- Huang, J.Y.; Hartemink, A.E.; Zhang, Y.K. Climate and land-use change effects on soil carbon stocks over 150 Years in Wisconsin, USA. Remote Sens. 2019, 11, 1504. [Google Scholar] [CrossRef] [Green Version]
- Li, H.W.; Wu, Y.P.; Chen, J.; Zhao, F.B.; Wang, F.; Sun, Y.Z.; Zhang, G.C.; Qiu, L.J. Responses of soil organic carbon to climate change in the Qilian Mountains and its future projection. J. Hydrol. 2021, 596, 126110. [Google Scholar] [CrossRef]
- Wadoux, A.M.J.C.; Minasny, B.; McBratney, A.B. Machine learning for digital soil mapping: Applications, challenges and suggested solutions. Earth-Sci. Rev. 2020, 210, 103359. [Google Scholar] [CrossRef]
- Adhikari, K.; Owens, P.R.; Libohova, Z.; Miller, D.M.; Wills, S.A.; Nemecek, J. Assessing soil organic carbon stock of Wisconsin, USA and its fate under future land use and climate change. Sci. Total Environ. 2019, 667, 833–845. [Google Scholar] [CrossRef] [PubMed]
- Bonfatti, B.R.; Hartemink, A.E.; Giasson, E.; Tornquist, C.G.; Adhikari, K. Digital mapping of soil carbon in a viticultural region of Southern Brazil. Geoderma 2016, 261, 204–221. [Google Scholar] [CrossRef]
- Feng, Q.; Yang, L.S.; Deo, R.C.; AghaKouchak, A.; Adamowski, J.F.; Stone, R.; Yin, Z.L.; Liu, W.; Si, J.H.; Wen, X.H.; et al. Domino effect of climate change over two millennia in ancient China’s Hexi Corridor. Nat. Sustain. 2019, 2, 957–961. [Google Scholar] [CrossRef]
- Yang, L.S.; Feng, Q.; Adamowski, J.F.; Alizadeh, M.R.; Yin, Z.L.; Wen, X.H.; Zhu, M. The role of climate change and vegetation greening on the variation of terrestrial evapotranspiration in northwest China’s Qilian Mountains. Sci. Total Environ. 2021, 759, 143532. [Google Scholar] [CrossRef]
- Zhu, M.; Feng, Q.; Qin, Y.Y.; Cao, J.J.; Zhang, M.X.; Liu, W.; Deo, R.C.; Zhang, C.Q.; Li, R.L.; Li, B.F. The role of topography in shaping the spatial patterns of soil organic carbon. Catena 2019, 176, 296–305. [Google Scholar] [CrossRef]
- Liu, W.; Li, Z.X.; Zhu, M.; Guo, X.Y.; Chen, L.J. Temperature and precipitation changes in Extensive Hexi Region, China, 1960–2011. Sci. Cold Arid Reg. 2016, 8, 212–226. [Google Scholar] [CrossRef]
- Zhu, M.; Feng, Q.; Qin, Y.Y.; Cao, J.J.; Li, H.Y.; Zhao, Y. Soil organic carbon as functions of slope aspects and soil depths in a semiarid alpine region of Northwest China. Catena 2017, 152, 94–102. [Google Scholar] [CrossRef]
- Chen, L.H.; Qu, Y.G.; Chen, H.S.; Li, F.X. Water and Land Resources and Their Rational Development and Utilizationin the Hexi Region; Science Press: Beijing, China, 1992. (In Chinese) [Google Scholar]
- IUSS Working Group WRB. World Reference Base for Soil Resources 2014, Update 2015 International Soil Classification System for Naming Soils and Creating Legends for Soil Maps; World Soil Resources Reports, No. 106; FAO: Rome, Italy, 2015. [Google Scholar]
- Li, Z.X.; Feng, Q.; Li, Z.J.; Wang, X.F.; Gui, J.; Zhang, B.J.; Li, Y.C.; Deng, X.H.; Xue, J.; Gao, W.D.; et al. Reversing conflict between humans and the environment—The experience in the Qilian Mountains. Renew. Sustain. Energy Rev. 2021, 148, 111333. [Google Scholar] [CrossRef]
- Song, X.D.; Brus, D.J.; Liu, F.; Li, D.C.; Zhao, Y.G.; Yang, J.L.; Zhang, G.L. Mapping soil organic carbon content by geographically weighted regression: A case study in the Heihe River Basin, China. Geoderma 2016, 261, 11–22. [Google Scholar] [CrossRef]
- Wu, T.W.; Lu, Y.X.; Fang, Y.J.; Xin, X.G.; Li, L.; Li, W.P.; Jie, W.H.; Zhang, J.; Liu, Y.M.; Zhang, L.; et al. The Beijing Climate Center Climate System Model (BCC-CSM): The main progress from CMIP5 to CMIP6. Geosci. Model Dev. 2019, 12, 1573–1600. [Google Scholar] [CrossRef] [Green Version]
- Bentsen, M.; Bethke, I.; Debernard, J.B.; Iversen, T.; Kirkevag, A.; Seland, O.; Drange, H.; Roelandt, C.; Seierstad, I.A.; Hoose, C.; et al. The Norwegian Earth System Model, NorESM1-M—Part 1: Description and basic evaluation of the physical climate. Geosci. Model Dev. 2013, 6, 687–720. [Google Scholar] [CrossRef] [Green Version]
- Iversen, T.; Bentsen, M.; Bethke, I.; Debernard, J.B.; Kirkevag, A.; Seland, O.; Drange, H.; Kristjansson, J.E.; Medhaug, I.; Sand, M.; et al. The Norwegian Earth System Model, NorESM1-M—Part 2: Climate response and scenario projections. Geosci. Model Dev. 2013, 6, 389–415. [Google Scholar] [CrossRef] [Green Version]
- Jones, C.D.; Hughes, J.K.; Bellouin, N.; Hardiman, S.C.; Jones, G.S.; Knight, J.; Liddicoat, S.; O’Connor, F.M.; Andres, R.J.; Bell, C.; et al. The HadGEM2-ES implementation of CMIP5 centennial simulations. Geosci. Model Dev. 2011, 4, 543–570. [Google Scholar] [CrossRef] [Green Version]
- Dufresne, J.L.; Foujols, M.A.; Denvil, S.; Caubel, A.; Marti, O.; Aumont, O.; Balkanski, Y.; Bekki, S.; Bellenger, H.; Benshila, R.; et al. Climate change projections using the IPSL-CM5 Earth System Model: From CMIP3 to CMIP5. Clim. Dyn. 2013, 40, 2123–2165. [Google Scholar] [CrossRef]
- Schmidt, G.A.; Kelley, M.; Nazarenko, L.; Ruedy, R.; Russell, G.L.; Aleinov, I.; Bauer, M.; Bauer, S.E.; Bhat, M.K.; Bleck, R.; et al. Configuration and assessment of the GISS ModelE2 contributions to the CMIP5 archive. J. Adv. Model. Earth Syst. 2014, 6, 141–184. [Google Scholar] [CrossRef]
- Breiman, L. Random forests. Mach. Learn. 2001, 45, 5–32. [Google Scholar] [CrossRef] [Green Version]
- Yang, R.M.; Zhang, G.L.; Liu, F.; Lu, Y.Y.; Yang, F.; Yang, F.; Yang, M.; Zhao, Y.G.; Li, D.C. Comparison of boosted regression tree and random forest models for mapping topsoil organic carbon concentration in an alpine ecosystem. Ecol. Indic. 2016, 60, 870–878. [Google Scholar] [CrossRef]
- Zhao, C.Y.; Nan, Z.R.; Cheng, G.D. Methods for modelling of temporal and spatial distribution of air temperature at landscape scale in the southern Qilian Mountains, China. Ecol. Model. 2005, 189, 209–220. [Google Scholar] [CrossRef]
- Zhao, C.Y.; Nan, Z.R.; Cheng, G.D.; Zhang, J.H.; Feng, Z.D. GIS-assisted modelling of the spatial distribution of Qinghai spruce (Picea crassifolia) in the Qilian Mountains, northwestern China based on biophysical parameters. Ecol. Model. 2006, 191, 487–500. [Google Scholar] [CrossRef]
- Adhikari, K.; Hartemink, A.E.; Minasny, B.; Kheir, R.B.; Greve, M.B.; Greve, M.H. Digital mapping of soil organic carbon contents and stocks in Denmark. PLoS ONE 2014, 9, e105519. [Google Scholar] [CrossRef]
- Mulder, V.L.; Lacoste, M.; Richer-de-Forges, A.C.; Martin, M.P.; Arrouays, D. National versus global modelling the 3D distribution of soil organic carbon in mainland France. Geoderma 2016, 263, 16–34. [Google Scholar] [CrossRef]
- Soleimani, A.; Hosseini, S.M.; Bavani, A.R.M.; Jafari, M.; Francaviglia, R. Simulating soil organic carbon stock as affected by land cover change and climate change, Hyrcanian forests (northern Iran). Sci. Total Environ. 2017, 599, 1646–1657. [Google Scholar] [CrossRef]
- Yang, L.S.; Feng, Q.; Yin, Z.L.; Wen, X.H.; Si, J.H.; Li, C.B.; Deo, C.R. Identifying separate impacts of climate and land use/cover change on hydrological processes in upper stream of Heihe River, Northwest China. Hydrol. Process. 2017, 31, 1100–1112. [Google Scholar] [CrossRef]
- Wiesmeier, M.; Urbanski, L.; Hobley, E.; Lang, B.; von Luetzow, M.; Marin-Spiotta, E.; van Wesemael, B.; Rabot, E.; Liess, M.; Garcia-Franco, N.; et al. Soil organic carbon storage as a key function of soils—A review of drivers and indicators at various scales. Geoderma 2019, 333, 149–162. [Google Scholar] [CrossRef]
- Prietzel, J.; Zimmermann, L.; Schubert, A.; Christophel, D. Organic matter losses in German Alps forest soils since the 1970s most likely caused by warming. Nat. Geosci. 2016, 9, 543–550. [Google Scholar] [CrossRef]
- Ding, J.Z.; Chen, L.Y.; Ji, C.J.; Hugelius, G.; Li, Y.N.; Liu, L.; Qin, S.Q.; Zhang, B.B.; Yang, G.B.; Li, F.; et al. Decadal soil carbon accumulation across Tibetan permafrost regions. Nat. Geosci. 2017, 10, 420–424. [Google Scholar] [CrossRef] [Green Version]
- Jakšić, S.; Ninkov, J.; Milić, S.; Vasin, J.; Zivanov, M.; Jaksic, D.; Komlen, V. Influence of slope gradient and aspect on soil organic carbon content in the region of Nis, Serbia. Sustainability 2021, 13, 8332. [Google Scholar] [CrossRef]
- Yang, Y.H.; Mohammat, A.; Feng, J.M.; Zhou, R.; Fang, J.Y. Storage, patterns and environmental controls of soil organic carbon in China. Biogeochemistry 2007, 84, 131–141. [Google Scholar] [CrossRef]
- Crowther, T.W.; Todd-Brown, K.E.O.; Rowe, C.W.; Wieder, W.R.; Carey, J.C.; Machmuller, M.B.; Snoek, B.L.; Fang, S.; Zhou, G.; Allison, S.D.; et al. Quantifying global soil carbon losses in response to warming. Nature 2016, 540, 104–108. [Google Scholar] [CrossRef] [PubMed]
Figure 1.
Distribution of sampling points and soil types across the Yingluoxia basin in the middle Qilian Mountains.
Figure 1.
Distribution of sampling points and soil types across the Yingluoxia basin in the middle Qilian Mountains.
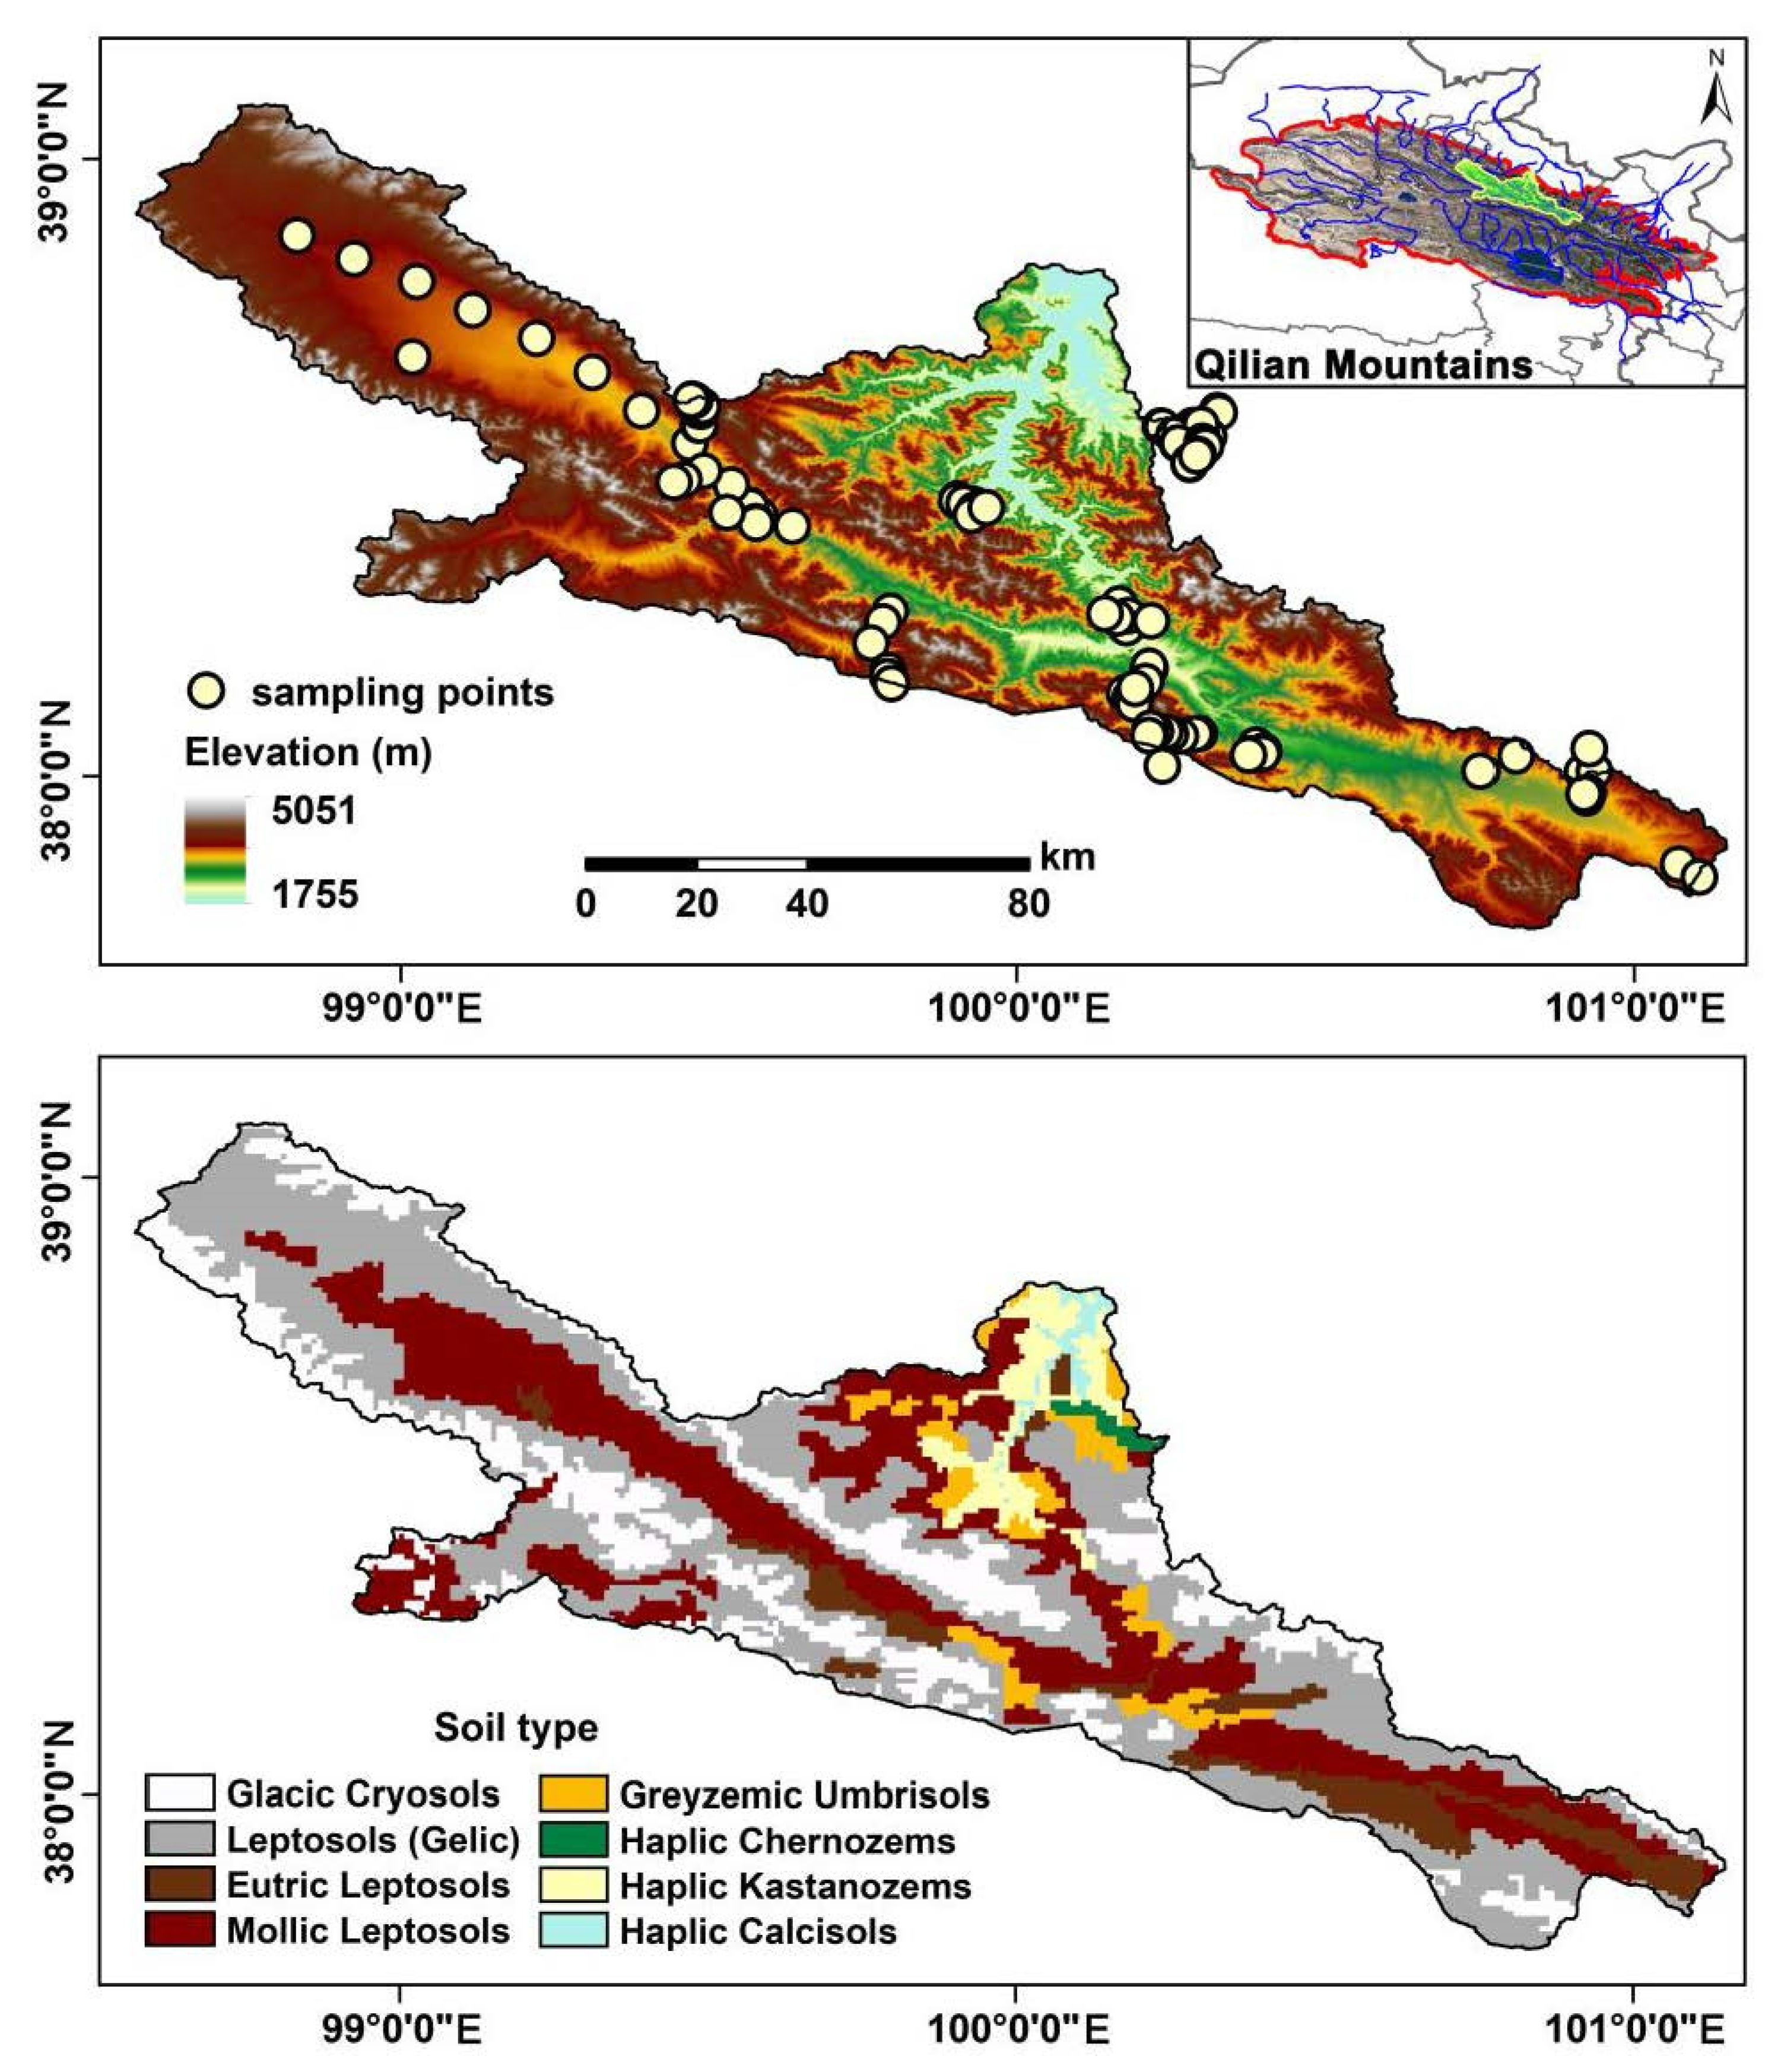
Figure 2.
Distribution of mean annual temperature for the 2000s (1970–2000) and 2050s under the three representative concentration pathways (i.e., RCP2.6, RCP4.5 and RCP8.5) in the study area.
Figure 2.
Distribution of mean annual temperature for the 2000s (1970–2000) and 2050s under the three representative concentration pathways (i.e., RCP2.6, RCP4.5 and RCP8.5) in the study area.

Figure 3.
Distribution of mean annual precipitation for the 2000s (1970–2000) and 2050s under the three representative concentration pathways (i.e., RCP2.6, RCP4.5 and RCP8.5) in the study area.
Figure 3.
Distribution of mean annual precipitation for the 2000s (1970–2000) and 2050s under the three representative concentration pathways (i.e., RCP2.6, RCP4.5 and RCP8.5) in the study area.
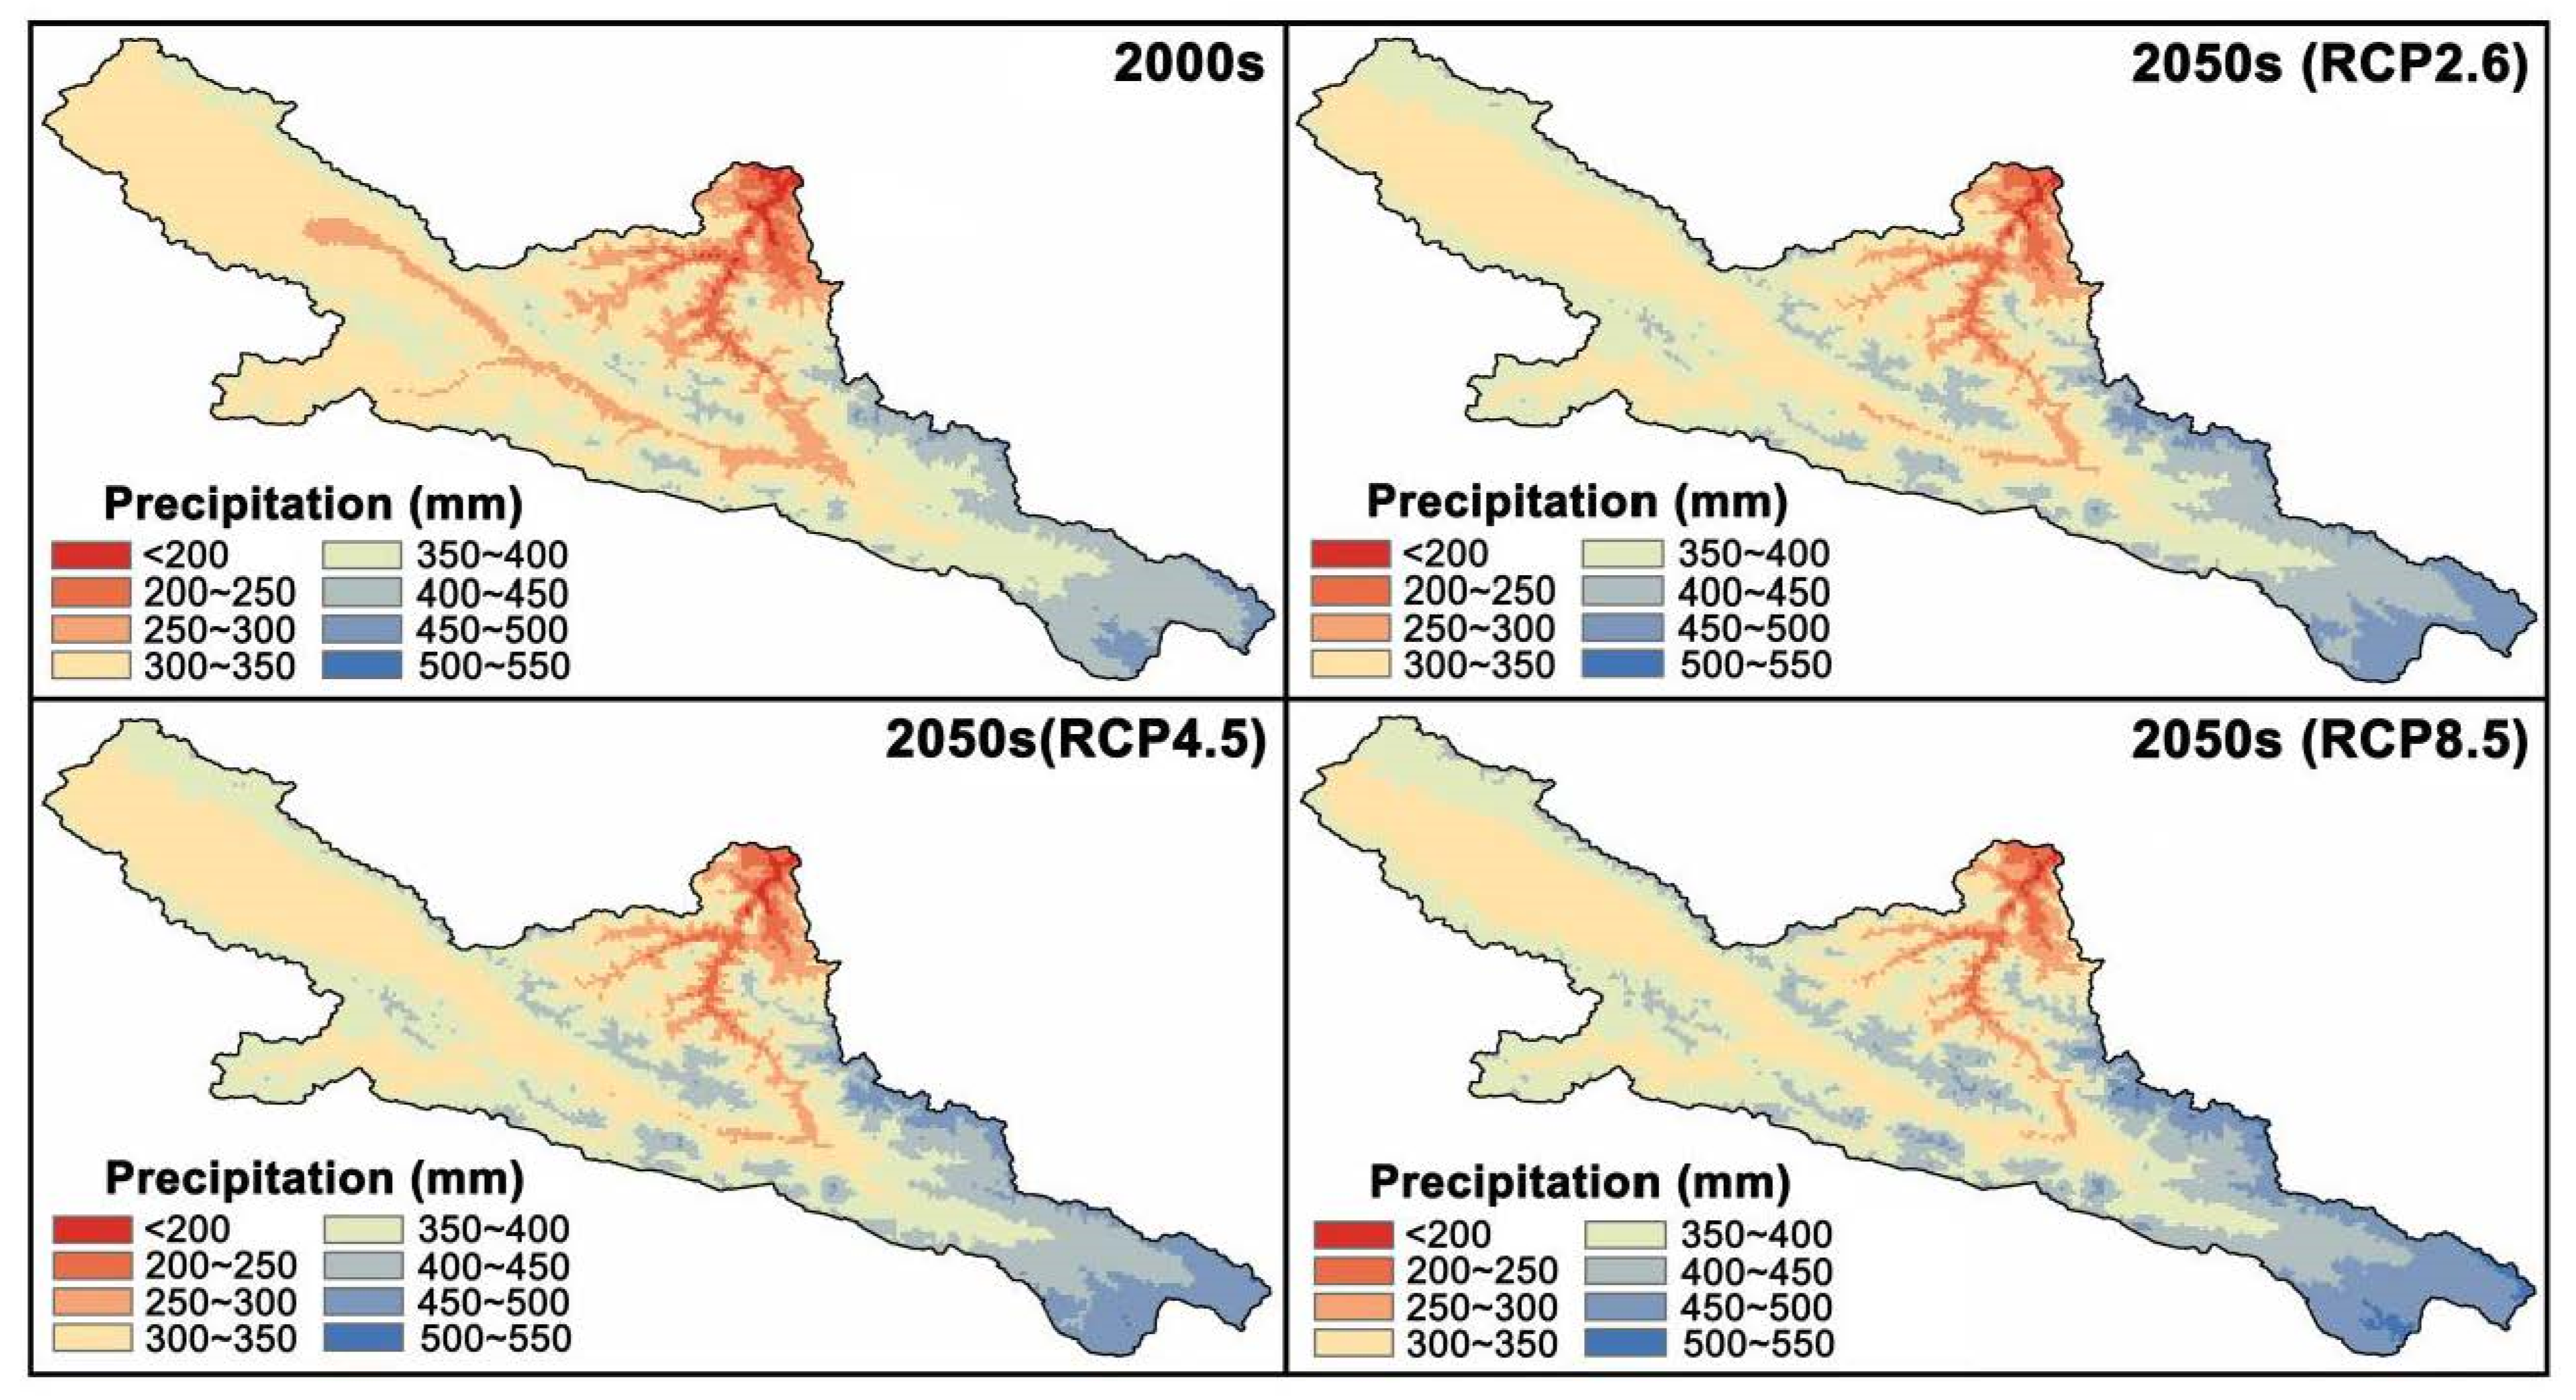
Figure 4.
Variation of mean annual temperature in the 2000s, and temperature change (difference for temperature between the 2050s and the 2000s) under the RCP2.6, RCP4.5, and RCP8.5 scenarios, along the elevation gradient for each 1 km × 1 km pixel. Note: The blue lines indicate the area-weighted averages of temperature or temperature difference between the 2050s and the 2000s for the whole study area. Each vertical gray line represents a 1 km × 1 km pixel over the study area, and the height of the gray line indicates the temperature value at that pixel. Most parts of the study area were located in regions with elevations ranging from 3000 to 3800 m, and thus, gray lines are much denser in mid-elevation zones, while sparser in high- and low-elevation zones.
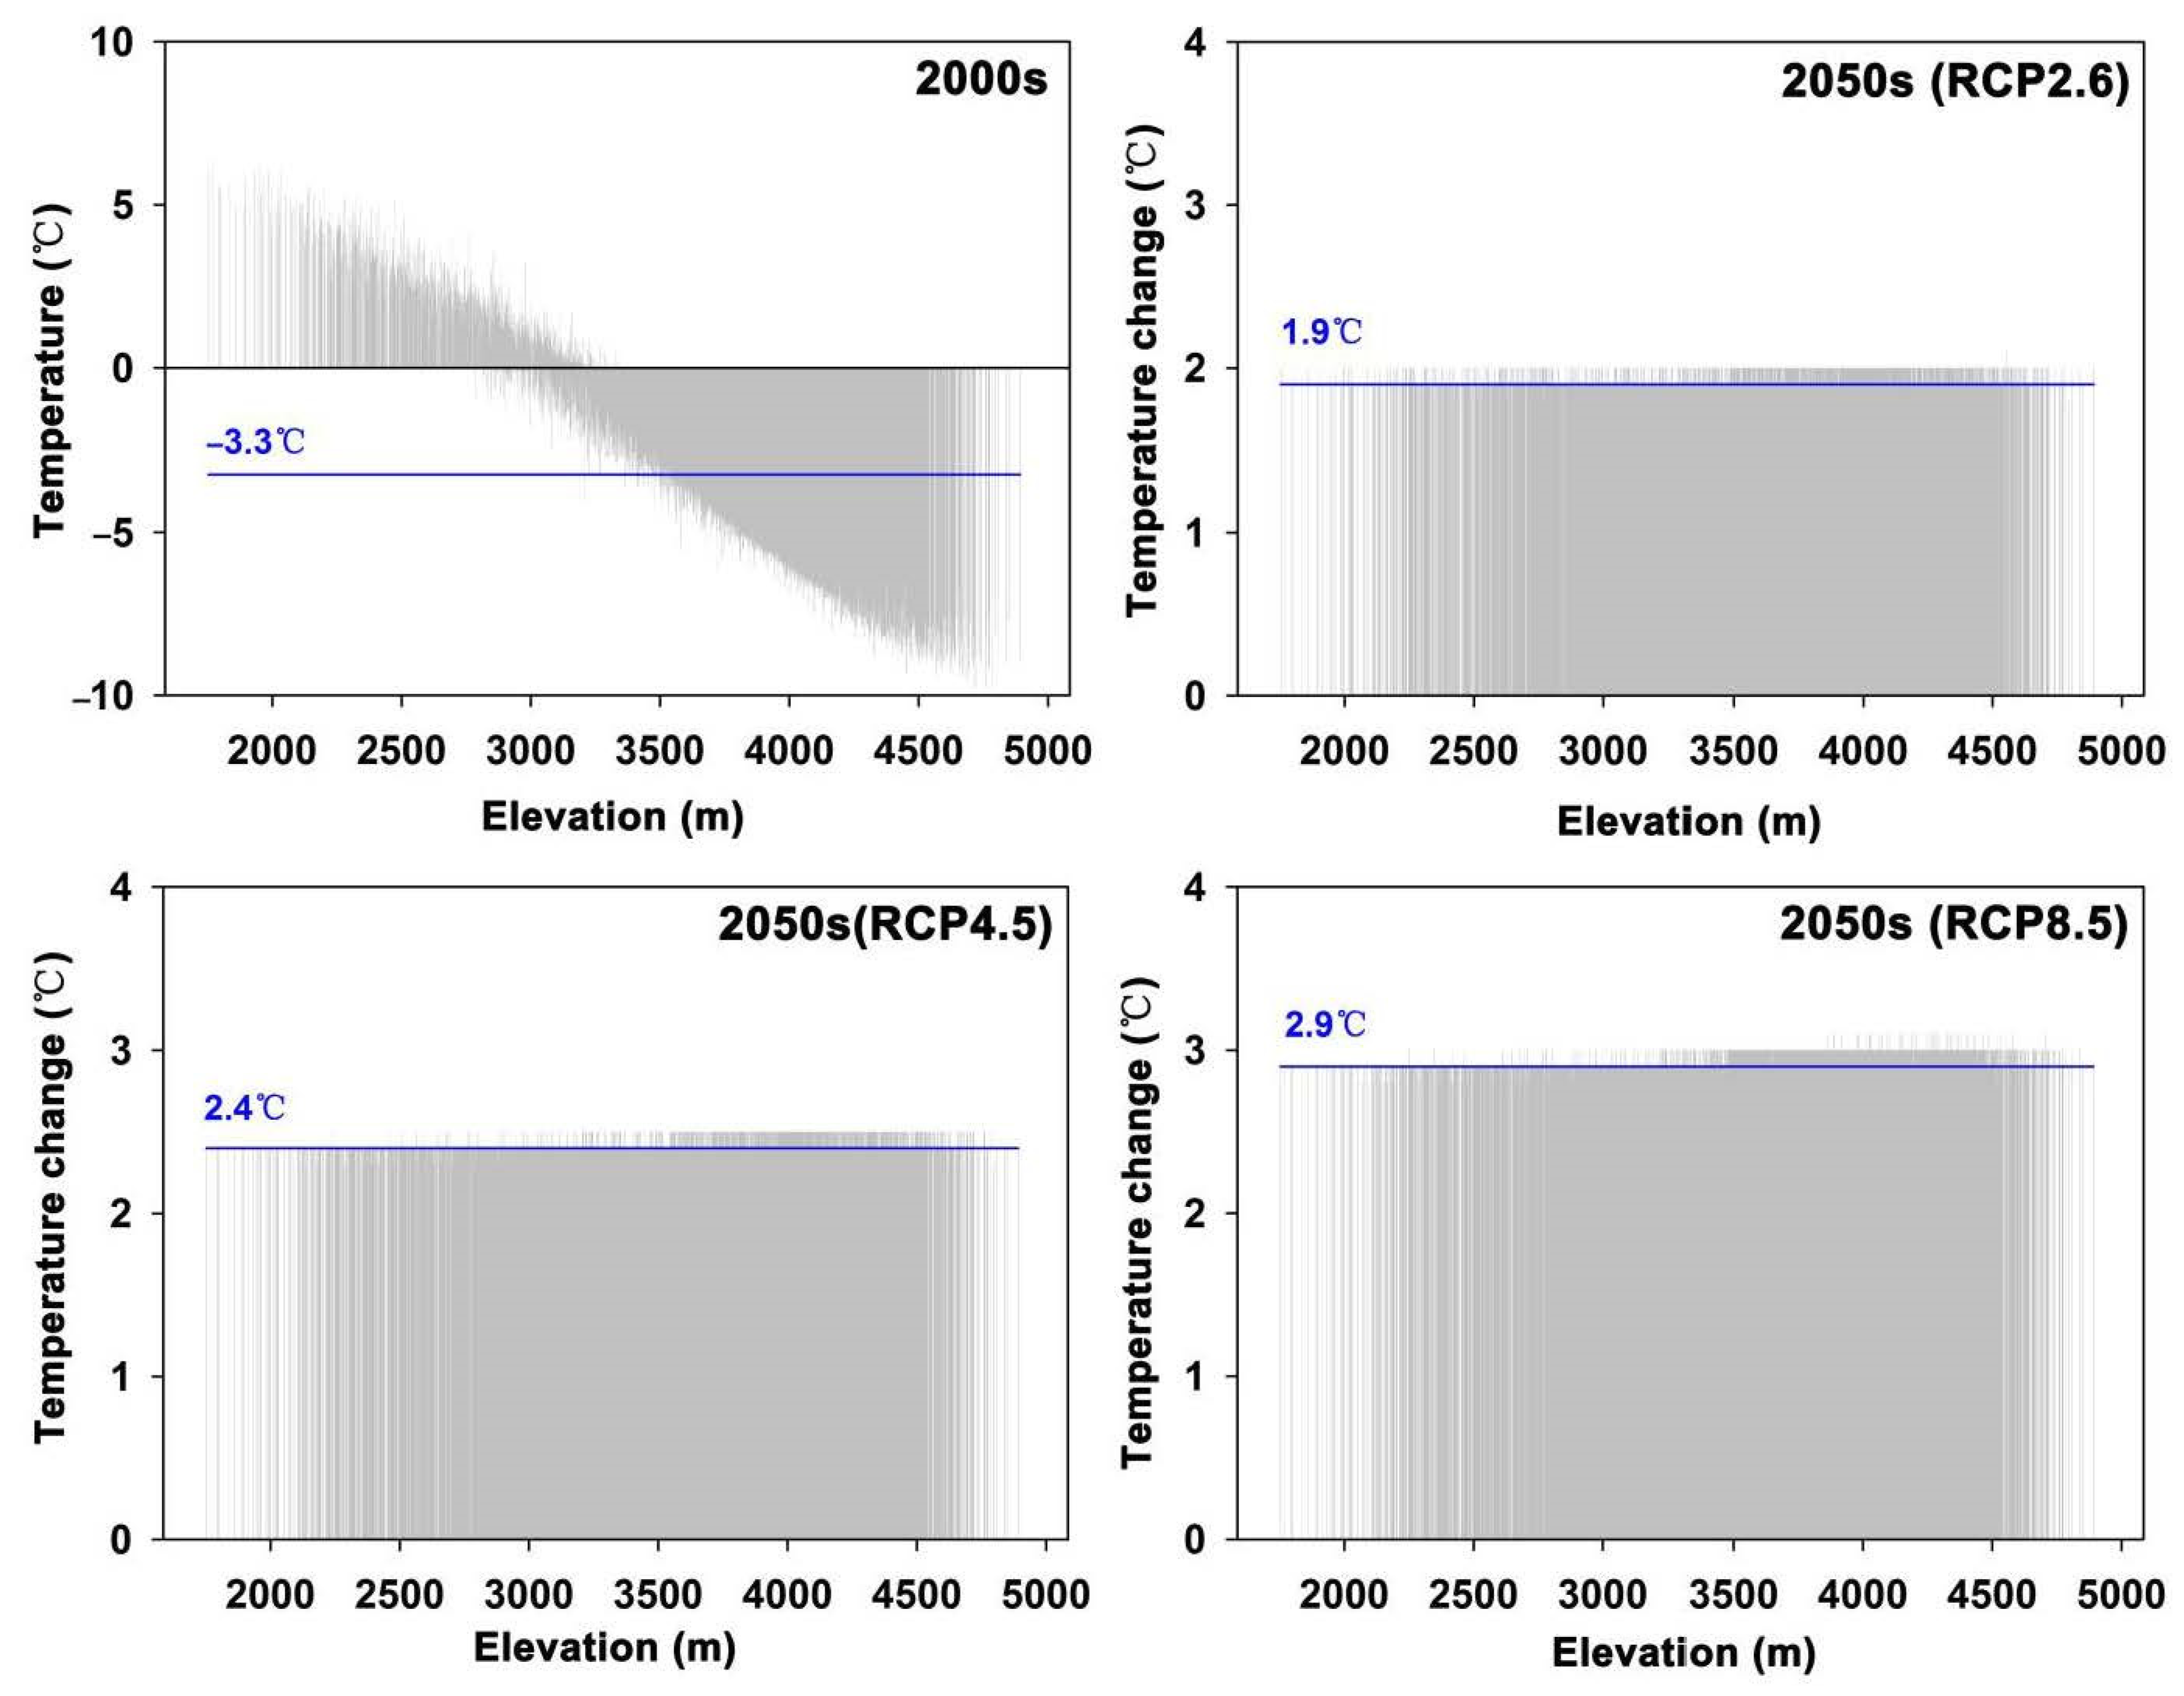
Figure 5.
Variation of mean annual precipitation in the 2000s, and precipitation change (difference between precipitation from the 2000s to the 2050s) under the RCP2.6, RCP4.5, and RCP8.5 scenarios, along the elevation gradient for each 1 km × 1 km pixel. Note: the meanings of the gray and blue lines are similar to those in Figure 4.
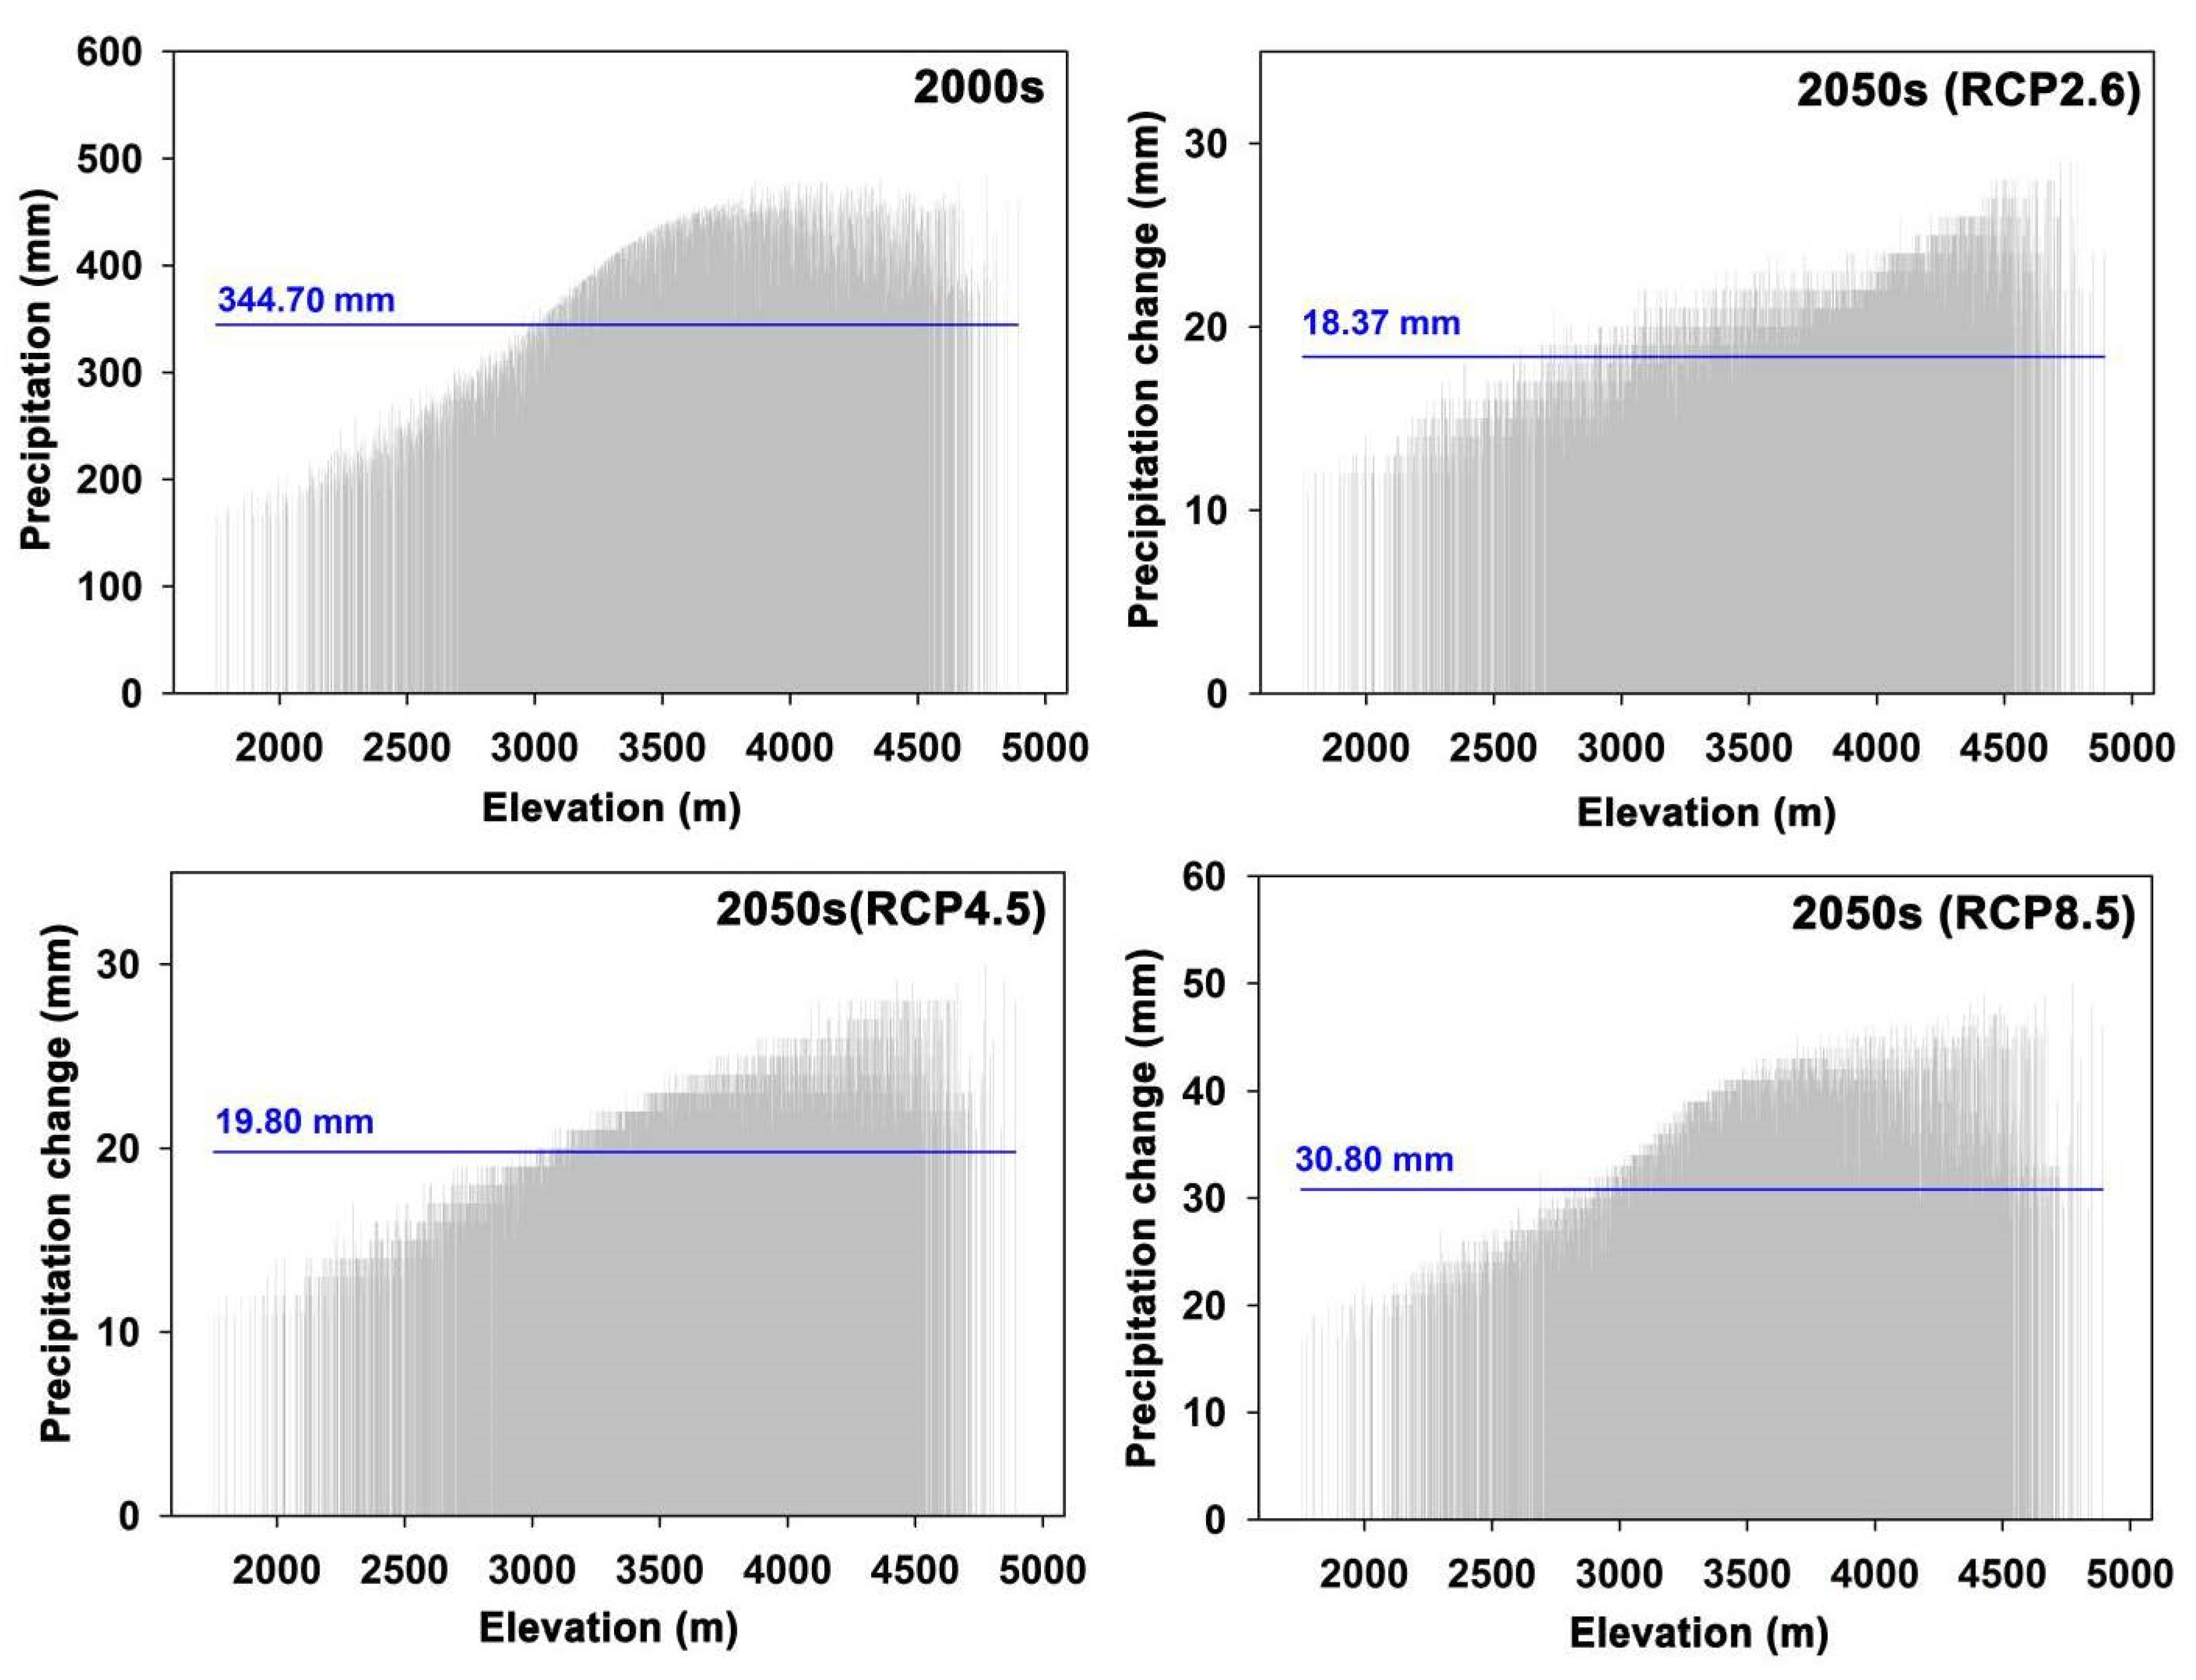
Figure 6.
Distribution of vegetation type for the 2000s and the 2050s under the RCP2.6, RCP4.5 and RCP8.5 scenarios in the study area.
Figure 6.
Distribution of vegetation type for the 2000s and the 2050s under the RCP2.6, RCP4.5 and RCP8.5 scenarios in the study area.

Figure 7.
Distribution of NDVI for the 2000s and 2050s under the RCP2.6, RCP4.5 and RCP8.5 scenarios in the study area.
Figure 7.
Distribution of NDVI for the 2000s and 2050s under the RCP2.6, RCP4.5 and RCP8.5 scenarios in the study area.
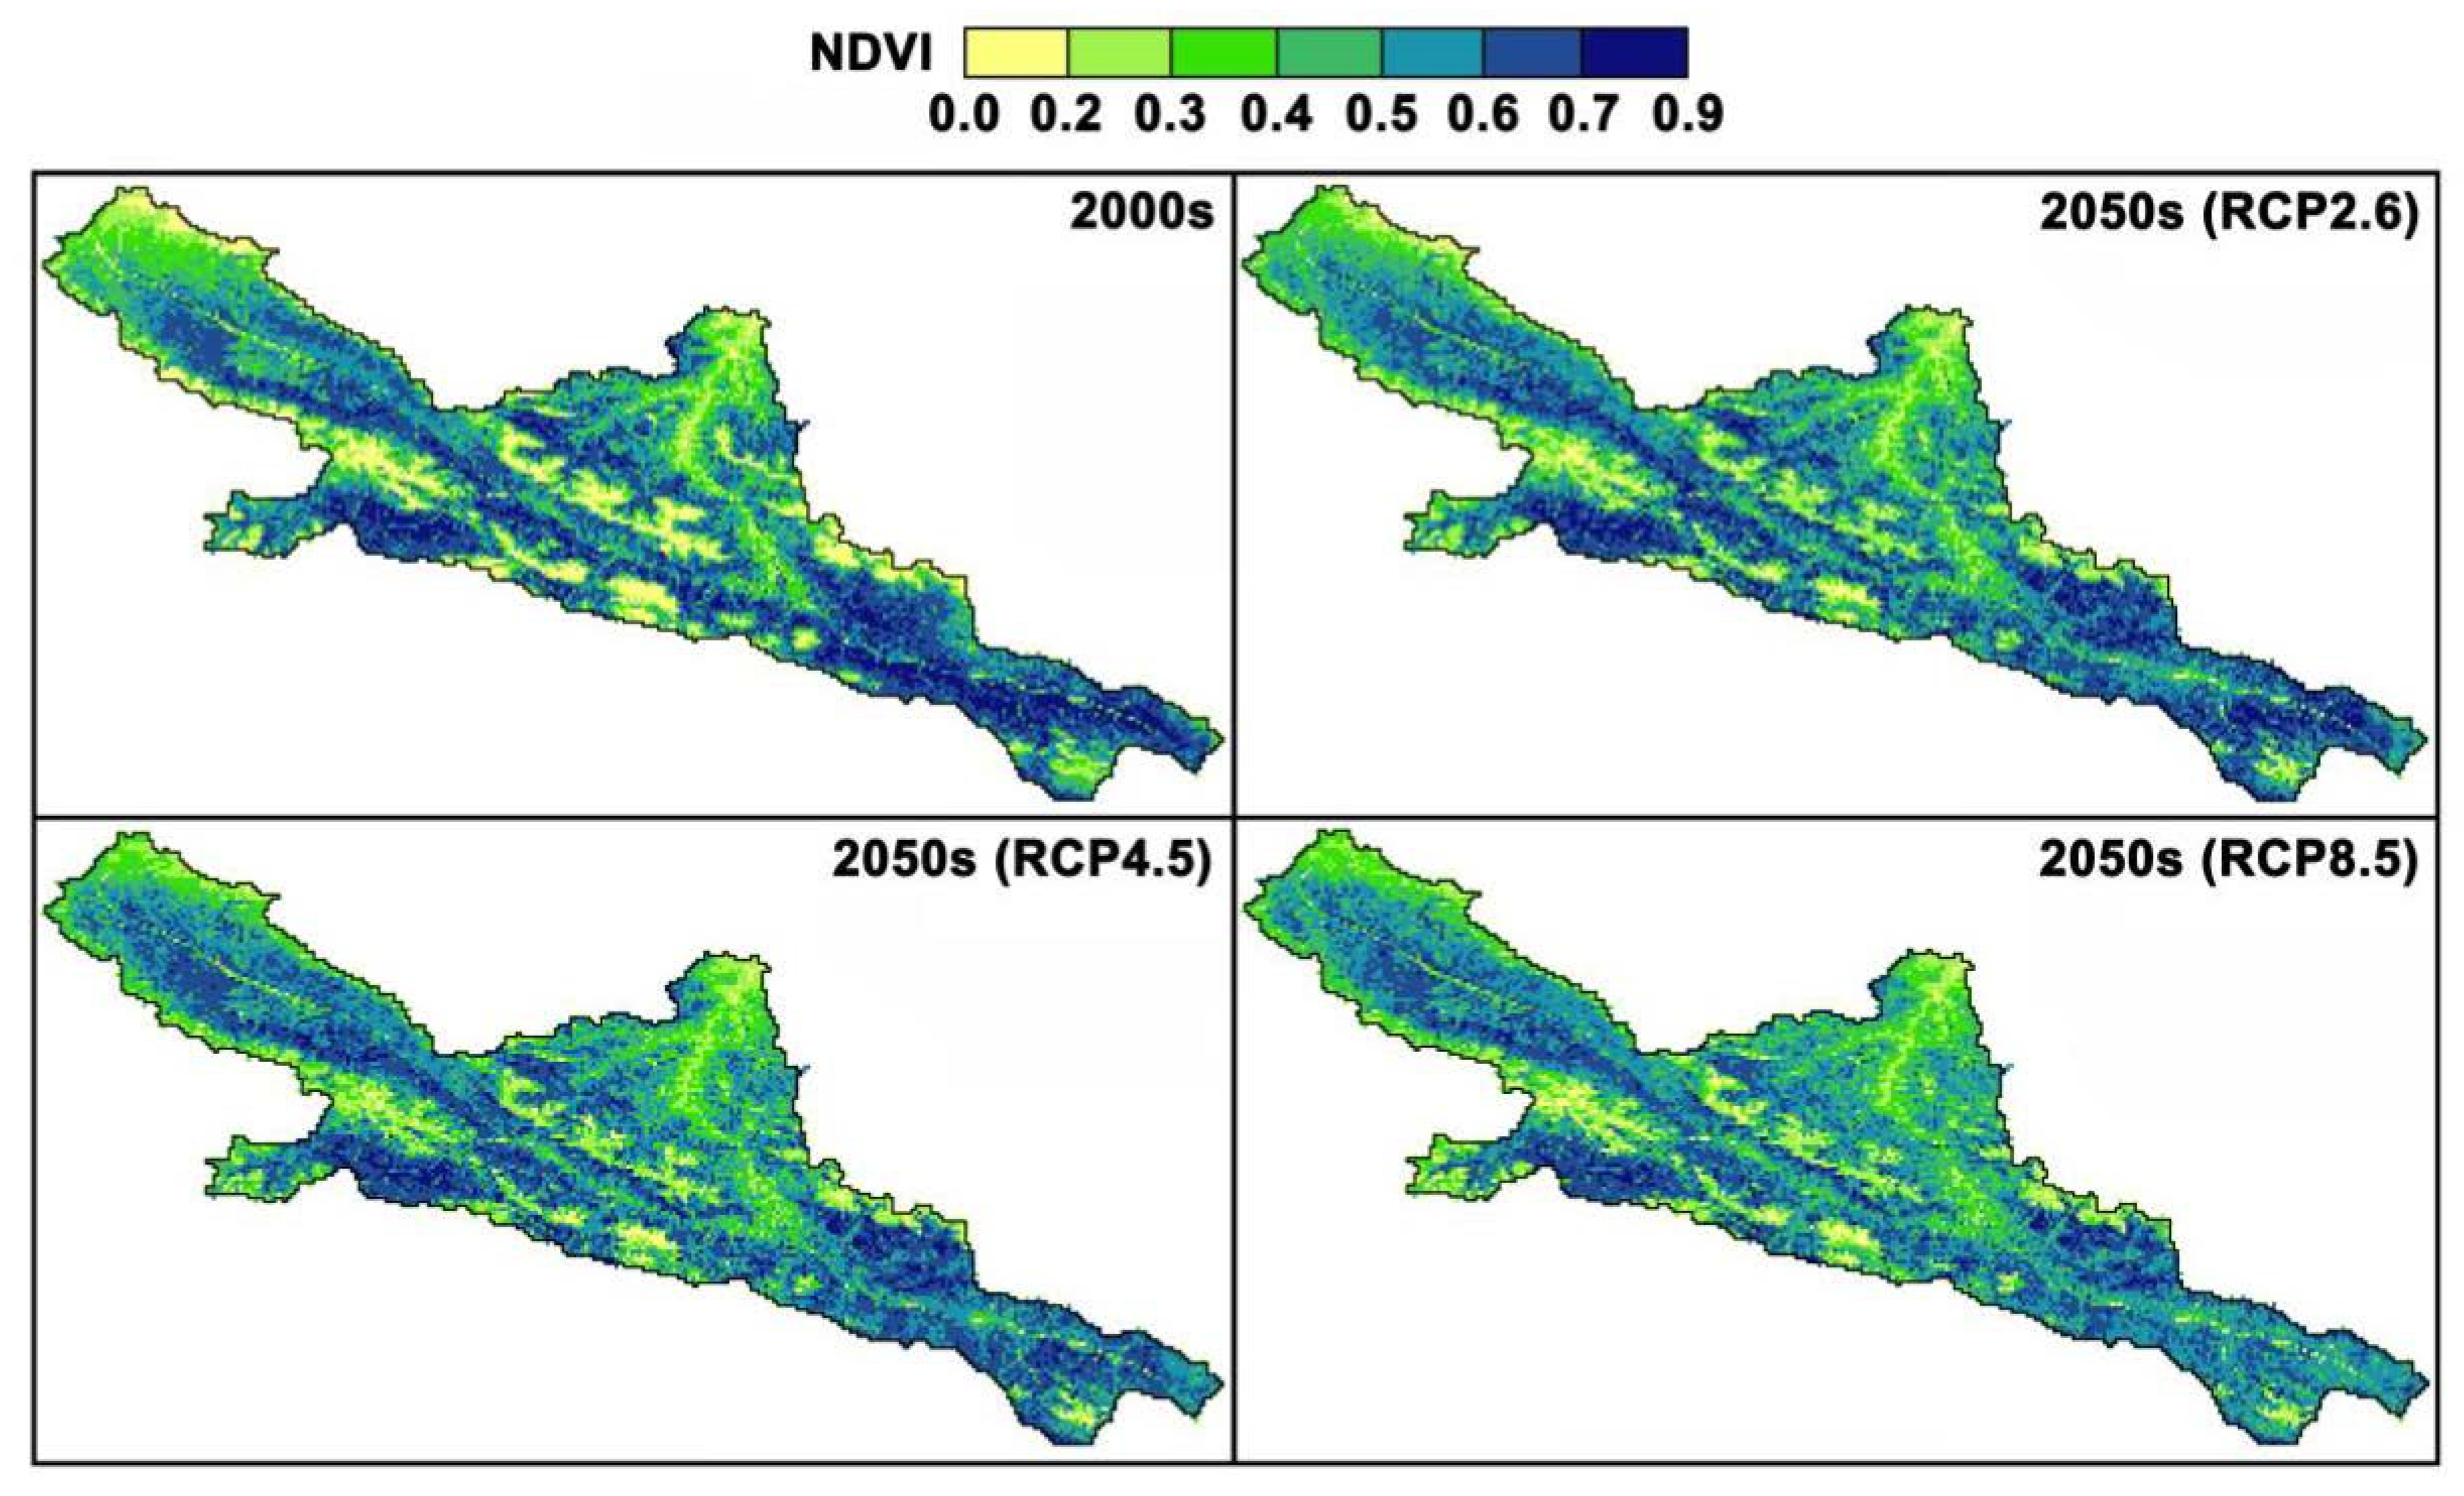
Figure 8.
Comparison between predicted and observed values for the SOC stock at 0–60 cm. Note: the predicted SOC stock in the scatter plots are averages of the predictions from 100 runs of the ten-fold cross-validation procedure.
Figure 8.
Comparison between predicted and observed values for the SOC stock at 0–60 cm. Note: the predicted SOC stock in the scatter plots are averages of the predictions from 100 runs of the ten-fold cross-validation procedure.

Figure 9.
Spatial distribution of SOC stock in the 2000s and the 2050s under the RCP2.6, RCP4.5 and RCP8.5 scenarios, respectively.
Figure 9.
Spatial distribution of SOC stock in the 2000s and the 2050s under the RCP2.6, RCP4.5 and RCP8.5 scenarios, respectively.
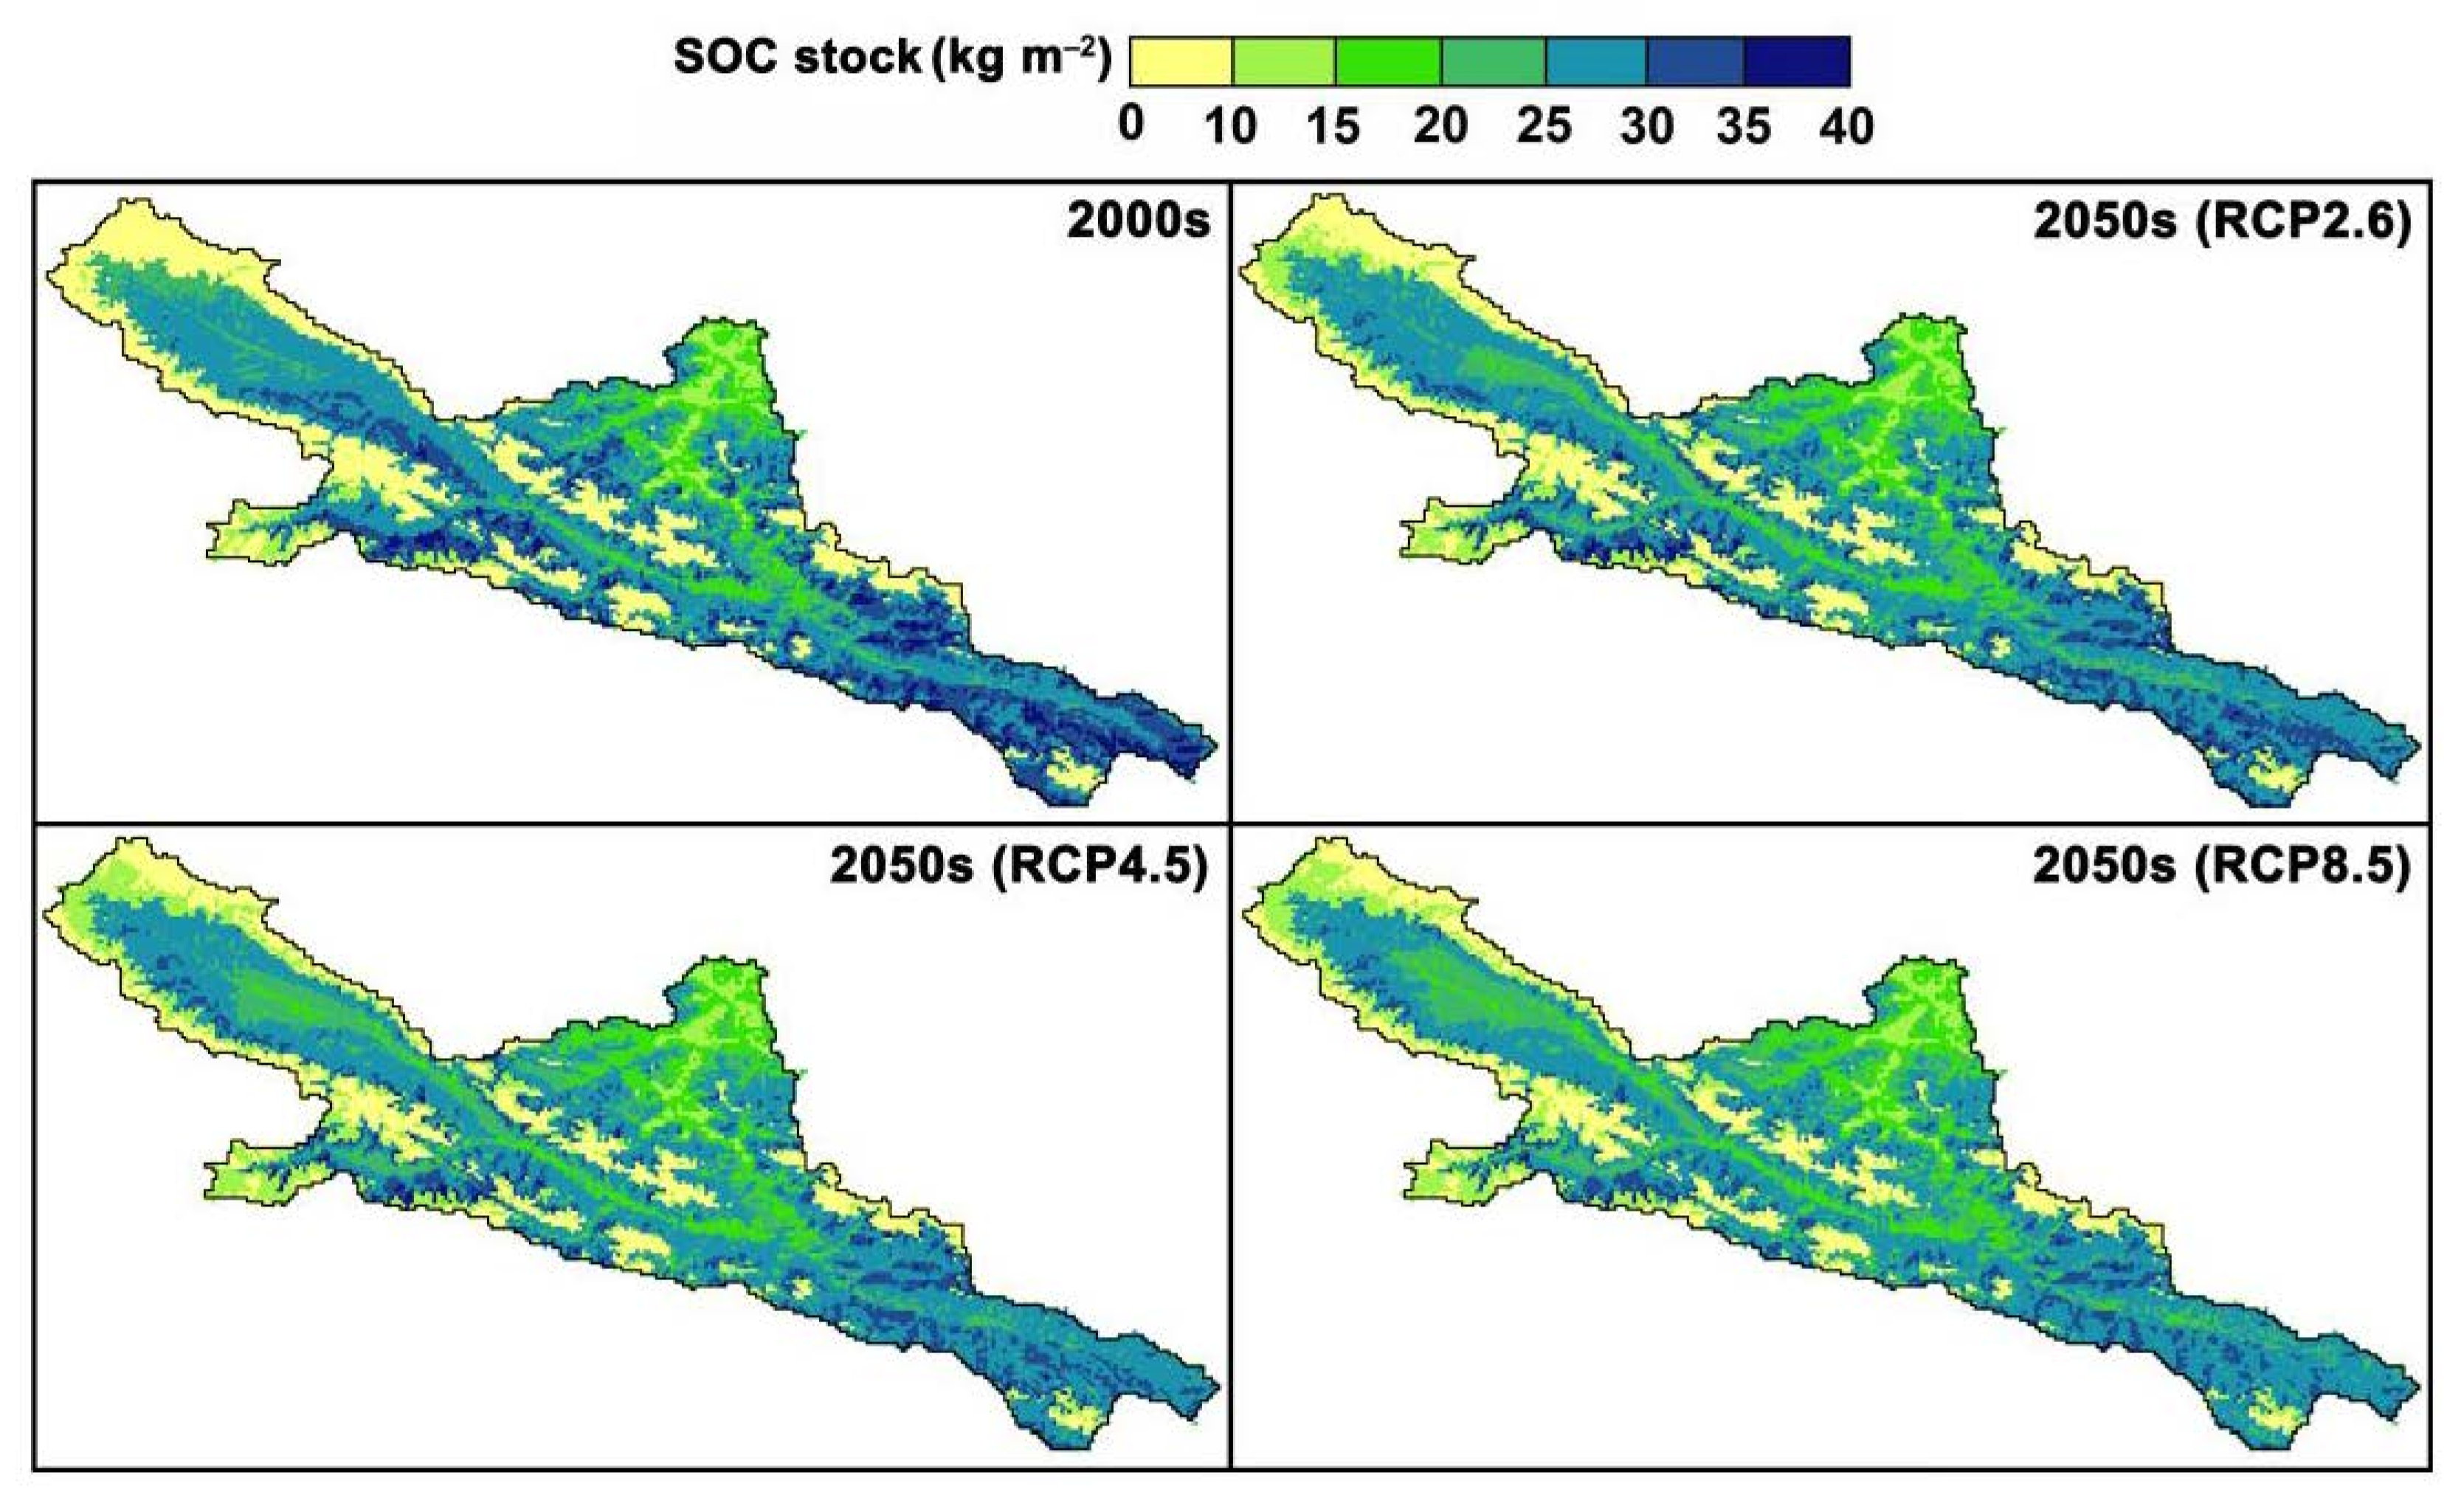
Figure 10.
Spatial distribution of SOC stock changes from the 2000s to the 2050s under the RCP2.6, RCP4.5 and RCP8.5 scenarios.
Figure 10.
Spatial distribution of SOC stock changes from the 2000s to the 2050s under the RCP2.6, RCP4.5 and RCP8.5 scenarios.

Figure 11.
SOC stock changes along the elevation gradient from the 2000s to the 2050s under the RCP2.6, RCP4.5 and RCP8.5 scenarios.
Figure 11.
SOC stock changes along the elevation gradient from the 2000s to the 2050s under the RCP2.6, RCP4.5 and RCP8.5 scenarios.
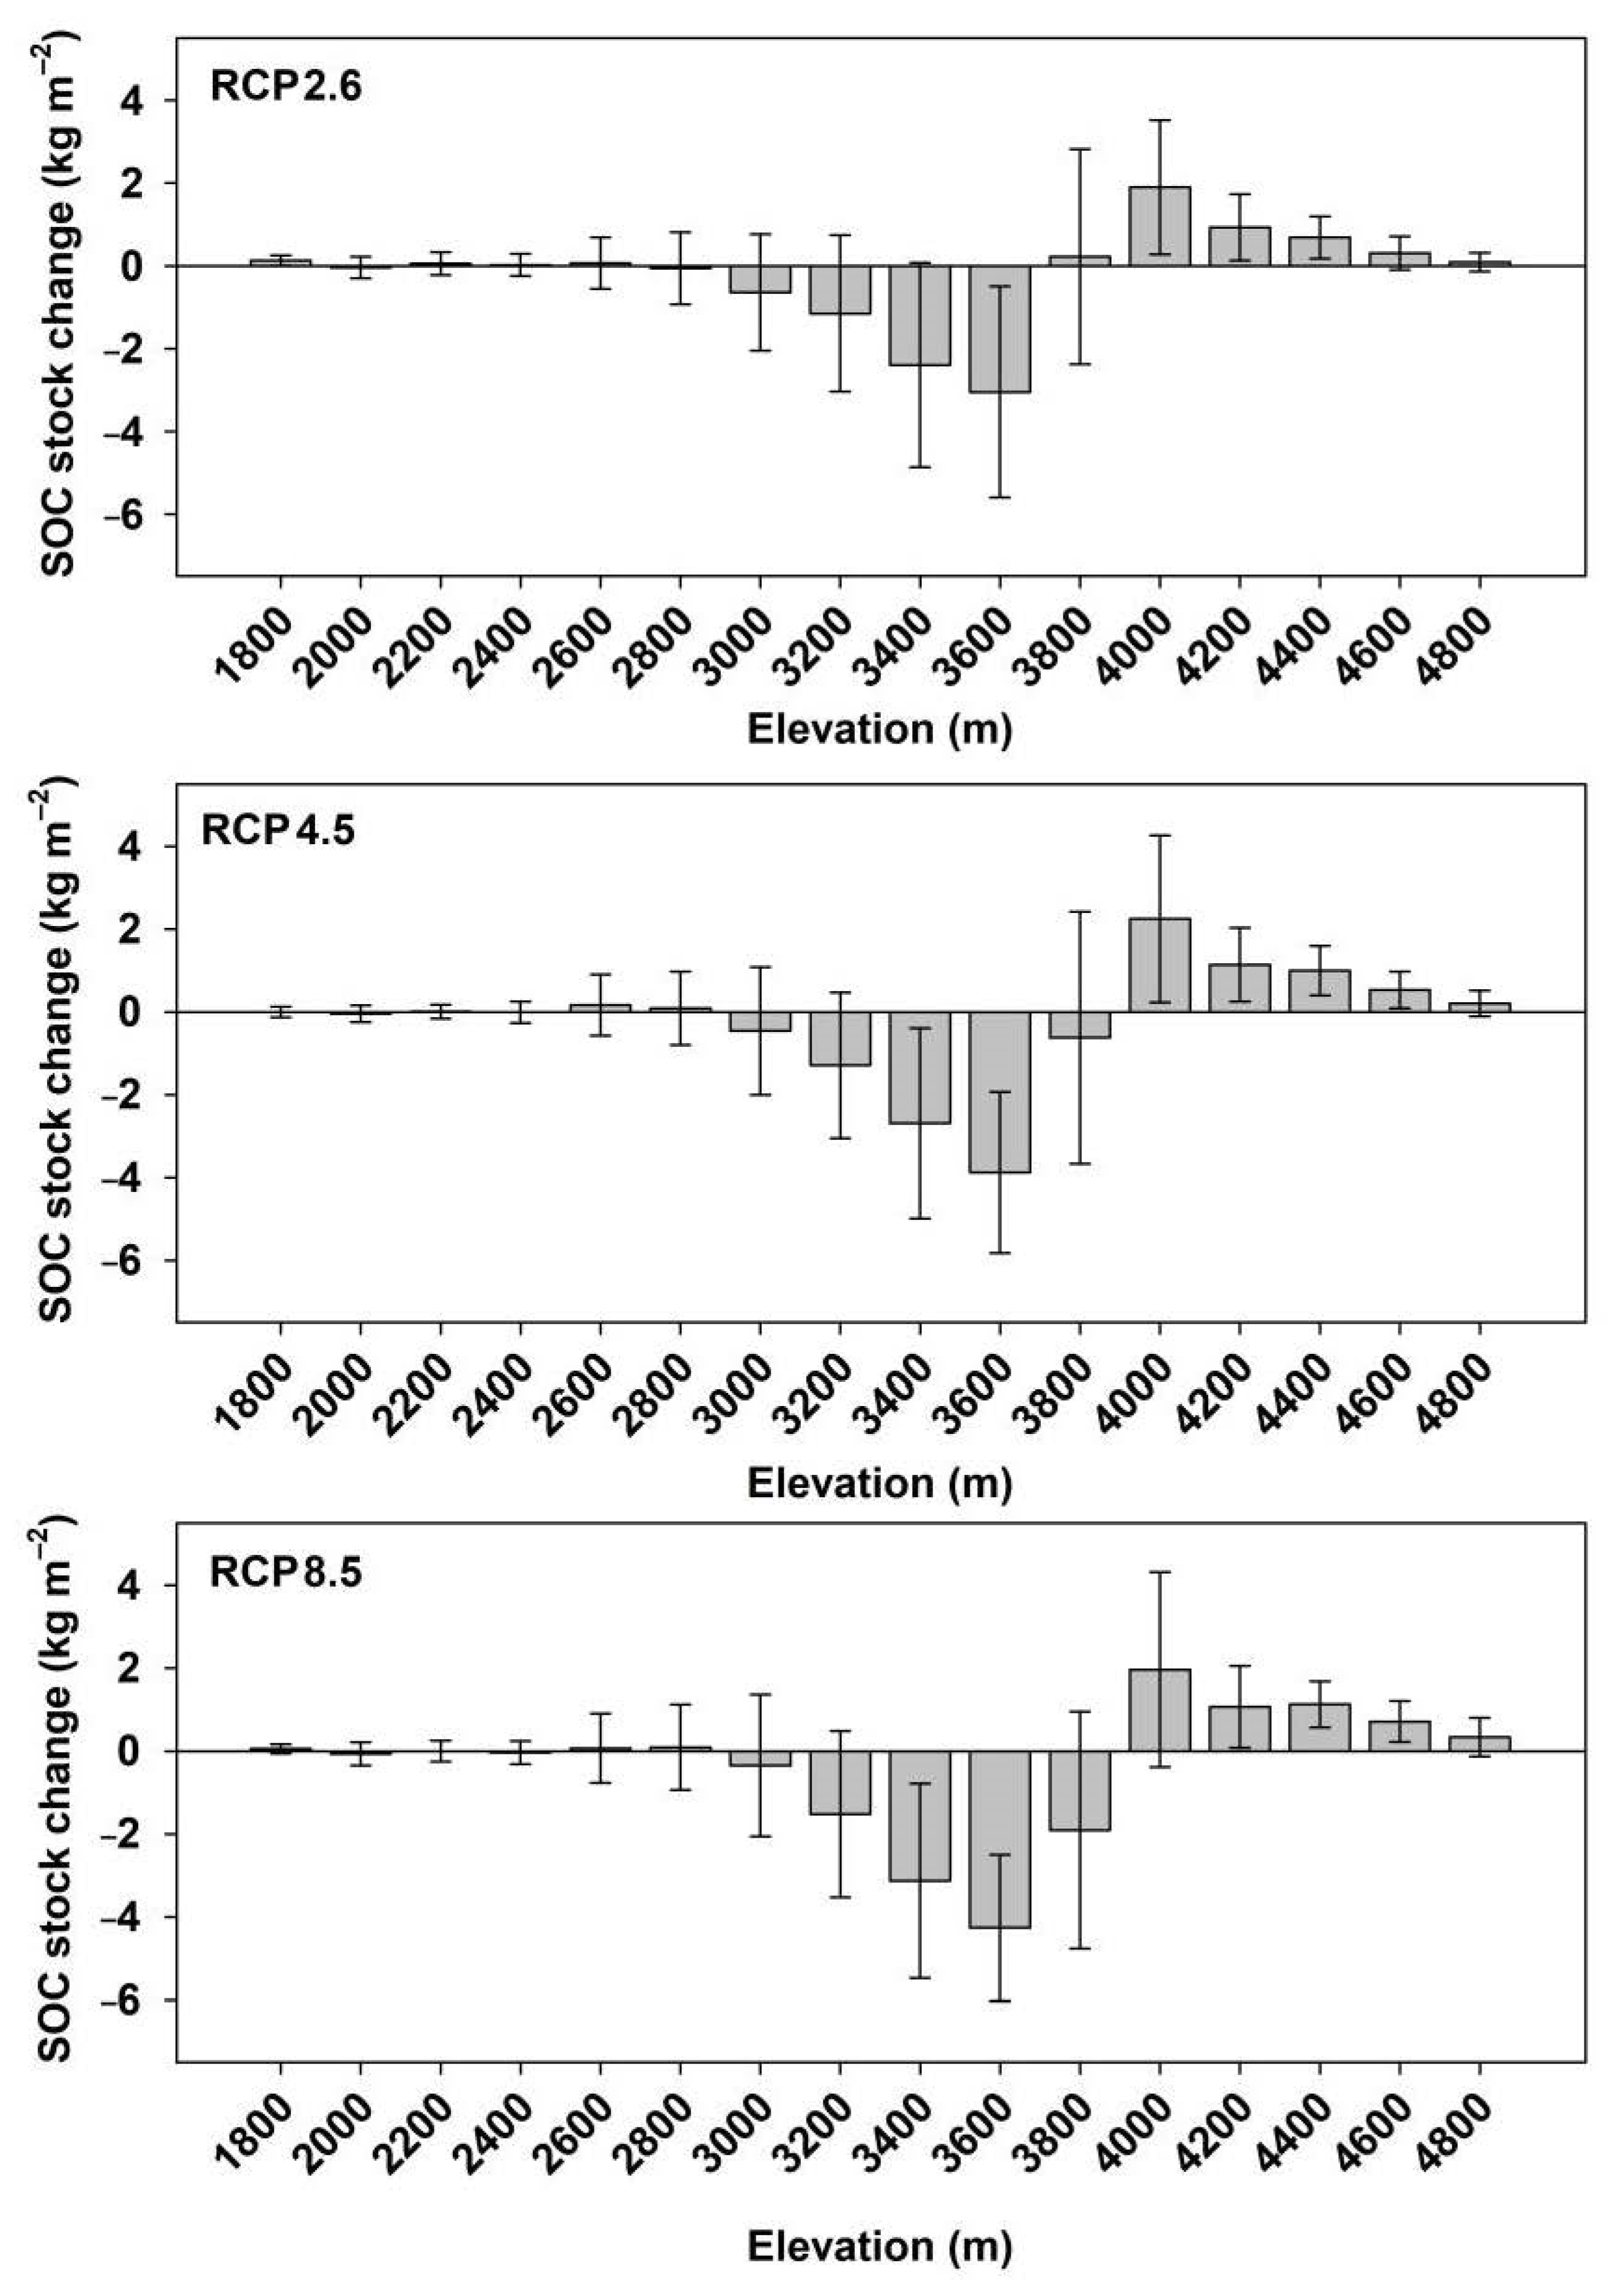
Figure 12.
Effect of different domestic animals on vegetation cover in the subalpine shrub. Note: (a,b) are a full and close shot of the subalpine shrub-meadow zone, respectively. The ridge in (a) is covered by fence with the left side mainly being grazed by yak and the right side by goats. The left side of the fence in (b) was mainly grazed by goats, and the right side was mainly grazed by yaks. The photos were taken at Toutan (3400 m a.s.l.) in the subalpine shrub-meadow zone of the middle Qilian Mountains.

Table 1.
Change in the area of different vegetation types under different climate change scenarios.
| Vegetation Type | Area (km2) | Change in Area (km2) | ||
|---|---|---|---|---|
| 2000s | 2050s (RCP2.6) | 2050s (RCP4.5) | 2050s (RCP8.5) | |
| Montane desert steppe | 101 | −10 | −15 | −24 |
| Montane steppe | 745 | 13 | 12 | 18 |
| Montane meadow steppe | 267 | −29 | −18 | −34 |
| Montane shrub | 447 | 40 | 37 | 56 |
| Montane forest | 776 | 32 | 63 | 100 |
| Subalpine meadow | 1564 | 199 | 216 | 250 |
| Subalpine shrub | 1002 | −63 | −37 | 234 |
| Alpine meadow | 3676 | −124 | −185 | −577 |
| Alpine desert | 1875 | −57 | −72 | −22 |
| No vegetation | 46 | 0 | 0 | 0 |
Table 2.
Evaluation of the performance of random forest model in predicting SOC stock.
| Statistics | Minimum | 1st Quartile | Median | Mean | 3rd Quartile | Maximum | Standard Deviation |
|---|---|---|---|---|---|---|---|
| R2 | 0.73 | 0.77 | 0.78 | 0.78 | 0.80 | 0.82 | 0.02 |
| RMSE | 4.70 | 5.00 | 5.06 | 5.10 | 5.26 | 5.50 | 0.19 |
Table 3.
Summary of SOC stock changes by vegetation types under different climate change scenarios from the 2000s to the 2050s.
Table 3.
Summary of SOC stock changes by vegetation types under different climate change scenarios from the 2000s to the 2050s.
| Vegetation Types | SOC Stock (kg m−2) | SOC Stock Changes (kg m−2) | ||
|---|---|---|---|---|
| 2000s | RCP2.6 | RCP4.5 | RCP8.5 | |
| Montane desert steppe | 14.89 | 0.06 | 0.00 | −0.01 |
| Montane steppe | 19.62 | −0.40 | −0.35 | −0.39 |
| Montane meadow steppe | 25.61 | −0.69 | −0.64 | −0.61 |
| Montane shrub | 24.72 | −0.89 | −0.71 | −0.96 |
| Montane forest | 24.99 | −0.93 | −1.10 | −1.26 |
| Subalpine meadow | 28.21 | −2.85 | −3.24 | −3.64 |
| Subalpine shrub | 31.37 | −2.46 | −3.04 | −3.30 |
| Alpine meadow | 23.91 | 0.87 | 0.57 | 0.08 |
| Alpine desert | 8.45 | 0.73 | 0.96 | 1.00 |
| No vegetation | 16.73 | 0.15 | 0.01 | −0.29 |
| Total | 22.23 | −0.43 | −0.63 | −1.01 |
Table 4.
Summary of SOC stocks and storage changes by vegetation types under different climate change scenarios from the 2000s to the 2050s.
Table 4.
Summary of SOC stocks and storage changes by vegetation types under different climate change scenarios from the 2000s to the 2050s.
| Vegetation Types | Area (km2) | SOC Storage (Tg) | SOC Storage Changes (Tg) | |||||
|---|---|---|---|---|---|---|---|---|
| 2000s | RCP2.6 | RCP4.5 | RCP8.5 | 2000s | RCP2.6 | RCP4.5 | RCP8.5 | |
| Montane desert steppe | 101.14 | 90.65 | 86.16 | 77.17 | 1.51 | 0.01 | 0.00 | 0.00 |
| Montane steppe | 745.45 | 758.19 | 757.44 | 762.68 | 14.63 | −0.30 | −0.26 | −0.30 |
| Montane meadow steppe | 267.46 | 238.24 | 248.73 | 233.00 | 6.85 | −0.17 | −0.16 | −0.14 |
| Montane shrub | 446.52 | 486.98 | 483.98 | 503.46 | 11.04 | −0.43 | −0.35 | −0.48 |
| Montane forest | 776.17 | 807.63 | 839.10 | 875.81 | 19.40 | −0.75 | −0.93 | −1.11 |
| Subalpine meadow | 1563.57 | 1762.86 | 1780.09 | 1813.81 | 44.11 | −5.03 | −5.76 | −6.60 |
| Subalpine shrub | 1001.68 | 939.49 | 964.97 | 1236.18 | 31.42 | −2.31 | −2.93 | −4.08 |
| Alpine meadow | 3676.31 | 3551.94 | 3491.26 | 3099.43 | 87.90 | 3.11 | 2.00 | 0.25 |
| Alpine desert | 1875.24 | 1817.55 | 1802.57 | 1852.76 | 15.84 | 1.32 | 1.72 | 1.86 |
| No vegetation | 46.45 | 46.45 | 45.70 | 45.70 | 0.78 | 0.01 | 0.00 | −0.01 |
| Total | 10,500.00 | 10,500.00 | 10,500.00 | 10,500.00 | 233.46 | −4.55 | −6.66 | −10.62 |
Table 5.
Summary of SOC stocks and storage changes by soil types under different climate change scenarios from the 2000s to the 2050s.
Table 5.
Summary of SOC stocks and storage changes by soil types under different climate change scenarios from the 2000s to the 2050s.
| Vegetation Types | Area (km2) | SOC (2000s) | SOC Changes (RCP2.6) | SOC Changes (RCP4.5) | SOC Changes (RCP8.5) | ||||
|---|---|---|---|---|---|---|---|---|---|
| Stock (kg m−2) | Storage (Tg) | Stock (kg m−2) | Storage (Tg) | Stock (kg m−2) | Storage (Tg) | Stock (kg m−2) | Storage (Tg) | ||
| Glacic Cryosols | 1923.19 | 12.45 | 23.94 | 0.83 | 1.60 | 0.95 | 1.83 | 0.84 | 1.62 |
| Leptosols (Gelic) | 4083.13 | 23.89 | 97.54 | −0.11 | −0.44 | −0.33 | −1.35 | −0.85 | −3.48 |
| Eutric Leptosols | 685.52 | 29.38 | 20.14 | −1.70 | −1.16 | −1.96 | −1.35 | −2.38 | −1.63 |
| Mollic Leptosols | 2827.47 | 25.71 | 72.69 | −1.47 | −4.15 | −1.89 | −5.33 | −2.37 | −6.71 |
| Greyzemic Umbrisols | 433.04 | 24.81 | 10.75 | −0.80 | −0.35 | −0.82 | −0.36 | −0.83 | −0.36 |
| Haplic Chernozems | 53.94 | 20.21 | 1.09 | 0.00 | 0.00 | 0.05 | 0.00 | 0.00 | 0.00 |
| Haplic Kastanozems | 403.82 | 14.89 | 6.01 | −0.15 | −0.06 | −0.27 | −0.11 | −0.16 | −0.07 |
| Haplic Calcisols | 89.90 | 14.57 | 1.31 | 0.06 | 0.01 | 0.00 | 0.00 | 0.00 | 0.00 |
| Total | 10,500.00 | 22.23 | 233.46 | −0.43 | −4.55 | −0.63 | −6.66 | −1.01 | −10.62 |
Publisher’s Note: MDPI stays neutral with regard to jurisdictional claims in published maps and institutional affiliations. |
© 2021 by the authors. Licensee MDPI, Basel, Switzerland. This article is an open access article distributed under the terms and conditions of the Creative Commons Attribution (CC BY) license (https://creativecommons.org/licenses/by/4.0/).
Share and Cite
MDPI and ACS Style
Liu, W.; Zhu, M.; Li, Y.; Zhang, J.; Yang, L.; Zhang, C. Assessing Soil Organic Carbon Stock Dynamics under Future Climate Change Scenarios in the Middle Qilian Mountains. Forests 2021, 12, 1698. https://doi.org/10.3390/f12121698
AMA Style
Liu W, Zhu M, Li Y, Zhang J, Yang L, Zhang C. Assessing Soil Organic Carbon Stock Dynamics under Future Climate Change Scenarios in the Middle Qilian Mountains. Forests. 2021; 12(12):1698. https://doi.org/10.3390/f12121698
Chicago/Turabian StyleLiu, Wei, Meng Zhu, Yongge Li, Jutao Zhang, Linshan Yang, and Chengqi Zhang. 2021. "Assessing Soil Organic Carbon Stock Dynamics under Future Climate Change Scenarios in the Middle Qilian Mountains" Forests 12, no. 12: 1698. https://doi.org/10.3390/f12121698
Note that from the first issue of 2016, this journal uses article numbers instead of page numbers. See further details here.