Abstract
Rapid temperature changes in mountain ecosystems pose a great threat to alpine plant species and communities. Rhododendron species, as the major component of alpine and sub-alpine vegetation, have been demonstrated to be sensitive to climate changes. Therefore, understanding how alpine Rhododendron species spread to new habitats and how their geographical distribution range shifts is crucial for predicting their response to global climate change and for facilitating species conservation and reintroduction. In this study, we applied MaxEnt modeling and integrated climate, topography, and soil variables in three periods under three climate change scenarios to predict the suitable habitat for four Rhododendron species in China. We measured the potential distribution change in each species using the change ratio and the direction of centroid shifts. The predicted results showed that (1) the threatened species R. protistum would have a maximum decrease of 85.84% in its distribution range in the 2070s under RCP 8.5, and R. rex subsp. rex as a threatened species would experience a distribution range expansion (6.62–43.10%) under all of the three climate change scenarios in the 2070s. (2) R. praestans would experience a reduction in its distribution range (7.82–28.34%) under all of the three climate change scenarios in the 2070s. (3) The four Rhododendron species would be moved to high latitudes in the north-westward direction as a whole in the future, especially the two threatened species R. protistum and R. rex subsp. rex. (4) Aside from climate variables, soil factors also exert an important influence on the distribution of Rhododendron species. This study revealed the species-specific response of Rhododendron species to climate change. The results can not only provide novel insights into conservation strategies of Rhododendron species, but also propose a valuable method for the habitat selection during the reintroduction of endangered species.
1. Introduction
Human-induced global changes are the most severe phenomena since the Last Glacial Maximum. Rapid global climate warming has led to distribution pattern changes for numerous species since the original habitats of these species may no longer be appropriate for their growth and survival [1]. Climate change plays a driving role in biodiversity loss, changes in the spatial patterns of species, and threatened species’ survival, and it can increase the risk of extinction for endangered plants. Numerous studies have shown that the habitat range of most species is decreasing [2,3], and the geographic distributions of these species are expected to move towards high altitudes and high elevations to expand to new favorable areas under climate warming [1]. Moreover, growing evidence shows that the speed of warming is amplified by elevation under the background of global warming, which means that temperatures change more rapidly at high elevations than at low elevations [4]. This rapid change in temperature poses a great threat to alpine plant species and communities [5,6]. Therefore, understanding how alpine species spread to new habitats and how the geographical distribution range changes is crucial for predicting their response to global climate change and facilitating species conservation and reintroduction [7].
Rhododendron L., which comprises about 1025 species, is one of the largest woody plant genera. This genus is widely distributed from the northern temperate region throughout southeast Asia to northeastern Australia [8,9]. About 571 Rhododendron species exist in China, and 70% of them are endemic in the southwestern region of China. Therefore, the mountain land of Southwest China is considered the center of origin or evolution of modern Rhododendron [8]. However, with the ever-increasing impact of human activities and global climate change, the survival of Rhododendron resources in China is facing a serious threat [10]. In addition, as the major component of alpine and sub-alpine vegetation, the Rhododendron species have been demonstrated to be sensitive to climate change [11,12,13]. Yu et al. (2019) [12] applied the presence-only ecological niche model MaxEnt and predicted the distribution of 10 narrow-ranging and 10 wide-ranging Rhododendron species. The authors discovered the negative effect of climatic and land use changes on the distribution of species. Lu et al. (2021) [13] assessed the effect of protected areas and tourist attractions on the current and future suitable habitat distributions of seven species of the genus Rhododendron in Northeast China and provided conservation suggestions.
Species distribution models (SDMs), as an effective tool in predicting species’ suitable habitats under climate change, play important roles in studying the processes of species’ ecological evolution and in conservation planning [13,14]. On the basis of species occurrence data and environmental variables, SDMs can predict the potential distribution of species at different spatial and temporal scales, especially under scenarios of global climate change [15]. At present, SDMs based on different theoretical and analysis methods, such as surface range envelope (BIOCLIM), artificial neural network (ANN), maximum entropy (Maxent), random forest (RF), generalized linear model (GLM), and generalized additive model (GAM), are widely used in ecology and biogeography. The Maxent model is widely recognized as one of the most effective tools for predicting species’ suitable habitats and changes in future distributions due to its advantages. In particular, it requires only species presence data, can deal effectively with limited occurrence data and small sample sizes, and can use continuous and categorical environmental data as input variables. Numerous studies have predicted changes in animal and plant distributions in response to contemporary climate changes using the Maxent model [7,16,17,18,19,20,21].
Reintroduction is one of the rescue methods of plant conservation, especially for endangered species threatened by habitat destruction and loss under global changes. Predicting habitat suitability and the potential habitat distribution range is critical to the reintroduction of endangered plants [22,23]. Here, we integrate climate and soil variables to predict the suitable habitat for four Rhododendron species in China. We hypothesize that the suitable range for the four Rhododendron species would contract and shift to high altitudes in the future since the original distribution areas may become climatically unsuitable under climate change omission scenarios. Furthermore, we predict that inter-specific variance would occur in the future. The results of this study can provide novel insights into the creation of conservation strategies and habitat selection during the reintroduction of Rhododendron species.
2. Materials and Methods
2.1. Species Occurrence Data
Four alpine Rhododendron species that belong to Rhododendron Sect. Ponticum G. Don., namely, Rhododendron protistum Balf.f. & Forrest (including its variant), Rhododendron rex H.Lév. subsp. rex, Rhododendron praestans Balf.f. & W.W.Sm. and Rhododendron sinogrande Balf.f. & W.W.Sm., were selected in the present study. Rhododendron rex subsp. rex is an endangered plant endemic to China [8]. Rhododendron protistum is listed as a critically endangered species in the China Plant Red Data Book [24]. Four Rhododendron species are evergreen trees that are distributed in forest ecosystems in the southwest plateau mountains in China.
Occurrence data were obtained from published studies, the China Digital Herbarium (http://www.cvh.ac.cn/, accessed on 1 October 2021), and GBIF (https://www.gbif.org/, accessed on 1 October 2021). In accordance with the biological and ecological characteristics of these species, we removed unreasonable sites to ensure geographic accuracy. Each sample point was at least 2 km apart to reduce the effect of spatial autocorrelation. Then, we obtained 24, 22, 15, and 39 effective localities of Rhododendron protistum, Rhododendron rex subsp. rex, Rhododendron praestans, and Rhododendron sinogrande in Southwest China for the subsequent model construction and analysis (Figure 1).
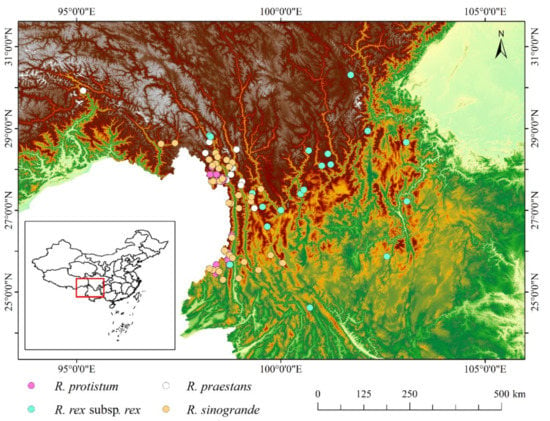
Figure 1.
Occurrence points of four Rhododendron species.
2.2. Environment Data
Climate variables are the major predictors in the MaxEnt model since they are the primary factors regulating species’ geographic distributions. However, recent studies have found that other factors, including soil types and characteristics, land use changes, and vegetation types, have a significant influence on distribution predictions. These factors are often correlated with climate change [15,16]. Therefore, combining climate and other factors that affect species’ biological characteristics in MaxEnt model building can reveal a suitable habitat under the scenarios of global climate change. This suitable habitat can be used for species reintroduction and rehabilitation.
The environment data included 19 climate variables, 3 topography variables, and 16 soil variables. Climate data (Bio1–Bio19) on current climate conditions (1960–1990), the 2050s (average for 2041–2060), and the 2070s (average for 2061–2080) were downloaded from the Worldclim Database (https://www.worldclim.org/, accessed on 1 October 2021) at a resolution of 30 arc-seconds (~1 km2). For future climatic projection, we used the Beijing Climate Center Climate System Model (BCC-CSM1-1), which is a widely utilized global climate model (GCM) in China provided by IPCC5 [25]. The representative concentration pathways (RCPs) form a set of greenhouse gas concentration and emission pathways which are widely used to research the impacts and potential policy of the responses to climate change. For this GCM, we selected three RCPs of emission scenarios from low to high, namely, RCP 2.6, RCP 4.5, and RCP 8.5. Furthermore, we used topsoil variables at depth intervals of 0–30 cm in Maxent model building for precise suitable habitat prediction. The topsoil variable data were derived from the Harmonized World Soil Database (http://www.iiasa.ac.at/web/home/research/researchPrograms/water/HWSD.html, accessed on 1 October 2021) at the same resolution (1 km2). Digital elevation model (DEM) data were obtained from the SRTM Database (http://srtm.csi.cgiar.org/, accessed on 1 October 2021) with a 90 m resolution. Meanwhile, the slope and aspect were extracted from DEM data in ArcGIS 10.2 and resampled into a 1 km spatial resolution.
2.3. Study Area and Environment Variables Selection
To approach a more realistic prediction, we delimited the study area of each Rhododendron species by drawing a minimum convex polygon (MCP) with a buffer distance of 1 degree (~111 km) around the localities and obtained the environment factors within this region by the Wallace package in R. All of the analyses include variables and the selections were accomplished within the buffer areas. In addition, we explored the potential distribution of four Rhododendron species in Southwest China.
The collinearity among environmental factors causes overfitting and uncertainty in the predicted results [26]. To establish a good performance model with few variables for four Rhododendron species, first, we used 38 variables to prebuild the MaxEnt model three times in succession and eliminated the environment factors with no contribution or importance to the models. Moreover, we eliminated four variables that combined temperature and precipitation since they have artificial discontinuities [27,28]. Therefore, we performed a correlation analysis by the Band Collection Statistics tool of ArcGIS for the remaining environment variables, except for the categorical factor. In addition, we retained one factor which has a high contribution from each set of highly cross-correlated variables (R2 > 0.8) for further modeling (Table 1Table 2 and Table A1, Table A2, Table A3 and Table A4).

Table 1.
Environmental predictors used for modeling the habitat suitability distribution of four Rhododendron species.

Table 2.
List of environmental predictors used for modeling the habitat suitability distribution of four Rhododendron species.
2.4. Model Evaluation and Model Selection
When selecting the model parameters, we used models with regularization multiplier (RM) values ranging from 0.5 to 4.5 (increments of 0.5) and with six feature class (FC) combinations (L, LQ, H, LQH, and LQHP, with L = linear, Q = quadratic, H = hinge, and p = product). In accordance with the lowest delta, the AICc score and the predictor variables (RM and FC) were used in the final model. All of the analyses were performed using the Wallace package in R [29,30,31].
We inputted the species and environment data into MaxEnt 3.4.1 [32]. The feature combination and regularization multiplier were set based on Table 3. For each run, we set the output format as “Cloglog” and the output file type as “asc.” The model was estimated using 75% of the occurrence data for model calibration, and 25% was used for model testing. The replicate was set as “10” with a replicated run type as “Crossvalidate” to reduce uncertainty. The remaining parameters adopted default settings. The average of 10 predictions was taken as the result. The area under the ROC curve (AUC) and the true skill statistic (TSS) are the two metrics that we used to measure model performance. The range of the AUC is from 0.5 to 1 and TSS ranges between −1 and +1. The closer the assessment value is to 1, the better the model performance [33,34].

Table 3.
The models calculate the results of Wallace package, as well as the values of AUC and TSS for four Rhododendron species. FC: Feature classes (H = Hinge, L = Linear, Q = Quadratic, p = Hinge); RM: Regularization multiplier; avg.test.AUC: The average result of n iterations of predicted values for the test localities; avg.test.or10 pct: The proportion of test localities with suitability values that is lower than what is excluded in the 10% of training localities with the lowest predicted suitability; delta. AICc: Akaike Information Criterion corrected.
2.5. Geospatial Analyses
To estimate the similarity of environment conditions between the buffered background area and projection area and to know where the climates are novel, we calculated the multivariate environmental similarity surfaces (MESS) following the guideline from Elith et al. [35]. The novelty of environment (i.e., extrapolation, negative values in MESS result) indicated where the prediction areas are questionable and extrapolated in ecologically unrealistic ways [35,36,37]. Therefore, we masked out these extrapolation areas (negative values in the MESS map output). As a result, a predictive map with four classes of habitat suitability for the four Rhododendron species was defined using the reclass tool in ArcGIS 10.2. The four classes were unsuitable (<0.10), low suitability (0.10–0.33), moderate suitability (0.33–0.67), and high suitability (>0.67). To measure the predicted distribution changes and centroid shifts for each species, we projected the binary species distribution models (SDMs) onto WGS_1984_UTM_Zone_47N projection in ArcGIS 10.2. Then, we calculated the change ratio between the current and future distribution and centroid change direction vectors of the current and future binary SDMs using the SDM Toolbox [38].
3. Results
3.1. Model Selection and Evaluation
In accordance with the lowest delta.AICc, we obtained optimal parameters for each Rhododendron species (Table 3). On the basis of these parameters, current suitable habitat distributions of R. protistum, R. rex subsp. rex, R. praestans, and R. sinogrande in the current period were constructed. The AUC values for the models of the four Rhododendron species were between 0.920 and 0.988, and the TSS ranged from 0.66 to 0.94 (Table 3).
3.2. Current Habitat Distribution and Dominant Environment Variables
After masking out the outlier areas which have negative values in MESS (Figure A1, Table A5), about 10% to 20% of projection grid cells were predicted as a suitable potential area under current climatic conditions. The current potential distribution prediction of the four Rhododendron species (Figure 2) indicated that R. protistum is mainly distributed in the Gaoligong Mountain of northwestern Yunnan Province in China. In addition, Tibet bordering northern Myanmar has a small suitable area. R. rex subsp. rex has a wide, highly suitable distribution range and is mainly distributed in northeastern Yunnan Province and southwestern Sichuan Province. R. praestans has a major current habitat suitability in northwestern Yunnan Province and southeastern Tibet. Moreover, the Hengduan Mountainous Region is a potential current habitat. The current habitat distribution range of R. sinogrande is similar to R. protistum. In other words, it is mainly distributed in western Yunnan Province and southeastern Tibet (Figure 2). The current distribution areas of R. protistum, R. rex subsp. rex, R. praestans, and R. sinogrande are 10,440.58, 178,394.88, 132,745.11, and 38,819.5 km2, respectively.
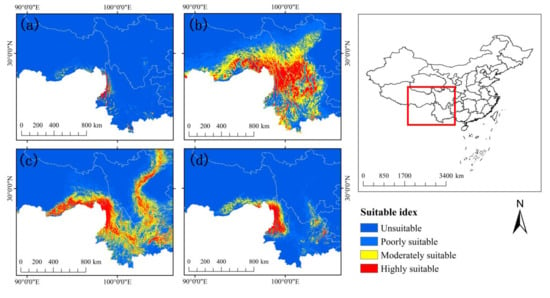
Figure 2.
The potential current distribution of four Rhododendron species: (a) R. protistum, (b) R. rex subsp. rex, (c) R. praestans, (d) R. sinogrande.
The jackknife test on the variables’ contributions to Maxent revealed the influence of the environmental factors on the spatial distribution of the species. High values of the regularized training gain indicate a highly significant contribution of variables [21]. The results of the jackknife test on the regularized training gain for the four Rhododendron species are shown in Figure A2. For R. protistum, Bio13 provided very high gains (>1.0) when utilized independently, indicating that the precipitation of the wettest month is the dominant factor in habitat conditions. Bio15, Bio17, Bio3, Bio4, T_CLAY, T_GRAVEL, and T_OC provided a moderate gain when used independently, suggesting that they can affect the habitat suitability distribution of R. protistum. For R. rex subsp. rex, only Bio4 and soil type (T_USDA_TEX_CLASS) provided a moderate gain when used independently. Meanwhile, Bio15, Bio2, Bio7, and the slope provided moderate gains for R. praestans when used independently. Bio2 and Bio4 provided high gains (>1.0) for R. sinogrande, and Bio13, Bio17, Bio3, Slope, T_CLAY, and T_USDA_TEX_CLASS provided moderate gains when used independently.
3.3. Projected Changes in Habitat Suitability for Future Periods
Prediction of the potential distribution of four Rhododendron species in China under different future climatic scenarios (RCP 2.6, RCP 4.5, and RCP 8.5) in the 2050s and 2070s are shown in Figure 3. Compared with the current high-suitability habitat distribution range (Figure 4) in the 2070s, R. protistum will show a decreasing–increasing–decreasing trend with intensified emission scenarios, and it will have a maximum decrease of 85.84% in the 2070s under RCP 8.5. R. rex subsp. rex would experience a distribution range expansion under all of the three scenarios in the 2070s. However, R. praestans will show an opposite performance as R. rex subsp. rex. In addition, the distribution range of R. sinogrande will decrease under RCP 2.6 and expand under RCP 4.5 and RCP 8.5.
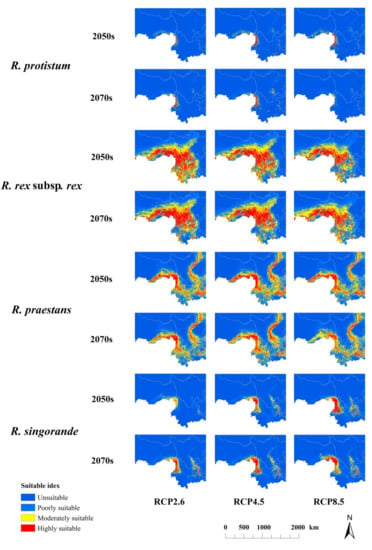
Figure 3.
Prediction of the potential distribution of four Rhododendron species in China under different future climatic scenarios (RCP 2.6, RCP 4.5, and RCP 8.5) in the 2050s and 2070s.
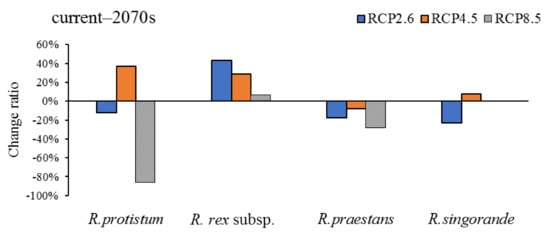
Figure 4.
Change ratio of high-suitability habitat distribution range for four Rhododendron species in the 2070s under RCP 2.6, RCP 4.5, and RCP 8.5.
After a comparison of the high-suitability habitat change ratio of each species between two periods (current–2050s and 2050s–2070s) under RCP 2.6, RCP 4.5, and RCP 8.5 (Figure 5), we found that the high-suitability habitat of R. protistum and R. rex subsp. rex will increase in the two periods under RCP 4.5. However, R. protistum will exhibit a trend of shrinkage–expansion and expansion–shrinkage under RCP 2.6 and RCP 8.5, respectively. The high-suitability habitat will decrease sharply in the 2050s–2070s under RCP 8.5. Meanwhile, the high-suitability habitat of R. rex subsp. rex will increase by at most 44.38% within the current–2050s under RCP 2.6. The high-suitability habitat of R. praestans will increase first, then decrease under RCP 2.6 and RCP 4.5, and it will show a persistent shrinkage trend under RCP 8.5. On the contrary, the high-suitability habitat of R. sinogrande will decrease first, then increase under RCP 2.6 and RCP 4.5.
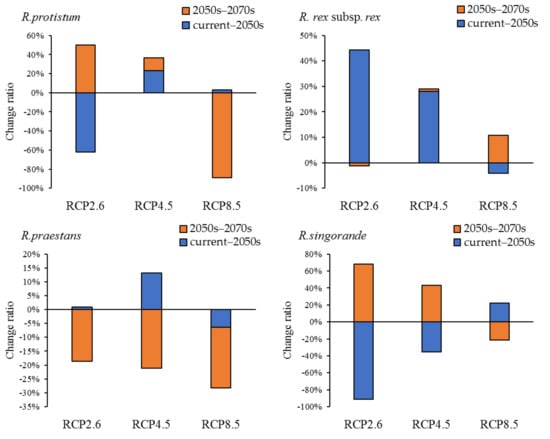
Figure 5.
Change ratio of high-suitability habitat distribution range for four Rhododendron species in two periods (current-2050s and 2050s–2070s) under RCP 2.6, RCP 4.5, and RCP 8.5.
3.4. Shifts of the Centroids of the High-Suitability Habitat in the Future
The overall trend of the centroid change of R. protistum will continue to be at high latitudes in the period current–2050s and 2050s–2070s under the three scenarios (Figure 6a), indicating that the climate sensitivity of the species will survive. R. rex subsp. rex will migrate to the northwest of the high latitude under RCP 4.5 and RCP 8.5, but under RCP 2.6, its centroid will move to low and then to high latitude (Figure 6b). For the centroid shift of R. praestans, it will move to high latitude, except for the period current–2050s under RCP 8.5 (Figure 6c). However, R. sinogrande is different from the former species, its centroid will change to high latitude first and then to low latitude under RCP 2.6 and RCP 4.5 (Figure 6d).
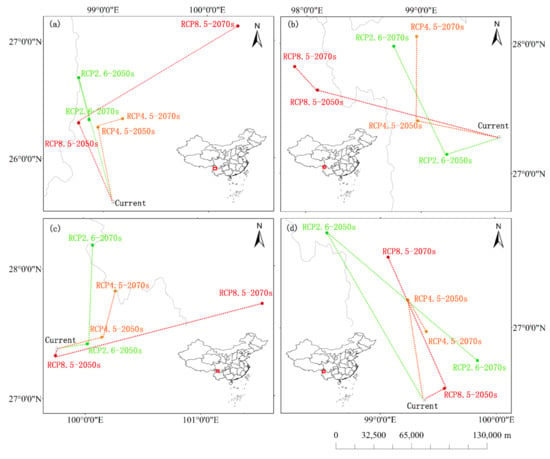
Figure 6.
Map of centroid shifts of high-suitability habitats for four Rhododendron species from current–2050s and 2070s under RCP 2.6, RCP 4.5, and RCP 8.5. The green line depicts the shifting path of high-suitability habitats under RCP 2.6. The orange line depicts the shifting path of high-suitability habitats under RCP 4.5. The red line depicts the shifting path of high-suitability habitats under RCP 8.5. (a) R. protistum, (b) R. rex subsp. rex, (c) R. praestans, (d) R. sinogrande.
4. Discussion
MAXENT is reliable in predicting the potential geographic distributions of species [19,20,21,23]. Ardestani reported that [22] the species with a wide distribution range tend to have low AUC values. Our results on the four Rhododendron species’ AUC values support this viewpoint. From small to large, the current habitat distribution ranges of the four focused species are in the order of R. protistum, R. sinogrande, R. praestans, and R. rex subsp. rex, and the AUC values are 0.996, 0.975, 0.922, and 0.918, respectively. In other words, R. protistum has the smallest distribution range with the largest AUC value (AUC = 0.996), and R. rex subsp. rex has the widest distribution range and the smallest AUC value.
The niche theory suggests that the species with a limited distribution range size often has a narrow niche breadth and low tolerance and adaptability to changeable environments [39]. The species with a wide distribution range tend to have a broad niche breadth, which allows them to adapt to climate change [13]. In the present study, the geographical ranges of R. protistum and R. sinogrande were locally distributed. These species have strict requirements for habitat environments. In other words, the predicted probability of presence will be greater than 0.632 if precipitation or other environment variables reach a certain value [40]. Moreover, the distribution sizes of R. rex subsp. rex and R. praestans were larger than the former. From the jackknife test on regularized training gain, we found that R. rex subsp. rex and R. praestans have a broad range of environment requirements. However, the suitable habitat proportion of limited-distribution plants R. protistum and R. sinogrande did not decrease under different future climate conditions according to the niche theory. On the contrary, their suitable habitat area will increase in the future. This prediction is consistent with the results of Yu et al. (2019) [12] and Lu et al. (2021) [13], in which the narrow-ranging species may experience range expansion under climate change. It is possible that the species occupying a warm climatological niche will benefit from climate change [41]. In addition, the distribution range of R. praestans was wider than the former, and its habitat size will decrease in the future. This result is consistent with the result of Yu et al. (2019) [12], in which the wide-ranging Rhododendron species will be adversely affected by environment changes. However, the distribution shift trend of R. rex subsp. rex was contrary to R. praestans. These species-specific responses of Rhododendron species imply specific conservation and reintroduction strategies for different species.
In general, the species would tend to distribute to high latitudes or elevations in the future to achieve a suitable habitat under continuous climate warming. Previous studies have demonstrated that numerous species change their geographic distribution range towards high latitudes and altitudes [1,16,17]. However, an increasing number of reports have found other types of range changes, such as east–west directions across longitudes or towards low elevations and tropical latitudes [42]. In this study, the four Rhododendron species were predicted to move towards high latitudes in the north-westward direction as a whole, especially the two threatened species R. protistum and R. rex subsp. rex. These results are in line with the universal migration rule of alpine plant species. However, the different species showed different movement trends (towards low latitudes or east–west direction across longitudes) under the different climate scenarios. For instance, the centroid shifts of the highly suitable habitat of R. sinogrande were predicted to move to high latitudes and to low latitudes in RCP 2.6 and RCP 4.5, respectively. This result implies that the species R. sinogrande has stronger adaptability to climate warming than the other species.
An organism’s habitat is the combination of the space it occupies and all of the ecological factors in that space, including the abiotic environment and the biotic environment, which are necessary for the survival of the other organisms [21]. Therefore, before conducting the predictions, we constructed a buffer area around the species occurrence localities to delimit the study region. This can greatly improve the accuracy and truthfulness of the predictions since the area includes environments that are accessible to the species, given its limitations and the configuration of barriers [43]. If possible, we could base this on a biological justification of the factor, physiological information from laboratory experiments, and natural history information when selecting the predictor variables to make the predictions realistic [44]. Previous studies have reported that aside from climate variables, other environmental factors, such as soil, topography and land use, vegetation dynamics, and inter-specific competition, affect the response of Rhododendron species to climate change and their future distribution [11,45,46]. Feng et al. (2020) [16] built ecological niche models using climate and soil variables when predicting the habitat distribution of Camptotheca acuminate. The authors found that soil factors can accurately limit the distribution range of species on the basis of climate factors, and the accuracy of climate and soil models for C. acuminata is high. Abdelaal [23] suggested that combining climate variables with soil variables can predict the distribution of species accurately. In the present study, climate, topographic, and soil variables were combined to explore the potential habitat distribution shift in current and future periods of four alpine Rhododendron species under rapid climate change. The results of the regularized training gain of each species showed that soil factors affect the distribution of Rhododendron species. T_CLAY, T_GRAVEL, and T_OC are important factors in predicting the distribution of R. protistum. T_USDA_TEX_CLASS has a moderate influence on R. rex subsp. rex. T_CLAY and T_USDA_TEX_CLASS can affect the habitat distribution of R. sinogrande. The clay content (T_CLAY) provides a high soil organic carbon, and the gravel content in the topsoil (T_GRAVEL) affects the respiration and water absorption of the roots. The content of topsoil organic carbon (T_OC) is a significant indicator in evaluating soil fertility. Moreover, the soil type (T_USDA_TEX_CLASS) can reflect the soil physical properties. Overall, we reasonably speculate that the nutrient-holding and water-holding capacities of soil significantly affect the distribution of Rhododendron species.
Rhododendron species have high ecological and ornamental values, but 70% of the plants in this group are classified as vulnerable, threatened, endangered or critically endangered [9,10]. Therefore, conservation recommendations must be made in accordance with the characteristics of the species, especially under future climate change scenarios. SDMs are easy-to-use tools for selecting the probable distribution and areas suitable for the reintroduction of endangered species [20,21,23]. Moreover, our results indicate that aside from climate factors, the contents of clay, gravel, and organic carbon in the topsoil have a significant influence on the endangered plant R. protistum. This result implies that the conservation and future reintroduction of R. protistum should consider not only the climate factors, but also the characteristics of topsoil in the micro-habitat. In addition, we found that R. protistum will face a severe contraction across its highly suitable distribution area in the 2070s under the RCP 8.5 climate change scenario. Notably, the remaining habitat area is still concentrated in the national natural conservation zone in the Gaoligong Mountain. Therefore, we reasonably speculate that the survival of R. protistum depends on the specific environment or local microhabitats, and R. protistum may have nearly no adaptive capacity to climate change. We recommend protecting R. protistum in situ where its preference is. In addition, we recommend that the habitat selection of future reintroduction and population recovery of R. protistum should focus on the Gaoligong Mountain. R. rex subsp. rex is an endangered plant endemic to China. However, the present study showed that this species will experience distribution range expansion under all of the three scenarios in the 2070s. This finding indicates that R. rex subsp. rex may have a certain adaptive capacity to future global warming. Meanwhile, a previous study has reported that the main reason for the endangerment of R. rex subsp. rex is exotic anthropogenic disturbance [8,47]. Furthermore, the present study found that the distribution of R. rex subsp. rex is mainly affected by the temperature seasonality standard deviation and soil type. Therefore, we suggest that R. rex subsp. rex should be given priority by building a conservation area to protect it from high-frequency human disturbances and implement reintroduction strategies for its future suitable habitat. Although R. praestans and R. sinogrande are not listed as threatened plants in China, the distribution size of R. praestans will decrease by 28.34% in the future. Therefore, we suggest that comprehensive studies and additional other alpine Rhododendron species should be given urgent attention under the scenario of climate change.
5. Conclusions
Global climate change causes distribution changes in organisms, which significantly affect biodiversity conservation and ecosystem safety. Therefore, predicting the trends of distribution changes of plants can provide a basis for plant conservation and habitat selection in species’ reintroduction strategies. The present study applied MaxEnt modeling and integrated climate, topography, and soil variables in three periods under three climate change scenarios to predict the suitable habitat for four Rhododendron species in China. We revealed species-specific responses to climate change and the influence of topsoil factors on the distribution of Rhododendron species. Moreover, we presented corresponding conservation strategies for different species.
Author Contributions
Conceptualization, S.-K.S., L.Y. and X.-F.L.; methodology, J.-H.Z., X.-F.L. and K.-J.L.; formal analysis, J.-H.Z. and K.-J.L.; writing—original draft preparation, J.-H.Z.; writing—review and editing, S.-K.S., L.Y. and X.-F.L.; supervision, S.-K.S.; project administration, S.-K.S.; funding acquisition, S.-K.S. All authors have read and agreed to the published version of the manuscript.
Funding
This research was funded by the National Natural Science Foundation of China (31870529, 31560224), the Science and Technology Basic Resources Investigation Program of China (2017FY100100), the Young Academic and Technical Leader Raising Foundation of Yunnan Province (2018HB035), the Program for Excellent Young Talents, Yunnan University, and the Scientific research fund project of Education Department of Yunnan (2021Y045).
Conflicts of Interest
The authors declare no conflict of interest.
Appendix A

Table A1.
Multi-collinearity test by utilizing correlations among climate variables for R. protistum.
Table A1.
Multi-collinearity test by utilizing correlations among climate variables for R. protistum.
| Factor | Bio2 | Bio3 | Bio4 | Bio6 | Bio9 | Bio13 | Bio15 | Bio17 | Asp | Ele | Slo | T_CaCO3 | T_CLAY | T_GRAVEL | T_OC |
|---|---|---|---|---|---|---|---|---|---|---|---|---|---|---|---|
| Bio2 | 1.00 | ||||||||||||||
| Bio3 | 0.59 | 1.00 | |||||||||||||
| Bio4 | 0.27 | −0.59 | 1.00 | ||||||||||||
| Bio6 | −0.85 | −0.19 | −0.61 | 1.00 | |||||||||||
| Bio9 | −0.77 | −0.07 | −0.68 | 0.99 | 1.00 | ||||||||||
| Bio13 | −0.67 | 0.03 | −0.72 | 0.84 | 0.85 | 1.00 | |||||||||
| Bio15 | 0.75 | 0.45 | 0.20 | −0.68 | −0.64 | −0.50 | 1.00 | ||||||||
| Bio17 | −0.78 | −0.33 | −0.39 | 0.77 | 0.75 | 0.70 | −0.73 | 1.00 | |||||||
| Asp | −0.02 | −0.01 | −0.02 | 0.01 | 0.01 | 0.02 | −0.02 | 0.02 | 1.00 | ||||||
| Ele | 0.87 | 0.44 | 0.33 | −0.93 | −0.89 | −0.74 | 0.73 | −0.73 | −0.02 | 1.00 | |||||
| Slo | −0.07 | 0.19 | −0.32 | 0.15 | 0.16 | 0.23 | −0.13 | 0.04 | 0.03 | −0.07 | 1.00 | ||||
| T_CaCO3 | −0.23 | −0.31 | 0.15 | 0.19 | 0.16 | 0.05 | −0.17 | 0.03 | −0.01 | −0.30 | −0.11 | 1.00 | |||
| T_CLAY | −0.53 | −0.09 | −0.42 | 0.68 | 0.68 | 0.59 | −0.48 | 0.57 | 0.01 | −0.64 | 0.09 | 0.08 | 1.00 | ||
| T_GRAVEL | 0.14 | 0.10 | 0.02 | −0.14 | −0.12 | −0.11 | 0.18 | 0.00 | 0.00 | 0.18 | −0.10 | −0.09 | −0.22 | 1.00 | |
| T_OC | 0.14 | 0.11 | −0.02 | −0.10 | −0.08 | −0.04 | 0.07 | −0.04 | 0.00 | 0.11 | −0.05 | −0.10 | 0.07 | 0.14 | 1.00 |

Table A2.
Multi-collinearity test by utilizing correlations among climate variables for R. rex subsp. rex.
Table A2.
Multi-collinearity test by utilizing correlations among climate variables for R. rex subsp. rex.
| Factor | Bio4 | Bio10 | Bio12 | Bio14 | Bio19 | Asp | Slo |
|---|---|---|---|---|---|---|---|
| Bio4 | 1.00 | ||||||
| Bio10 | −0.51 | 1.00 | |||||
| Bio12 | −0.42 | 0.49 | 1.00 | ||||
| Bio14 | −0.56 | 0.63 | 0.72 | 1.00 | |||
| Bio19 | −0.53 | 0.55 | 0.74 | 0.95 | 1.00 | ||
| Asp | −0.01 | −0.05 | 0.01 | 0.00 | 0.00 | 1.00 | |
| Slo | 0.21 | −0.20 | −0.13 | −0.21 | −0.15 | 0.00 | 1.00 |

Table A3.
Multi-collinearity test by utilizing correlations among climate variables for R. praestans.
Table A3.
Multi-collinearity test by utilizing correlations among climate variables for R. praestans.
| Factor | Bio2 | Bio5 | Bio7 | Bio15 | Bio16 | Slo | T_ECE | T_OC |
|---|---|---|---|---|---|---|---|---|
| Bio2 | 1.00 | |||||||
| Bio5 | −0.83 | 1.00 | ||||||
| Bio7 | 0.67 | −0.59 | 1.00 | |||||
| Bio15 | 0.75 | −0.70 | 0.48 | 1.00 | ||||
| Bio16 | −0.68 | 0.70 | −0.84 | −0.53 | 1.00 | |||
| Slo | −0.07 | 0.05 | −0.25 | −0.13 | 0.24 | 1.00 | ||
| T_ECE | 0.04 | 0.02 | 0.09 | 0.01 | −0.07 | −0.08 | 1.00 | |
| T_OC | 0.14 | −0.12 | 0.05 | 0.07 | −0.04 | −0.05 | −0.05 | −0.10 |

Table A4.
Multi-collinearity test by utilizing correlations among climate variables for R. singorand.
Table A4.
Multi-collinearity test by utilizing correlations among climate variables for R. singorand.
| Factor | Bio2 | Bio3 | Bio4 | Bio5 | Bio7 | Bio11 | Bio13 | Bio16 | Bio17 | Asp | Ele | Slo | T_CaCO3 | T_Clay |
|---|---|---|---|---|---|---|---|---|---|---|---|---|---|---|
| Bio2 | 1.00 | |||||||||||||
| Bio3 | 0.59 | 1.00 | ||||||||||||
| Bio4 | 0.27 | −0.59 | 1.00 | |||||||||||
| Bio5 | −0.83 | −0.43 | −0.29 | 1.00 | ||||||||||
| Bio7 | 0.67 | −0.18 | 0.89 | −0.59 | 1.00 | |||||||||
| Bio11 | −0.78 | −0.08 | −0.68 | 0.90 | −0.87 | 1.00 | ||||||||
| Bio13 | −0.67 | 0.03 | −0.72 | 0.69 | −0.84 | 0.86 | 1.00 | |||||||
| Bio16 | −0.68 | 0.01 | −0.71 | 0.70 | −0.84 | 0.87 | 1.00 | 1.00 | ||||||
| Bio17 | −0.78 | −0.33 | −0.39 | 0.70 | −0.67 | 0.73 | 0.70 | 0.71 | 1.00 | |||||
| Asp | −0.02 | −0.01 | −0.02 | 0.00 | −0.03 | 0.01 | 0.02 | 0.02 | 0.02 | 1.00 | ||||
| Ele | 0.87 | 0.44 | 0.33 | −0.98 | 0.63 | −0.91 | −0.74 | −0.76 | −0.73 | −0.02 | 1.00 | |||
| Slo | −0.07 | 0.19 | −0.32 | 0.05 | −0.25 | 0.18 | 0.23 | 0.24 | 0.04 | 0.03 | −0.07 | 1.00 | ||
| T_CaCO3 | −0.23 | −0.31 | 0.15 | 0.31 | 0.02 | 0.17 | 0.05 | 0.05 | 0.03 | −0.01 | −0.30 | −0.11 | 1.00 | |
| T_CLAY | −0.53 | −0.09 | −0.42 | 0.64 | −0.56 | 0.68 | 0.59 | 0.60 | 0.57 | 0.01 | −0.64 | 0.09 | 0.08 | 1.00 |

Table A5.
The property of the extrapolation area to the projection area for four Rhododendron species.
Table A5.
The property of the extrapolation area to the projection area for four Rhododendron species.
| Species | Current | RCP 2.6 | RCP 4.5 | RCP 8.5 | |||
|---|---|---|---|---|---|---|---|
| 2050s | 2070s | 2050s | 2070s | 2050s | 2070s | ||
| R. protistum | 90.74% | 91.59% | 90.56% | 90.25% | 91.27% | 91.40% | 91.89% |
| R. rex subsp. rex | 71.17% | 68.31% | 67.77% | 68.67% | 68.18% | 69.85% | 69.51% |
| R. praestans | 77.41% | 74.93% | 76.74% | 76.61% | 77.39% | 77.10% | 75.06% |
| R. sinogrande | 87.70% | 86.78% | 85.54% | 86.24% | 86.42% | 86.17% | 86.29% |
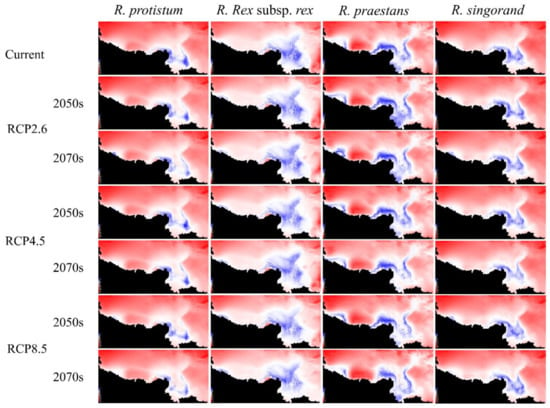
Figure A1.
The multivariate environmental similarity surface (MESS) map output for four Rhododendron species in different periods under RCP 2.6, RCP 4.5, and RCP 8.5. Areas with different degrees of similarity by the white-blue colors (comprised between 0 and 1) and extrapolation areas are displayed in red.
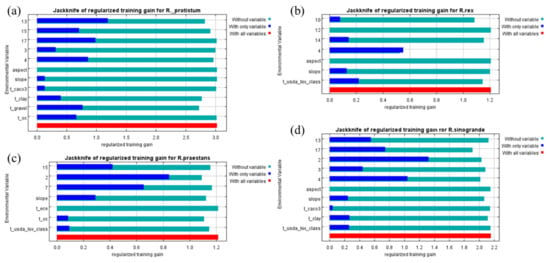
Figure A2.
The Jackknife test of variables’ contribution for four Rhododendron species: (a) R. protistum, (b) R. rex subsp. rex, (c) R. praestans, (d) R. sinogrande.
References
- Chen, I.C.; Hill, J.K.; Ohlemüller, R.; Roy, D.B.; Thomas, C.D. Rapid range shifts of species associated with high levels of climate warming. Science 2011, 333, 1024–1026. [Google Scholar] [CrossRef] [PubMed]
- Bertrand, R.; Lenoir, J.; Piedallu, C.; Dillon, G.R.; De Ruffray, P.; Vidal, C.; Pierrat, J.C.; Gégout, J.C. Changes in plant community composition lag behind climate warming in lowland forests. Nature 2011, 479, 517–520. [Google Scholar] [CrossRef] [PubMed]
- Moritz, C.; Agudo, R. The future of species under climate change: Resilience or decline? Science 2013, 341, 504–508. [Google Scholar] [CrossRef] [PubMed]
- Pepin, N.; Bradley, R.S.; Diaz, H.F.; Baraër, M.; Caceres, E.B.; Forsythe, N.; Fowler, H.; Greenwood, G.; Hashmi, M.Z.; Liu, X.D. Mountain Research Initiative Elevation-dependent warming in mountain regions of the world. Nat. Clim. Chang. 2015, 5, 424–430. [Google Scholar] [CrossRef]
- Dirnböck, T.; Essl, F.; Rabitsch, W. Disproportional risk for habitat loss of high-altitude endemic species under climate change. Glob. Chang. Biol. 2011, 17, 990–996. [Google Scholar] [CrossRef]
- Hülber, K.; Wessely, J.; Gattringer, A.; Moser, D.; Kuttner, M.; Essl, F.; Leitner, M.; Winkler, M.; Ertl, S.; Willner, W.; et al. Uncertainty in predicting range dynamics of endemic alpine plants under climate warming. Glob. Chang. Biol. 2016, 22, 2608–2619. [Google Scholar] [CrossRef] [PubMed]
- Wyatt, G.E.; Hamrick, J.L.; Trapnell, D.W. Ecological niche modelling and phylogeography reveal range shifts of pawpaw, a North American understorey tree. J. Biogeogr. 2021, 48, 974–989. [Google Scholar] [CrossRef]
- Zhang, Y.; Zhang, X.; Wang, Y.H.; Shen, S.K. De novo assembly of transcriptome and development of novel EST-SSR markers in Rhododendron rex Lévl. Through illumina sequencing. Front. Plant Sci. 2017, 8, 1–12. [Google Scholar] [CrossRef]
- Shrestha, N.; Wang, Z.H.; Su, X.Y.; Xu, X.T.; Lyu, L.; Liu, Y.P.; Dimitrov, D.; Kennedy, J.D.; Wang, Q.G.; Tang, Z.Y.; et al. Global patterns of Rhododendron diversity: The role of evolutionary time and diversification rates. Glob. Ecol. Biogeogr. 2018, 27, 913–924. [Google Scholar] [CrossRef]
- Ma, Y.P.; Nielsen, J.; Chamberlain, D.F.; Li, X.Y.; Sun, W.B. The conservation of Rhododendrons is of greater urgency than has been previously acknowledged in China. Biodivers. Conserv. 2014, 23, 3149–3154. [Google Scholar] [CrossRef]
- Kumar, P. Assessment of impact of climate change on Rhododendrons in Sikkim Himalayas using Maxent modelling: Limitations and challenges. Biodivers. Conserv. 2012, 21, 1251–1266. [Google Scholar] [CrossRef]
- Yu, F.Y.; Wang, T.J.; Groen, T.A.; Skidmore, A.K.; Yang, X.F.; Ma, K.P.; Wu, Z.F. Climate and land use changes will degrade the distribution of Rhododendrons in China. Sci. Total Environ. 2019, 659, 515–528. [Google Scholar] [CrossRef]
- Lu, Y.P.; Liu, H.C.; Chen, W.; Yao, J.; Huang, Y.P.; Zhang, Y.; He, X.Y. Conservation planning of the genus Rhododendron in Northeast China based on current and future suitable habitat distributions. Biodivers. Conserv. 2021, 30, 673–697. [Google Scholar] [CrossRef]
- Kozak, K.H.; Graham, C.H.; Wiens, J.J. Integrating GIS-based environmental data into evolutionary biology. Trends Ecol. Evol. 2008, 23, 141–148. [Google Scholar] [CrossRef] [PubMed]
- Guo, Y.L.; Li, X.; Zhao, Z.F.; Nawaz, Z. Predicting the impacts of climate change, soils and vegetation types on the geographic distribution of Polyporus umbellatus in China. Sci. Total Environ. 2019, 648, 1–11. [Google Scholar] [CrossRef]
- Feng, L.; Sun, J.J.; Shi, Y.B.; Wang, G.B.; Wang, T.L. Predicting suitable habitats of Camptotheca acuminata considering both climatic and soil variables. Forests 2020, 11, 891. [Google Scholar] [CrossRef]
- Fragnière, Y.; Pittet, L.; Clément, B.; Bétrisey, S.; Gerber, E.; Ronikier, M.; Parisod, C.; Kozlowski, G. Climate Change and Alpine Screes: No Future for Glacial Relict Papaver occidentale (Papaveraceae) in Western Prealps. Diversity 2020, 12, 346. [Google Scholar] [CrossRef]
- Hunter-ayad, J.; Seddon, P.J.; Hunter-ayad, J. Reintroduction modelling: A guide to choosing and combining models for species reintroductions. J. Appl. Ecol. 2020, 57, 1233–1243. [Google Scholar] [CrossRef]
- Tariq, M.; Bhatt, S.K.N.I.D.; Bhavsar, D.; Roy, A.; Pande, V. Phytosociological and niche distribution study of Paris polyphylla smith, an important medicinal herb of Indian Himalayan region. Trop. Ecol. 2021, 62, 163–173. [Google Scholar] [CrossRef]
- Wani, I.A.; Verma, S.; Mushtaq, S.; Alsahli, A.A.; Alyemeni, M.N.; Tariq, M.; Pant, S. Ecological analysis and environmental niche modelling of Dactylorhiza hatagirea (D. Don) Soo: A conservation approach for critically endangered medicinal orchid. Saudi J. Biol. Sci. 2021, 28, 2109–2122. [Google Scholar] [CrossRef] [PubMed]
- Yi, Y.J.; Cheng, X.; Yang, Z.F.; Zhang, S.H. Maxent modeling for predicting the potential distribution of endangered medicinal plant (H. riparia Lour) in Yunnan, China. Ecol. Eng. 2016, 92, 260–269. [Google Scholar] [CrossRef]
- Ardestani, E.G.; Tarkesh, M.; Bassiri, M.; Vahabi, M.R. Potential habitat modeling for reintroduction of three native plant species in central Iran. J. Arid Land 2015, 7, 381–390. [Google Scholar] [CrossRef]
- Abdelaal, M.; Fois, M.; Dakhil, M.A.; Bacchetta, G.; El-Sherbeny, G.A. Predicting the Potential Current and Future Distribution of the Endangered Endemic Vascular Plant Primula boveana Decne. ex Duby in Egypt. Plants 2020, 9, 957. [Google Scholar] [CrossRef] [PubMed]
- Fu, L.G.; Jin, J.M. Red List of Endangered Plants in China; Science Press: Beijing, China, 1992. [Google Scholar]
- Climate Change 2013: The Physical Science Basis. Contribution of Working Group I to the Fifth Assessment Report of the Intergovernmental Panel on Climate Change; Stocker, T.F., Qin, D., Plattner, G.-K., Tignor, M., Allen, S.K., Boschung, J., Nauels, A., Xia, Y., Bex, V., Eds.; Cambridge University Press: Cambridge, UK; New York, NY, USA, 2013; Volume AR5, p. 1535. [Google Scholar]
- Graham, M.H. Confronting multicollinearity in ecological multiple regression. Ecology 2003, 84, 2809–2815. [Google Scholar] [CrossRef]
- Escobar, L.E.; Lira-Noriega, A.; Medina-Vogel, G.; Townsend Peterson, A. Potential for spread of the white-nose fungus (Pseudogymnoascus destructans) in the Americas: Use of Maxent and NicheA to assure strict model transference. Geospat. Health 2014, 9, 221–229. [Google Scholar] [CrossRef] [PubMed]
- Zhu, G.P.; Peterson, A.T. Do consensus models outperform individual models? Transferability evaluations of diverse modeling approaches for an invasive moth. Biol. Invasions 2017, 19, 2519–2532. [Google Scholar] [CrossRef]
- Team, R.C. R: A Language and Environment for Statistical Computing. 2018. Available online: https://www/R-project.org (accessed on 1 October 2021).
- Warren, D.L.; Seifert, S.N. Ecological niche modeling in Maxent: The importance of model complexity and the performance of model selection criteria. Ecol. Appl. 2011, 21, 335–342. [Google Scholar] [CrossRef]
- Kass, J.M.; Vilela, B.; Aiello-Lammens, M.E.; Muscarella, R.; Merow, C.; Anderson, R.P. Wallace: A flexible platform for reproducible modeling of species niches and distributions built for community expansion. Methods Ecol. Evol. 2018, 9, 1151–1156. [Google Scholar] [CrossRef]
- Phillips, S.J.; Dudík, M.; Schapire, R.E. Maxent Software for Modeling Species Niches and Distributions (Version 3.4.1). Available online: http://biodiversityinformatics.amnh.org/open_sourse/maxent/ (accessed on 1 October 2021).
- Swets, J. Measuring the accuracy of diagnostic systems. Science 1988, 240, 1285–1293. [Google Scholar] [CrossRef] [PubMed]
- Allouche, O.; Tsoar, A.; Kadmon, R. Assessing the accuracy of species distribution models: Prevalence, kappa and the true skill statistic (TSS). J. Appl. Ecol. 2006, 43, 1223–1232. [Google Scholar] [CrossRef]
- Elith, J.; Kearney, M.; Phillips, S. The art of modelling range-shifting species. Methods Ecol. Evol. 2010, 1, 330–342. [Google Scholar] [CrossRef]
- Feng, X.; Lin, C.; Qiao, H.; Ji, L. Assessment of climatically suitable area for Syrmaticus reevesii under climate change. Endanger. Species Res. 2015, 28, 19–31. [Google Scholar] [CrossRef][Green Version]
- Guillaumot, C.; Moreau, C.; Danis, B.; Saucède, T. Extrapolation in species distribution modelling. Application to Southern Ocean marine species. Prog. Oceanogr. 2020, 188, 102438. [Google Scholar] [CrossRef]
- Brown, J.L. SDMtoolbox: A python-based GIS toolkit for landscape genetic, biogeographic and species distribution model analyses. Methods Ecol. Evol. 2014, 5, 694–700. [Google Scholar] [CrossRef]
- Slatyer, R.A.; Hirst, M.; Sexton, J.P. Niche breadth predicts geographical range size: A general ecological pattern. Ecol. Lett. 2013, 16, 1104–1114. [Google Scholar] [CrossRef] [PubMed]
- Phillips, S.J.; Anderson, R.P.; Dudík, M.; Schapire, R.E.; Blair, M.E. Opening the black box: An open-source release of Maxent. Ecography 2017, 40, 887–893. [Google Scholar] [CrossRef]
- Frishkoff, L.O.; Karp, D.S.; Flanders, J.R.; Zook, J.; Hadly, E.A.; Daily, G.C.; M’Gonigle, L.K. Climate change and habitat conversion favour the same species. Ecol. Lett. 2016, 19, 1081–1090. [Google Scholar] [CrossRef] [PubMed]
- Lenoir, J.; Svenning, J. Climate-related range shifts—A global multidimensional synthesis and new research directions. Ecography 2015, 38, 15–28. [Google Scholar] [CrossRef]
- Anderson, R.P.; Raza, A. The effect of the extent of the study region on GIS models of species geographic distributions and estimates of niche evolution: Preliminary tests with montane rodents (genus Nephelomys) in Venezuela. J. Biogeogr. 2010, 37, 1378–1393. [Google Scholar] [CrossRef]
- Guevara, L.; Gerstner, B.E.; Kass, J.M.; Anderson, R.P. Toward ecologically realistic predictions of species distributions: A cross-time example from tropical montane cloud forests. Glob. Chang. Biol. 2018, 24, 1511–1522. [Google Scholar] [CrossRef] [PubMed]
- Eşen, D.; Zedaker, S.M.; Kirwan, J.L.; Mou, P. Soil and site factors influencing purple-flowered rhododendron (Rhododendron ponticum L.) and eastern beech forests (Fagus orientalis Lipsky) in Turkey. For. Ecol. Manag. 2004, 203, 229–240. [Google Scholar] [CrossRef]
- Tokuoka, Y.; Hayakawa, H.; Hashigoe, K. Spatial distribution and environmental preferences of a threatened species (Rhododendron uwaense) and two common species (R. dilatatum var decandrum and R. weyrichii) in southwestern Japan. J. For. Res. 2020, 25, 113–119. [Google Scholar] [CrossRef]
- Zhang, X.; Liu, Y.H.; Wang, Y.H.; Shen, S.K. Genetic diversity and population structure of Rhododendron rex Subsp. rex inferred from microsatellite markers and chloroplast DNA sequences. Plants 2020, 9, 338. [Google Scholar] [CrossRef]
Publisher’s Note: MDPI stays neutral with regard to jurisdictional claims in published maps and institutional affiliations. |
© 2021 by the authors. Licensee MDPI, Basel, Switzerland. This article is an open access article distributed under the terms and conditions of the Creative Commons Attribution (CC BY) license (https://creativecommons.org/licenses/by/4.0/).