Article

Prediction of the Suitable Area of the Chinese White Pines (Pinus subsect. Strobus) under Climate Changes and Implications for Their Conservation

School of Ecology and Nature Conservation, Beijing Forestry University, Beijing 100083, China
*
Author to whom correspondence should be addressed.
Forests 2020, 11(9), 996; https://doi.org/10.3390/f11090996
Submission received: 14 June 2020 / Revised: 10 September 2020 / Accepted: 12 September 2020 / Published: 17 September 2020
(This article belongs to the Section Forest Ecology and Management)

Abstract

:
White pines (Pinus subsect. Strobus) play important roles in forest ecosystems in the Northern Hemisphere. Species of this group are narrowly distributed or endangered in China. In this study, we used a species distribution model (SDM) to project and predict the distribution patterns of the 12 species of Chinese white pine under a variety of paleoclimatic and future climate change scenarios based on 39 high-resolution environmental variables and 1459 distribution records. We also computed the centroid shift, range expansion/contraction, and suitability change of the current distribution area to assess the potential risk to each species in the future. The modeling results revealed that the suitable habitat of each species is consistent with but slightly larger than its actual distribution range and that temperature, precipitation, and UV radiation are important determining factors for the distribution of different white pine species. The results indicate that the Last Glacial Maximum (LGM) greatly affected the current distribution of the Chinese white pine species. Additionally, it was predicted that under the future climate change scenarios, there will be a reduction in the area of habitats suitable for P. armandii, P. morrisonicola, and P. mastersiana. Furthermore, some of the current distribution sites of P. armandii, P. kwangtungensis, P. mastersiana, P. morrisonicola, P. sibirica, and P. wallichiana were predicted to become more unsuitable under these scenarios. These results indicate that some Chinese white pine species, such as P. armandii, P. morrisonicola, and P. mastersiana, may have a very high risk of population shrinkage in the future. Overall, this study provided relevant data for the long-term conservation (both in situ and ex situ) and sustainable management of Chinese white pine species.

1. Introduction

There are 17 so-called “megadiverse” countries, predominantly located in tropical or subtropical regions, which harbor the majority of earth’s species and have a high proportion of endemism [1]. China is one of the few megadiverse countries in the temperate zone of the Northern Hemisphere [2]. Therefore, the conservation of China’s biodiversity will make a great contribution to the natural heritage of temperate zones [3]. However, biodiversity loss is continuing, and some researchers consider the earth to be undergoing the sixth mass extinction in its history [4,5,6]. The distribution of organisms has been greatly influenced by climate changes and habitat fragmentation, which bring about severe threats to biodiversity [3,7]. In the last few decades, rising temperatures have shifted the latitudinal and altitudinal ranges of many species, especially those distributed in alpine areas [7,8]. Thus, determining the effects of climate changes on the distribution of organisms is fundamental for understanding the conservation of biodiversity [9,10,11].
The earth’s vegetation and plant communities have been deeply influenced and shaped by the climate fluctuations since the Late Pleistocene, particularly since the last glacial-interglacial cycle [12,13,14,15,16]. During the glacial periods of the Quaternary, the global temperature was 5–12 °C lower than today, and the environment of East Asia became much drier due to the weakness of the Asian summer monsoon [17]. Paleopalynological evidence suggests that remarkable vegetation changes occurred in East Asia during the Last Glacial Maximum (LGM), which led to the expansion of steppe regions and the contraction and southward migration of forests [13,18]. During these vegetation shifts, the destinies of individual species were strongly impacted by climate changes. During the hash climatic conditions in the glacial-interglacial cycles, many temperate species are considered to undergo a habitat contraction and retreat into refugia, which are usually characterized by high genetic diversity and are hence hotspots of species conservation [14,19]. After the adverse climatic conditions improve, species may expand from the refugia and recolonize their previous habitats; however, the recolonization may be limited, which is considered to cause endemism and disjunctive distributions [20]. Thus, the reconstruction of species’ distribution in the context of paleoclimatic punctuation can help to understand their current distribution patterns.
As estimated by the Fifth Assessment Report of the Intergovernmental Panel on Climate Change (IPCC), by the end of the 21st century, the average global temperature will have increased by 0.3–4.8 °C due to the continued increase of greenhouse gas emissions [8]. This temperature increase may have an especially large impact on alpine species since there may not be sufficient suitable habitats at higher elevation for them to migrate to [21,22] and they may experience more barriers to dispersal when migrating to other new suitable locations [23]. Under future global warming, many species are at risk of population shrinkage or even local extinction, especially endemic or restricted species [24]. For highly threatened species, transplanting to suitable habitats is thought to be an option to maintain their population in the wild [25]. For this reason, it is necessary to reveal the impact of past and future climate changes on species, assess locations in which species are at a particularly high risk under future climate change, and predict suitable habitat for ex situ conservation.
Forests harbor a significant proportion of the global species pool and their widespread destruction is a key driver of the ongoing global biodiversity crisis [26,27]. Conifers are important and very often dominant components of temperate forests in the Northern Hemisphere [28]. Consisting of over 100 extant species, Pinus is the largest genus of conifers and the most widespread genus of trees in this hemisphere [29]. White pines (P. subsect. Strobus, pines with a bundle of five leaves), a species-rich group in the P. subg. Strobus [29], comprise more than 20 species worldwide [30]. Species of this subsection are characterized by their five-leaved bundles and terminal umbo, and recent molecular phylogenetic analysis supports the idea that they are a monophyletic group [29,30]. Around 10 species of white pine (albeit with some taxonomic controversies) are naturally distributed in China [31,32].
According to their geographic distribution, Chinese white pines can be recognized as northern species (P. sibirica, P. koraiensis, and P. pumila), southern mainland species (P. armandii, P. dabeshanensis, P. kwangtungensis, P. fenzeliana, and P. wangii), Himalayan species (P. wallichiana and P. bhutanica), and Taiwan species (P. morrisonicola and P. mastersiana). Among them, five species are endemic to China (Figure 1, Table S1). Many of the Chinese white pines are narrowly distributed and endangered (Table S1) [32,33,34]. The habitats of 1/3 of Chinese white pine species (P. dabeshanensis, P. wangii, P. mastersiana, and P. morrisonicola) are restricted to a single mountain range. All the Chinese white pines are montane species, with most growing at elevations above 1000 m a.s.l., and consequently, they colonize fragmented natural habitats, even those with a broad distribution. Besides the endangered species, the populations of some least-concern species of Chinese white pine in China, such as P. sibirica, P. bhutanica, and P. wallichiana, are also very low and fragile. For example, populations of P. sibirica are only found in the far northeast and far northwest of China. It is highly possible that this species will disappear from China in the near future due to global warming.
Due to its importance in ecosystems, P. subsect. Strobus has attracted much attention in recent years. Previous studies have studied white pines in terms of their phylogeny, ecology, population structures of endangered species, etc. [30,35,36,37,38,39,40,41,42,43,44,45]. However, it is still unclear what are the key ecological factors determining the current distribution of P. subsect. Strobus, how the distribution pattern reacted to changes in paleoclimate, and how the distribution pattern will react under future climate changes. This knowledge will help us to identify response mechanisms, which will contribute to the development of effective conservation strategies in the future.
The maximum entropy method (MaxEnt) is a species distribution model (SDM) that is used to simulate the habitats that are suitable for species based on presence data and information of environmental variables [46]. Due to the model’s effectiveness, it has been widely used in biodiversity (especially for endangered species) conservation [47,48,49,50,51], invasive species control [52,53], as well as nature reserve planning and management [54,55,56]. It has also been applied to reconstruct habitat shifts of individual species or vegetation during the last glacial period, and simulate how paleoclimatic fluctuations have influenced the present distribution [57,58,59], predict the potential distribution in the future, find conservation gaps, and guide protection management [60,61,62].
Niche conservatism is a key assumption underlying the application of SDMs [63]. According to a phylogenetic study of P. subsect. Strobus species, the current species diversity and distribution of this group was greatly influenced by climate changes during the late Neogene [30]. Therefore, we hypothesize that the current distribution and endangered status of the Chinese white pine species may have been greatly but differently influenced by the climate variation during the last glacial period due to the different ecological niches of the species. Under projected future global warming, the suitable habitat of each species is expected to change differently, which may raise serious conservation issues for some species, especially those with restricted distribution.
In this study, we used comprehensive occurrence data of the Chinese white pine species and a species distribution model to dynamically project and quantify their suitable habitats under paleoclimatic, current, and future climate scenarios. We also explored the centroid shift, range expansion/contraction, and suitability change of the current distribution area to assess the potential risk to each species in the future. Our aims are to find out how climate fluctuation since the last interglacial period have impacted the present distribution pattern and endangerment of Chinese white pines in order to determine the vulnerability of the studied species to future climate change, identify the habitats at risk of extinction, and provide guidance for species conservation.

2. Materials and Methods

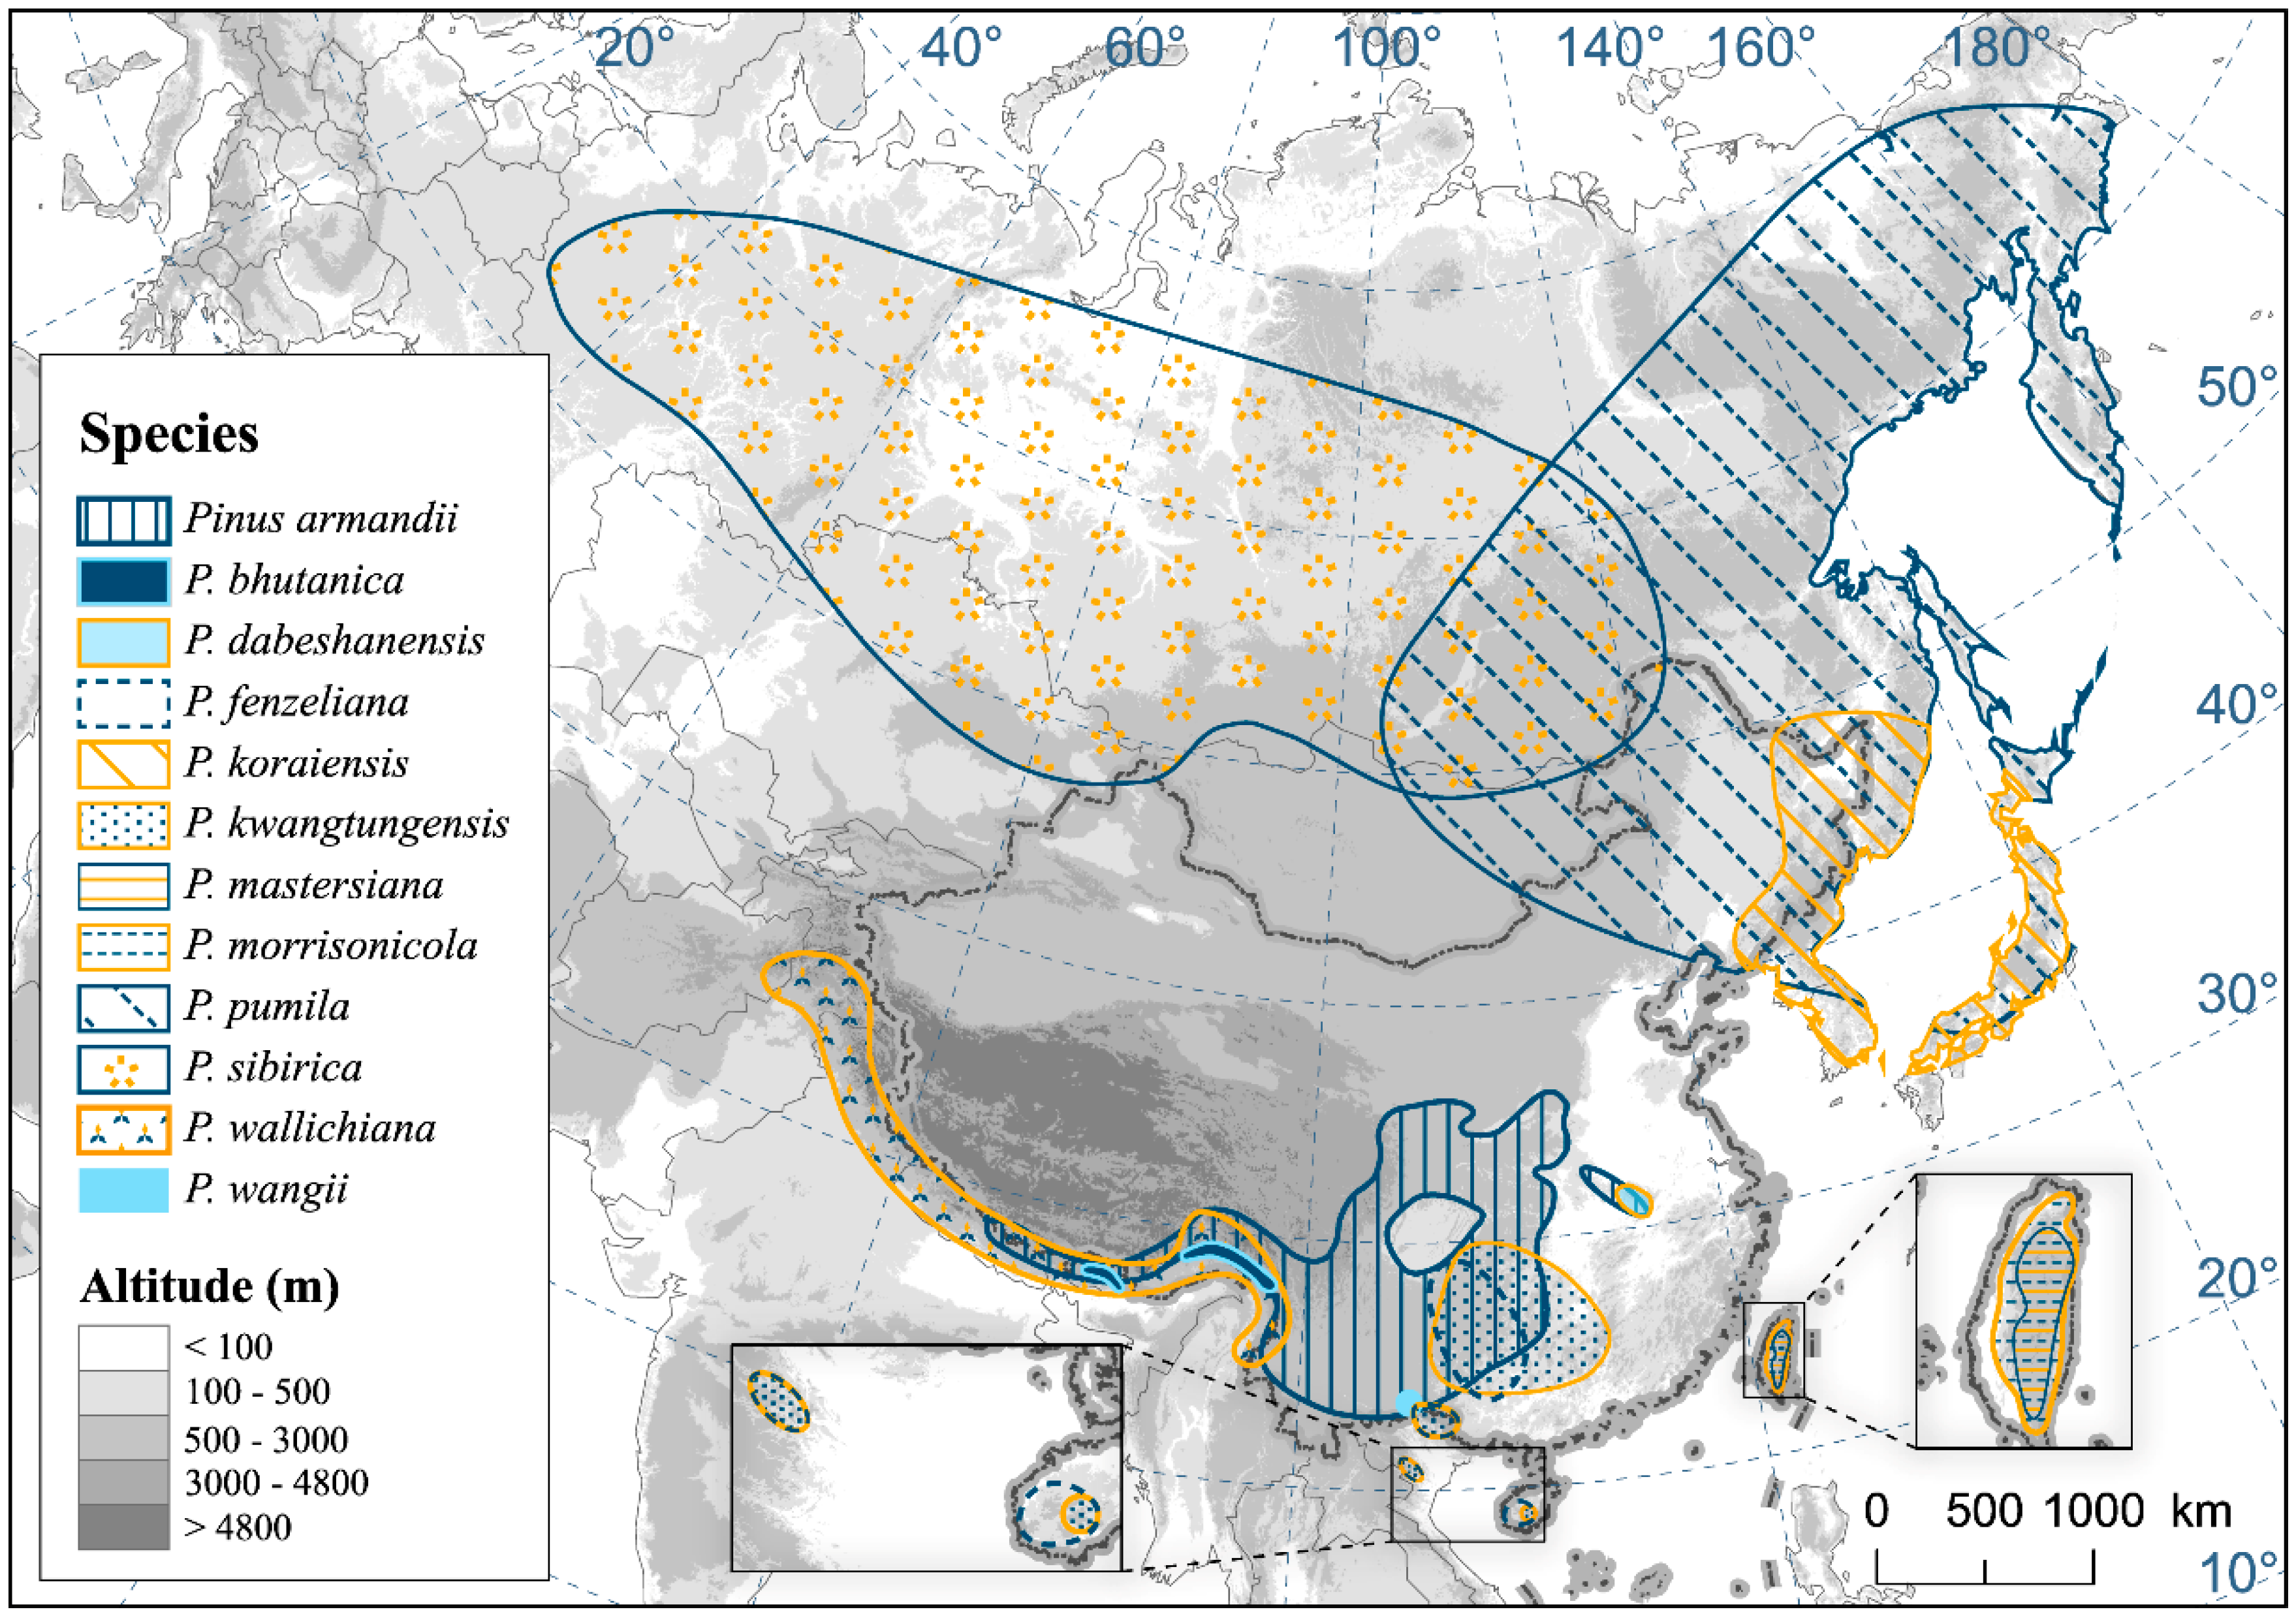
2.1. Study Species Field Survey and Occurrence Data

According to Flora of China [32], ten species of P. subsect. Strobus are naturally distributed in China. The authors treated P. dabeshanensis as a variety of P. fenzeliana, and treated P. mastersiana as a variety of P. armandii (with the acceptance of the treatment by Hayata) [64]. However, the distribution areas of both P. dabeshanensis and P. mastersiana are far from the distribution areas of P. fenzeliana and P. armandii, and additionally the former two taxa are genetically differentiated from P. fenzeliana and P. armandii [32,36]. Hence, we kept the species status of P. dabeshanensis and P. mastersiana and recognized 12 natural species of white pines in China.
From 2016 to 2018, we conducted extensive field surveys throughout the major distribution areas of these 12 species in mainland China and Taiwan Province. The geographical coordinates of the surveyed locations were recorded with an accuracy of 10 m. Additionally, online databases were consulted to obtain comprehensive occurrence data for the white pines, including the Chinese Virtual Herbarium database (CVH, http://www.cvh.ac.cn) and the Global Biodiversity Information Facility (GBIF, http://www.gbif.org). For CVH data, the specimens were checked, and misidentifications were corrected based on the taxonomic treatments mentioned above. When no exact geographical coordinates were recorded for a specimen, the longitude and latitude coordinates of the specimens were determined using Google Earth 7.0 (https://www.google.com/earth) [65,66]. We used the R package “dismo” [67] to retrieve the occurrence data from GBIF. The specimens were checked according to previous taxonomic studies to avoid the risk of misidentification [32,68,69]. For those species that are not endemic to China, entire natural distribution records were used for niche modeling. In order to avoid sampling bias [70], in the case of multiple occurrence sites, only one was retained in each 10 × 10 km square using the “spatially rarify occurrence data” tool in the SDM toolbox for the ArcGis software (Esri, Redlands, CA, USA) (http://www.sdmtoolbox.org) [71].
Finally, a total of 1459 records of the 12 white pine species were kept for analysis. Among them, there were only four distribution records for P. wangii, only 10 distribution records for P. dabeshanensis, and only 17 distribution records for P. bhutanica. For all of the other species, a much larger number of records were available (Table S2).

2.2. Environmental Variables

The distribution of white pines is profoundly influenced by environmental factors since their growth and reproduction requires specific combinations of climatic and geographic conditions. For example, P. koraiensis is a photophilous species which needs a cold moist climate and deep fertile soil, whereas P. pumila is shade-tolerant and can grow in shallow soil and P. fenzeliana usually grows in warm, wet mountainous areas with weakly acidic soil [31]. Therefore, we utilized 39 environmental variables for niche modeling, including temperature, precipitation, soil, ultraviolet radiation, terrain, and land cover. Nineteen widely used bioclimatic variables were accessed from the WorldClim online database (http://worldclim.org/data/worldclim21.html) [72]. Four climatic variables—namely wet days, ground frost frequency, water vapor, and cloud cover—were obtained from the IPCC data distribution center (http://ipcc-data.org/observ/clim/get_30yr_means.html). We obtained another three variables (growing degree days, soil pH, and soil organic carbon) from the Center for Sustainability and the Global Environment, Nelson Institute for Environmental Studies, University of Wisconsin-Madison (UW) (http://nelson.wisc.edu/sage/data-and-models/atlas/maps.php). Additionally, we downloaded six UVB variables from glUV, an online global UVB radiation dataset (https://www.ufz.de/gluv/index.php?en=32435) [73]. The other five geographic variables were derived from a dataset provided by the Food and Agriculture Organization of the United Nations (FAO) (http://www.fao.org/soils-portal/soil-survey/soil-maps-and-databases/harmonized-world-soil-database-v12/zh/) [74]. All of the 39 environmental variables are listed in Table S3.
Collinearity may exist among the environmental variables, which may exaggerate the importance of highly correlated variables and hence may lead to over-fitting of the simulation [75,76]. Therefore, we determined the Pearson correlation coefficients among the 39 variables using the “banding collection statistics” tool in ArcGis 10.7 [77] and conducted the Jackknife test using Maxent to evaluate the contributions of each variable. All of the 39 variables scored 0 contribution values for all of the 12 species, and the variables with less ecological importance in highly correlated (r ≥ 0.9) variable pairs were excluded [77]. Finally, 18 variables were used in the subsequent analysis (Table 1).

2.3. Assessment of Important Environmental Factors

Three methods were used to estimate the importance of the environmental variables, namely percentage contribution, permutation importance, and Jackknife of regularized training gain. The percentage contribution value was an average value derived from each of the 10 training replicates and depended on the specific path that the model selects to find the optimal solution [78]. The permutation importance value, which depends more on the model’s final performance instead of an individual path, was obtained by switching the variable values between occurrence and background spots and observing the change leading to the area under the curve (AUC) value [60]. The Jackknife test was conducted by creating a series of new models with exclusion or inclusion of a variable in turn to reveal the change in the information content of the model that is caused by each variable [78].

2.4. Paleoclimate and Future Climate Scenarios

Aside from the current scenario, three paleoclimatic scenarios were modeled: the last interglacial period (LIG, 120 to 140 ka), the LGM (22 ka), and the Middle Holocene (MH, 6 ka). These scenarios were modeled in the Community Climate System Model version 4 (CCSM4), which is an efficient climate model developed by the National Center for Atmosphere Research (Boulder, CO, USA) [79] and is widely used in studies on the response of species distribution to past and future climate changes [65,66,80].
We also used the CCSM4 model under two typical CO2 representative concentration pathways (RCPs), namely RCP2.6 and RCP8.5, which represent two future climate scenarios depending on different levels of greenhouse gas (GHG) emissions, with a projected average temperature increase of 1.0 °C and 3.7 °C respectively, in 2081–2100 relative to the situation in 1986–2005 [8]. Then, the future climate datasets were applied to four combined scenarios: RCP2.6-2050 (average for the period 2041–2060), RCP2.6-2070 (average for the period 2061–2080), RCP8.5-2050, and RCP8.5-2070. All of the paleoclimatic and future data were downloaded from the WorldClim online database.

2.5. Model Simulation and Model Performance Evaluation

We used Maxent 3.4.0 (http://www.cs.princeton.edu/~schapire/maxent/) to construct the ecological niche and predict the potential distribution of each species under the current climate, three paleoclimatic climate scenarios, and four future climate scenarios [81]. All of the environmental variables were converted into ASCII files with the same resolution (2.5′ × 2.5′, approximately 4.6 km × 4.6 km) in ArcGis 10.7 as required by the software. The model was parameterized with a maximum of 10,000 background points, a convergence threshold of 0.00001, and a maximum of 500 interactions. To optimize the model, we ran 10 bootstrap replicates, in which 75% of the presence data was randomly selected for model training and the other 25% was used for model testing. During the modeling, response curves were generated for each individual variable in order to demonstrate how the occurrence probability was influenced by their variations [48,65,66,70].
Additionally, two assessment indicators were adopted to measure the accuracy of the SDM, namely the AUC of the ROC [82] and the TSS [83]. ROC curves were generated by plotting sensitivity (true positive rate) against false positive rate. The AUC is one of the most widely used threshold-independent accuracy measures for SDM [84,85,86]. TSS is defined as the sum of sensitivity and specificity (true negative rate) minus 1, with a range of –1 to 1. As TSS is a threshold-dependent index used for binary prediction data, the continuous predictions from the Maxent model were transformed into binary ones by setting the threshold with the maxTSS method [87,88]. It is usually regarded that AUC values of 0.5–0.7 are an indicator of poor performance, values of 0.7–0.9 are an indicator of medium performance, and values of 0.9–1.0 are an indicator of good performance [89]; meanwhile, it is usually considered that TSS values from 0.7–0.85 indicate good performance and values of 0.85–1.0 indicate excellent performance [90].

2.6. Potential Distribution Areas Classifying, Suitable Habitat Changes in Different Scenarios

The output maps of Maxent were ASCII grid maps with the value of occurrence probability (ranging from 0 to 1) of the species for each grid cell (2.5′ × 2.5′). According to occurrence probabilities, the simulated potential distribution areas were categorized into four classes of suitability: not suitable (<0.2), low suitability (0.2–0.4), medium suitability (0.4–0.6), and high suitability (>0.6); areas ranked in the latter three classes were considered as suitable habitats [11,66,91]. The suitable areas for each species within China were calculated. A map of China (1:4,000,000) showing the administrative regions was downloaded from the Resource and Environment Data Cloud Platform (http://www.resdc.cn/Default.aspx) provided by the Institute of Geographic Sciences and Natural Resources Research, Chinese Academy of Sciences, and spatial data for other countries were obtained from the GADM online database (https://www.gadm.org/).
Distribution changes for the past and the future climate scenarios were analyzed by calculating the interactions and complements between the distribution areas of each period and the current scenario. In order to examine how the suitable habitats change altitudinally and latitudinally in response to climate changes under the multiple scenarios in detail, we extracted the center point of each grid cell in the suitable areas (in Asia) of each species with ArcGis 10.7 and plotted the elevation and latitude of each point in a scatter diagram [47,92].
To understand how the suitability of the current actual distribution sites (presence spots) of each species in China change in the future scenarios, we extracted the probability values of the grid cells where the current presence points were located and calculated the proportions of points with the four different suitability ranks (not suitable, and low, medium, and high suitability) under the current climate and the four future scenarios. The proportion was calculated using the following equation:
P i = N i S × 100 %
where Ni is the number of presence points within China with a certain suitability rank, and S denotes the total number of actual presence points within China of each species.
We estimated the species’ distribution centroid of each scenario using the “spatial statistics” toolbox in ArcGis 10.7 by calculating the occurrence probability-weighted Euclidean distances among potential occurrence grids [52,93].

3. Results

3.1. Model Accuracy and Key Environmental Variables

The mean AUC and TSS values of the 12 white pine species for the current scenario were all above 0.9 and above 0.7, respectively (Table 2), indicating that the models had a high level of accuracy and validity.
The percentage contribution, permutation importance, and Jackknife of the regularized training gain results are shown in Table 3. According to the response curves of the environmental variables (Figure S1), we obtained the range (occurrence probability > 0.2) of each variable for the 12 species (Table S4). The top four most contributing variables and permutation importance values of each species cumulatively account for more than 70% of the total contributions, except for P. wangii. Our results demonstrated that the precipitation in the warmest quarter (Bio18) is a dominant factor for all the tested species except P. wallichiana and P. sibirica. According to response curves of Bio18 (Figure S1), the two Taiwanese species are the most moist adaptive (with suitable rainfall of over 800 mm in wettest season, Table S4); P. fenzeliana, P. kwangtungensis, P. armandii, P. koraiensis, and P. pumila can all grow under a wide range of rainfall levels; however, the first two species cannot endure rainfall of under 500 mm in the rainy season. The other three precipitation variables (Bio12, Bio13, and Bio16) were also found to be important for many species, such as P. bhutanica, P. dabeshanensis, P. fenzeliana, P. kwangtungensis, P. mastersiana, P. morrisonicola, and P. pumila (Table 3). The temperature variables (temperature seasonality [Bio4], mean diurnal range [Bio2], isothermality [Bio3], minimum temperature of the coldest month [Bio6], mean temperature of the driest quarter [Bio9]) are also important for many white pine species. Among them, temperature seasonality was found to be important for all species except P. bhutanica and P. dabeshanensis. Two UVB factors (UVB1 and UVB3) contributed a large amount for the two Himalayan species (P. wallichiana and P. bhutanica), two northern species (P. koraiensis and P. pumila), and the endemic P. armandii and P. dabeshanensis.

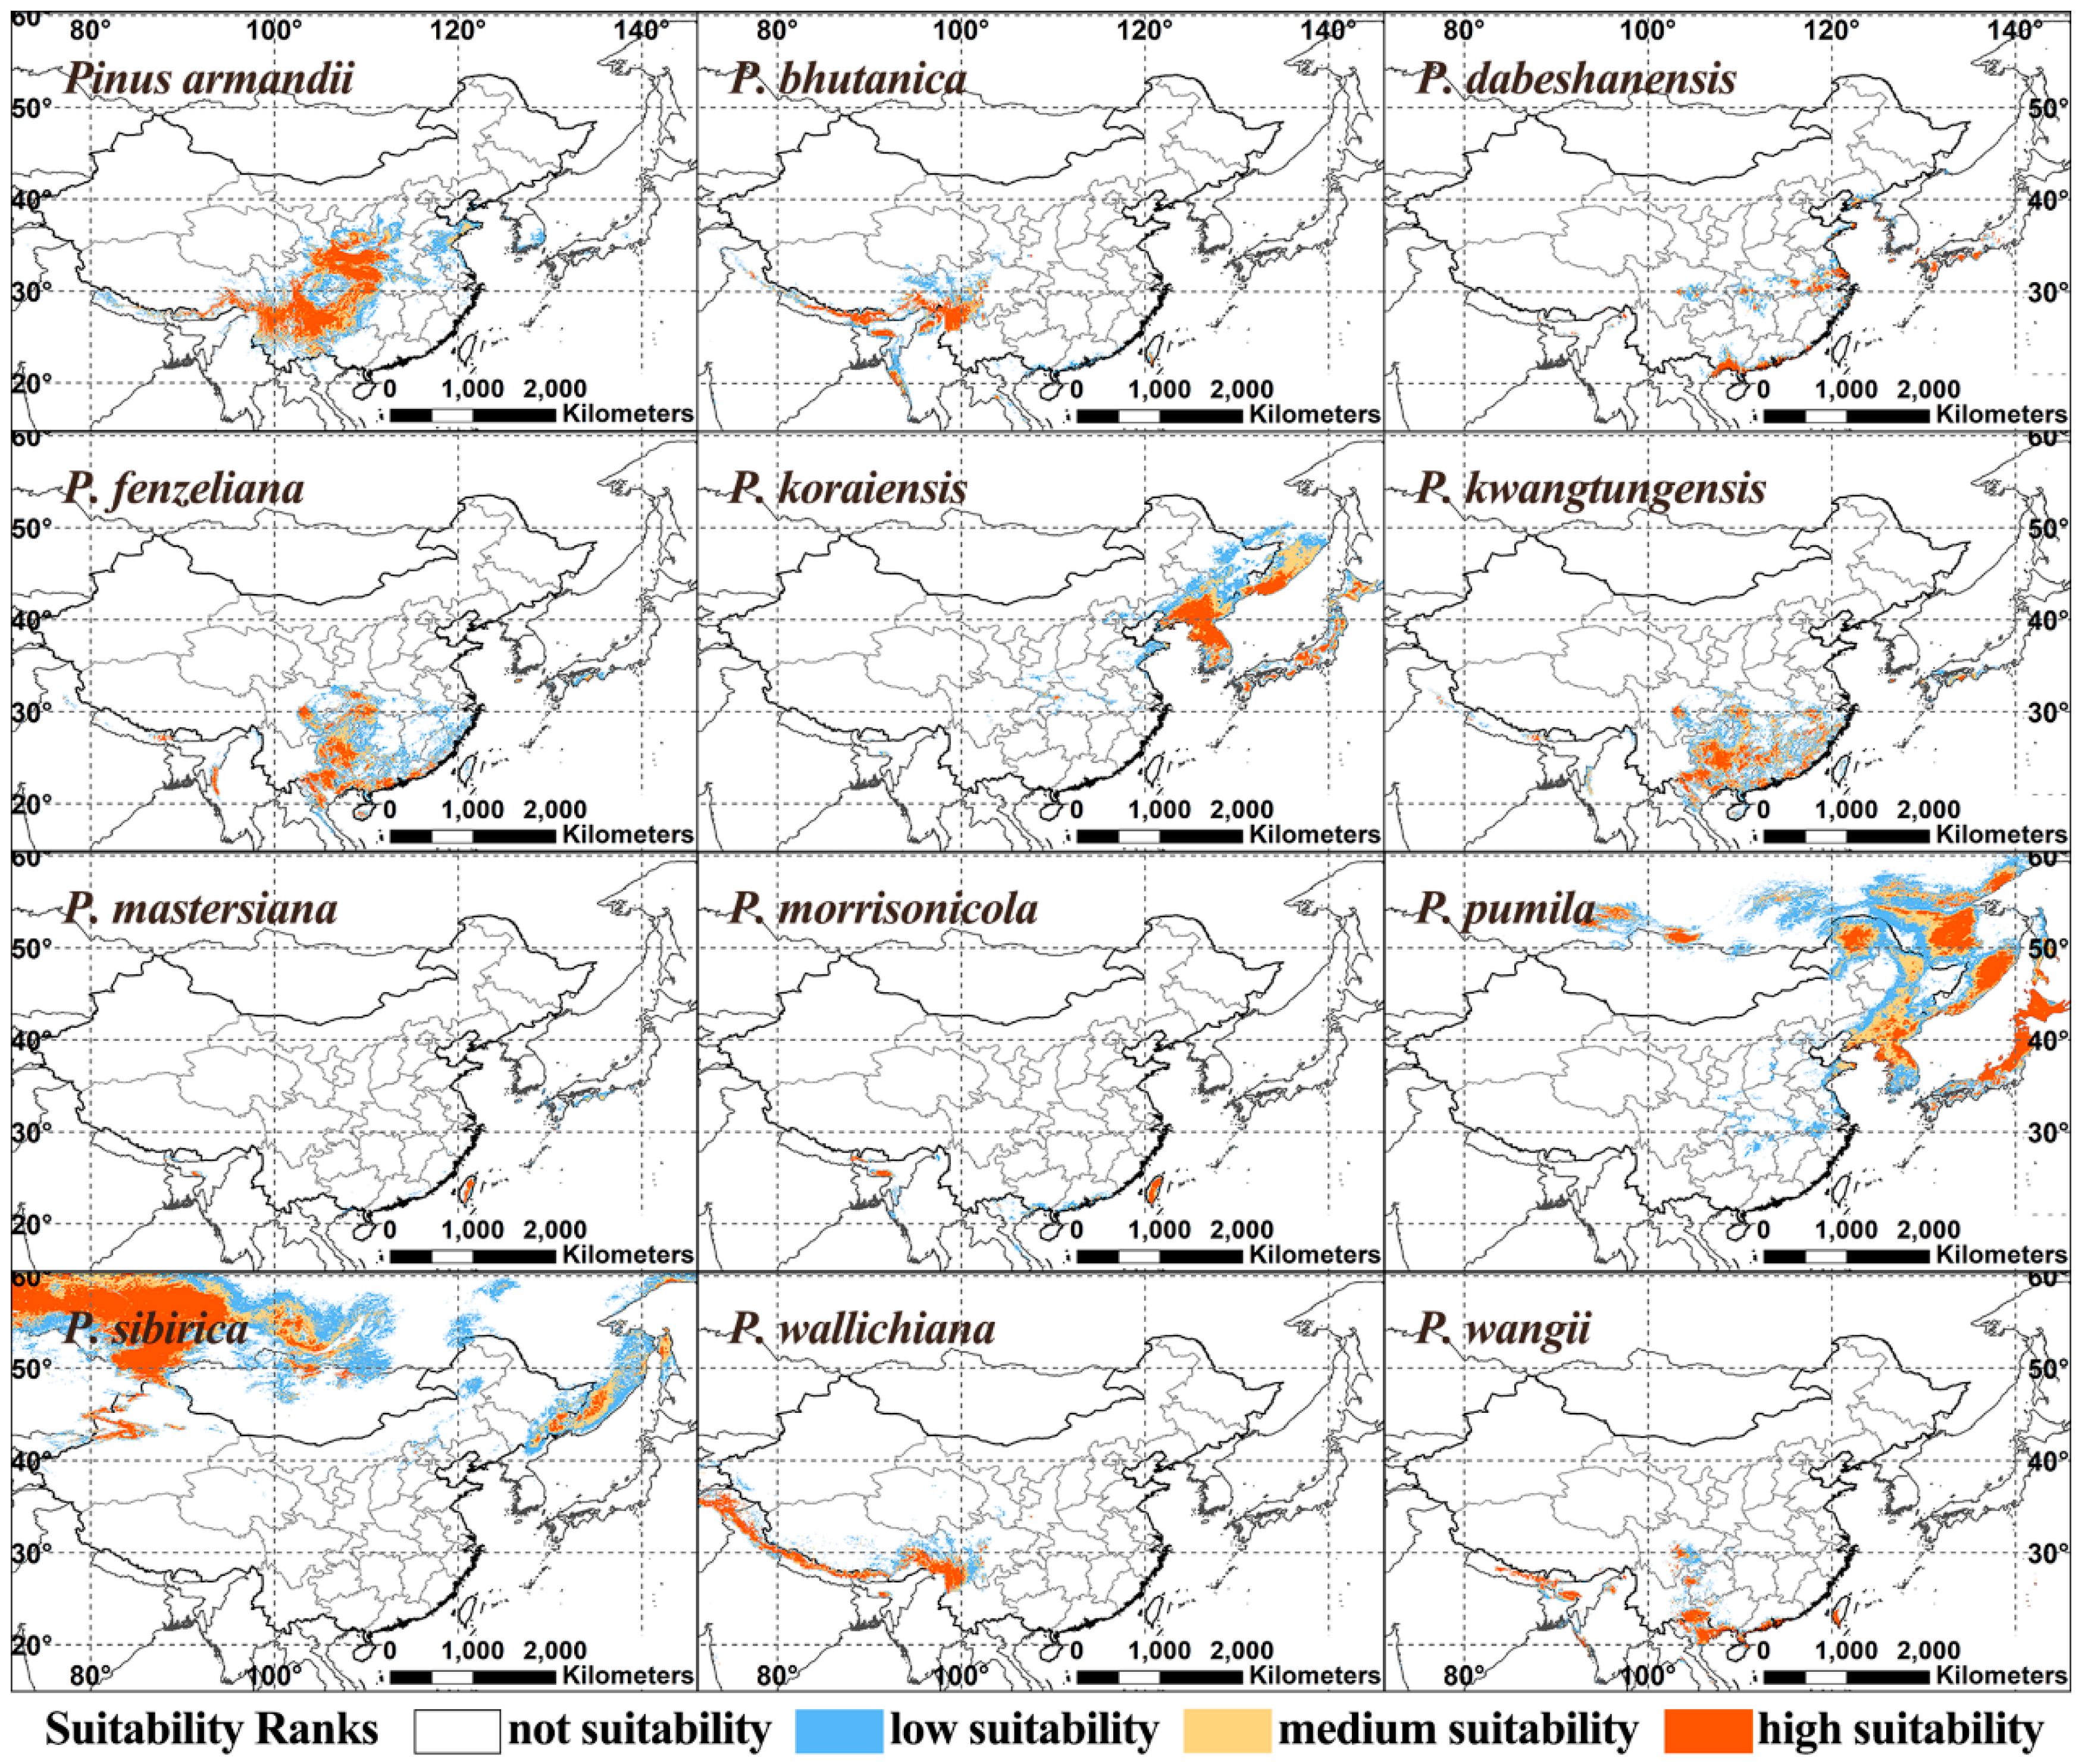
3.2. Suitable Habitats in Current Condition

The area of suitable habitats (high, medium, and low suitability) within China of the 12 species under the current climate, three paleoclimatic climate scenarios, and four future climate scenarios are shown in Table 4, Figure 2, Table S5 and Figure S2. For each species, the predicted suitable habitat was generally larger than the actual distribution range. Of the three northern white pines, P. sibirica is predicted to occupy the widest suitable habitat in the Eurasian continent, mainly in Russia (approximately 50°~60° N, 40°~110° E), with only small marginal areas extending into China (the Altai Mountains and Tianshan Mountains in Xinjiang, and the eastern margin of Northeast China). The suitable habitat of P. koraiensis spreads from the Changbai Mountains of Northeast China to the Korean Peninsula, far-eastern Russia, and Japan. The suitable habitat of P. pumila is similar to that of P. koraiensis, but extends further north to the Greater Khingan Mountains, the Lesser Khingan Mountains, and the Kamchatka Peninsula. The largest predicted suitable habitat (1,419,288 km2) of the 12 species was obtained for the most widely distributed endemic species, P. armandii, which was predicted to cover a vast area of China, including the Qinling-Daba Mountains, the Yungui Plateau, and the Hengduan Mountains to the eastern Himalaya (Table 4). The suitable habitats of the two endangered species, P. dabeshanensis and P. wangii, are relatively limited and fragmented in China. Those of P. dabeshanensis are scattered either along the Yangtze River or in coastal areas of South and Southeast China. For P. wangii, the suitable areas occur in small patches in southwestern and southern mainland China and Southwestern Taiwan. For these two species, the predicted suitable areas are much larger than their actual distribution areas.
Compared to the other 10 species, P. fenzeliana and P. kwangtungensis have wider and more continuous suitable habitats in vast areas south of the Qinling Mountains. The predicted suitable habitats of these two species are highly similar, except that there is less suitable habitat for P. fenzeliana in Hunan and Jiangxi Provinces. The two Himalayan species, P. wallichiana and P. bhutanica, also have similar suitable habitats in China; their suitable habitats mainly occur in the Hengduan Mountains and along the Himalayas. The suitable areas of the two Taiwanese species, P. mastersiana and P. morrisonicola, are also similar and mainly occur in the Central Mountain Range of Taiwan with a small area along the coast of South China and Northeast India. However, the suitable area of P. mastersiana is smaller than that of P. morrisonicola.

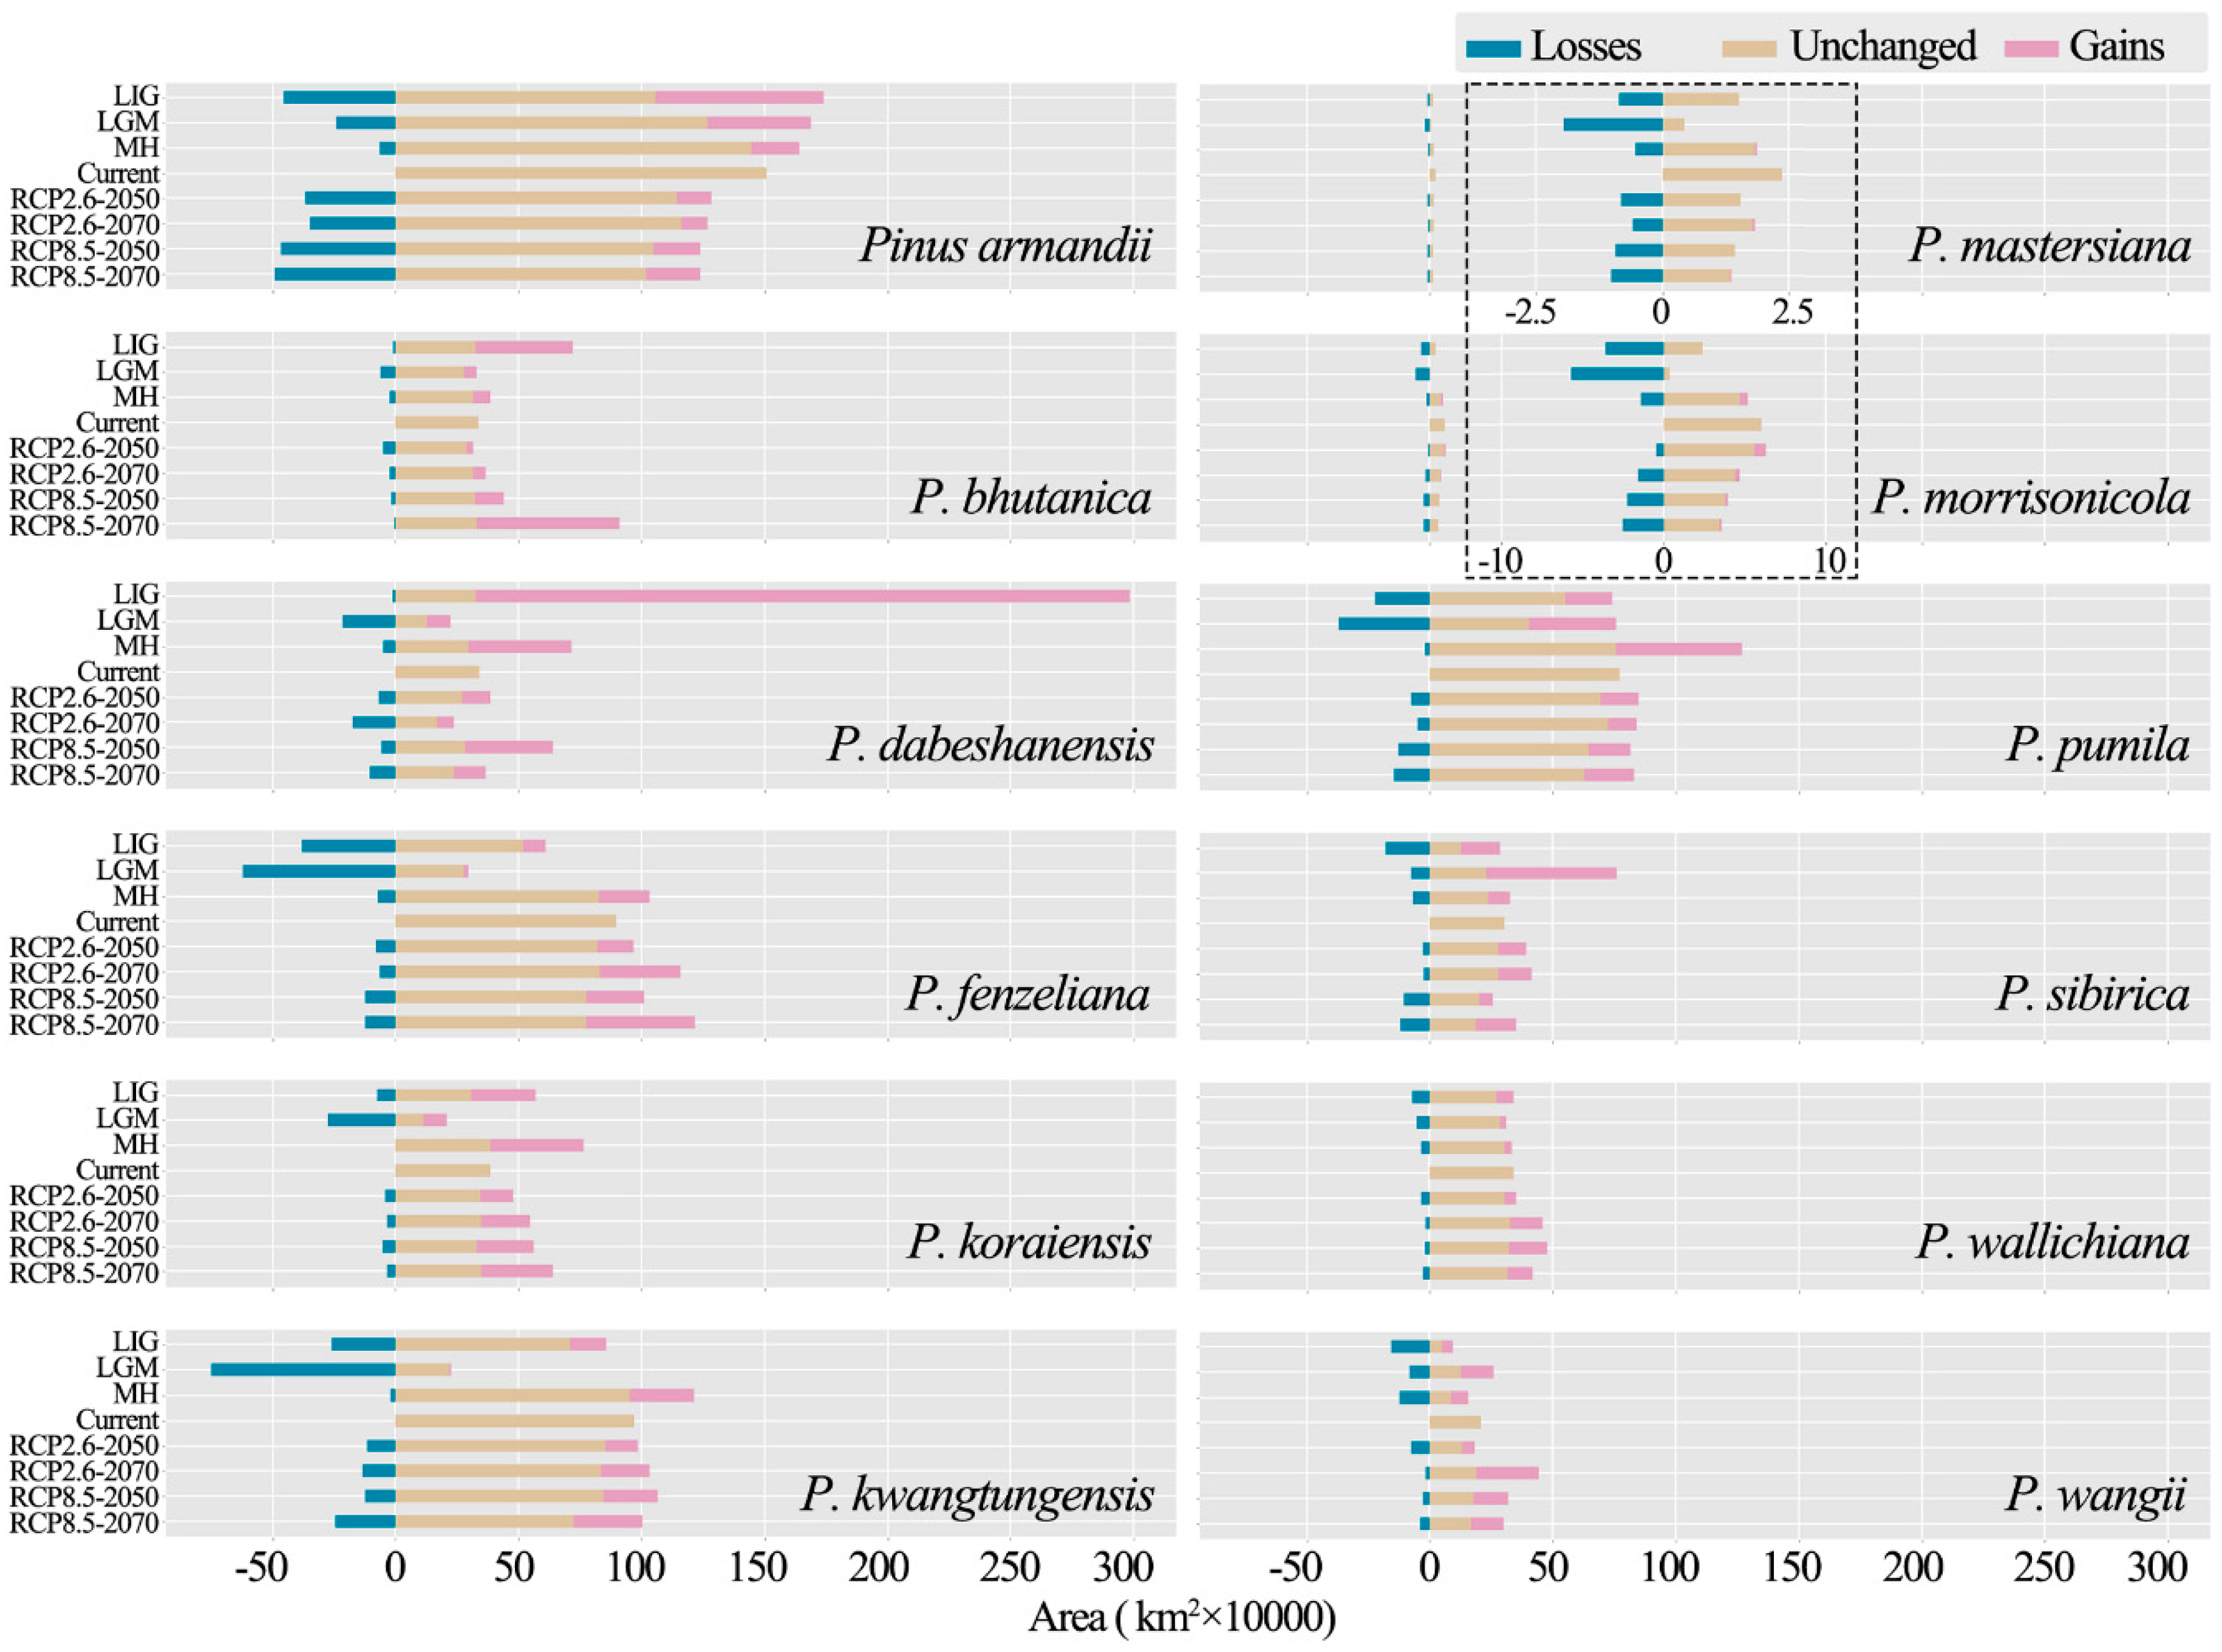
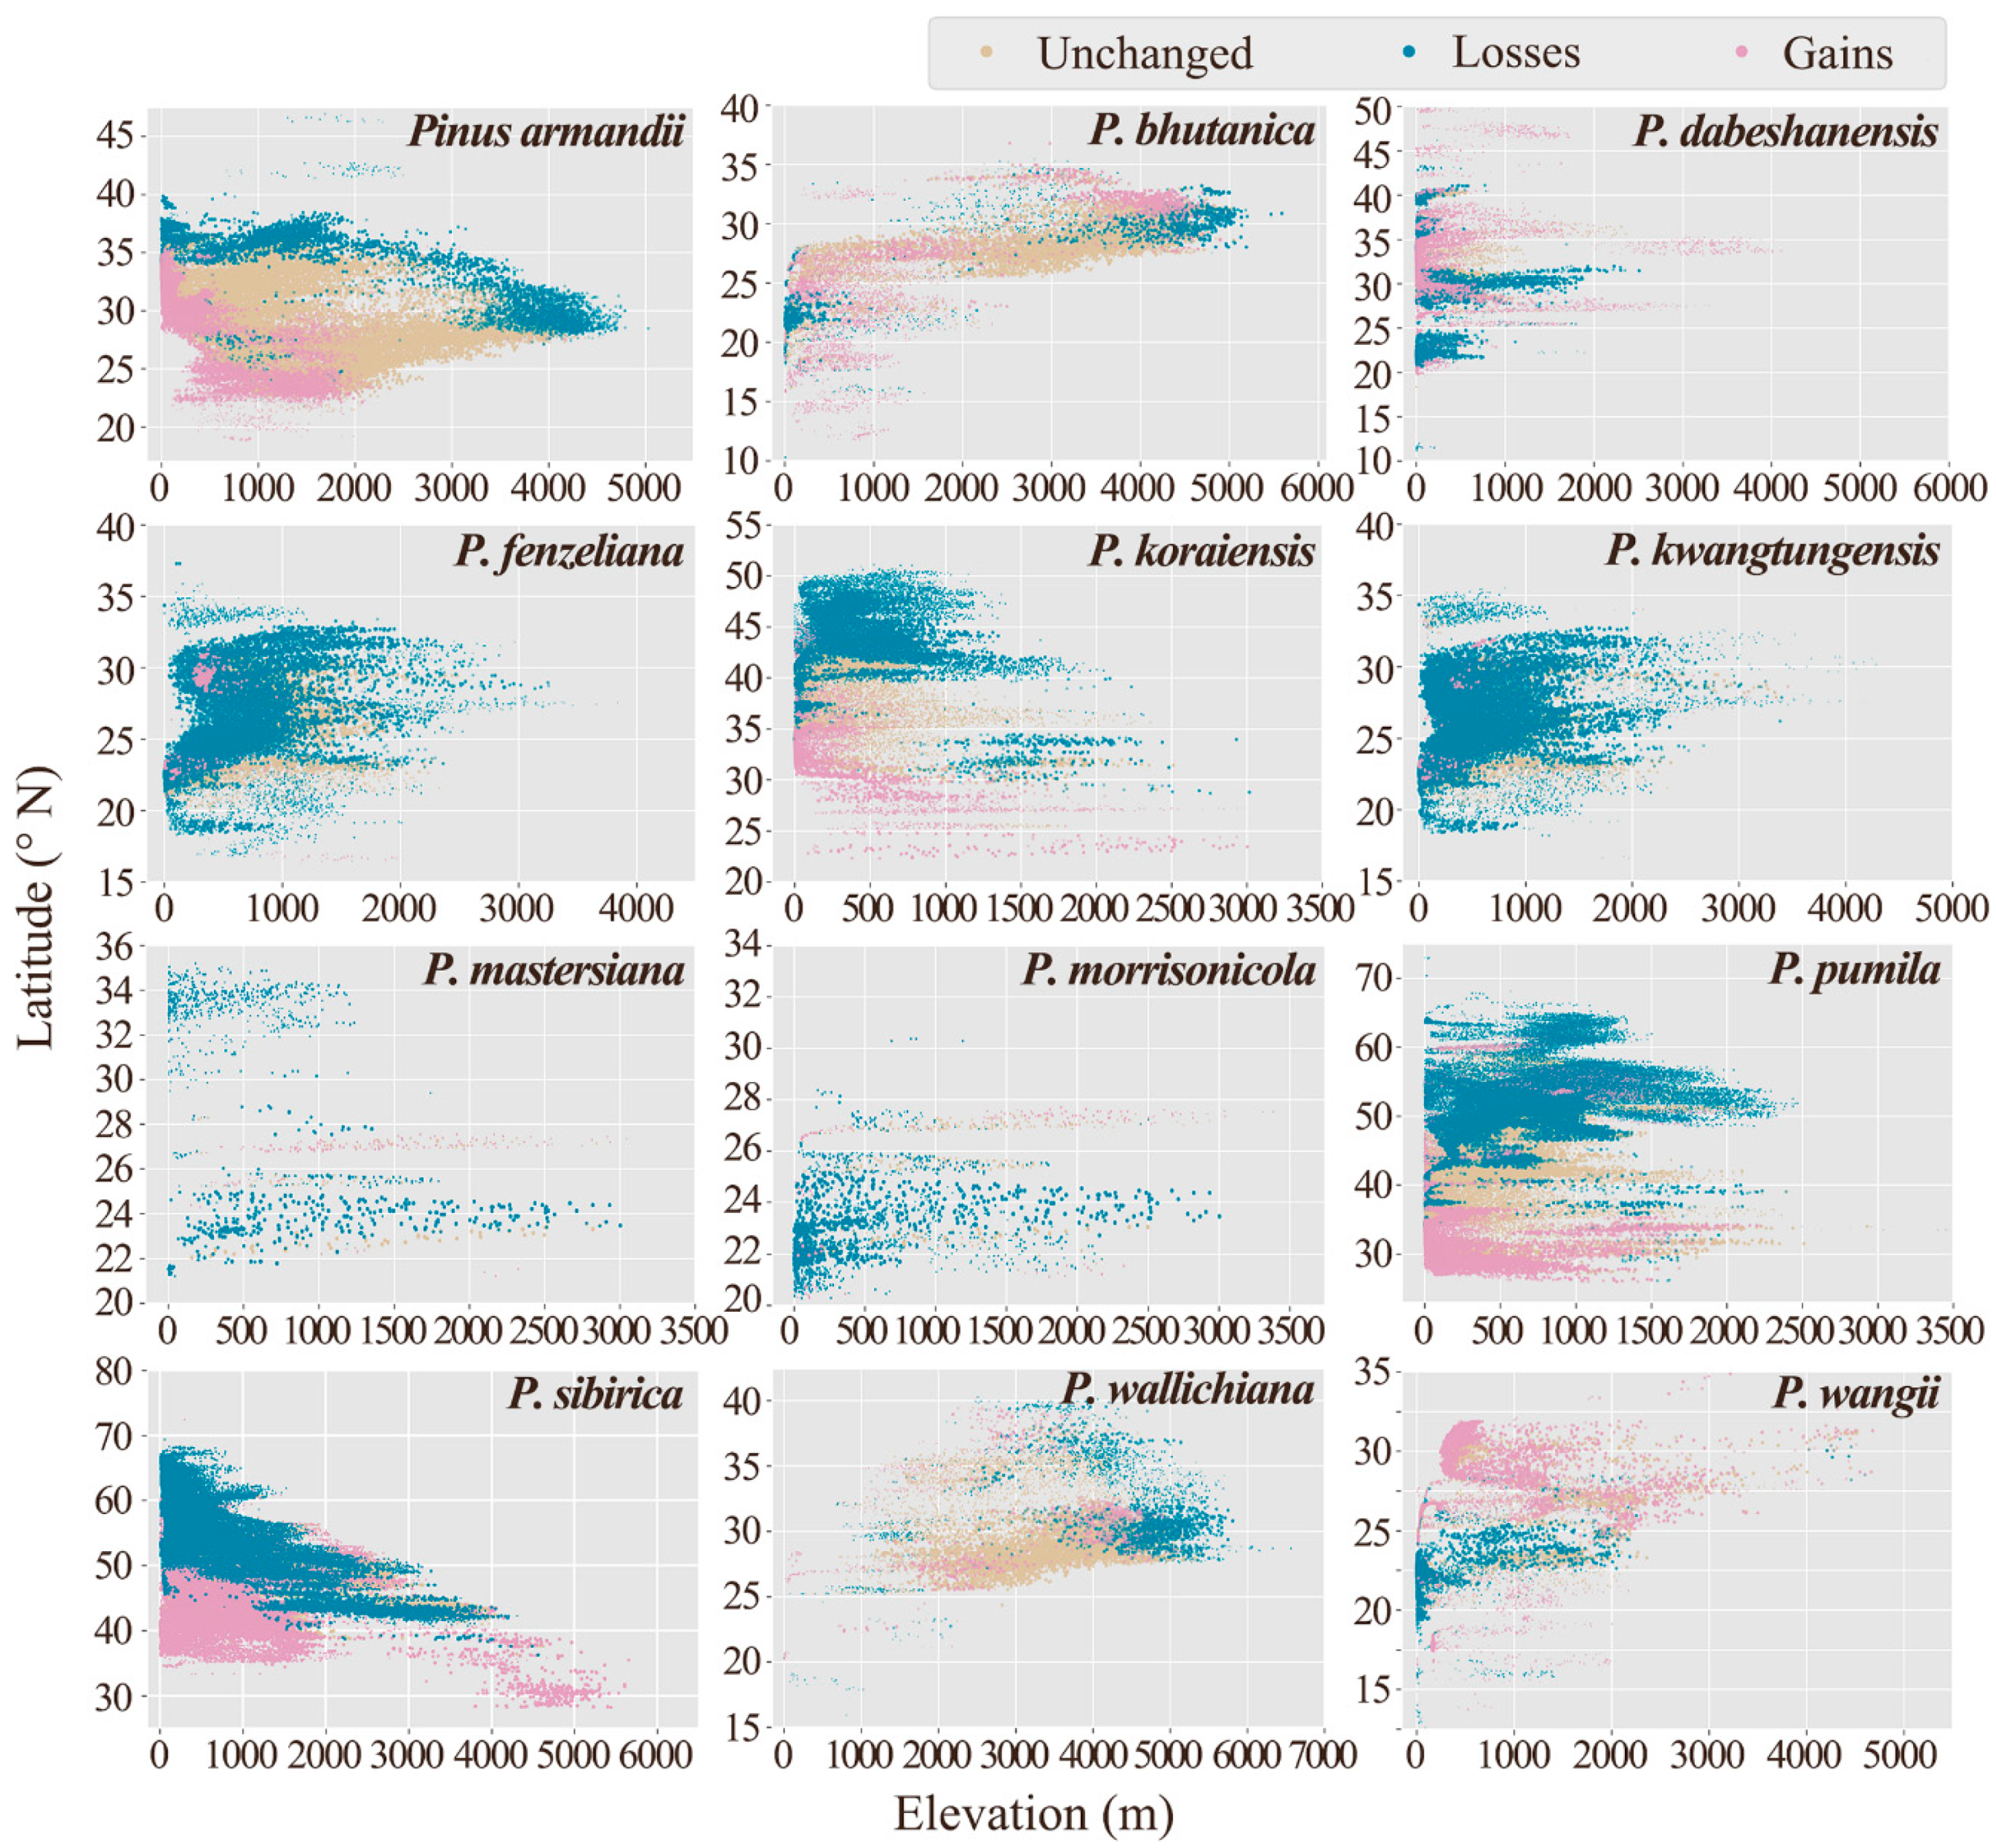
3.3. Distribution Shifts in Different Climate Scenarios

Predicted changes in suitable habitat for different scenarios are presented in Figure 3 and Table 4, Figures S3–S9 and Tables S5 and S6. The suitable area of each species underwent great change during the LIG and LGM periods. In the LIG period, compared to the current scenario, the suitable habitats in China of P. dabeshanensis, P. bhutanica, and P. koraiensis significantly expanded, whereas the two Taiwanese species and P. wangii lost much of their suitable habitat (Figure 3, Table 4). Additionally, the results showed that most of the white pine species experienced great changes in their suitable habitat area during the last glacial maximum. In this period, the suitable areas of seven species contracted notably (the two Taiwanese species as well as P. bhutanica, P. dabeshanensis, P. fenzeliana, P. koraiensis, and P. kwangtungensis). On the contrary, the suitable area of P. sibirica increased in China during the LGM (Figure 3). A large range expansion was predicted during the MH for the two Taiwanese species, P. dabeshanensis, P. pumila, P. fenzeliana, P. koraiensis, and P. kwangtungensis. For the future scenarios, the suitable areas of the two Taiwanese species and P. armandii were predicted to decrease. Meanwhile, the suitable areas of the nine other species were predicted to increase in most of the scenarios except P. sibirica and P. wangii for RCP2.6-2050, P. dabeshanensis for RCP2.6-2070, and P. sibirica for RCP8.5-2050. (Figure 3, Table 4).
The shifts in the distribution of the suitable habitats were further simulated by calculating the centroids of each suitable habitat for different climate scenarios (Table S7, Figure S10) as well as the altitude and latitude change of the suitable habitats in each grid cell under climate changes (Figure 4 and Figure 5, and Figures S11–S15). The suitable habitats of the three northern species displayed obvious changes in latitude during the last interglacial/glacial periods. In the LIG scenario, the suitable habitats of P. sibirica, P. koraiensis, and P. pumila expanded to higher latitudes compared to the current condition. Their habitats also tended to spread to lower latitudes at higher elevations (Figure S11). In the LGM, at higher latitudes, the habitats of the three northern species contracted (Figure 4). Meanwhile, in the MH, at higher latitudes, the habitats of these three species expanded compared to the LGM scenario. (Figure S12).
During the last interglacial/glacial periods, two southern species, namely P. fenzeliana and P. kwangtungensis, showed similar habitat changes to the northern species in response to climate change. In the LIG, these two species were mainly distributed between 18–30° N (Figure S11). Meanwhile, in the LGM, the suitable habitats of these two species were greatly reduced (Figure 4). Subsequently, during the MH, their suitable habitats expanded greatly at latitudes of 18–34° N (Figure S12). The suitable habitat of the Himalayan species P. bhutanica showed altitudinal shifts during the last glacial period. In the LIG, the suitable habitat of P. bhutanica extended to elevations of up to 5600 m, while in the LGM, the suitable habitat retreated to lower elevations. The elevation of the suitable habitat did not increase in the MH (Figures S11 and S12). The other Himalayan species, P. wallichiana, did not show clear altitudinal and latitudinal habitat shifts during the last glacial period. In the LGM, the suitable habitat of P. wallichiana covered a much narrower range of both altitude and latitude compared to the LIG and MH. Similar results were obtained for the two Taiwanese species and the endangered P. dabeshanensis. An interesting result was obtained for the endangered species, P. wangii, whose habitat was predicted to expand to higher latitudes and higher elevations during the LGM relative to the LIG (Figure 4). The predicted habitat change of the most widely distributed endemic species, P. armandii, was unique in that its suitable habitat was predicted to keep moving northward after the LIG, even in the LGM.
In the four future climate scenarios, the predicted habitat changes of the 12 species were largely similar. For three of the 12 Chinese white pine species, namely P. armandii, P. mastersiana, and P. morrisonicola, the suitable habitat was predicted to reduce in all the future scenarios except P. morrisonicola for RCP2.6-2050, whereas the suitable habitats of the nine other species were predicted to expand (Table 4).
In all the future scenarios, suitable habitats of P. armandii were predicted to spread to the north and to higher elevations (Figure 5 and Figures S13–S15). This was also the case for the two Himalayan species P. bhutanica and P. wallichiana, as well as a northern species P. pumila and the endangered P. wangii. On the other hand, in all of the future scenarios, P. koraiensis, P. fenzeliana and P. kwangtungensis were predicted to spread to higher latitudes but not to higher elevations (Figure 5 and Figures S13–S15).
In all of the future scenarios, the suitable habitat of P. mastersiana was predicted to reduce to a very narrow latitudinal range (Figure 5 and Figures S13–S15). Meanwhile, for the other Taiwanese species, P. morrisonicola, the suitable habitat was predicted to move to the north in the RCP2.6-2050, RCP2.6-2070, and RCP8.5-2050 scenarios; however, in the RCP8.5-2070 scenario, the range was predicted to reduce to a very narrow latitude range, similar to P. mastersiana. Pinus sibirica was also predicted to have obvious range shifts in all of the future scenarios: at low latitudes, its suitable habitat was predicted to move to higher elevations, while in suitable habitats at low elevation, it was predicted to move to higher latitudes (Figure 5). For the vulnerable species, P. dabeshanensis, no change in its suitable habitat (either altitudinally or latitudinally) was predicted in any of the future scenarios.
In this study, we also checked the suitability change of the present distribution sites in the future scenarios to predict the potential risk to each species. The proportions of presence points with the four different suitability ranks under the current and the four future scenarios are shown in Table 5. There are six species whose proportion of not suitable presence points was predicted to increase in the future, namely P. armandii, P. kwangtungensis, P. mastersiana, P. morrisonicola, P. sibirica, and P. wallichiana. This proportion was predicted to decrease in only one species, P. koraiensis, for which all of the actual sites were predicted to become suitable in all four of the future scenarios.

4. Discussion

This study predicted the habitat suitability of the 12 Chinese white pine species in the current climate and under paleoclimatic climate scenarios and future climate scenarios using Maxent. The AUC and TSS values produced by the models adequately described the distribution patterns of the 12 species. The results showed high precision, indicating that our modeling was reliable and accurate for the prediction of the suitable habitats of the white pine species. This study revealed dynamic range shifts of the Chinese white pine species under climate changes, which may be useful for conservation strategies.
The predicted current suitable habitat was basically consistent with, albeit wider than, the actual distribution of each species in China (Figure 2). This indicates that there may be more areas in potentially suitable habitats for the ex situ conservation of these species. However, small and discontinuous suitable habitats (such as for P. sibirica and P. dabeshanensis) may be one of the key factors for the endangered situation of these species [94,95]. For example, although the endangered species, P. dabeshanensis and P. wangii, have a suitable habitat outside of their actual distribution areas, these suitable habitats are still very narrow and dispersed. This is also the case for the two Taiwanese species, which have some small patches of suitable area outside of Taiwan Island. Although the three northern species have large suitable habitats, the majority of this habitat is in countries neighboring China. Of the 12 Chinese white pine species, only three (P. armandii, P. fenzeliana, and P. kwangtungensis) were predicted to have relatively large and continuous habitats in China.
The adaption of species to different environmental variables is a determinant factor for their distribution patterns [96]. The 12 species of Chinese white pine respond to environmental variables in different ways (Table S4), reflecting their differentiation in the ecological niche. According to the contribution indexes obtained from Maxent modeling and the Jackknife test, it was found that the precipitation of the warmest quarter (Bio18) and temperature seasonality are the factors that contribute the most to the species distribution. The importance of Bio18 indicates that most of the Chinese species are adapted to the East Asian monsoon climate with warm and moist summers [97,98]. Previous studies have suggested that Bio18 may be the most important factor for the growth or biomass accumulation of the Chinese white pines [99,100].
The four important temperature variables (Bio2, Bio4, Bio6, and Bio9) highlighted the contribution of minimum temperature and temperature variations on the distribution of the Chinese white pines, probably due to the fact that, in China, the summer is commonly warm and the minimum temperature and temperature variation in winter differ greatly with latitude [97]. Temperature seasonality generally increases with increasing latitude [101], and strong seasonal variation of temperature may inhibit vegetative growth [102]. As a result, temperature seasonality may determine the upper latitude limit for the distribution of each species. Bio6 may determine whether the temperature meets the need of vernalization for the northern species such as P. sibirica [103] and whether the pines from low-latitude areas can survive the harsh weather during the winter [104]. The response curves (Figure S1) of these temperature variables show that, compared with the northern species, the two southern species (P. fenzeliana and P. kwangtungensis) and the two Taiwanese species are more adapted to moisture and high temperature and prefer stable thermal conditions with low diurnal and seasonal temperature fluctuations (Table S4, Figure S1).
Another dominant factor affecting the distribution of Chinese white pines is UVB radiation, which is a damaging wavelength of radiation that can cause problems to plants such as DNA damage and growth rate reduction [105]. Plants’ responses to UVB radiation vary with species [106], and some alpine plants exhibit adaption to the long-term enhanced UVB radiation at high elevation [107]. In this study, the UVB radiation levels that the two Himalayan species (P. bhutanica and P. wallichiana) can tolerate were found to be remarkably higher than those of the other studied species (Figure S1). This may be an adaptation to the strong UV radiation in the alpine habitat of the Himalayas and the Hengduan Mountains [108].
Climate changes exert a significant influence on the geographical distribution of organisms, and consequently, the distribution patterns of species can reflect climatic conditions [14,109,110]. Global climate has fluctuated greatly since the Late Pleistocene, especially the last glacial-interglacial cycle, which has deeply influenced the current distribution of most living organisms [13,14,19]. During the glacial periods, the global temperature was 5–12 °C lower than today, and the environment of East Asia became much drier due to the weakness of the Asian summer monsoon [17]. Under these conditions, forest biomes in the Northern Hemisphere migrated southward and the distribution of many temperate species contracted remarkably [14,17].
The results of this study suggest that the distribution areas of most of the Chinese white pine species underwent evident fluctuations between the LIG and the present. According to our results, the suitable habitat of the northern species (P. sibirica, P. pumila, and P. koraiensis) fluctuated in response to glacier movement since the LIG (Figure 4 and Figure 5, Figures S11 and S12). During the LGM, the polar ice sheets spread considerably [14]. Probably forced by this spread, the distribution of the boreal species P. sibirica contracted to a large degree in Northern Eurasia and retreated to lower-latitude regions in Europe (not shown in this study), Northeast China, the Korean Peninsula, and Japan (Figure S4). As the last glaciers receded, its habitat expanded to the north, which may have affected the current distribution pattern in China; namely, a few limited populations in the Altai Mountains and the northern Greater Khingan Mountains (Figure 1). A similar scenario occurred for the other two northern white pine species, indicating that the last glacial period greatly affected the current distribution of white pine species in Northeastern Asia [58].
The four species that are most adapted to warm and moist conditions—namely P. mastersiana, P. morrisonicola, P. fenzeliana, and P. kwangtungensis—lost a tremendous amount of habitat during the LGM, when the habitat area decreased to less than half of that during the LIG (Table 4). Although the direct impact of the last interglacial/glacial period was smaller in South China [111], the habitats of the above four species also greatly reduced in this region during this period, indicating that they were vulnerable to the cool and dry climate [50,63]. Pinus fenzeliana and P. kwangtungensis inhabit extremely narrow and fragmented habitats in the mountainous areas of South China, which are characterized by high biodiversity and abundant endemic plant species and are considered to be typical refugia during glacial-interglacial cycles [112,113]. Notably, in the present study, the coastal areas of Southeast China were estimated to be suitable habitats for the above two species. This is supported by evidence from pollen fossils, which indicates that many upland conifer species of South China, including Pinus species, were common in coastal areas in South China during the LGM [114]. These regions are still predicted to be suitable for the two southern white pine species for the current condition; however, no actual distribution is recorded there. This indicates that the distribution of these species in the coastal regions of South China may have been inhibited before the glacial period and contracted during the LGM but that the two species failed to recover in these regions after glacial retreat. Mountains in Guangxi Province and the Nanling Mountains may be refugia for P. kwangtungensis, and these regions have been found to be genetic diversity hotspots of this species via mitochondrial DNA analysis [38]. The LGM climate and the species’ response to this climate, especially the resulting refugia pattern, may have been an important cause of the current highly narrow and disjunctive distribution of the species.
Except for the abovementioned species, the climate of the LGM influenced the Chinese white pines in different ways. The suitable habitat of one Himalayan species, P. bhutanica, showed altitudinal shifts during the climate fluctuation of the last glacial period, whereas that of the other Himalayan species, P. wallichiana, narrowed both in altitude and in latitude (Figure 4, Figures S11 and S12). In the LIG, the vulnerable P. dabeshanensis had a large suitable habitat in China; however, this habitat shrank strikingly to a very limited area in the LGM. On the other hand, in the LIG, the endangered P. wangii had a very small habitat and then expanded its range in the LGM, although this expanded area was still limited. This result implies that these two species had different endangerment mechanisms. For P. dabeshanensis, the last glacial maximum may be the main determining factor for its current endangerment. A recent population genetic study showed that populations of P. dabeshanensis underwent a reduction about 10,000 years ago [43]. Whereas, for P. wangii, its current endangerment may have been influenced by factors which occurred prior to the LIG. Pinus armandii showed a significantly different response to climate changes since the LIG compared to other species. Between the LIG and the present time, its suitable habitat was relatively stable but continuously reduced. On the whole, its habitat continued to move northward even during the LGM and reached the Qinling Mountains at this time. Its suitable habitat expanded to the Loess Plateau during and after the LGM. This result is also supported by pollen fossil records [115]. The different response pattern of P. armandii may be due to the fact that this species occupied different ecological niches and adapted in a different way compared with other southern species such as P. fenzeliana, P. kwangtungensis, and P. mastersiana, and was more cold-tolerant than these species (Table S4). This also indicates that the Qinling Mountains, which run from west to east in China, may have been a geographical barrier against the ice sheet [116,117,118].
Predicting distribution changes that occurred under paleoclimate conditions could provide an effective way to predict distribution areas under future climate change [119]. The Fifth Assessment Report of the IPCC estimated that average global temperatures will have increased by 0.3–4.8 °C by the end of the 21st century [8]. This may profoundly influence the species distribution in temperate forests [10]. Shifts in suitable habitats may provide chances for species to adapt to predicted future climate change. However, the results of this study suggest that the habitats of three endemic species, namely P. armandii, P. mastersiana, and P. morrisonicola, will reduce in the future (Table 4). Among them, the two Taiwanese species were predicted to be in a critically endangered situation. The suitable habitats of both of these species were predicted to keep contracting to higher latitudes in the Central Mountains in Taiwan, where few new suitable regions are predicted to arise (Table 4, Figure 5 and Figures S13–S15). Meanwhile, regions at the southern edge and/or at low altitudes of the suitable habitats of P. armandii may disappear, and new suitable habitats may appear at higher latitudes and altitudes (Figure 5).
The results of this study suggest that, under most of the future climate scenarios, the suitable habitats of the eight species other than P. armandii, P. mastersiana, and P. morrisonicola will generally expand to higher latitudes and higher elevations. However, this does not mean that these species will actually expand their distribution ranges in response to climate change, since this may be limited by the dispersal ability of the species and interspecific competition [120,121]. Furthermore, in the future, the actual distribution area of a species may contract when its current distribution habitats become unsuitable, even if the total suitable area has expanded. In the present study, we analyzed the predicted future changes in the suitability of the presence sites for each species within China. The results showed that, for the three species (P. armandii, P. mastersiana, and P. morrisonicola) whose suitable habitats are predicted to contract in the future, the suitability of their actual distribution sites is also predicted to reduce (Table 5). Therefore, P. armandii and the two Taiwanese species are predicted to have a high risk of population shrinkage or even local extinction in the future. In view of their restricted current distributions, P. mastersiana and P. morrisonicola require urgent protection in their entire distribution range. Additionally, for P. armandii, attention should be paid to locations at low altitude (below 2500 m) in the southern margin of the Hengduan Mountains, the southeast margin of the Yungui Plateau, the edge of the Sichuan Basin, and the southern margin of the Dabieshan Mountains (Figures S6–S9).
Furthermore, the results of this study suggest that P. sibirica is also at high risk under future climate change, despite the fact that its suitable habitat within China is predicted to expand in three of the four future climate scenarios (Table 4). This species is extremely cold-adapted [42] and its distribution sites in China are at the southern and southeastern edges of its distribution range. Thus, it is likely that a high proportion of its current presence sites are not currently suitable and will continue to be unsuitable in the future. Furthermore, the results of this study suggest that, in the future, the suitable habitats of P. sibirica in China will be discontinuous (Figures S6–S9), which will hinder the natural dispersal of this species.
The results of this study indicate that the suitable area of P. kwangtungensis will increase (Table 4) under all the future climate scenarios. However, a large area of its habitat in South China is expected to disappear (Figures S6–S9). Our results supported the suggestion of ex situ conservation of P. kwangtungensis propose by a previous study [39]. A similar situation was predicted for P. fenzeliana. Thus, it is reasonable that the IUCN has listed these two species as near-threatened [33]. For two species in Northeast China, P. pumila and P. koraiensis, no contraction of their suitable habitat in China was predicted and the suitability of their current presence sites in China was not predicted to decrease. P. koraiensis is the most important conifer species with high ecological and economic value in Northeast China [40]. Although P. koraiensis is currently listed in the second conservation class in China [34], this study suggests that its future situation will be better than those of P. dabeshanensis, P. wangii, and P. kwangtungensis, which are also listed in the second conservation class. Populations genetic study showed that high genetic diversity is present within the natural population of P. koraiensis [41], indicating that an in situ conservation strategy for this species should be taken into consideration.
The two Himalayan species, P. wallichiana and P. bhutanica, are listed as Least Concern by the IUCN. However, some of the presence sites of P. wallichiana are predicted to be unsuitable in the future. Given that the two Himalayan species are restricted, special care should be paid to the conservation of their natural populations. Additionally, more attention should be paid to the little-known species P. bhutanica, which has been the subject of only a few taxonomic studies to date [29,68,122]. Moreover, two endemic species, P. wangii and P. dabeshanensis, have a restricted distribution in China [35,45,123,124]. Although the suitable habitats of P. dabeshanensis are predicted to increase in the future, they are predicted to be discontinuous. Furthermore, for P. wangii, it is predicted that some of its few presence sites will disappear in the future. Therefore, both in situ and ex situ conservation strategies should be considered for these endangered species.
Combining paleoclimatic reconstruction with future prediction is of great importance for species conservation strategy in changing climates [63]. However, the uncertainties of our modeling should be kept in mind. For instance, it is difficult to implement some ecological and evolutionary processes which greatly affect the distribution of species in the modeling process, such as species competition and human activities [125]. Despite this, SDMs can still provide a reference which can be used to inform the choice of conservation strategies.

5. Conclusions

In this study, a species distribution model (SDM) not only revealed the possible paleoclimatic roots of the distribution patterns of Chinese white pine species but also shed light on appropriate directions for their conservation and sustainable management. The results of this study suggest that most of the Chinese white pine species responded sensitively to the last interglacial-glacial cycles and the ongoing global warming. The results suggest that P. armandii and the two Taiwanese species may be at high risk in China in the future, which indicates that both in situ and near situ protection strategies should be considered. Pinus kwangtungensis, P. dabeshanensis, and P. wangii are considered as threatened or endangered species, and therefore special care should be taken to enlarge their natural populations, especially for the latter two species. Additionally, this study suggests that P. sibirica is also at a high risk of losing its current populations. Given that the suitable habitat of this species is predicted to expand to several unconnected mountains outside of its current range, ex situ conservation should be considered for this species. Although P. koraiensis is listed as a second-class species for conservation, this study suggests that this species is not at risk under future climate change scenarios. Similar findings were also obtained for P. pumila and P. fenzeliana, for which the suitable area in China is predicted to increase in response to future global warming. The two Himalayan species are also rare within China and have small distribution areas. The SDMs revealed that, under future climate change, the suitable habitats of these species will expand in the Hengduan Mountains. However, the high mountains may impede the dispersal of white pine species. Efforts should be made to protect the current distribution ranges of these rare and fragile species and transplant them to wider suitable habitats.

Supplementary Materials

The following are available online at https://www.mdpi.com/1999-4907/11/9/996/s1, Figure S1: Response curves of the key environmental variables; Figure S2: Bar chart of suitable habitat areas (of high, medium and low suitability, within China) under the current, three past and four future climate scenarios; Figure S3: Suitable habitat changes under the last inter-glacial (LIG) scenario compared with the current condition; Figure S4: Suitable habitat changes under the last glacial maximum (LGM) scenario compared with the current condition; Figure S5: Suitable habitat changes under the middle Holocene (MH) scenario compared with the current condition; Figure S6: Suitable habitat changes under the RCP2.6-2050 scenario compared with the current condition; Figure S7: Suitable habitat changes under the RCP2.6-2070 scenario compared with the current condition; Figure S8: Suitable habitat changes under the RCP8.5-2050 scenario compared with the current condition; Figure S9: Suitable habitat changes under the RCP8.5-2050 scenario compared with the current condition; Figure S10: Shifts of centroids for each species under different scenarios; Figure S11: Altitude and latitude change of the suitable habitats under the LIG scenario compared with the current condition; Figure S12: Altitude and latitude change of the suitable habitats under the MH scenario compared with the current condition; Figure S13: Altitude and latitude change of the suitable habitats under the RCP2.6-2050 scenario compared with the current condition; Figure S14: Altitude and latitude change of the suitable habitats under the RCP2.6-2070 scenario compared with the current; Figure S15: Altitude and latitude change of the suitable habitats under the RCP8.5-2050 scenario compared with the current condition; Table S1: Species of Chinese white pines and their conservation status; Table S2: Presence data of the 12 Chines white pine species; Table S3: Information of the 39 environmental variables; Table S4: Suitable ranges of the 18 environmental variables for the 12 Chines white pine species; Table S5: Area of suitable habitats (of high, medium and low suitability) within China under the current condition, three past and four future climate scenarios; Table S6: Suitable habitat area changes (within China) under the three past and four future climate scenarios compared with the current condition; Table S7: Geographic coordinates of the distribution centroids under the eight climate scenarios.

Author Contributions

Conceptualization, L.X. and G.C.; methodology, L.X. and L.L.; software, L.L. and J.H.; validation, L.L., J.H. and L.X.; formal analysis, L.L. and J.H.; investigation, L.L.; resources, L.X. and G.C.; data curation, L.L. and J.H.; writing—original draft preparation, L.L.; writing—review and editing, L.X.; visualization, L.L.; supervision, G.C.; project administration, L.X.; funding acquisition, G.C. All authors have read and agreed to the published version of the manuscript.

Funding

This research was funded by the Medium- and Long-term Scientific Study Projects for Young Teachers of Beijing Forestry University (grant No. 2015ZCQ-BH-03 to L.X.).

Acknowledgments

We would like to thank the contributors to the databases used in this study. We appreciate the help from Li Mingyu for data analysis. We also thank Lu Dau-Jye and Yang Chih-Kai of the Taiwan University for their help during the field work.

Conflicts of Interest

The authors declare no conflict of interest.

References

  1. Mittermeier, R.A.; Mittermeier, C.G. Megadiversity: Earth’s Biologically Wealthiest Nations; Agrupación Sierra Madre: Mexico City, Mexico, 1997. [Google Scholar]
  2. Yu, X. Biodiversity conservation in China: Barriers and future actions. Int. J. Environ. Stud. 2010, 67, 117–126. [Google Scholar] [CrossRef]
  3. Xu, H.; Wang, S.; Xue, D. Biodiversity conservation in China: Legislation, plans and measures. Biodivers. Conserv. 1999, 8, 819–837. [Google Scholar] [CrossRef]
  4. Isbell, F.; Gonzalez, A.; Loreau, M.; Cowles, J.; Díaz, S.; Hector, A.; Mace, G.M.; Wardle, D.A.; O’Connor, M.I.; Duffy, J.E. Linking the influence and dependence of people on biodiversity across scales. Nature 2017, 546, 65–72. [Google Scholar] [CrossRef] [PubMed] [Green Version]
  5. Johnson, C.N.; Balmford, A.; Brook, B.W.; Buettel, J.C.; Galetti, M.; Guangchun, L.; Wilmshurst, J.M. Biodiversity losses and conservation responses in the Anthropocene. Science 2017, 356, 270–275. [Google Scholar] [CrossRef]
  6. Meng, H.-H.; Zhou, S.-S.; Li, L.; Tan, Y.-H.; Li, J.-W.; Li, J. Conflict between biodiversity conservation and economic growth: Insight into rare plants in tropical China. Biodivers. Conserv. 2019, 28, 523–537. [Google Scholar] [CrossRef]
  7. You, J.; Qin, X.; Ranjitkar, S.; Lougheed, S.C.; Wang, M.; Zhou, W.; Ouyang, D.; Zhou, Y.; Xu, J.; Zhang, W.; et al. Response to climate change of montane herbaceous plants in the genus Rhodiola predicted by ecological niche modelling. Sci. Rep. 2018, 8, 5879. [Google Scholar] [CrossRef]
  8. IPCC. Climate Change 2013: The Physical Science Basis. Contribution of Working Group I to the Fifth Assessment Report of the Intergovernmental Panel on Climate Change; Cambridge University Press: Cambridge, UK; New York, NY, USA, 2013; Volume 1535. [Google Scholar]
  9. Li, Y.; Li, M.; Li, C.; Liu, Z. Optimized maxent model predictions of climate change impacts on the suitable distribution of Cunninghamia lanceolata in China. Forests 2020, 11, 302. [Google Scholar] [CrossRef] [Green Version]
  10. Wang, D.; Cui, B.; Duan, S.; Chen, J.; Fan, H.; Lu, B.; Zheng, J. Moving north in China: The habitat of Pedicularis kansuensis in the context of climate change. Sci. Total Environ. 2019, 697, 133979. [Google Scholar] [CrossRef]
  11. Zhang, K.; Zhang, Y.; Tao, J. Predicting the potential distribution of Paeonia veitchii (Paeoniaceae) in China by incorporating climate change into a Maxent model. Forests 2019, 10, 190. [Google Scholar] [CrossRef] [Green Version]
  12. Bigelow, N.H.; Brubaker, L.B.; Edwards, M.E.; Harrison, S.P.; Prentice, I.C.; Anderson, P.M.; Andreev, A.A.; Bartlein, P.J.; Christensen, T.R.; Cramer, W. Climate change and Arctic ecosystems: 1. Vegetation changes north of 55° N between the last glacial maximum, mid-Holocene, and present. J. Geophys. Res. Atmos. 2003, 108, 8170. [Google Scholar] [CrossRef] [Green Version]
  13. Harrison, S.; Yu, G.; Takahara, H.; Prentice, I. Palaeovegetation—Diversity of temperate plants in east Asia. Nature 2001, 413, 129–130. [Google Scholar] [CrossRef] [PubMed]
  14. Hewitt, G. The genetic legacy of the Quaternary ice ages. Nature 2000, 405, 907–913. [Google Scholar] [CrossRef] [PubMed]
  15. Huang, Y.; Street-Perrott, F.A.; Metcalfe, S.E.; Brenner, M.; Moreland, M.; Freeman, K.H. Climate change as the dominant control on glacial-interglacial variations in C3 and C4 plant abundance. Science 2001, 293, 1647–1651. [Google Scholar] [CrossRef] [PubMed]
  16. Prentice, I.C.; Jolly, D.; Afanas’Eva, N.B.; Ager, T.A.; Zheng, Z. Mid-Holocene and glacial-maximum vegetation geography of the northern continents and Africa. J. Biogeogr. 2000, 27, 507–519. [Google Scholar] [CrossRef] [Green Version]
  17. Shen, L.; Chen, X.Y.; Li, Y.Y. Glacial refugia and postglacial recolonization patterns of organisms. Acta Ecol. Sin. 2002, 22, 1983–1990. [Google Scholar]
  18. Yu, G.; Chen, X.; Ni, J.; Cheddadi, R.; Guiot, J.; Han, H.; Harrison, S.P.; Huang, C.; Ke, M.; Kong, Z. Palaeovegetation of China: A pollen data-based synthesis for the mid-Holocene and last glacial maximum. J. Biogeogr. 2000, 27, 635–664. [Google Scholar] [CrossRef] [Green Version]
  19. Stewart, J.R.; Lister, A.M.; Barnes, I.; Dalén, L. Refugia revisited: Individualistic responses of species in space and time. Proc. Biol. Sci. 2010, 277, 661–671. [Google Scholar] [CrossRef] [Green Version]
  20. Feng, G.; Ma, Z.; Sandel, B.; Mao, L.; Normand, S.; Ordonez, A.; Svenning, J.C. Species and phylogenetic endemism in angiosperm trees across the Northern Hemisphere are jointly shaped by modern climate and glacial–interglacial climate change. Glob. Ecol. Biogeogr. 2019, 28, 1393–1402. [Google Scholar] [CrossRef]
  21. Chen, I.C.; Hill, J.K.; Ohlemuller, R.; Roy, D.B.; Thomas, C.D. Rapid range shifts of species associated with high levels of climate warming. Science 2011, 333, 1024–1026. [Google Scholar] [CrossRef]
  22. Nogués-Bravo, D.; Araújo, M.B.; Errea, M.P.; Martínez-Rica, J.P. Exposure of global mountain systems to climate warming during the 21st Century. Glob. Environ. Chang. 2007, 17, 420–428. [Google Scholar] [CrossRef]
  23. Broennimann, O.; Thuiller, W.; Hughes, G.; Midgley, G.F.; Alkemade, J.R.; Guisan, A. Do geographic distribution, niche property and life form explain plants’ vulnerability to global change? Glob. Chang. Biol. 2006, 12, 1079–1093. [Google Scholar] [CrossRef]
  24. Malcolm, J.R.; Liu, C.; Neilson, R.P.; Hansen, L.; Hannah, L. Global warming and extinctions of endemic species from biodiversity hotspots. Conserv. Biol. 2006, 20, 538–548. [Google Scholar] [CrossRef] [PubMed]
  25. Thomas, C.D. Translocation of species, climate change, and the end of trying to recreate past ecological communities. Trends Ecol. Evol. 2011, 26, 216–221. [Google Scholar] [CrossRef] [PubMed]
  26. Gibson, L.; Lee, T.M.; Koh, L.P.; Brook, B.W.; Gardner, T.A.; Barlow, J.; Peres, C.A.; Bradshaw, C.J.; Laurance, W.F.; Lovejoy, T.E. Primary forests are irreplaceable for sustaining tropical biodiversity. Nature 2011, 478, 378–381. [Google Scholar] [CrossRef] [PubMed]
  27. Watson, J.E.; Evans, T.; Venter, O.; Williams, B.; Tulloch, A.; Stewart, C.; Thompson, I.; Ray, J.C.; Murray, K.; Salazar, A. The exceptional value of intact forest ecosystems. Nat. Ecol. Evol. 2018, 2, 599–610. [Google Scholar] [CrossRef]
  28. Crausbay, S.D.; Higuera, P.E.; Sprugel, D.G.; Brubaker, L.B. Fire catalyzed rapid ecological change in lowland coniferous forests of the Pacific Northwest over the past 14,000 years. Ecology 2017, 98, 1–14. [Google Scholar] [CrossRef]
  29. Gernandt, D.S.; López, G.G.; García, S.O.; Liston, A. Phylogeny and classification of Pinus. Taxon 2005, 54, 29–42. [Google Scholar] [CrossRef] [Green Version]
  30. Hao, Z.Z.; Liu, Y.Y.; Nazaire, M.; Wei, X.X.; Wang, X.Q. Molecular phylogenetics and evolutionary history of sect. Quinquefoliae (Pinus): Implications for Northern Hemisphere biogeography. Mol. Phylogenet. Evol. 2015, 87, 65–79. [Google Scholar] [CrossRef]
  31. Cheng, W.C.; Fu, L.K. Pinus Linn. In Flora Reipublicae Popularis Sinicae; Science Press: Beijing, China, 1978; Volume 7, pp. 204–281. [Google Scholar]
  32. Fu, L.G.; Li, N.; Mill, R.R. Pinaceae. In Flora of China; Science Press and Missouri Botanical Garden Press: Beijing, China; St. Louis, MO, USA, 1999; Volume 4, pp. 11–52. [Google Scholar]
  33. IUCN. The IUCN Red List of Threatened Species. Version 2020-1. Available online: https://www.iucnredlist.org (accessed on 16 April 2020).
  34. National Forestry Administration. List of National Key Protected Wild Plants (First Group). Available online: http://www.forestry.gov.cn/main/3954/20180925/143410933280757.html (accessed on 23 August 2020).
  35. Dou, J.J.; Zhou, R.C.; Tang, A.J.; Ge, X.J.; Wu, W. Development and characterization of nine microsatellites for an endangered tree, Pinus wangii (Pinaceae). Appl. Plant Sci. 2013, 1, 1200134. [Google Scholar] [CrossRef]
  36. Li, Z.-H.; Yang, C.; Mao, K.-S.; Ma, Y.-Z.; Liu, J.; Liu, Z.-L.; Deng, T.-T.; Zhao, G.-F. Molecular identification and allopatric divergence of the white pine species in China based on the cytoplasmic DNA variation. Biochem. Syst. Ecol. 2015, 61, 161–168. [Google Scholar] [CrossRef]
  37. Liu, Y.Y.; Jin, W.T.; Wei, X.X.; Wang, X.Q. Cryptic speciation in the Chinese white pine (Pinus armandii): Implications for the high species diversity of conifers in the Hengduan Mountains, a global biodiversity hotspot. Mol. Phylogenet. Evol. 2019, 138, 114–125. [Google Scholar] [CrossRef] [PubMed]
  38. Shuang, T. Molecular evidence for glacial expansion and interglacial retreat during Quaternary climatic changes in a montane temperate pine (Pinus kwangtungensis Chun ex Tsiang) in southern China. Plant Syst. Evol. 2010, 284, 219–229. [Google Scholar] [CrossRef]
  39. Tao, C.; Li, X.; Wang, Q.; Cui, G. Relationships between geographical distribution of endangered Pinus kwangtungensis and climate in China. Plant Sci. J. 2012, 30, 577–583. [Google Scholar] [CrossRef]
  40. Tong, Y.; Durka, W.; Zhou, W.; Zhou, L.; Yu, D.; Dai, L. Ex situ conservation of Pinus koraiensis can preserve genetic diversity but homogenizes population structure. For. Ecol. Manag. 2020, 465, 117820. [Google Scholar] [CrossRef]
  41. Tong, Y.W.; Lewis, B.J.; Zhou, W.M.; Mao, C.R.; Wang, Y.; Zhou, L.; Yu, D.P.; Dai, L.M.; Qi, L. Genetic diversity and population structure of natural Pinus koraiensis populations. Forests 2020, 11, 39. [Google Scholar] [CrossRef] [Green Version]
  42. Wang, F.; Liang, D.; Pei, X.; Zhang, Q.; Zhang, P.; Zhang, J.; Lu, Z.; Yang, Y.; Liu, G.; Zhao, X. Study on the physiological indices of Pinus sibirica and Pinus koraiensis seedlings under cold stress. J. For. Res. 2019, 30, 1255–1265. [Google Scholar] [CrossRef]
  43. Xiang, X.-Y.; Zhang, Z.-X.; Duan, R.-Y.; Zhang, X.-P.; Wu, G.-L. Genetic diversity and structure of Pinus dabeshanensis revealed by expressed sequence tag-simple sequence repeat (EST-SSR) markers. Biochem. Syst. Ecol. 2015, 61, 70–77. [Google Scholar] [CrossRef]
  44. You, J.; Lin, L.L.; Xie, L.; Cui, G.F.; University, B.F. Interaspecific and intraspecific competitions of Pinus fenzeliana in Yinggeling, Hainan Province. Guihaia 2017, 37, 776–782. [Google Scholar] [CrossRef]
  45. Zhou, Y.; Jiang, H.; Yang, W.Z.; Zhang, S.S.; Xiang, Z.Y. Study on Stock of Pinus wangii,an Extremely Small Population Species. J. West China For. Sci. 2012, 41, 80–83. [Google Scholar] [CrossRef]
  46. Phillips, S.J.; Anderson, R.P.; Schapire, R.E. Maximum entropy modeling of species geographic distributions. Ecol. Modell. 2006, 190, 231–259. [Google Scholar] [CrossRef] [Green Version]
  47. Ackerly, D.D.; Loarie, S.R.; Cornwell, W.K.; Weiss, S.B.; Hamilton, H.; Branciforte, R.; Kraft, N.J.B. The geography of climate change: Implications for conservation biogeography. Divers. Distrib. 2010, 16, 476–487. [Google Scholar] [CrossRef]
  48. Adhikari, D.; Tiwary, R.; Singh, P.P.; Upadhaya, K.; Singh, B.; Haridasan, K.E.; Bhatt, B.B.; Chettri, A.; Barik, S.K. Ecological niche modeling as a cumulative environmental impact assessment tool for biodiversity assessment and conservation planning: A case study of critically endangered plant Lagerstroemia minuticarpa in the Indian Eastern Himalaya. J. Environ. Manag. 2019, 243, 299–307. [Google Scholar] [CrossRef] [PubMed]
  49. Chucholl, C. Niche-based species distribution models and conservation planning for endangered freshwater crayfish in south-western Germany. Aquat. Conserv. 2017, 27, 698–705. [Google Scholar] [CrossRef]
  50. Qin, A.; Liu, B.; Guo, Q.; Bussmann, R.W.; Ma, F.; Jian, Z.; Xu, G.; Pei, S. Maxent modeling for predicting impacts of climate change on the potential distribution of Thuja sutchuenensis Franch., an extremely endangered conifer from southwestern China. Glob. Ecol. Conserv. 2017, 10, 139–146. [Google Scholar] [CrossRef]
  51. Sarania, B.; Devi, A.; Kumar, A.; Sarma, K.; Gupta, A.K. Predictive distribution modeling and population status of the endangered Macaca munzala in Arunachal Pradesh, India. Am. J. Primatol. 2017, 79, 1–10. [Google Scholar] [CrossRef]
  52. Wang, W.; Gao, S.; Wang, S. Predictive studies of potential invasive areas for four poisonous weeds in Gansu Grassland. Acta Ecol. Sin. 2019, 39, 4301–5307. [Google Scholar] [CrossRef]
  53. Zeng, Y.; Low, B.W.; Yeo, D.C. Novel methods to select environmental variables in MaxEnt: A case study using invasive crayfish. Ecol. Modell. 2016, 341, 5–13. [Google Scholar] [CrossRef]
  54. Chen, F.; Du, Y.; Niu, S.; Zhao, J. Modeling forest lightning fire occurrence in the Daxinganling Mountains of Northeastern China with MAXENT. Forests 2015, 6, 1422–1438. [Google Scholar] [CrossRef] [Green Version]
  55. Duan, H.; Xia, S.; Hou, X.; Liu, Y.; Yu, X. Conservation planning following reclamation of intertidal areas throughout the Yellow and Bohai Seas, China. Biodivers. Conserv. 2019, 28, 3787–3801. [Google Scholar] [CrossRef]
  56. Raney, P.A.; Leopold, D.J. Fantastic wetlands and where to find them: Modeling rich fen distribution in New York State with Maxent. Wetlands 2018, 38, 81–93. [Google Scholar] [CrossRef]
  57. Roces-Díaz, J.V.; Jiménez-Alfaro, B.; Chytrý, M.; Díaz-Varela, E.R.; Álvarez-Álvarez, P. Glacial refugia and mid-Holocene expansion delineate the current distribution of Castanea sativa in Europe. Palaeogeogr. Palaeoclimatol. Palaeoecol. 2018, 491, 152–160. [Google Scholar] [CrossRef] [Green Version]
  58. Shitara, T.; Nakamura, Y.; Matsui, T.; Tsuyama, I.; Ohashi, H.; Kamijo, T. Formation of disjunct plant distributions in Northeast Asia: A case study of Betula davurica using a species distribution model. Plant Ecol. 2018, 219, 1105–1115. [Google Scholar] [CrossRef]
  59. Wang, S.; Xu, X.; Shrestha, N.; Zimmermann, N.E.; Tang, Z.; Wang, Z. Response of spatial vegetation distribution in China to climate changes since the Last Glacial Maximum (LGM). PLoS ONE 2017, 12, e0175742. [Google Scholar] [CrossRef] [Green Version]
  60. Songer, M.; Delion, M.; Biggs, A.; Huang, Q. Modeling impacts of climate change on giant panda habitat. Int. J. Ecol. 2012, 2012, 108752. [Google Scholar] [CrossRef]
  61. Tang, C.Q.; Dong, Y.-F.; Herrando-Moraira, S.; Matsui, T.; Ohashi, H.; He, L.-Y.; Nakao, K.; Tanaka, N.; Tomita, M.; Li, X.-S. Potential effects of climate change on geographic distribution of the Tertiary relict tree species Davidia involucrata in China. Sci. Rep. 2017, 7, 43822. [Google Scholar] [CrossRef] [PubMed] [Green Version]
  62. Vieilledent, G.; Cornu, C.; Sanchez, A.C.; Pock-Tsy, J.-M.L.; Danthu, P. Vulnerability of baobab species to climate change and effectiveness of the protected area network in Madagascar: Towards new conservation priorities. Biol. Conserv. 2013, 166, 11–22. [Google Scholar] [CrossRef]
  63. Bai, Y.; Wei, X.; Li, X. Distributional dynamics of a vulnerable species in response to past and future climate change: A window for conservation prospects. PeerJ 2018, 6, e4287. [Google Scholar] [CrossRef]
  64. Hayata, B. Pinus armandii var. mastersiana (Hayata) Hayata. J. Coll. Sci. Imp. Univ. Tokyo 1908, XXV, 217. [Google Scholar]
  65. Li, J.; Fan, G.; He, Y. Predicting the current and future distribution of three Coptis herbs in China under climate change conditions, using the MaxEnt model and chemical analysis. Sci. Total Environ. 2020, 698, 134141. [Google Scholar] [CrossRef]
  66. Li, M.; He, J.; Zhao, Z.; Lyu, R.; Yao, M.; Cheng, J.; Xie, L. Predictive modelling of the distribution of Clematis sect. Fruticella s. str. under climate change reveals a range expansion during the Last Glacial Maximum. PeerJ 2020, 8, e8729. [Google Scholar] [CrossRef] [Green Version]
  67. Hijmans, R.J.; Phillips, S.; Leathwick, J.; Elith, J.; Hijmans, M.R.J. Dismo: Species Distribution Modeling. Available online: https://cran.r-project.org/package=dismo (accessed on 24 October 2019).
  68. Grierson, A.J.C.; Long, D.G.; Page, C.N. Notes relating to the flora of Bhutan:(III). Pinus bhutanica: A new 5-needle pine from Bhutan and India. Notes R. Bot. Gard. Edinb. 1980, 38, 297–310. [Google Scholar]
  69. Komarov, V.L.e. Flora of the USSR; Izdatel’stvo Akademii Nauk SSSR: Leningrad, Russia, 1934; Volume I. [Google Scholar]
  70. Syfert, M.M.; Smith, M.J.; Coomes, D.A. The effects of sampling bias and model complexity on the predictive performance of MaxEnt species distribution models. PLoS ONE 2013, 8, e55158. [Google Scholar] [CrossRef]
  71. Brown, J.L. SDM toolbox: A python-based GIS toolkit for landscape genetic, biogeographic and species distribution model analyses. Methods Ecol. Evol. 2014, 5, 694–700. [Google Scholar] [CrossRef]
  72. Hijmans, R.J.; Cameron, S.E.; Parra, J.L.; Jones, P.G.; Jarvis, A. Very high resolution interpolated climate surfaces for global land areas. Int. J. Climatol. 2005, 25, 1965–1978. [Google Scholar] [CrossRef]
  73. Beckmann, M.; Václavík, T.; Manceur, A.M.; Šprtová, L.; von Wehrden, H.; Welk, E.; Cord, A.F. gl UV: A global UV-B radiation data set for macroecological studies. Methods Ecol. Evol. 2014, 5, 372–383. [Google Scholar] [CrossRef]
  74. IIASA; FAO. Global Agro-cological Zones (GAEZ v3.0); IIASA: Laxenburg, Austria; FAO: Rome, Italy, 2012. [Google Scholar]
  75. Baldwin, R.A. Use of maximum entropy modeling in wildlife research. Entropy 2009, 11, 854–866. [Google Scholar] [CrossRef]
  76. Dormann, C.F.; Elith, J.; Bacher, S.; Buchmann, C.; Carl, G.; Carré, G.; Marquéz, J.R.G.; Gruber, B.; Lafourcade, B.; Leitão, P.J. Collinearity: A review of methods to deal with it and a simulation study evaluating their performance. Ecography 2013, 36, 27–46. [Google Scholar] [CrossRef]
  77. Fourcade, Y.; Engler, J.O.; Rödder, D.; Secondi, J. Mapping species distributions with MAXENT using a geographically biased sample of presence data: A performance assessment of methods for correcting sampling bias. PLoS ONE 2014, 9, e97122. [Google Scholar] [CrossRef] [Green Version]
  78. Phillips, S.J. A Brief Tutorial on Maxent. Available online: https://biodiversityinformatics.amnh.org/open_source/maxent/ (accessed on 13 November 2019).
  79. Gent, P.R.; Danabasoglu, G.; Donner, L.J.; Holland, M.M.; Hunke, E.C.; Jayne, S.R.; Lawrence, D.M.; Neale, R.B.; Rasch, P.J.; Vertenstein, M.; et al. The Community Climate System Model Version 4. J Clim. 2011, 24, 4973–4991. [Google Scholar] [CrossRef]
  80. Duffy, K.J.; Jacquemyn, H. Climate change increases ecogeographical isolation between closely related plants. J. Ecol. 2019, 107, 167–177. [Google Scholar] [CrossRef]
  81. Phillips, S.J.; Anderson, R.P.; Dudík, M.; Schapire, R.E.; Blair, M.E. Opening the black box: An open-source release of Maxent. Ecography 2017, 40, 887–893. [Google Scholar] [CrossRef]
  82. Fielding, A.H.; Bell, J.F. A review of methods for the assessment of prediction errors in conservation presence/absence models. Environ. Conserv. 1997, 24, 38–49. [Google Scholar] [CrossRef]
  83. Allouche, O.; Tsoar, A.; Kadmon, R. Assessing the accuracy of species distribution models: Prevalence, kappa and the true skill statistic (TSS). J. Appl. Ecol. 2006, 43, 1223–1232. [Google Scholar] [CrossRef]
  84. Elith, J.; Leathwick, J.R. Species distribution models: Ecological explanation and prediction across space and time. Annu. Rev. Ecol. Evol. Syst. 2009, 40, 677–697. [Google Scholar] [CrossRef]
  85. Jiménez-Valverde, A. Insights into the area under the receiver operating characteristic curve (AUC) as a discrimination measure in species distribution modelling. Glob. Ecol. Biogeogr. 2012, 21, 498–507. [Google Scholar] [CrossRef]
  86. Liu, C.; White, M.; Newell, G. Measuring and comparing the accuracy of species distribution models with presence-absence data. Ecography 2011, 34, 232–243. [Google Scholar] [CrossRef]
  87. Lei, Z.; Wang, L.; Liu, S.; Sun, P.; Zhang, X. An evaluation of four threshold selection methods in species occurrence modelling with random forest: Case studies with Davidia involucrata and Cunninghamia lanceolata. Chin. J. Plant. Ecol. 2017, 41, 387–395. [Google Scholar] [CrossRef] [Green Version]
  88. Thuiller, W.; Georges, D.; Engler, R.; Breiner, F.; Georges, M.D.; Thuiller, C.W. Package ‘Biomod2′: Ensemble Platform for Species Distribution Modeling. Available online: https://cran.r-project.org/web/packages/biomod2/biomod2.pdf (accessed on 6 March 2020).
  89. Wang, Y.; Xie, B.; Wan, F.; Xiao, Q.; Dai, L. Application of ROC curve analysis in evaluating the performance of alien species potential distribution models. Biodiv. Sci. 2007, 15, 365–372. [Google Scholar] [CrossRef]
  90. Luo, M.; Wang, H.; Lyu, Z. Evaluating the performance of species distribution models Biomod2 and MaxEnt using the giant panda distribution data. Chin. J. Appl. Ecol. 2017, 28, 4001–4006. [Google Scholar] [CrossRef]
  91. Yang, X.-Q.; Kushwaha, S.; Saran, S.; Xu, J.; Roy, P. Maxent modeling for predicting the potential distribution of medicinal plant, Justicia adhatoda L. in Lesser Himalayan foothills. Ecol. Eng. 2013, 51, 83–87. [Google Scholar] [CrossRef]
  92. Janská, V.; Jiménez-Alfaro, B.; Chytrý, M.; Divíšek, J.; Anenkhonov, O.; Korolyuk, A.; Lashchinskyi, N.; Culek, M. Palaeodistribution modelling of European vegetation types at the Last Glacial Maximum using modern analogues from Siberia: Prospects and limitations. Quat. Sci. Rev. 2017, 159, 103–115. [Google Scholar] [CrossRef]
  93. Zhuang, H.; Zhang, Y.; Wang, W.; Ren, Y.; Liu, F.; Du, J.; Zhou, Y. Optimized hot spot analysis for probability of species distribution under different spatial scales based on MaxEnt model: Manglietia insignis case. Biodiv. Sci. 2018, 26, 931–940. [Google Scholar] [CrossRef] [Green Version]
  94. Diekmann, O.E.; Coyer, J.A.; Ferreira, J.; Olsen, J.L.; Stam, W.T.; Pearson, G.A.; Serrão, E.A. Population genetics of Zostera noltii along the west Iberian coast: Consequences of small population size, habitat discontinuity and near-shore currents. Mar. Ecol. Prog. Ser. 2005, 290, 89–96. [Google Scholar] [CrossRef]
  95. Kobayashi, T.; Sota, T. Contrasting effects of habitat discontinuity on three closely related fungivorous beetle species with diverging host-use patterns and dispersal ability. Ecol. Evol. 2019, 9, 2475–2486. [Google Scholar] [CrossRef] [PubMed]
  96. Bush, A.; Mokany, K.; Catullo, R.; Hoffmann, A.; Kellermann, V.; Sgrò, C.; McEvey, S.; Ferrier, S. Incorporating evolutionary adaptation in species distribution modelling reduces projected vulnerability to climate change. Ecol. Lett. 2016, 19, 1468–1478. [Google Scholar] [CrossRef]
  97. Chen, M. A preliminary study on climate re-gionalization in China. Sci. Geogr. Sin. 1990, 010, 308–315. [Google Scholar]
  98. Li, G.; Du, S.; Guo, K. Evaluation of limiting climatic factors and simulation of a climatically suitable habitat for Chinese sea buckthorn. PLoS ONE 2015, 10, e0131659. [Google Scholar] [CrossRef]
  99. Gao, L.; Wang, X. Response of Pinus koraiensis and Picea jezoensis var. komarovii to climate in the transition zone of Changbai Mountain, China. Chin. J. Plant Ecol. 2011, 35, 27–34. [Google Scholar] [CrossRef]
  100. Yin, X.; Wu, X. Modelling analysis of Huashan pine growth response to climate. Q. J. Appl. Meteorol. 1995, 006, 257–264. [Google Scholar]
  101. Feng, J. Spatial patterns of species diversity of seed plants in China and their climatic explanation. Biodiv. Sci. 2008, 16, 470–476. [Google Scholar] [CrossRef]
  102. Yang, Q.S.; Xing, Y.W.; Zhou, Z.K. Modern geographical distribution of Tsuga and its climatic conditions in the Asian monsoon region. Acta Bot. Yunnanica 2009, 31, 389–398. [Google Scholar] [CrossRef]
  103. Chong, K.; Yong, W.; Tan, K. Advances on research of vernalization in higher plants. Chin. Bull. Bot. 1999, 16, 481–487. [Google Scholar]
  104. Ma, C.; Zhang, Y.; An, D. Geographic variation of cold hardiness of Pinus armandii. For. Res. 1990, 3, 113–118. [Google Scholar]
  105. Day, T.A.; Neale, P.J. Effects of UV-B radiation on terrestrial and aquatic primary producers. Annu. Rev. Ecol. Syst. 2002, 33, 371–396. [Google Scholar] [CrossRef]
  106. Ren, J.; Li, C. Research advances in response of seed plants to enhanced ultraviolet-B radiation. Chin. J. Ecol. 2005, 24, 315–320. [Google Scholar]
  107. Fu, G.; Shen, Z.-X. Effects of enhanced UV-B radiation on plant physiology and growth on the Tibetan Plateau: A meta-analysis. Acta Physiol. Plant. 2017, 39, 85. [Google Scholar] [CrossRef]
  108. Laakso, K.; Sullivan, J.H.; Huttunen, S. The effects of UV-B radiation on epidermal anatomy in loblolly pine (Pinus taeda L.) and Scots pine (Pinus sylvestris L.). Plant Cell Environ. 2000, 23, 461–472. [Google Scholar] [CrossRef]
  109. Matías, L.; Linares, J.C.; Sánchez-Miranda, Á.; Jump, A.S. Contrasting growth forecasts across the geographical range of Scots pine due to altitudinal and latitudinal differences in climatic sensitivity. Glob. Chang. Biol. 2017, 23, 4106–4116. [Google Scholar] [CrossRef]
  110. Yang, S.; Ding, Z.; Li, Y.; Wang, X.; Jiang, W.; Huang, X. Warming-induced northwestward migration of the East Asian monsoon rain belt from the Last Glacial Maximum to the mid-Holocene. PNAS 2015, 112, 13178–13183. [Google Scholar] [CrossRef] [Green Version]
  111. Xiao, J.; Shang, Z.; Shu, Q.; Yin, J.; Wu, X. The vegetation feature and palaeoenvironment significance in the mountainous interior of southern China from the Last Glacial Maximum. Sci. China Earth Sci. 2017, 61, 71–81. [Google Scholar] [CrossRef]
  112. Qiu, Y.-X.; Fu, C.-X.; Comes, H.P. Plant molecular phylogeography in China and adjacent regions: Tracing the genetic imprints of Quaternary climate and environmental change in the world’s most diverse temperate flora. Mol. Phylogenet. Evol. 2011, 59, 225–244. [Google Scholar] [CrossRef] [PubMed]
  113. Wang, J.; Gao, P.; Kang, M.; Lowe, A.J.; Huang, H. Refugia within refugia: The case study of a canopy tree (Eurycorymbus cavaleriei) in subtropical China. J. Biogeogr. 2009, 36, 2156–2164. [Google Scholar] [CrossRef]
  114. Zheng, Z. Response of altitudinal belts of vegetation to the Late Quaternary climatic changes in tropical Asia. Geogr. Res. 1999, 18, 96–104. [Google Scholar]
  115. Cheng, Y.; Jiang, W. Vegetation and climate changes since the Last Glacial Maximum in the Northern Loess Plateau. Quat. Sci. 2011, 31, 982–989. [Google Scholar] [CrossRef]
  116. Hou, K.; Qian, H.; Zhang, Y.; Zhang, Q. Influence of tectonic uplift of the Qinling Mountains on the paleoclimatic environment of surrounding areas: Insights from loess–paleosol sequences, Weihe Basin, central China. Catena 2020, 187, 104336. [Google Scholar] [CrossRef]
  117. Xu, X.X.; Cheng, F.Y.; Peng, L.P.; Sun, Y.Q.; Hu, X.G.; Li, S.Y.; Xian, H.L.; Jia, K.H.; Abbott, R.J.; Mao, J.F. Late Pleistocene speciation of three closely related tree peonies endemic to the Qinling–Daba Mountains, a major glacial refugium in Central China. Ecol. Evol. 2019, 9, 7528–7548. [Google Scholar] [CrossRef]
  118. Zhang, H.; Lu, H.; Jiang, S.-Y.; Vandenberghe, J.; Wang, S.; Cosgrove, R. Provenance of loess deposits in the Eastern Qinling Mountains (central China) and their implications for the paleoenvironment. Quat. Sci. Rev. 2012, 43, 94–102. [Google Scholar] [CrossRef]
  119. Cong, M.; Xu, Y.; Tang, L.; Yang, W.; Jian, M. Predicting the dynamic distribution of Sphagnum bogs in China under climate change since the last interglacial period. PLoS ONE 2020, 15, e0230969. [Google Scholar] [CrossRef]
  120. Büchi, L.; Vuilleumier, S. Coexistence of specialist and generalist species is shaped by dispersal and environmental factors. Am. Nat. 2014, 183, 612–624. [Google Scholar] [CrossRef]
  121. Liang, Y.; Duveneck, M.J.; Gustafson, E.J.; Serra-Diaz, J.M.; Thompson, J.R. How disturbance, competition, and dispersal interact to prevent tree range boundaries from keeping pace with climate change. Glob. Chang. Biol. 2018, 24, e335–e351. [Google Scholar] [CrossRef]
  122. Sun, H.; Zhou, Z.; Yu, H. The vegetation of the Big Bend Gorge of Yalu Tsangpo River, SE Tibet, E. Himalayas. Acta Bot. Yunnanica 1997, 19, 57–66. [Google Scholar]
  123. Xiang, X.; Zhang, Z.; Wang, Z.; Zhang, X.; Wu, G. Transcriptome sequencing and development of EST-SSR markers in Pinus dabeshanensis, an endangered conifer endemic to China. Mol. Breed. 2015, 35, 158. [Google Scholar] [CrossRef]
  124. Zhang, Z.; Wang, H.; Chen, W.; Pang, X.; Li, Y. Genetic diversity and structure of native and non-native populations of the endangered plant Pinus dabeshanensis. Genet. Mol. Res. 2003, 15, 1–11. [Google Scholar] [CrossRef] [PubMed]
  125. Fordham, D.A.; Resit Akçakaya, H.; Araújo, M.B.; Elith, J.; Keith, D.A.; Pearson, R.; Auld, T.D.; Mellin, C.; Morgan, J.W.; Regan, T.J. Plant extinction risk under climate change: Are forecast range shifts alone a good indicator of species vulnerability to global warming? Glob. Chang. Biol. 2012, 18, 1357–1371. [Google Scholar] [CrossRef]
Figure 1. Distribution of Chinese white pines.
Forests 11 00996 g001
Figure 2. Present suitable distribution areas of the 12 Chinese white pine species predicted using MaxEnt modeling.
Forests 11 00996 g002
Figure 3. Predicted changes in the suitable areas of the 12 white pine species under the three paleoclimatic and four climate scenarios compared with the current condition (enlarged figures of P. mastersiana and P. morrisonicola in dashed box).
Forests 11 00996 g003
Figure 4. The predicted changes in the elevation and latitude of the suitable habitats of the 12 white pine species under the Last Glacial Maximum (LGM) scenario relative to the current climate. Each dot represents a grid cell in the suitable area data.
Forests 11 00996 g004
Figure 5. The predicted changes in the elevation and latitude of the suitable habitats of the 12 white pine species under the RCP8.5-2070 scenario relative to the current climate. Each dot represents a grid cell in the suitable area data.
Forests 11 00996 g005
Table 1. Information of the environmental variables used for niche modeling.
Environmental VariableEcological MeaningUnitData Source
Bio1Annual mean temperature°C × 10WorldClim
Bio2mean diurnal range (mean of monthly (max temp—min temp))°C × 10WorldClim
Bio3Isothermality (Bio2/(max temperature of warmest month—min temperature of coldest month)) (×100)×100WorldClim
Bio4Temperature seasonality (standard deviation ×100)×100WorldClim
Bio6Min temperature of coldest month°C × 10WorldClim
Bio8Mean temperature of wettest quarter°C × 10WorldClim
Bio9Mean temperature of driest quarter°C × 10WorldClim
Bio12Annual precipitationmmWorldClim
Bio13Precipitation of wettest monthmmWorldClim
Bio16Precipitation of wettest quartermmWorldClim
Bio18Precipitation of warmest quartermmWorldClim
Bio19Precipitation of coldest quartermmWorldClim
FORForest land%FAO
GRSGrass/scrub/woodland%FAO
NVGBarren/very sparsely vegetated land%FAO
UVB1Annual mean ultraviolet B (UVB)J·m−2·day−1glUV
UVB3Mean UVB of highest monthJ·m−2·day−1glUV
WATMapped water Bodies%FAO
Table 2. Area under the curve (AUC) and true skill statistic (TSS) values of the MaxEnt models.
SpeciesAUCTSS
Pinus armandii0.9780.954
P. bhutanica0.9990.997
P. dabeshanensis0.9970.995
P. fenzeliana0.9200.742
P. koraiensis0.9850.954
P. kwangtungensis0.9330.867
P. mastersiana0.9860.971
P. morrisonicola0.9860.971
P. pumila0.9210.746
P. sibirica0.9040.776
P. wallichiana0.9170.833
P. wangii0.9970.994
Table 3. Contribution of environmental variables 1 to the models of the Chinese white pines.
Species Bio1Bio2Bio3Bio4Bio6Bio9Bio12Bio13Bio16Bio18Bio19UVB1UVB3FORGRSNVGSum
Pinus armandiiPC 2 8.9 15.9 28.0 22.8 75.6
PI 3 22.4 5.658.1 2.8 88.9
JR 4
P. bhutanicaPC 6.2 29.9 41.28.8 86.1
PI 1.1 6.929.4 44.882.2
JR
P. dabeshanensisPC 9.429.5 22.0 12.8 73.7
PI 39.2 25.321.5 7.493.4
JR
P. fenzelianaPC 15.8 11.7 50.2 5.5 83.2
PI 56.9 3.125.3 3.3 88.6
JR
P. koraiensisPC 23 50.6 6.1 7.7 87.4
PI12.1 14.6 36.516.9 80.1
JR
P. kwangtungensisPC 11.8 17.9 8.047.5 85.2
PI 48.0 18.58.0 15.4 89.9
JR
P. mastersianaPC 7.2 68.88.3 5.7 90.0
PI 27.2 42.2 2.1 6.9 78.4
JR
P. morrisonicolaPC 3.2 9.6 73.78.2 94.7
PI 69.7 24.5 2.2 1.4 97.8
JR
P. pumilaPC 27.9 6.7 32.7 5.6 72.9
PI7.7 26.1 40.7 6.1 80.6
JR
P. sibiricaPC 26.09.817.5 21.3 74.6
PI33.3 19.619.2 6.5 78.6
JR
P. wallichianaPC 9.2 11.047.813.9 81.9
PI 8.5 3.6 46.130.0 88.2
JR
P. wangiiPC 11.9 29.28.9 9.7 59.7
PI 21.716.312.5 22.2 72.7
JR
1 Only the top four contributing variables for each species are displayed. 2 PC: percentage contribution (%). 3 PI: permutation importance (%). 4 JR: Jackknife of regularized training gain, roman numerals indicate the contribution ranks.
Table 4. Predicted suitable distribution areas (km2) of the 12 Chinese white pine species under the current climate, three past climate scenarios, and four future climate scenarios.
SpeciesLIG 1LGM 2Middle HoloceneCurrent3 RCP2.6-2050RCP2.6-2070RCP8.5-2050RCP8.5-2070
Pinus armandii1,602,309 1,573,767 1,537,343 1,419,288 1,211,267 1,194,878 1,171,996 1,174,323
P. bhutanica671,962 305,382 358,941 313,594 290,312 341,180 409,861 855,833
P. dabeshanensis2,827,499 214,861 679,427 321,788 361,667 224,635 603,663 343,420
P. fenzeliana544,757 270,364 940,659 814,809 882,309 1,059,409 923,541 1,116,198
P. koraiensis626,996 205,833 820,139 417,257 528,854 605,434 629,930 710,104
P. kwangtungensis767,725 203,646 1,101,770 878,107 892,812 943,802 969,809 919,878
P. mastersiana13,212 3767 16,441 20,903 13,490 16,042 12,760 12,222
P. morrisonicola21,389 3767 46,354 54,306 56,372 42,118 35,486 32,066
P. pumila830,642 758,993 1,369,757 878,524 979,444 959,705 949,496 975,416
P. sibirica318,229 845,121 364,184 347,743 448,055 473,351 296,337 417,187
P. wallichiana314,271 288,472 309,323 316,753 326,649 429,444 450,156 392,292
P. wangii86,198 239,392 140,382 189,010 166,302 408,368 288,750 271,910
1 LIG: Last Inter-glacial. 2 LGM: Last Glacial Maximum. 3 RCP: Representative Concentration Pathways.
Table 5. Proportions of actual presence points in China with different suitability ranks in the predicted potential distribution maps under the current climate and four future climate scenarios. (%)
SpeciesSuitability ranksCurrent1 RCP2.6-2050RCP2.6-2070RCP8.5-2050RCP8.5-2070
Pinus armandiiNot 5.72 13.68 11.44 15.42 19.40
Low12.44 17.16 16.92 18.41 20.15
Medium19.90 17.91 20.65 23.63 20.15
High61.94 51.24 51.00 42.54 40.30
P. bhutanicaNot 0.00 0.00 0.00 0.00 0.00
Low0.00 0.00 0.00 0.00 0.00
Medium0.00 0.00 0.00 0.00 0.00
High100.00 100.00 100.00 100.00 100.00
P. dabeshanensisNot 0.00 0.00 0.00 0.00 0.00
Low0.00 0.00 0.00 0.00 0.00
Medium20.00 20.00 20.00 0.00 10.00
High80.00 80.00 80.00 100.00 90.00
P. fenzelianaNot 3.85 0.00 0.00 3.85 3.85
Low19.23 26.92 15.38 19.23 19.23
Medium15.38 7.69 19.23 15.38 15.38
High61.54 65.38 65.38 61.54 61.54
P. koraiensisNot 6.25 0.00 0.00 0.00 0.00
Low37.50 18.75 0.00 0.00 6.25
Medium12.50 31.25 18.75 31.25 6.25
High43.75 50.00 81.25 68.75 87.50
P. kwangtungensisNot 1.61 1.61 1.61 1.61 9.68
Low6.45 9.68 4.84 4.84 8.06
Medium16.13 12.90 19.35 16.13 6.45
High75.81 75.81 74.19 77.42 75.81
P. mastersianaNot 0.98 0.98 0.98 2.94 1.96
Low1.96 4.90 4.90 11.76 15.69
Medium9.80 14.71 12.75 24.51 4.90
High87.25 79.41 81.37 60.78 77.45
P. morrisonicolaNot 0.00 0.00 1.41 1.41 1.41
Low1.41 4.23 1.41 0.00 7.04
Medium15.49 14.08 9.86 15.49 19.72
High83.10 81.69 87.32 83.10 71.83
P. pumilaNot 0.00 0.00 0.00 0.00 0.00
Low3.85 11.54 11.54 15.38 19.23
Medium23.08 19.23 19.23 30.77 7.69
High73.08 69.23 69.23 53.85 73.08
P. sibiricaNot 42.86 57.14 42.86 42.86 57.14
Low0.00 14.29 0.00 28.57 14.29
Medium14.29 14.29 14.29 28.57 0.00
High42.86 14.29 42.86 0.00 28.57
P. wallichianaNot 5.95 13.10 8.33 14.29 11.90
Low8.33 2.38 9.52 4.76 11.90
Medium13.10 7.14 8.33 16.67 8.33
High72.62 77.38 73.81 64.29 67.86
P. wangiiNot 0.00 0.00 0.00 0.00 0.00
Low0.00 0.00 0.00 50.00 25.00
Medium0.00 50.00 25.00 25.00 50.00
High100.00 50.00 75.00 25.00 25.00
1 RCP: Representative Concentration Pathways.

