Article

The Variation in Water Consumption by Transpiration of Qinghai Spruce among Canopy Layers in the Qilian Mountains, Northwestern China

1
Research Institute of Forest Ecology, Environment and Protection, Chinese Academy of Forestry, Key Laboratory of Forest Ecology and Environment of the State Forestry Administration of China, Beijing 100091, China
2
Academy of Water Resource Conservation Forests of Qilian Mountains in Gansu Province, Zhangye 734000, China
*
Author to whom correspondence should be addressed.
Forests 2020, 11(8), 845; https://doi.org/10.3390/f11080845
Submission received: 1 June 2020 / Revised: 20 July 2020 / Accepted: 3 August 2020 / Published: 4 August 2020
(This article belongs to the Section Forest Ecology and Management)

Abstract

:
It is important for integrated forest-water management to develop a better understanding of the variation of tree transpiration among different canopy layers in the forests and its response to soil moisture and weather conditions. The results will provide insights into water consumption by trees occupying different social positions of the forests. In the present study, an experiment was conducted in the Qilian Mountains, northwest China, and 13 trees, i.e., 4–5 trees from each one of dominant (the relative tree height (HR) > 1.65), subdominant (1.25 < HR ≤ 1.65) and intermediate-suppressed (HR ≤ 1.25) layers) were chosen as sample trees in a pure Qinghai spruce (Picea crassifolia Kom.) forest stand. The sap flux density of sample trees, soil moisture of main root zone (0 to 60 cm) and meteorological conditions in open field were observed simultaneously from July to October of 2015 and 2016. The results showed that (1) The mean daily stand transpiration for the study period in 2015 and 2016 (July–October), was 0.408 and 0.313 mm·day−1, and the cumulative stand transpiration was 54.84 and 40.97 mm, accounting for 24.14% (227.2 mm) and 16.39% (249.9 mm) of the total precipitation over the same periods, respectively. (2) The transpiration varied greatly among canopy layers, and the transpiration of the dominant and codominant layers was the main contributors to the stand transpiration, contributing 86.05% and 81.28% of the stand transpiration, respectively, in 2015 and 2016. (3) The stand transpiration was strongly affected by potential evapotranspiration (PET) and volumetric soil moisture (VSM). However, the transpiration of trees from the dominant and codominant layers was more sensitive to PET changes and that from the intermediate-suppressed layer was more susceptible to soil drought. This implied that in dry period, such as in drought events, the dominant and codominant trees would transpire more water, while the intermediate-suppressed trees almost stopped transpiration. These remind us that the canopy structure was the essential factor affecting single-tree and forest transpiration in the dryland areas.

1. Introduction

Transpiration is an important component of water consumption from vegetated ecosystems worldwide and usually accounts for a large proportion of water consumption [1,2,3,4,5], especially for forest ecosystems in the water-limited arid regions such as northwest China [5,6]. Under the decade-long rising stresses of climate warming [7,8], water resource shortage has strengthened due to the increasing frequency and intensity of drought events [9,10,11], and a high forest coverage due to human activities [12,13], the water consumption conflict between increasing demand of forests and limited water supply is becoming increasingly prominent [14,15]. Therefore, quantifying water consumption by forest transpiration is critical for water resource and forest management, especially in the water-limited arid regions.
The difference of forest structure and the heterogeneity of the forest stand, such as the tree size [16,17,18,19], the tree dominance [16,20,21,22], the canopy overlapping [23], competition [17,22,24], and the shaded terrain and the slope position [5], would affect the sap flow density of individual trees, and further affect the transpiration of individual tree and the entire forest. However, the effects of these differences on forest transpiration was not given sufficient attention and thus forest transpiration was usually estimated by multiplying the mean sap flux density of a certain number of sample trees by the stand sapwood area [4,5,16]. This lead the situation that the variation of tree transpiration among canopy layers, i.e., among social positions in the forest, is still unclear.
Transpiration is primarily controlled by the atmospheric and soil factors [4]. The atmospheric factors include net radiation, air temperature, air humidity, wind speed and vapor pressure, whose effects on evapotranspiration can be composed as potential evapotranspiration (PET) [4,5,13,16]. The soil factors are usually represented by the volumetric soil moisture (VSM) or relative extractable soil water of the main root zone [4,6,13]. Generally speaking, the hydrological process of stand transpiration is driven by the potential evapotranspiration, but it was limited by the soil moisture, especially in the water-limited areas [4,25]. Until now, quantifying tree transpiration from different layers and its relation to potential evaporation and soil moisture was an open topic in forest hydrology.
In the arid northwestern region of China, the Qilian Mountains are a key nourishing and cherished water source area, feeding the Shiyanghe, Shulehe, and Heihe rivers. Qinghai spruce (Picea crassifolia Kom.) is the dominant tree species of natural forests in this region, growing on shaded or semi-shaded slopes with elevations of 2500 to 3300 m [26,27,28], and it has obviously different canopy layers in vertical [21]. The previous studies found that tree transpiration accounts for a large proportion of the water consumption in the Qinghai spruce forest, e.g., approximately 74% of the total precipitation in 2011 and 2012 [6,29]. Mean daily sap flow density of Qinghai spruce of each canopy layer was significantly correlated with solar radiation, vapor pressure deficit, and air temperature rather than one of them, and it was mainly affected by solar radiation [21]. However, we do not yet have a clear understanding of the variation of transpiration of Qinghai spruce among canopy layers and how weather conditions and soil moisture changes affect transpiration at canopy layer and stand levels.
Consequently, we focused on (a) revealing the transpiration of the Qinghai spruce forest and its variation among canopy layers; (b) which environmental factors controlled transpiration at canopy layer and stand levels. To achieve these objectives, we selected a 45- to 115-year-old Qinghai spruce forest plot in the Pailugou watershed, located in the Qilian Mountains, Northwest China. Sap flow density, meteorological factors and soil moisture were measured synchronously and continuously in the field from July to October 2015 and 2016. The results will promote the explanation of water consumption by transpiration differences among canopy layers and provide scientific supports for forest water management in the dryland areas.

2. Materials and Methods
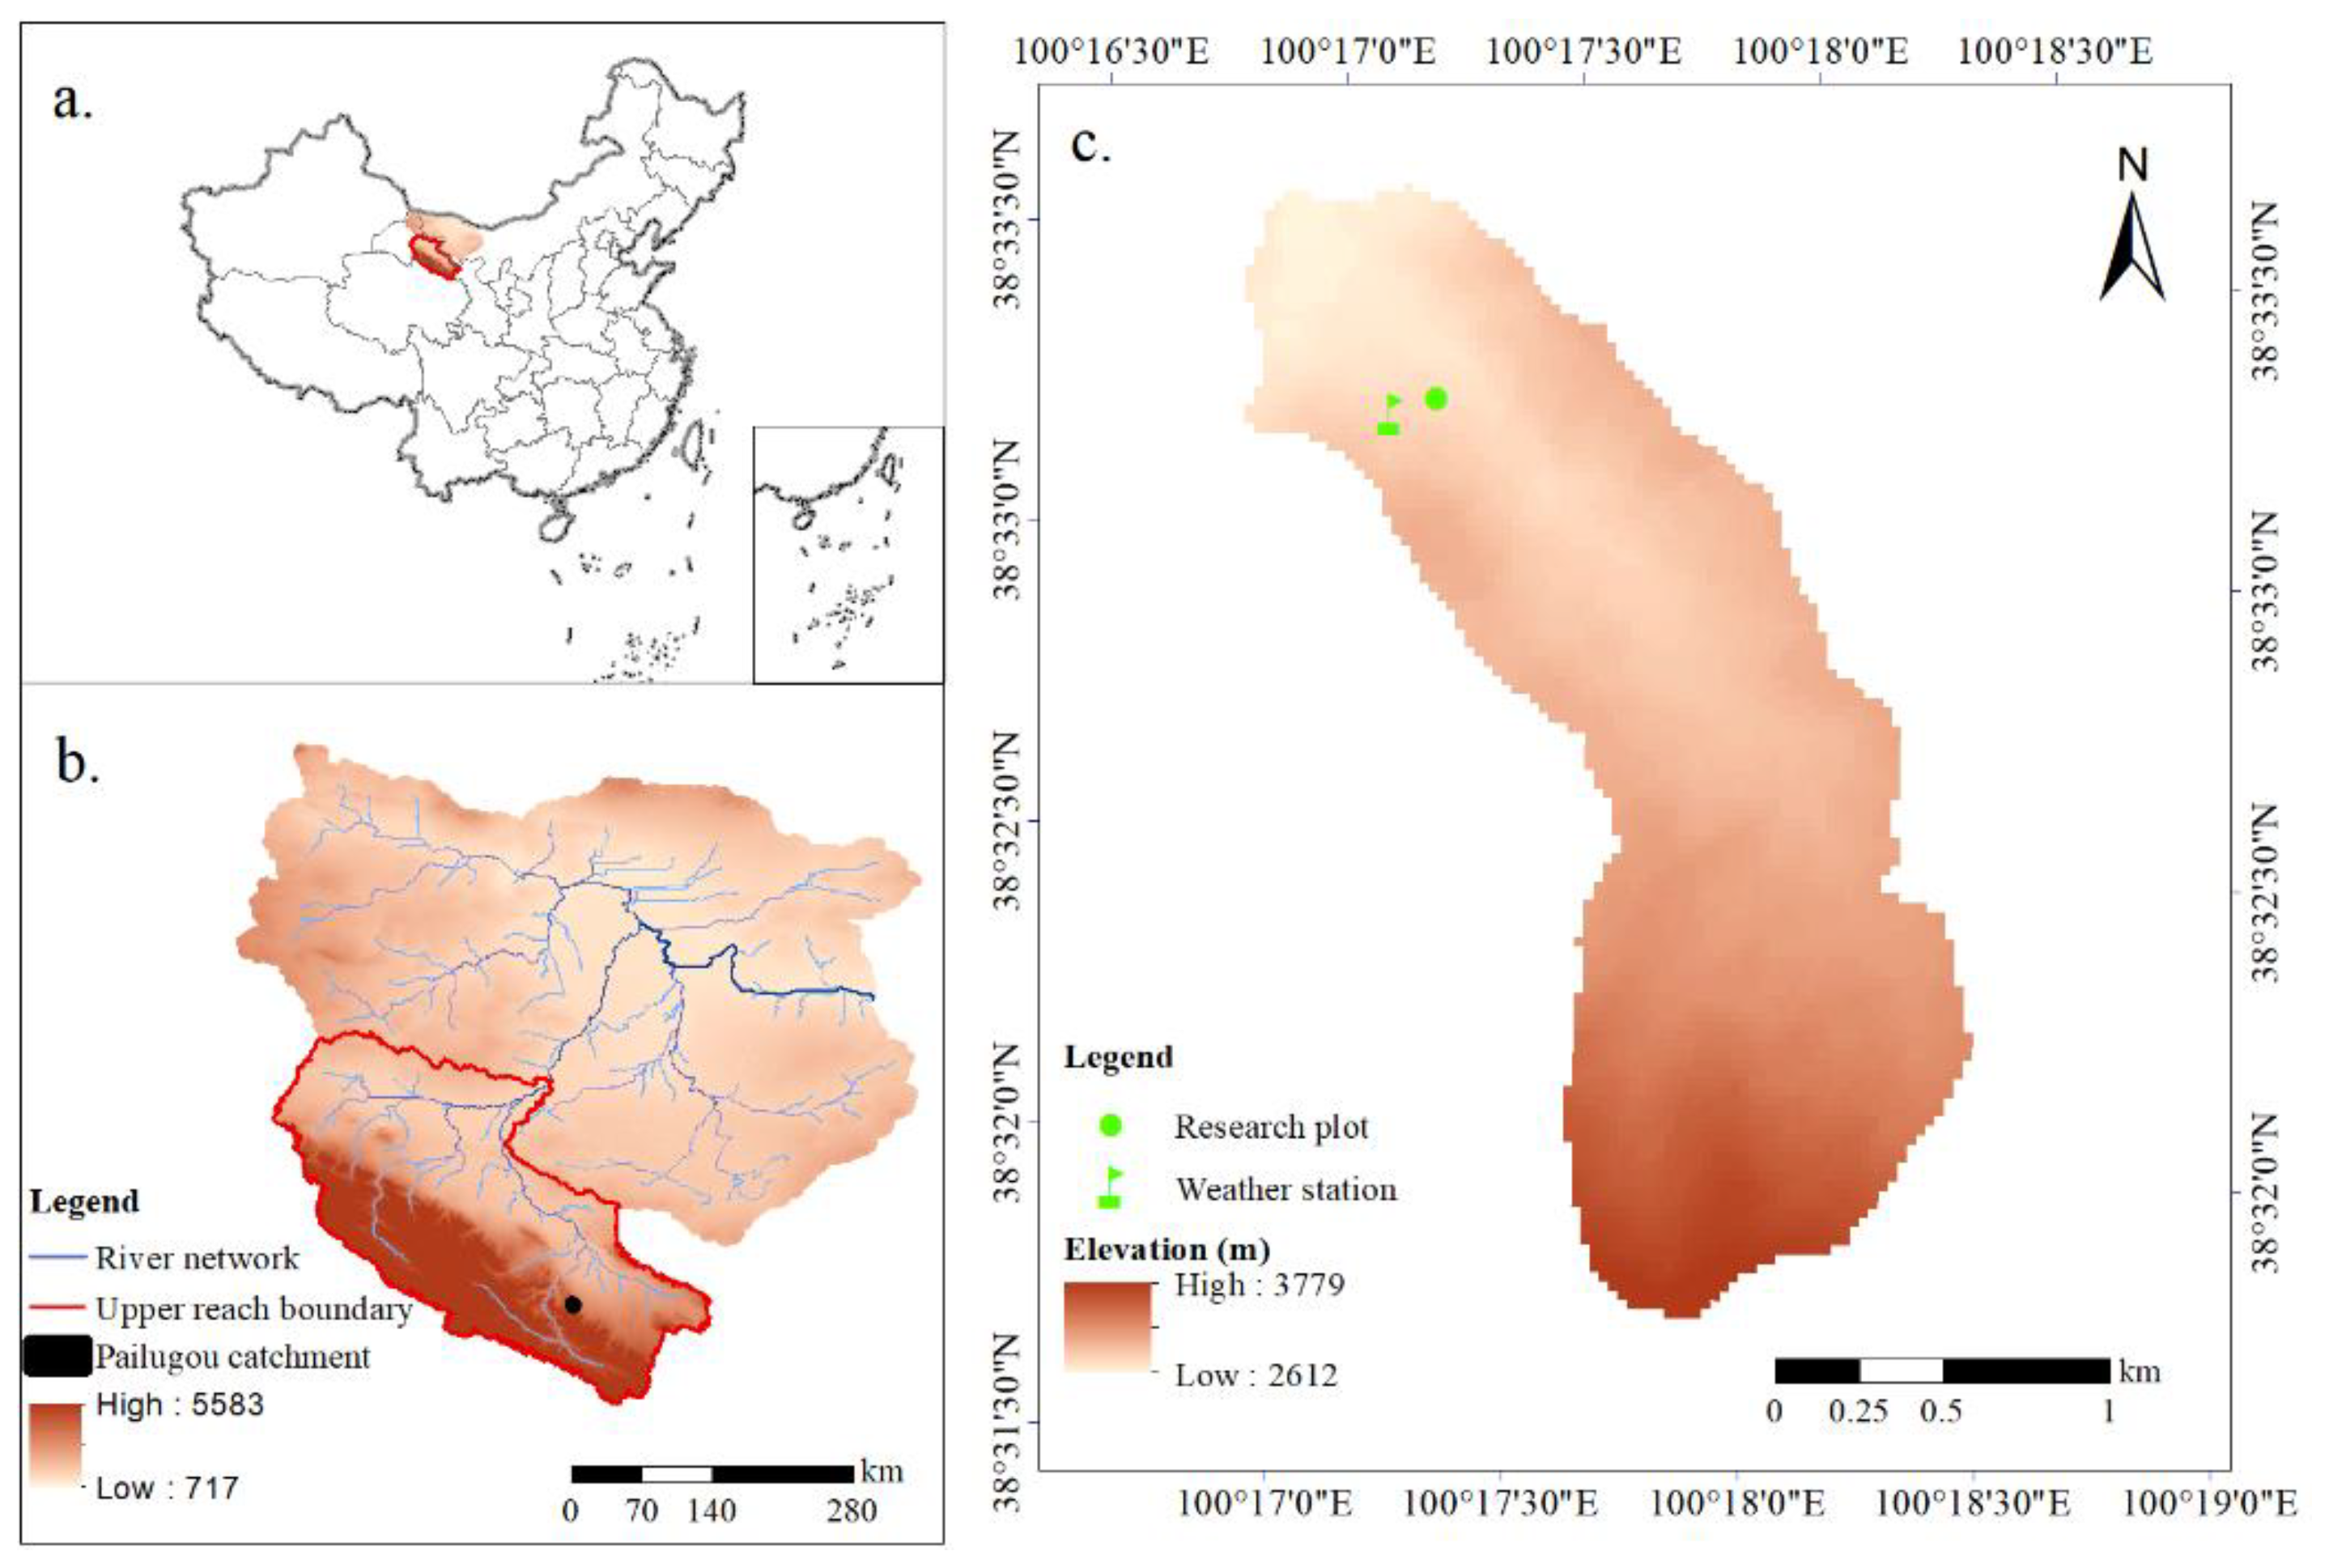
2.1. Study Area

The study was performed in the Pailugou watershed (38°31′–38°33′ N, 100°16′–100°18′ E), located in the middle part of the Qilian Mountains, in the upper Heihe River basin of arid Northwest China (36°43′–39°36′ N, 97°25′–103°46′ E) (Figure 1). The watershed had an area of 2.85 km2 and an elevation range of 2500 to 3800 m a.s.l. According to meteorological data from the Xishui station at an elevation of 2600 m, from 1994 to 2014, the mean annual air temperature was 1.6 °C. The mean annual precipitation was 435.5 mm, with rainfall mainly occurring from June to September (60.0% of the annual total rainfall). The basin evaporation was 1081.7 mm. The mean annual sunshine duration was 1892.6 h·a−1. The mean annual relative humidity was 60% [26,28].
In the Pailugou watershed, along the elevation gradient, the vegetation types are mountain forest grasslands, subalpine shrub meadows, and alpine meadows, respectively. The corresponding soil types are chestnut soil, grey cinnamon soil, subalpine shrub meadow soil, and alpine meadow soil, respectively [26]. The dominant tree species of mountain forest is Qinghai spruce (Picea crassifolia Kom.), which is distributed only on shaded (north-facing) or semi-shaded (northwest- and northeast-facing) slopes at elevations from 2500 to 3300 m a.s.l. Shrubs community consist mainly of Caragana jubata (Pall.) Poir., Potentilla fruticosa L., Berberis diaphana Maxim. Herbaceous vegetation consists mainly of Carex lanceolata Boott, Pedicularis spp., Stipa capillata.

2.2. Research Plot

In 2015, a 25 × 50 m2 plot was set up in a pure spruce plot (38°33′12.6″ N, 100°17′7.9″ E; 2762 m a.s.l.), located on a northwest-facing slope with a slope gradient of 27° (Figure 1c). The forest in the plot consisted of Qinghai spruce ranging from 45 to 115 years in age [27]. The canopy density, i.e., the ratio of the total projected area of all trees to the total stand area, was 0.55. The tree density was 1120 trees·ha−1. The tree height (H) ranged from 5.0 to 24.3 m, with an average of 10.6 ± 5.6 m. The tree diameter at breast height (DBH) ranged from 5 to 48 cm, with an average of 15.3 ± 9.1 cm. The canopy width ranged from 1.4 to 6.7 m, with an average of 3.6 ± 1.1 m. The leaf area index (LAI) ranged from 2.53 to 3.96 during the growing season (May–October), using the plant canopy analyzer (LAI-2200C, Li-Cor Inc., Lincoln, NE, USA).
The vegetation overstory was composed of only Qinghai spruce trees in the plot, but it had different canopy layers in vertical direction, i.e., different social positions for trees in the forest. Based on the relative tree height (HR), that was, the ratio of the height of each tree to the average tree height in the plot [20,30,31,32], all 140 Qinghai spruce trees in this research plot were divided into three layers in the vertical direction, i.e., the dominant (HR > 1.65), codominant (1.25 < HR ≤ 1.65) and intermediate-suppressed layers (HR ≤ 1.25). The dominant layer, the top canopy layer, was composed of dominant trees, which were defined as the tallest trees in the plot. The codominant layer, the second canopy layer, was composed of codominant trees, which constituted a group of similar trees whose tree height were slightly lower than dominant trees. The intermediate-suppressed layer, the third canopy layer, was composed of intermediate and suppressed trees, which were located under larger trees, and their crowns were mostly or totally overlapped by neighboring crowns [30,31,32].
Trees from the dominant layer were the tallest trees in the plot, with an average tree height of 18.1 ± 2.9 m. There were 21 dominant trees, with only 15% of all trees in the plot, but their total sapwood area was 8735.32 cm2, accounting for 41.7% of the total plot sapwood area. The average tree height of the codominant and intermediate-suppressed layers was much smaller than that of the dominant layer, with decreases of 4.2 and 11.4 m, respectively. The number of the intermediate-suppressed layer trees was the largest, 84 trees, 4 times that of the dominant layer, but the total sapwood area was the smallest, with a value of 5455.45 cm2, accounting for 26.1% of the total plot sapwood area (Table 1).
According to the relationship between the sapwood area and tree diameter at breast height (DBH) [6] in this Qinghai spruce stand, the sapwood area (As, mm2) per Qinghai spruce tree was accurately calculated using Equation (1):
A S = 12655.61 × e DBH / 226.72 13306.78   ( R 2 = 0.99 )
where DBH (mm) is the tree diameter at breast height.
According to the relationship between the leaf area and DBH and tree height (H) [33] in this research area, the leaf biomass (WL, kg) per Qinghai spruce tree was calculated using Equation (2):
W L = 0.265 × ( DBH 2 × H ) 0.470   ( R 2 = 0.86 )
The dominant shrub in the plot was mainly Potentilla glabra Lodd., and the average height was 0.65 ± 0.05 m at a coverage of approximately 4%. The herbaceous vegetation was mainly Carex lanceolata Boott, and the average height was 5.8 ± 2.2 cm at a coverage of approximately 17%. Moss covered the forest floor, which was Abietinella abietina, and the average thickness was 8.4 ± 3.1 cm, while the coverage was approximately 30%.
The soil in the plot was thick and highly permeable, with an average soil thickness of 70 cm. The soil type was mountainous grey cinnamon soil and its texture was loam, with sand content of 34%, a total soil porosity of 71.2%, and a bulk density of 0.83 g·cm−3 in the root zone (0 to 60 cm soil layer) [28,34]. Within the 0 to 60 cm root zone, the saturation moisture content was approximately 0.69 m3·m−3 and the field capacity was approximately 0.58 m3·m−3 [28,34].

2.3. Sap Flow Measurement and Transpiration Calculation

In order to describe the variation in transpiration among different canopy layers in a Qinghai spruce plot, four or five representative trees (i.e., healthy, average shape) from each canopy layer were chosen as sample trees according to the percent of total sapwood area of each canopy layer in the plot, which characters varied with the diameter at breast height (DBH) from 10 to 38 cm, the tree height from 6.1 to 20.5 m, the canopy width from 2.4 to 6.7 m, the canopy thickness of the difference between the tree height and the height of the first live branch from 4.0 to 15.3 m, the sapwood area from 6741 to 53,396 mm2, and the leaf biomass from 5.67 to 32.06 kg (Table 2).
The sap flow density of thirteen sample trees was measured at breast height (1.3 m above ground level) using thermal diffusion probes (SF-L, Ecomatik, Munich, Germany) consisting of four sensors that were 20 mm in length and 2 mm in diameter (S0, a heated sensor powered by a constant current at a voltage of 12 V; S1, an unheated sensor; and S2 and S3, reference sensors). These sensors were inserted into the outer 20 mm of the xylem at breast height on the north-facing side of trunks (not the sun-exposed side). Before insertion, the outer bark was peeled off, and each probe was coated with silicone gel to ensure good thermal contact between the probe elements and sapwood. After insertion, the exposed cambium was covered with silicone gel to reduce evaporation from the wood surface and then covered with aluminum foil to avoid physical damage and thermal influences from solar radiation. Data were recorded by a data logger (DL2, Delta-T Devices, Cambridge, UK) every 10 min.
The sap flow density (Js, mL·cm−2·min−1) (flow per unit of sapwood area) of an individual sample tree was calculated by Equations (3) and (4) [4,13]:
J s = 0.714 × ( d tmax d tact 1 ) 1.231
d tact = T 1 0 T 1 2 + T 1 3 2
where dtact is the difference in instantaneous temperature (°C) between the heated and reference sensors; dtmax is the value of dtact at which the sap flow density is nil or near zero; and T1–0, T1–2, and T1–3 are the temperature differences between sensors S1 and S0, S1 and S2, and S1 and S3, respectively.
The azimuthal variation in sap flux density of each tree was related with tree crown architecture [35] and crown exposure to the sun [36,37], both of which were thought to be closely related to the canopy density [5]. When the canopy was highly closed, the azimuthal variation in sap flux density was thought to be negligible [5]. In this study, highly closed forests (with canopy densities of 0.55) was chosen as research plot, thus we assumed the azimuthal variation was small for each tree.
For Qinghai spruce trees, their sapwood depth normally was less than 40 mm and its sap flow density varied with sapwood depth by the Gaussian distribution function with a peak at the depth of 20 mm [29]. In this study, our probes were only 20 mm long, which could not measure the sap flow density within the sapwood deep exceeding 20 mm [13]. Thus, the Js in the 20 to 40 mm was calculated by Gaussian regression equation (Equation (5)) [29].
J s = 107.54 + 654.77 6.72 π / 2 e 2 ( d 20.09 ) 2 45.16
where d (mm) is sapwood depth from the cambium, and Js (Kg·day−1) is daily sap flow density at d mm depth in the sapwood.
To quantify the daily and monthly variation in transpiration among canopy layers, the daily transpiration (Fi, mm·day−1) of each canopy layer per unit area was calculated by Equation (6):
F i = J ci × A ci S × 60 × 24 × 1000
where Jci (mL·cm−2·min−1) is the average Js value of the sample tree of canopy layer i, with i = 1, 2 or 3, representing the dominant, codominant and intermediate-suppressed layers, respectively; Aci is the cumulative sapwood area of all trees in canopy layer i in the plot; and S (cm2) is the projected area of the plot.
The daily stand transpiration (T, mm·day−1) per unit area was calculated by Equation (7):
T = i = 1 4 F i
Qinghai spruce trees began growing on approximately 25 May 2015 and 20 June 2016, and ended growing on approximately 21 August 2015 and 14 September 2016 [28]. The better observation on transpiration should be carried on the whole growing season (May–October). Unfortunately, we could not collect the data throughout the whole growing season, although we carried out the observation in two growing seasons, since the thermal diffusion probes did not work and record the data on the early period of growing season. This may be due to that the lower temperature leaded to the unstable electricity supply and worse data. Therefore, the whole experiment was conducted from July to October of 2015 and 2016.

2.4. Weather and Soil Moisture Measurements

In 2015 and 2016 (July–October), solar radiation (Li200X, Rs (W·m−2)), air temperature (HMP115A, T (°C)), relative humidity (HMP45A, Rh (%)), precipitation (TE525MM, P (mm)) and wind speed (010C, U (m·s−1)) recorded every 10 min with an automatic meteorological station (CR3000, Campbell Scientific Inc., USA) located in an open area, approximately 50 m away from the research plot.
The vapor pressure deficit (VPD, kPa) was calculated from air temperature (T, °C) and relative humidity (Rh, %) using Equation (8) [38]:
VPD = 6.10 × e 17.08 × T T + 234.2 × ( 100 R h 100 )
According to the Food and Agriculture Organization of the United Nations (FAO) Penman–Monteith equation, the daily potential evapotranspiration (PET, mm·day−1), as a comprehensive meteorological index of many weather parameters (air temperature, solar radiation, VPD, and wind speed), can reflect the evaporative demand determined by the air conditions and available energy and thus has an important effect on transpiration [13]. The daily PET was used to estimate by using the Equation (9) [39]:
PET = 0.408 Δ ( R n G ) + γ 900 T + 273 U ( e s e a ) Δ + γ ( 1 + 0.34 U )
where Δ (kPa·°C−1) is the slope of the vapor pressure versus temperature relationship; Rn (MJ·m−2·day−1) is the net radiation; G (MJ·m−2·day−1) is the soil heat density; γ (0.053 kPa·°C−1) is the psychrometric constant; T (°C) is the mean air temperature; U (m·s−1) is the wind speed; es (kPa) is the saturation vapor pressure; and ea (kPa) is the actual vapor pressure.
In 2015 and 2016 (July–October), the volumetric soil moisture of main root zone (the 0 to 10 cm, 10 to 20 cm, 20 to 40 cm, and 40 to 60 cm soil layers) was continuously monitored at a single location by using soil moisture sensors (5-TE, Decagon, Pullman, WA, USA). Data were collected every 10 min by a data logger (EM50, Decagon, Pullman, WA, USA). Finally, we calculated the mean volumetric soil moisture of the 0 to 60 cm soil layer (VSM1, m3·m−3).
Due to the lack of facilities, nine points were evenly distributed within the plot at fixed positions to revise VSM1. Soil samples were collected at each point with a time interval of approximately 10 days, by using an aluminum box with a volume of 100 cm3, from the 0 to 10 cm, 10 to 20 cm, 20 to 40 cm, and 40 to 60 cm soil layers, to calculate the mean volumetric soil moisture of the 0 to 60 cm soil layer (VSM, m3·m−3). Based on these data, VSM was estimated by using the following relationship (Equation (10)):
VSM = 2.239 × VSM 1 0.1035   ( R 2 = 0.96 ,   n = 12 ,   and   P < 0.01 )

2.5. Data Analysis

In this study, the stand transpiration was calculated based on the cumulative transpiration of the four canopy layers, and the transpiration of each canopy layer was calculated based on the sapwood area and the measured sap flow density. The transpiration response to PET and volumetric soil moisture (VSM) were analyzed on daily basis using the measured data. The transpiration model was determined by polylinear regression analysis using the Statistical Product and Service Solutions (SPSS) version 21.0 (IBM Inc., Chicago, IL, USA).
The whole experiment was conducted from July to October of 2015 and 2016. Unfortunately, we could not collect the whole data in this period since the equipment abruptly failed and unstable electricity supplied. Therefore, to calculate the daily and monthly cumulative transpiration, the missed data was reasonably interpolated by the linear relationship between daily transpiration of each canopy layer and daily potential evapotranspiration (PET) built in this study (Table 3).
To determine the impact of soil moisture limitations on transpiration, we divided VSM into two groups (VSM ≥ 0.21 m3·m−3 and VSM < 0.21 m3·m−3). VSM = 0.21 m3·m−3 was the threshold value, which was determined based on the deviation from linearity of the relationship between PET and stand transpiration. Well-watered soil conditions occurred when VSM was more than 0.21 m3·m−3, while water-limited soil conditions occurred when VSM was less than 0.21 m3·m−3.
The different transpiration responses to PET and VSM among the canopy layers were analyzed on a daily basis. The standardized coefficients of the regression equation [40,41] could reflect the important degree of transpiration response to environmental factors. In addition, the larger the standardized coefficients was, the stronger the relationship between transpiration and environmental factors was [42].
To further examine the impact of soil moisture on transpiration in the period under water-limited soil conditions, we defined the reduction in transpiration as follows (Equation (11)):
Reduction = 1 F i f ( PET )
where Fi (mm·day−1) is the daily measured transpiration of canopy layer i per unit area, with i = 1, 2, or 3, representing the dominant, codominant and intermediate-suppressed layers, respectively; f (PET) is the simulated transpiration based on the fitted linear line of the daily mean transpiration for each canopy layer (Fi) versus the daily mean PET in the period of well-watered soil conditions and rainy days.

3. Results

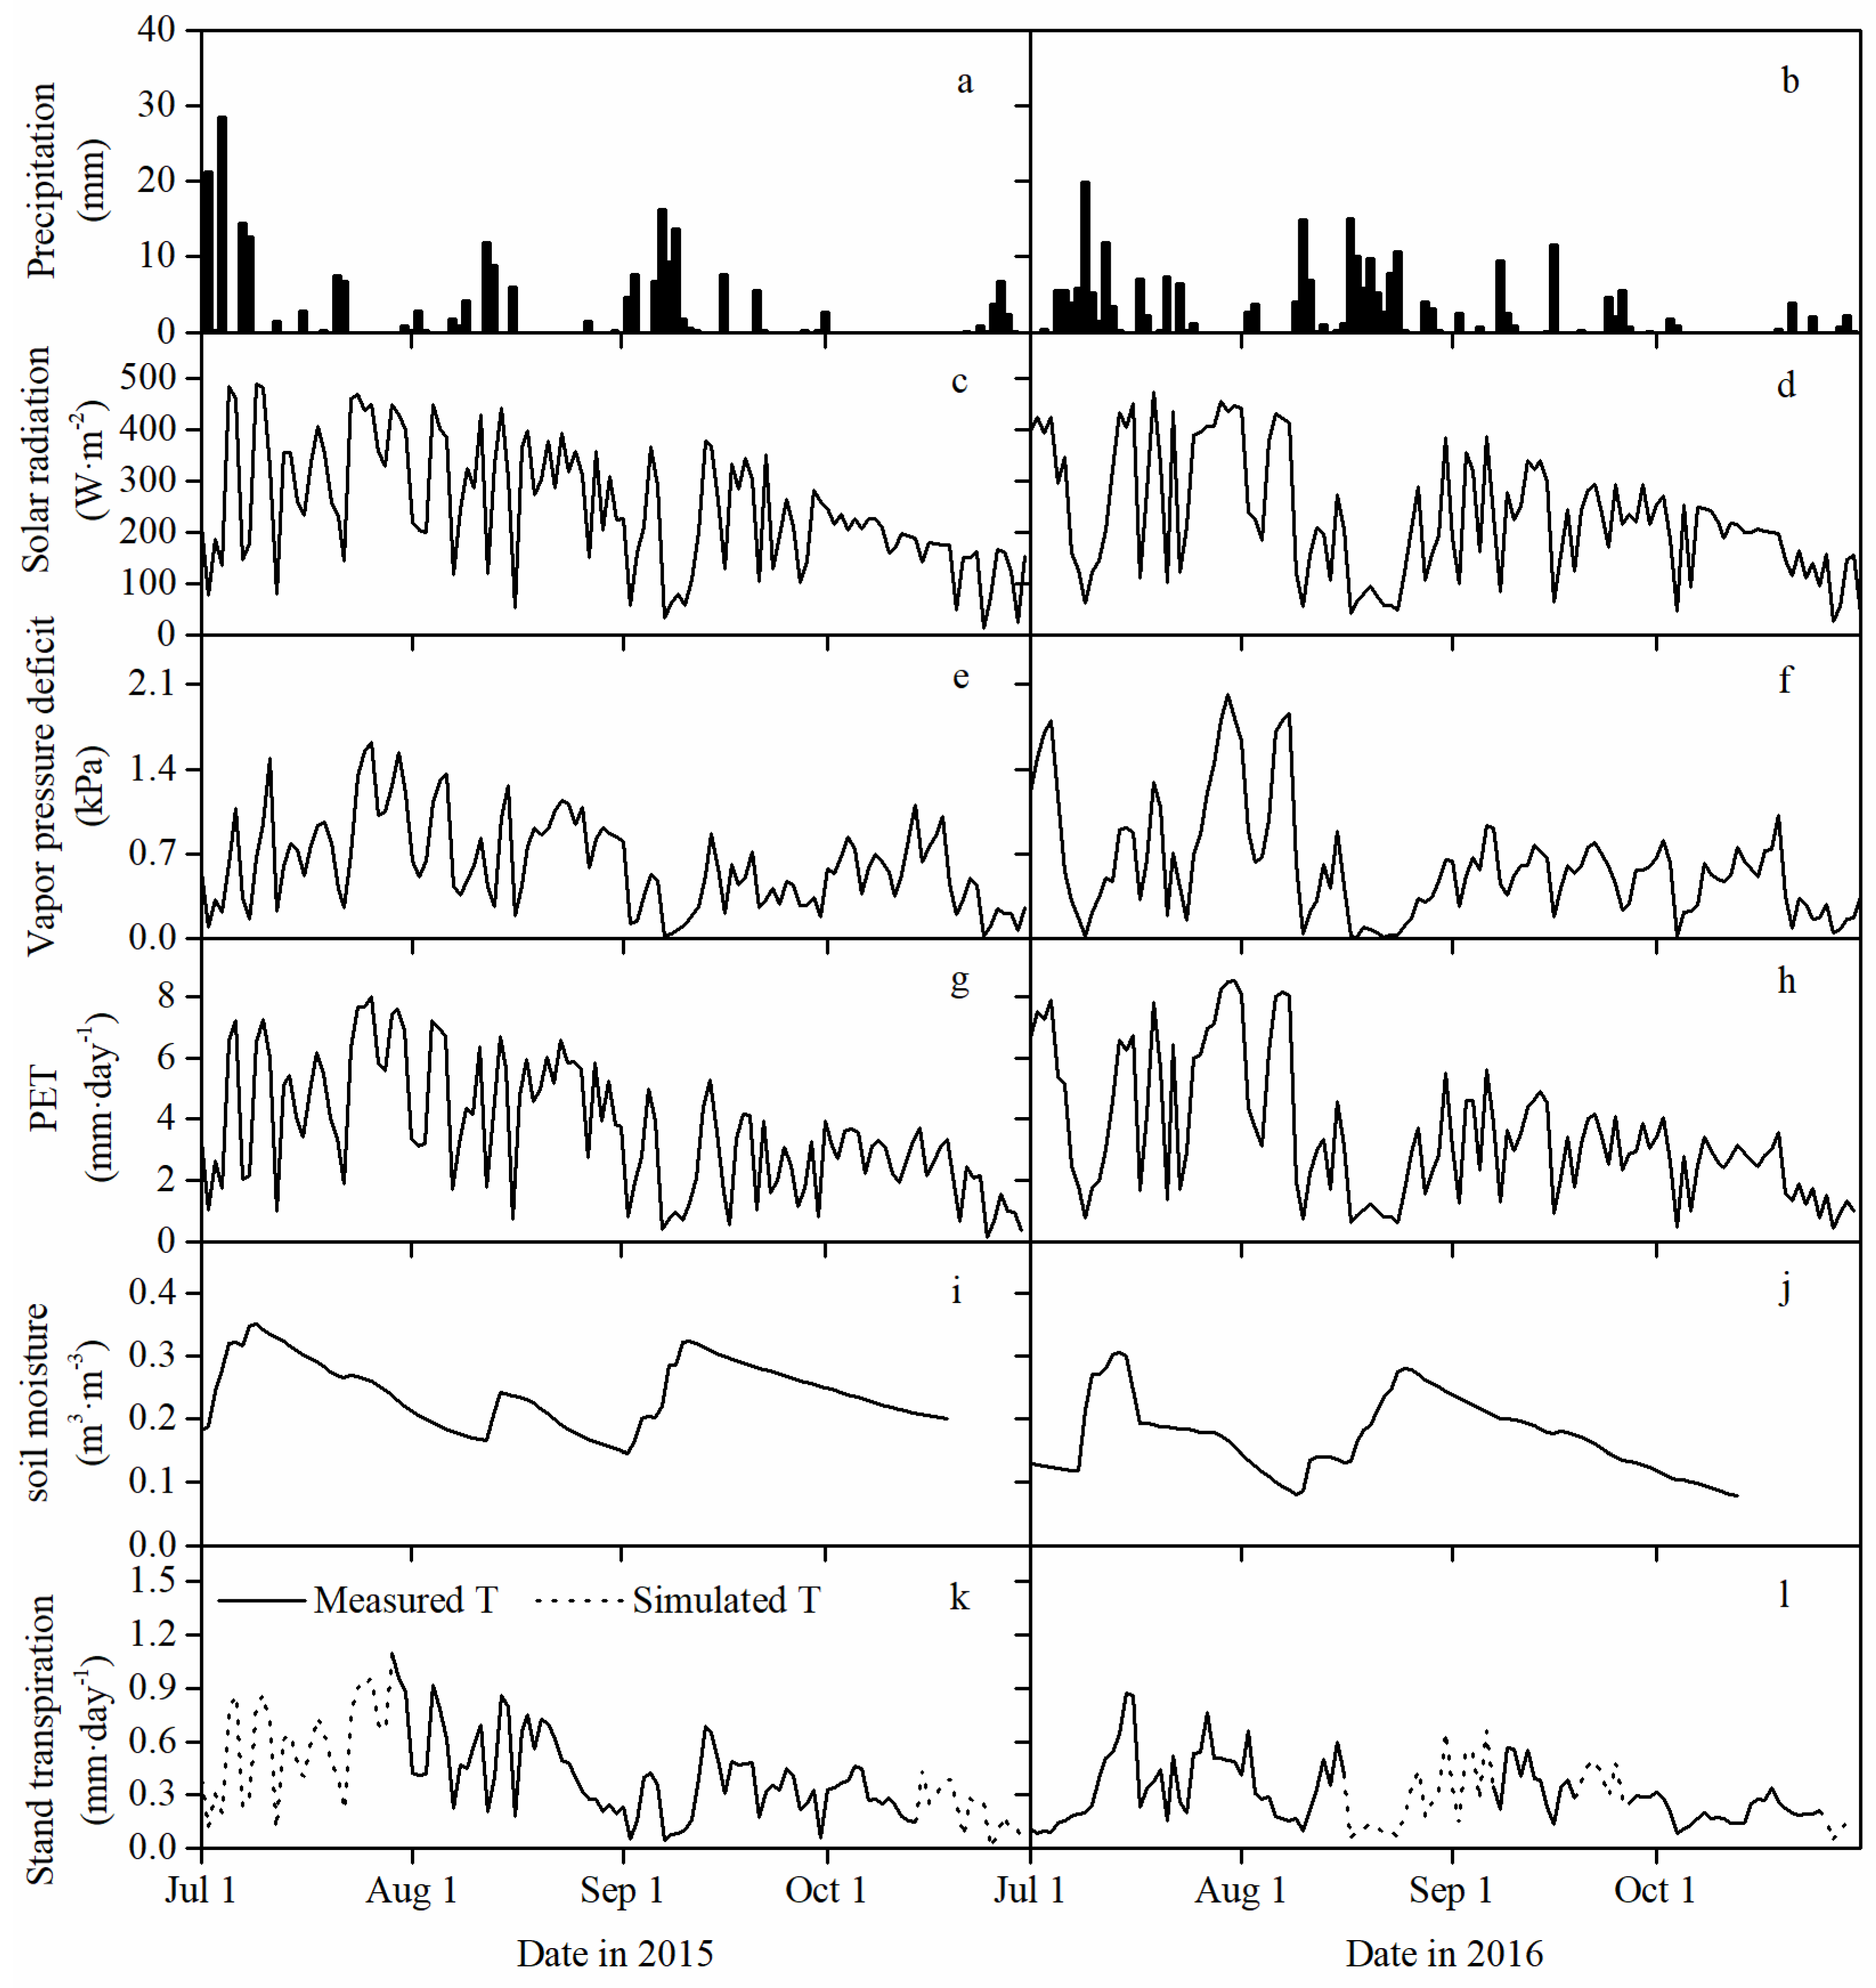
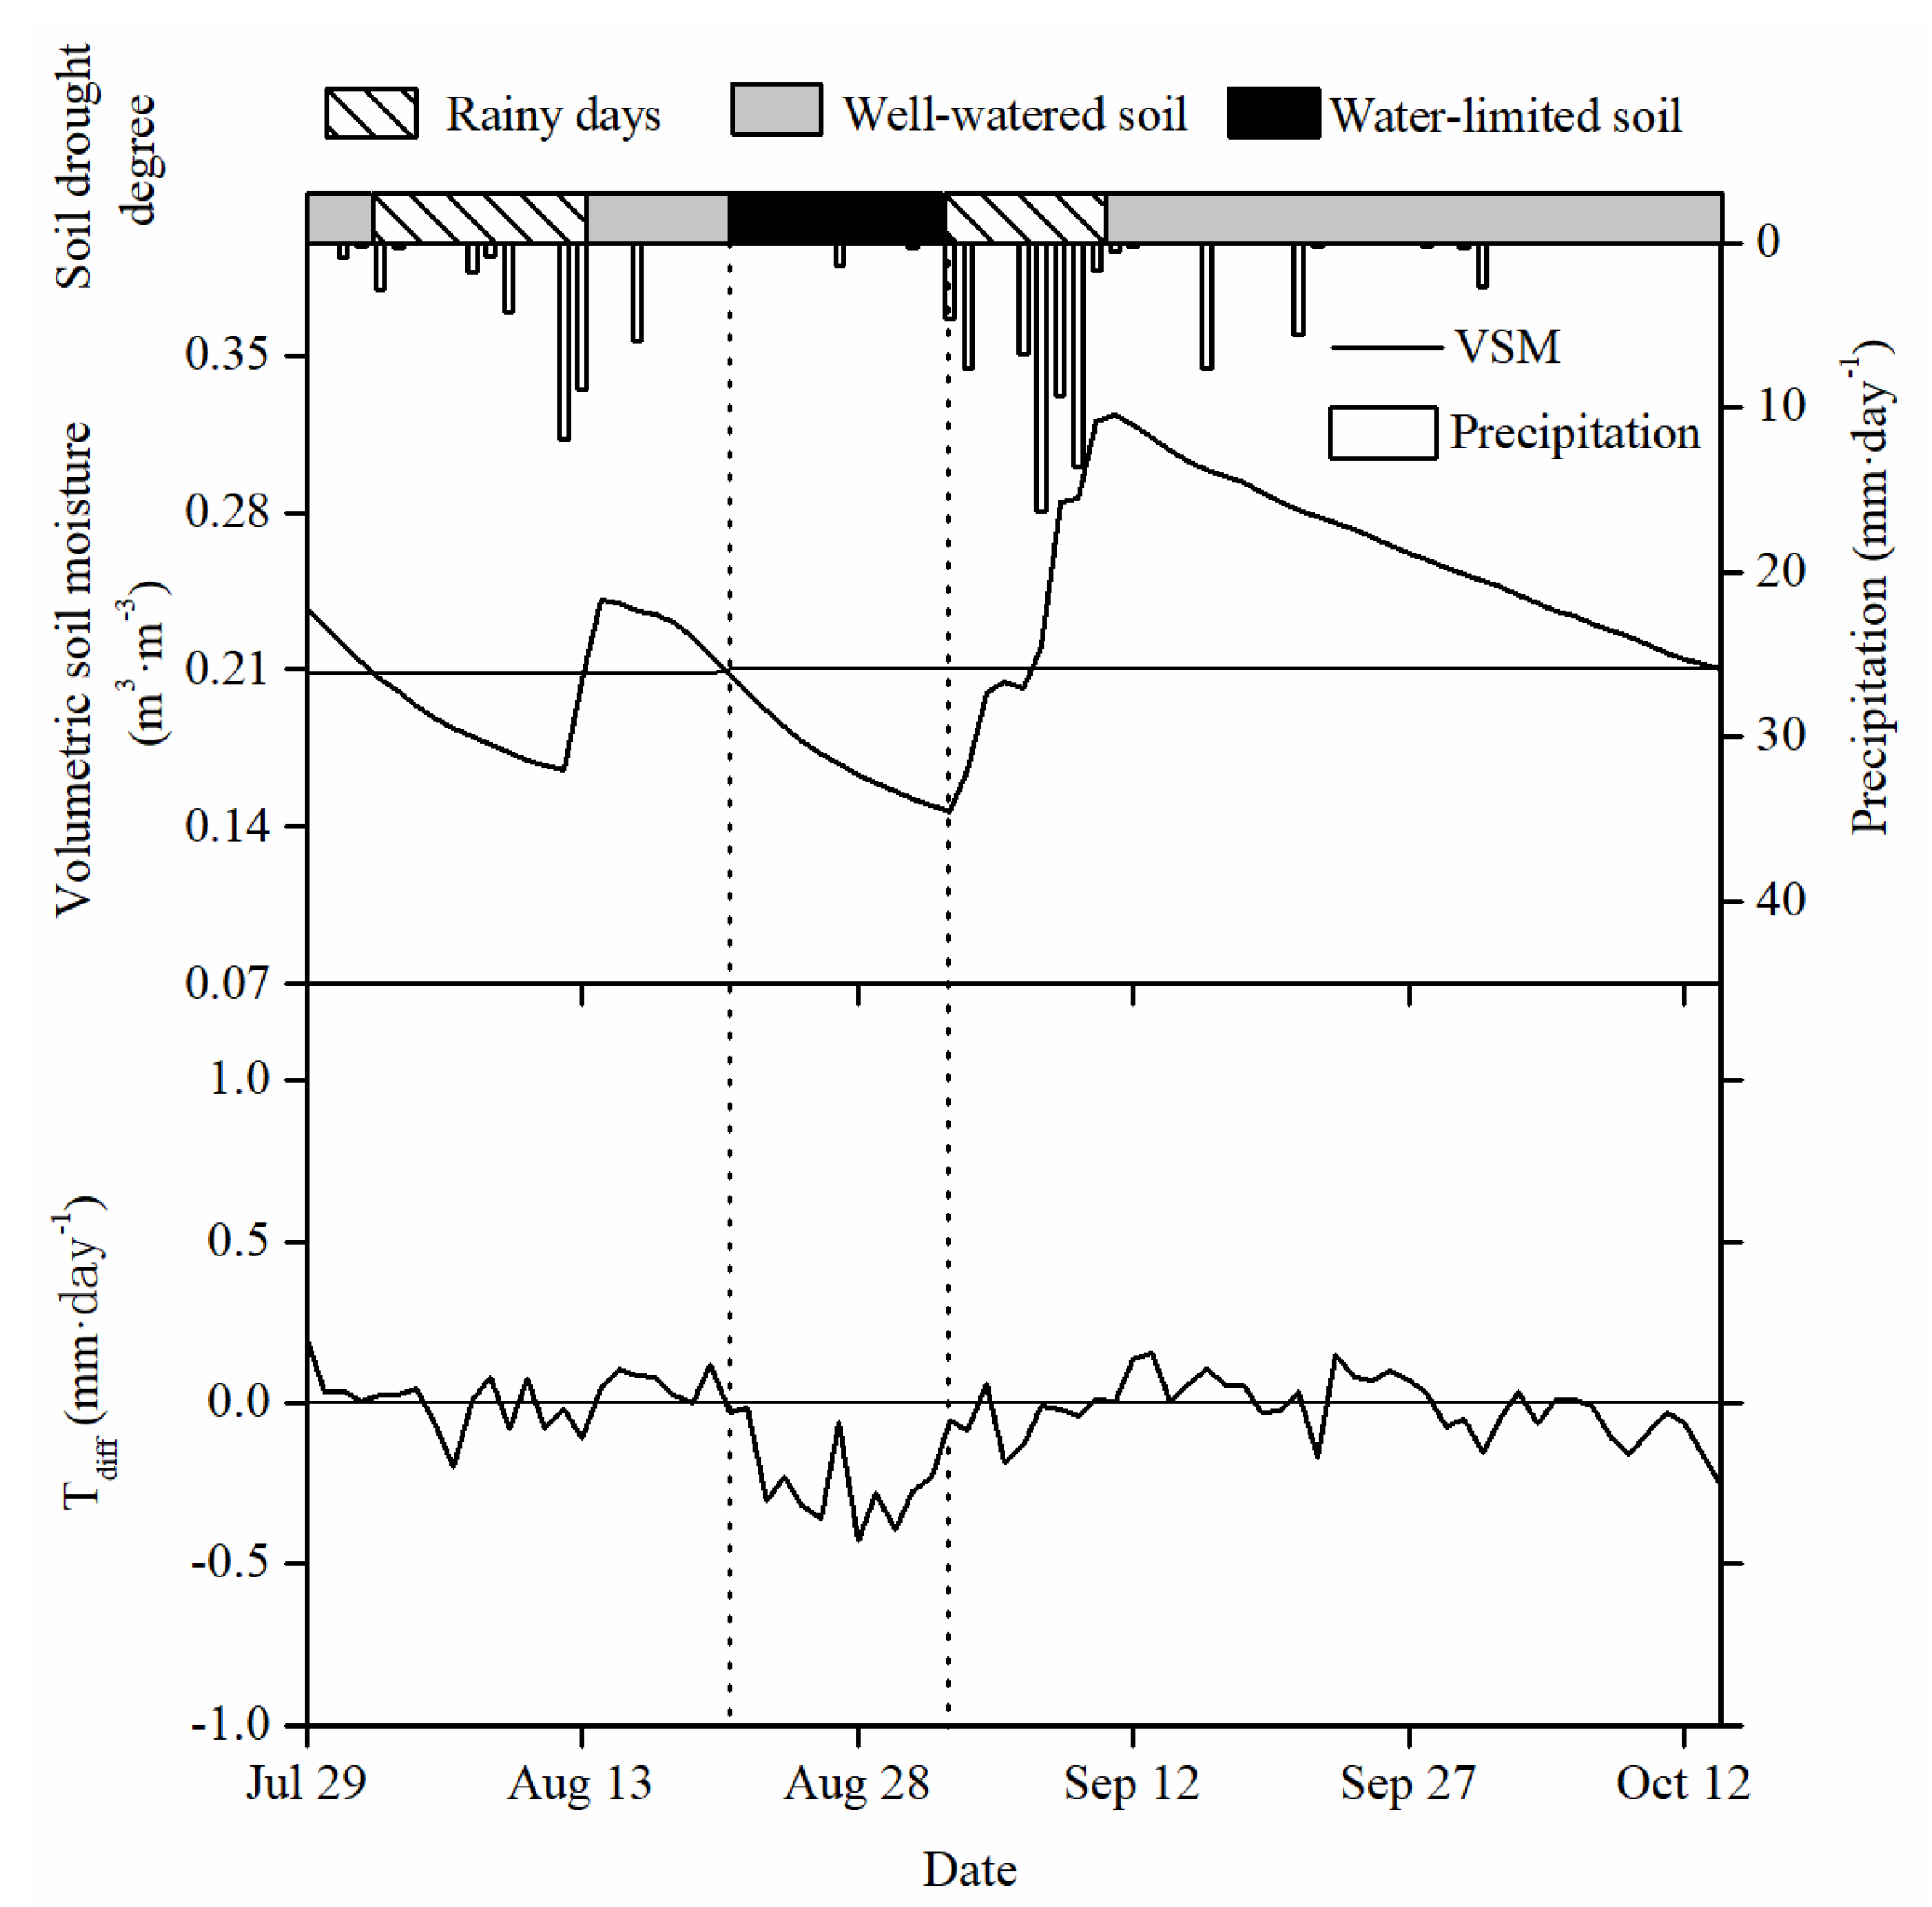
3.1. Environmental Characteristics during the Growing Season

In the Pailugou watershed, precipitation variability was high from July to October of 2015. There were 45 rainy days with a total precipitation of 227.2 mm, of which 82.2% of rainy days was less than 10 mm·day−1. Rainy days occurred mainly from 1 to 8 July, from 1 to 13 August, and from 2 to 11 September, with a total precipitation of 77.5, 31.0 and 60.4 mm, respectively (Figure 2a). However, precipitation was distributed more evenly from July to October of 2016. There were 60 rainy days with total precipitation of 249.9 mm in 2016 (July–October). 86.7% of the rainy days occurred mainly from July to September (Figure 2b).
There was enough sunshine and PET from July to October of 2015 and 2016. The daily mean solar radiation intensity varied in the ranges of 13.5–490.3 W·m−2 and 27.7–474.6 W·m−2, with averages of 249.9 and 231.2 W·m−2, respectively (Figure 2c,d). The mean vapor pressure deficit varied in the ranges of 0.02–1.63 kPa and 0.01–2.02 kPa, with averages of 0.62 and 0.60 kPa, respectively (Figure 2e,f). The daily mean PET varied in the ranges of 0.15–8.01 mm·day−1 and 0.45–8.53 mm·day−1, with averages of 3.65 and 3.46 mm·day−1, respectively, in 2015 and 2016 (Figure 2g,h).
Soil moisture violently fluctuated with the occurrence of rainfall events. The mean volumetric soil moisture of the 0 to 60 cm soil layer ranged from 0.146 to 0.350 m3·m−3, with an average of 0.242 m3·m−3 from 1 July to 19 October in 2015, but it remained at a low level in August, with a range of 0.152–0.241 m3·m−3 and an average of 0.193 m3·m−3. In 2016, the mean volumetric soil moisture of 0.171 m3·m−3 in the 0 to 60 cm soil layer was slightly lower than that in 2015, and it ranged from 0.078 to 0.304 m3·m−3 from 1 July to 13 October in 2016 (Figure 2i,j).

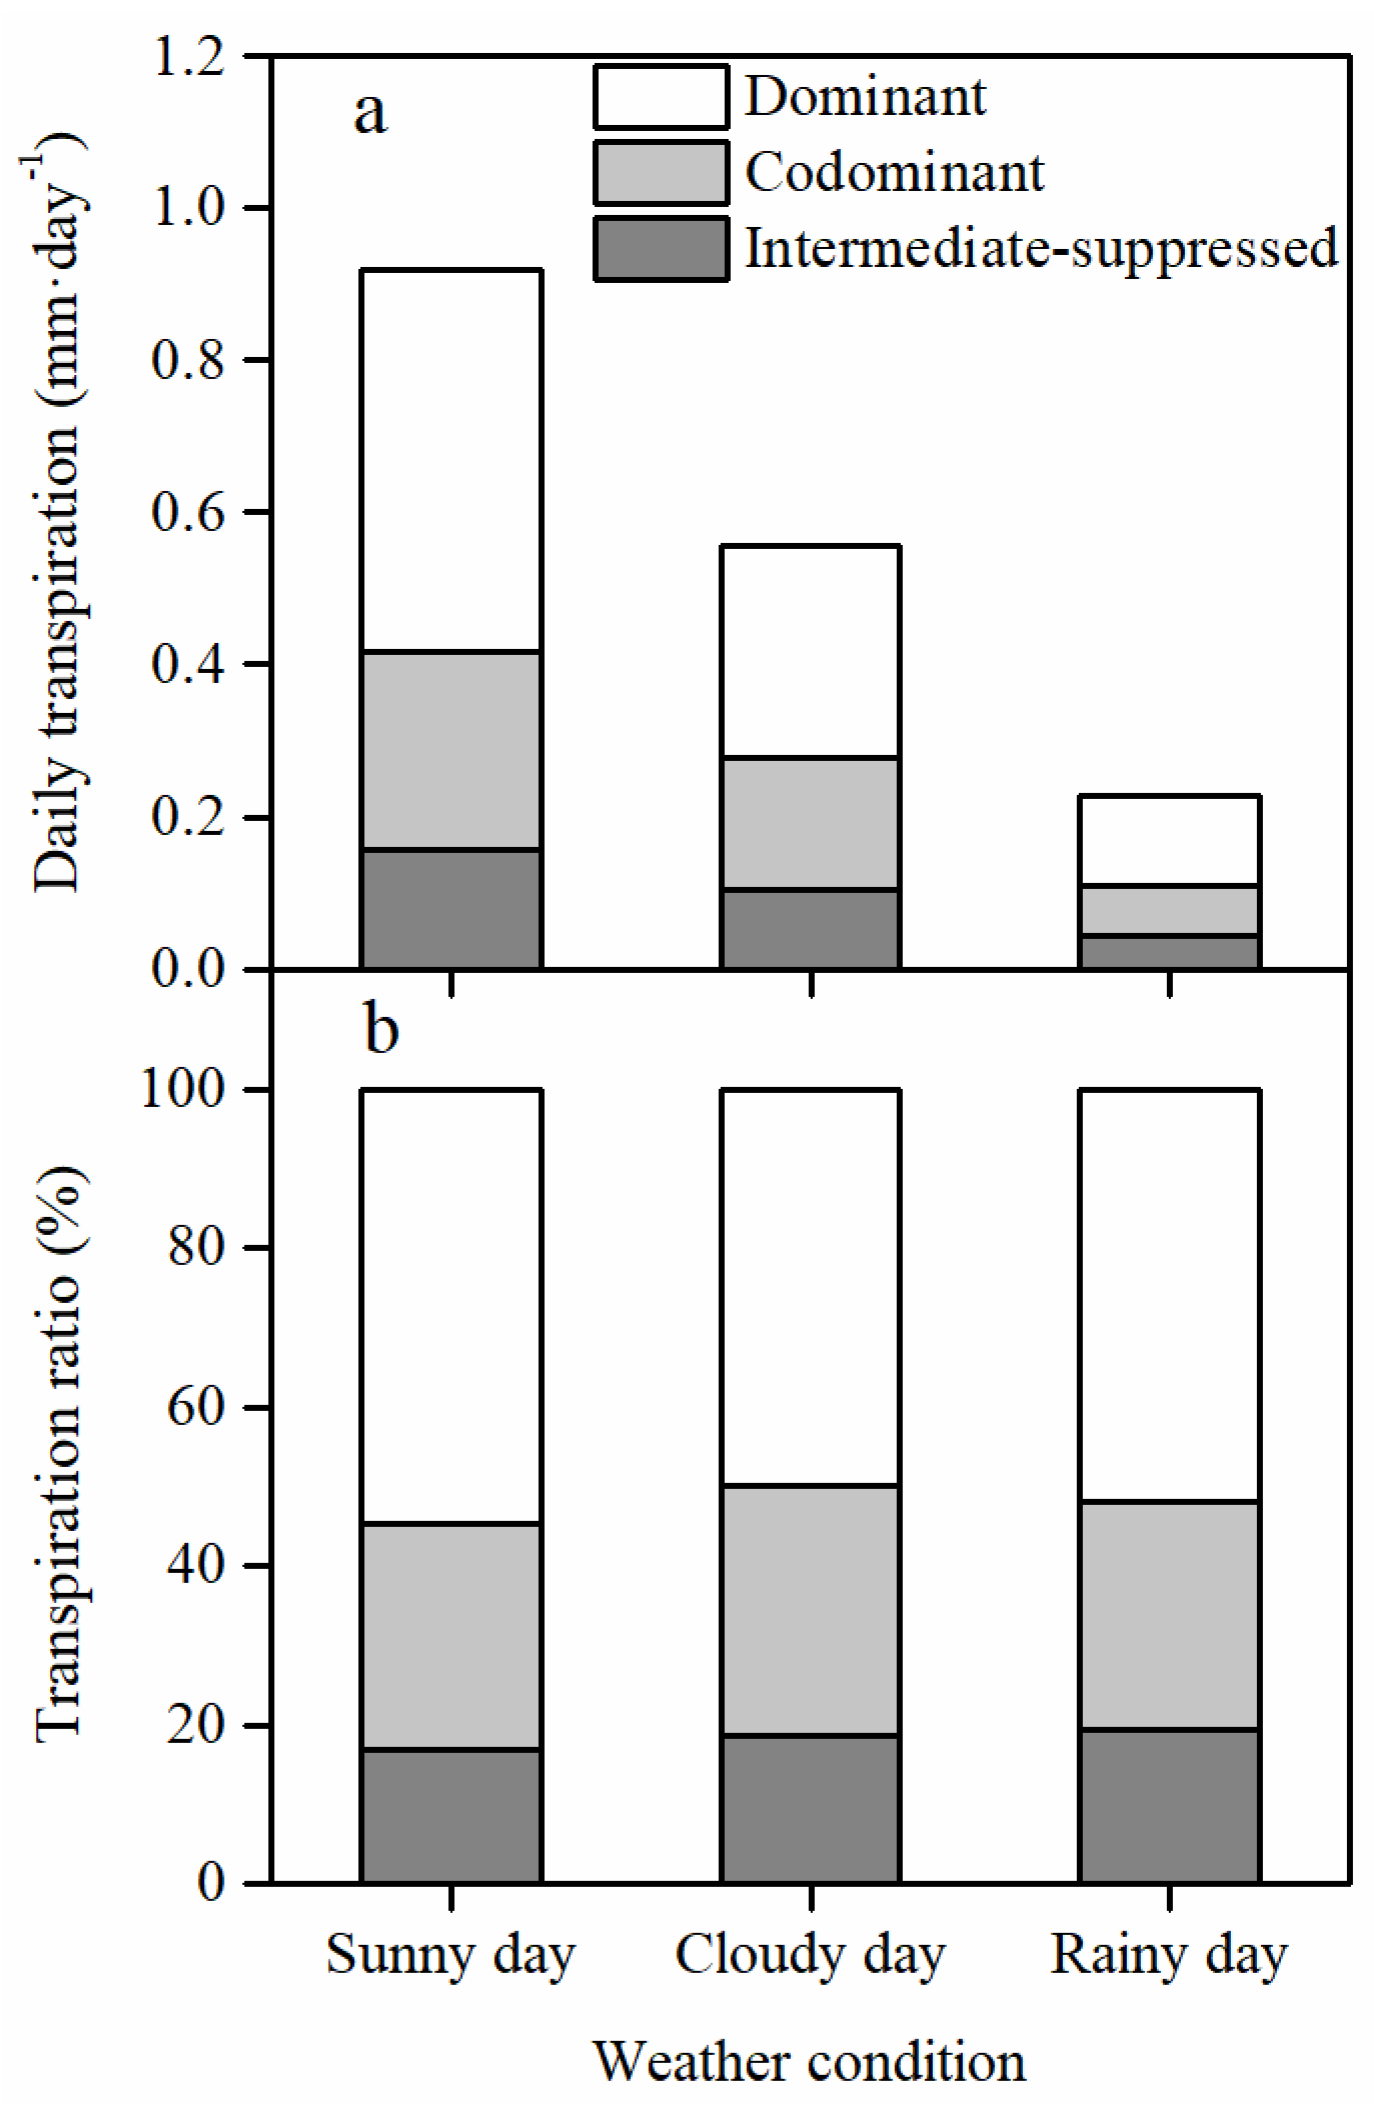
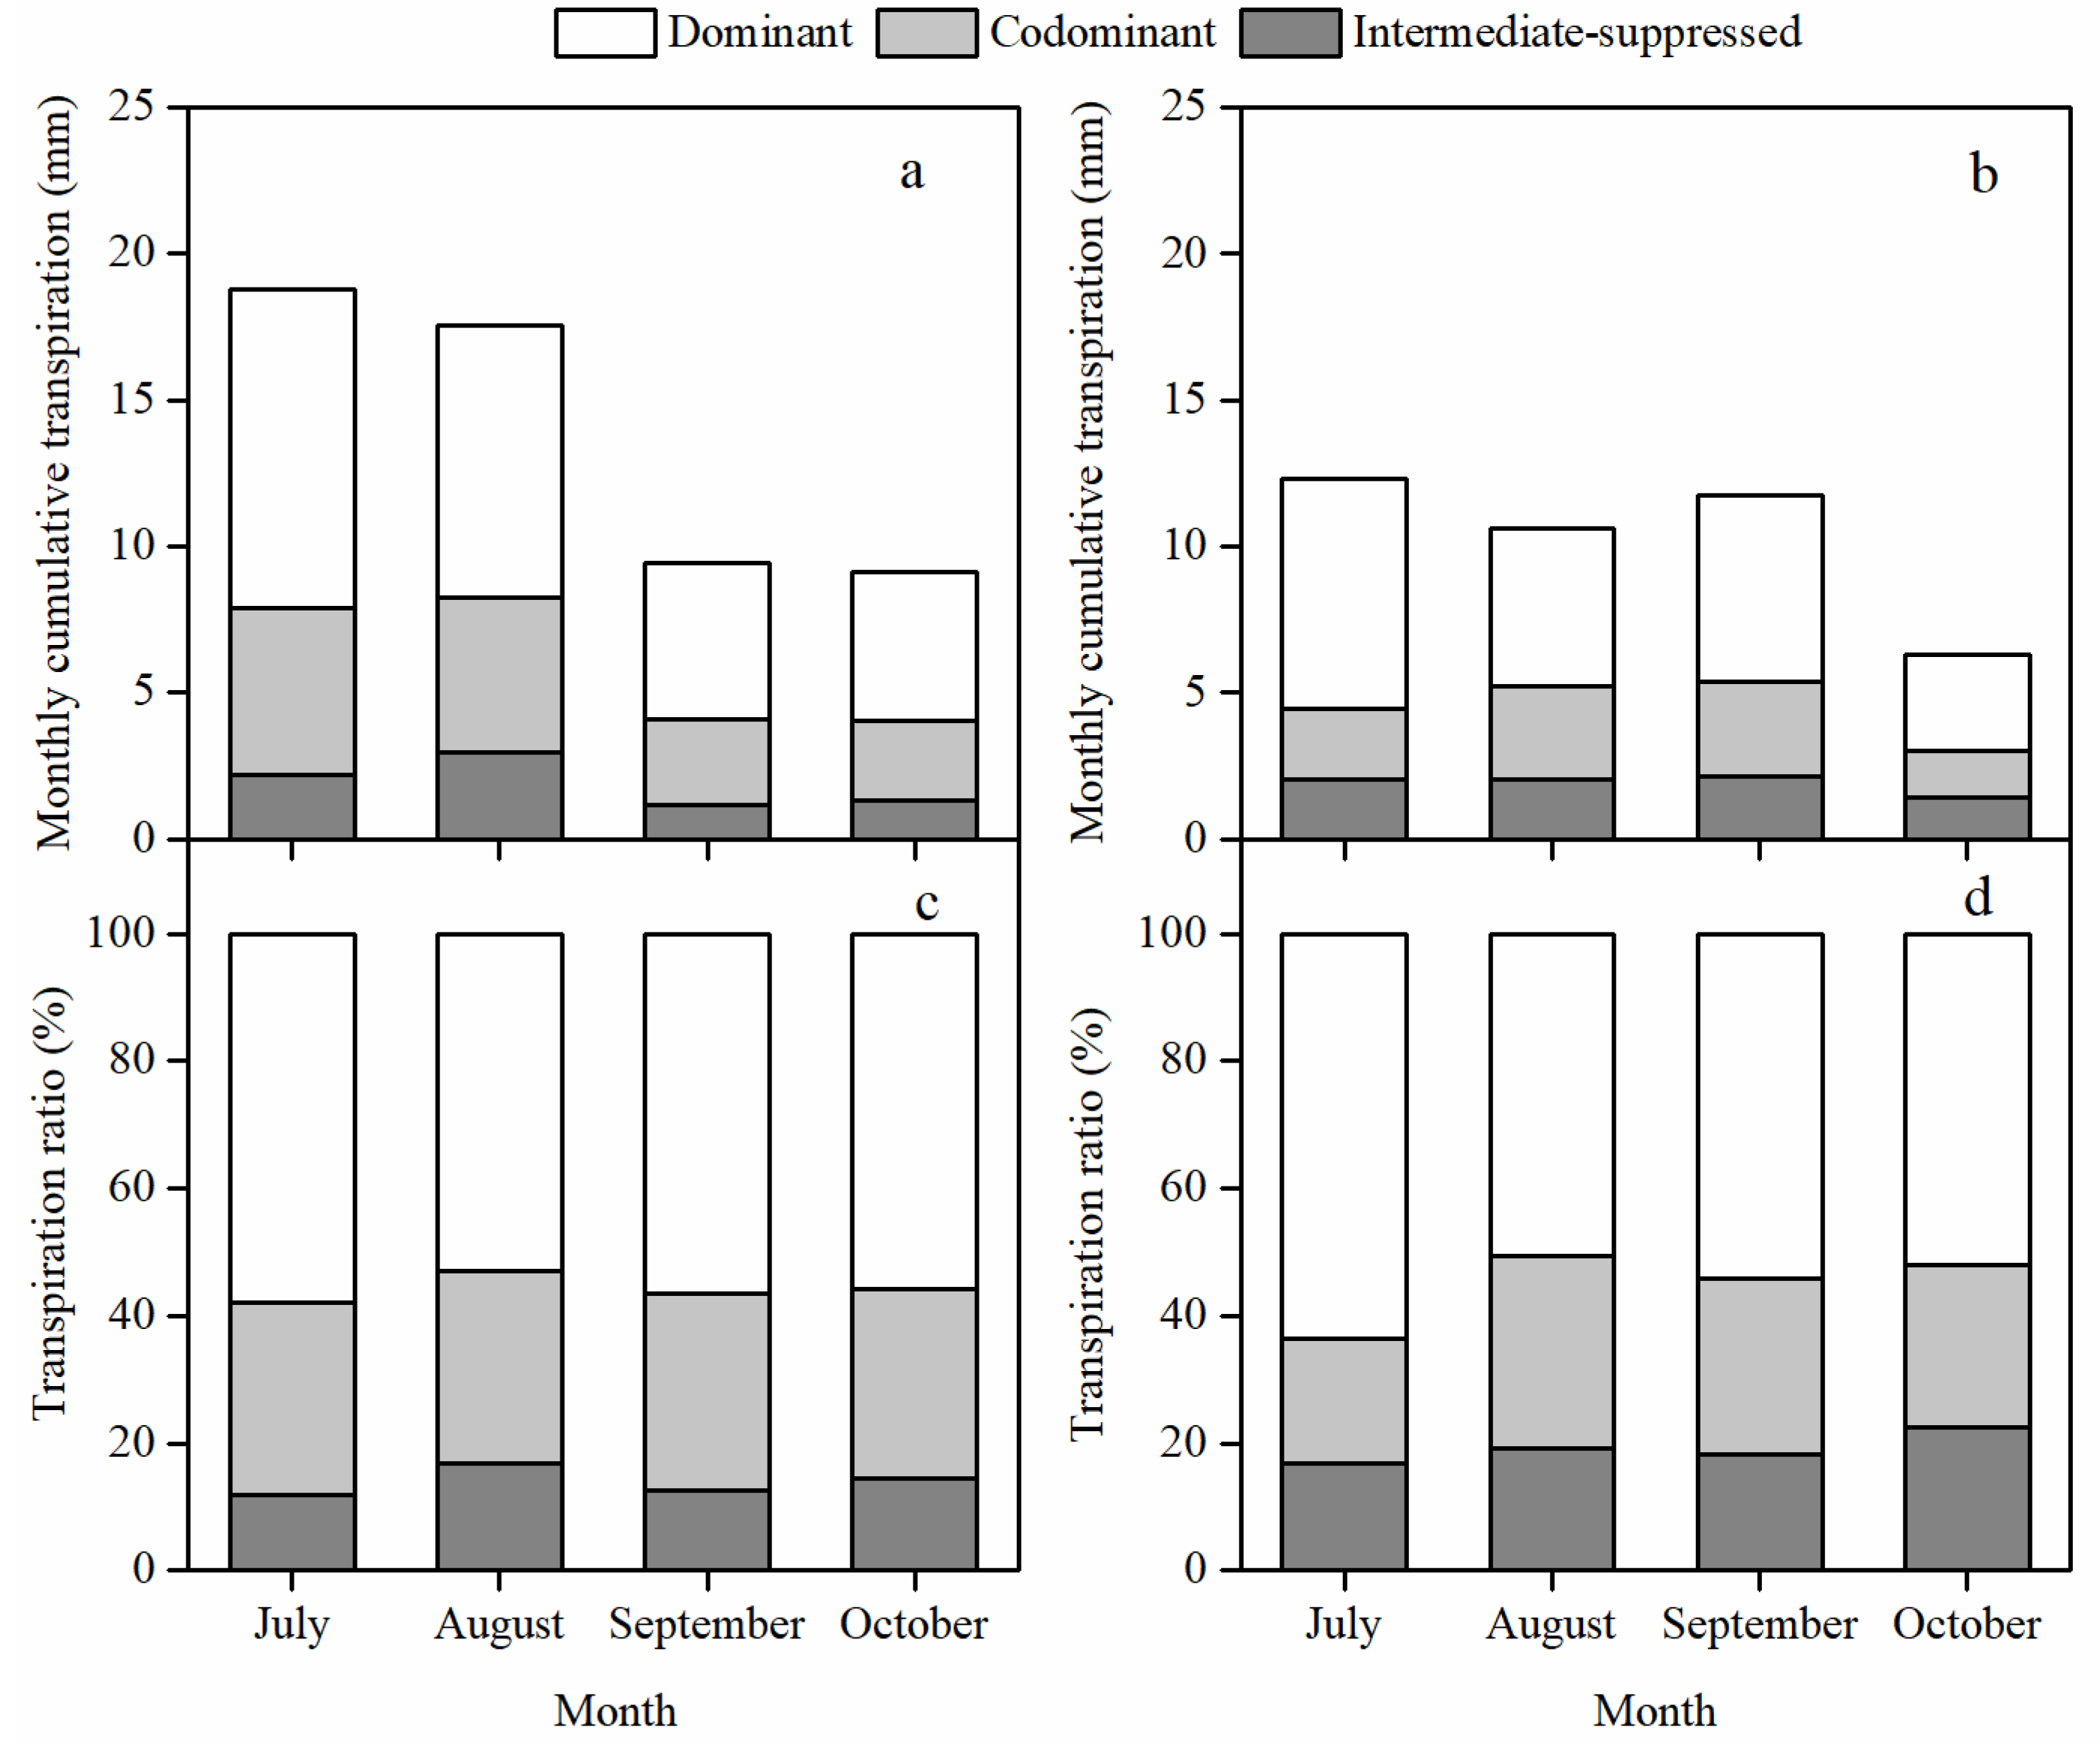
3.2. Stand Transpiration and Its Vertical Distribution among Canopy Layers

The stand transpiration fluctuated with the daily PET. The stand transpiration varied in the ranges of 0.047–1.098 mm·day−1 and 0.082–0.870 mm·day−1, with averages of 0.408 and 0.313 mm·day−1, respectively, from July to October of 2015 and 2016 (Figure 2k,l).
The stand transpiration varied with the weather (Figure 3). On sunny days, the Qinghai spruce forest experienced more transpiration. For example, the daily transpiration of the entire stand was 0.919 mm on 4 August 2015 (a sunny day) (Figure 3a). The largest contributor to the stand transpiration was the dominant layer, with a value of 0.501 mm, accounting for 54.55% of the daily stand transpiration (Figure 3b); followed by the codominant layer (with values of 0.262 mm and 28.52%, respectively); the smallest contributor was the intermediate-suppressed layer, with a total daily transpiration of 0.156 mm, which was only 16.93% of the daily stand transpiration.
On cloudy (e.g., 19 August 2015) and rainy days (e.g., 7 August 2015), the daily stand transpiration was much lower than that on a sunny day (e.g., 4 August 2015), decreasing by 0.36 and 0.69 mm, respectively (Figure 3a); the daily stand transpiration significantly decreased for the dominant and codominant layers, where the intermediate-suppressed layer only slightly declined. However, the transpiration ratio for the three canopy layers showed little variation with the changing weather conditions; the ratio was high for the dominant and codominant layers, accounting for 81.30% and 80.64%, respectively, of the stand transpiration on cloudy and rainy days, and the ratio of the intermediate-suppressed layer was low, accounting for 18.70% and 19.36%, respectively, of the stand transpiration on cloudy and rainy days (Figure 3b).
The stand transpiration varied with each month. From July to October in 2015 and 2016, the cumulative stand transpiration was 54.84 and 40.97 mm, accounting for 24.14% and 16.39% of the total precipitation over the same period, respectively. In 2015, the cumulative stand transpiration monotonously decreased from 18.75 mm in July to 9.15 mm in October, and it exhibited little variation in September and October, with a difference of only 0.27 mm (Figure 4a). However, in October 2016, the stand transpiration was lower than that in other months (Figure 4b).
There was obviously different transpiration among canopy layers under the different months, but the value and ratio of the monthly transpiration of the four canopy layers exhibited the same order in the different months: dominant > codominant > intermediate-suppressed layers (Figure 4). From July to October in 2015 and 2016, the largest contributor to the stand transpiration was the dominant layer, with values of 30.52 and 22.84 mm, accounting for 55.65% and 55.75% of the cumulative stand transpiration, respectively, followed by the codominant layer (with values of 16.67 and 10.46 mm, respectively, in 2015 and 2016); the smallest contributor was the intermediate-suppressed layer, with values of 7.65 and 7.67 mm, which accounted for only 13.95% and 18.72% of the cumulative stand transpiration, respectively, in 2015 and 2016.

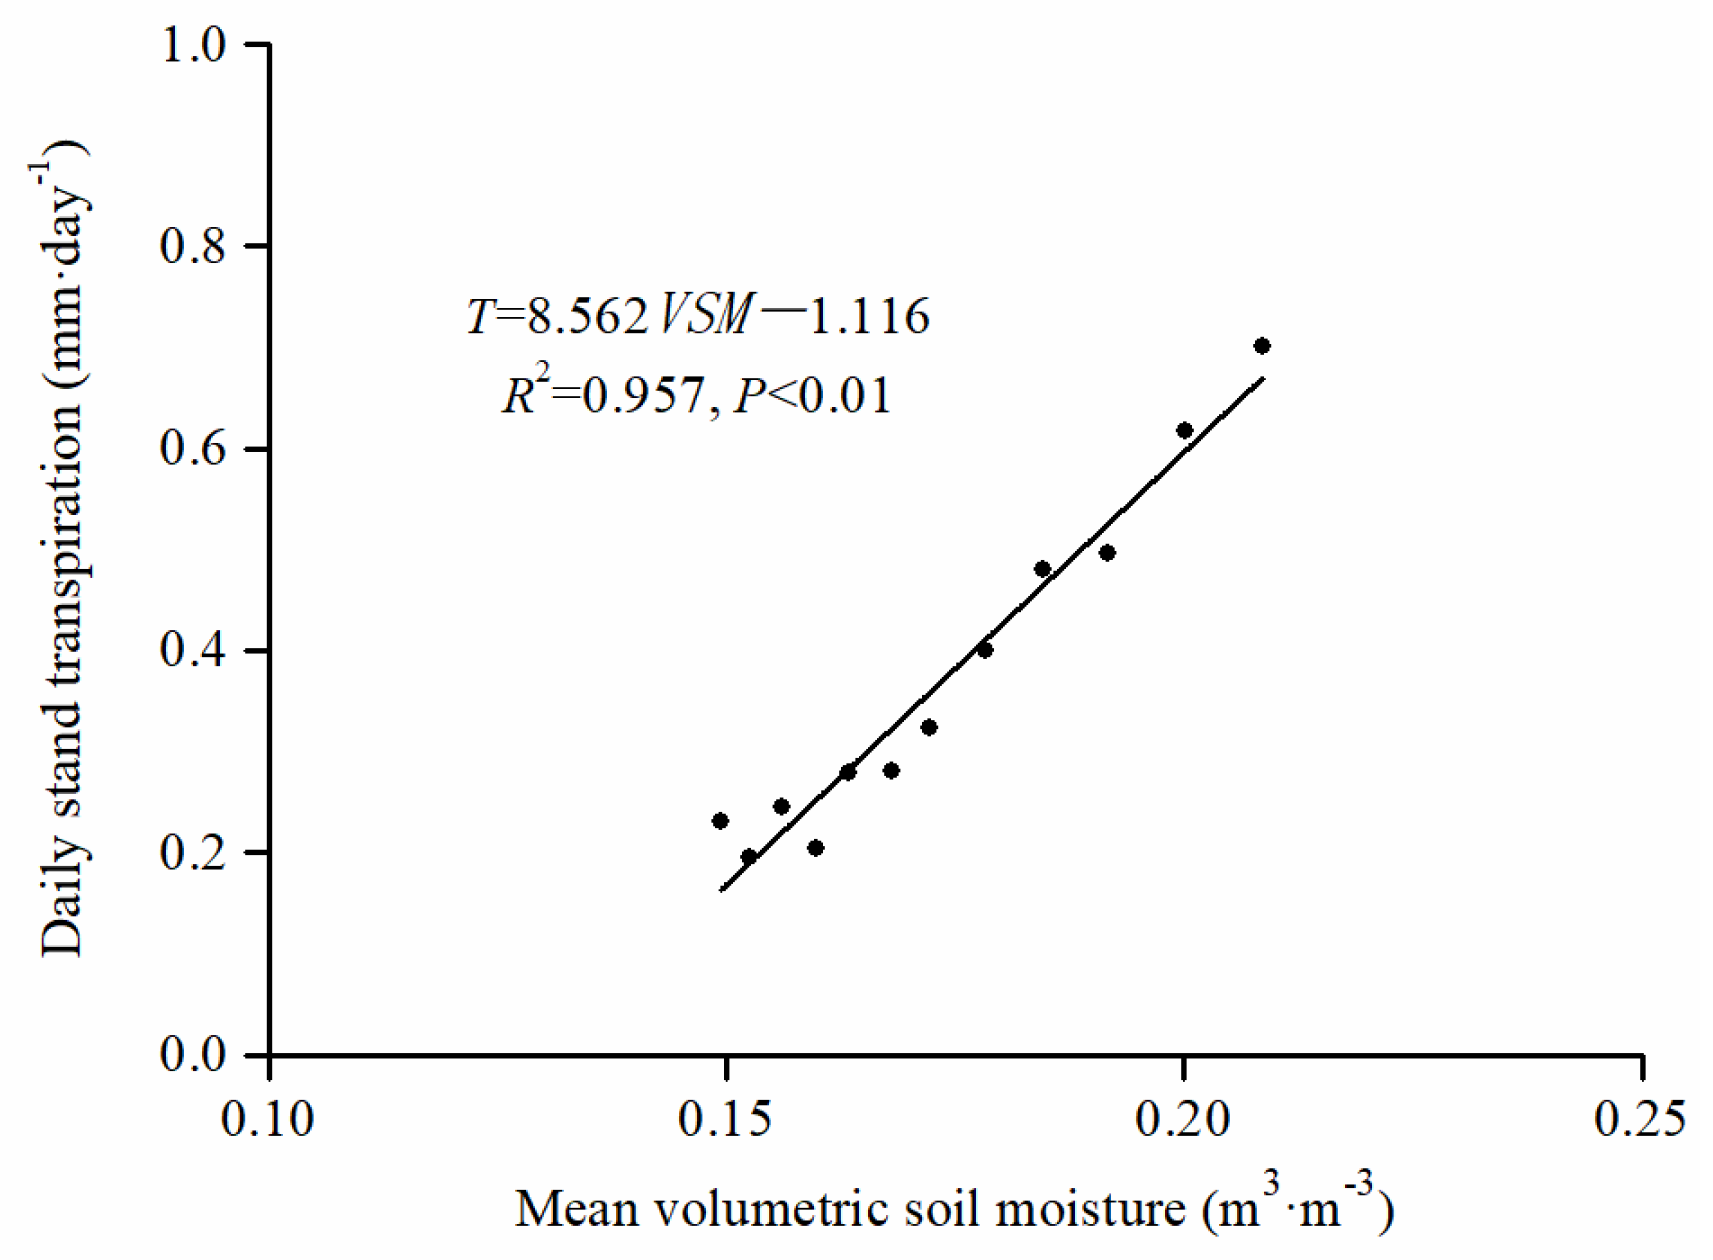
3.3. Daily Stand Transpiration Responses to PET and VSM

Transpiration is strongly dependent on potential evapotranspiration (PET) and volumetric soil moisture (VSM) [4,13,16,43], especially in arid and semiarid areas where the soil moisture is rather low and the evaporative demand is high [4,6].
In the period of well-watered soil conditions (VSM ≥ 0.21 m3·m−3) and rainy days, the daily stand transpiration responded to the daily PET following a linear relation (Figure 5); that is, the daily stand transpiration increased with increasing daily PET according to Equation (12).
T p = 0.120 × PET 0.008    ( R 2 = 0.87 ,   n = 66 ,   and   P < 0.01 )
where Tp (mm·day−1) is the simulated stand transpiration, and PET (mm·day−1) is the daily potential evapotranspiration.
In the period of water-limited soil conditions (VSM < 0.21 m3·m−3), there are clear deviations from linearity in the relationship between PET and stand transpiration (Figure 5). Figure 6 shows the difference between the measured transpiration (T) and simulated transpiration (Tp), and a substantial negative deviation occurred during this period, indicating that transpiration was limited by soil moisture. When VSM was less than 0.21 m3·m−3, the daily stand transpiration responded to VSM following a linear relation except on rainy days (Figure 7); that is, the daily stand transpiration decreased with the decreasing VSM based on Equation (13).
T p = 8.562 × VSM 1.116    ( R 2 = 0.96 ,   n = 12 ,   and   P < 0.01 )    VSM < 0.21   m 3 · m 3
where VSM (m3·m−3) is the mean volumetric soil moisture of the 0 to 60 cm soil layer.
On rainy days, the measured and calculated transpiration values were very similar from 1 to 13 August and from 2 to 6 September in 2015, even when VSM remained low (Figure 6). Precipitation creates a temporary water reservoir that can be absorbed by trees in an uninhibited fashion [16].

3.4. Different Responses of the Daily Transpiration to PET and VSM among Canopy Layers

In the period of well-watered soil conditions and rainy days, the daily transpiration of the dominant and codominant layers increased linearly with increasing PET, and the coefficients of determination (R2) of the regression relation were 0.880 and 0.797, respectively. Conversely, the daily transpiration of the intermediate-suppressed layer hardly changed with PET (R2 = 0.613). The difference in transpiration among the three canopy layers increased rapidly with increasing PET (Figure 8). The relationship between the dominant-layer transpiration and PET was more sensitive than that of any other layer, and the standardized coefficient (Kd) of the regression equation was 0.938 (Table 3).
In the period of water-limited water conditions, the daily transpiration decreased rapidly with decreasing VSM for the dominant and codominant layers, which declined slightly for the intermediate-suppressed layer (Figure 8). The R2 of each regression relation exceeded 0.95, but the intermediate-suppressed layer transpiration responses to VSM was more notable than that of any other layer, and the standardized coefficient was 0.980.

4. Discussion

4.1. Tree Dominance Determines Its Role in Forest Transpiration

In related studies, trees were distinguished by DBH, and larger trees were found to generally transpire more than smaller trees [24,26], but it was also found that the mean sap flow of trees was not strongly correlated with DBH [18,22,44]. In addition to DBH, tree dominance in forest was also the main influencing factor on transpiration [22], because it was related to the ability to acquire living resources, including water and energy resources. To quantify tree dominance in forests, the forest canopy could be divided into three layers, i.e., the dominant, codominant and intermediate-suppressed layers according to the difference of tree height between trees and their neighboring trees [31,32].
Trees from the dominant layer had a higher sap flow density than that of trees from the suppressed layer [20,21,45]. In this study, the dominant-layer trees were further proven to transpire more, and the dominant layer was the largest contributor to the stand transpiration, which accounted for 55.65% and 55.75% of the cumulative stand transpiration, respectively, in 2015 and 2016 (Figure 4), although only 15% of the trees in the plot occurred in the dominant layer (Table 1). This occurred due to a larger conductive sapwood area and leaf biomass of the dominant-layer trees of a forest located in the upper layer (Table 1), and to the intense solar radiation and large vapor pressure deficit in the upper layer [21,32,46]. This key contribution of dominant-layer trees was also found by in previous research, such as the study of Ceulemans et al. [47] in an Abies amabilis stand in western Washington, USA, and that of Sun et al. [48] in a Pinus koraiensis plantation, Northeast China.

4.2. Effects of PET and VSM on the Daily Transpiration among Canopy Layers

Transpiration in forest stands is mainly controlled by PET and VSM [4,13,16,38,43]. The dominant and codominant layers occupy favorable social positions in the forest and generally obtain more resources, especially light and soil moisture [32]. They are usually considered to be less vulnerable to drought [46], i.e., PET increase and soil water decrease.
However, in this study, it was found that the dominant and codominant layers were more sensitive to the changing PET and VSM. In the period of well-watered soil conditions and rainy days of 2015, the daily transpiration of the dominant and codominant layers increased linearly with increasing daily PET; conversely, the daily transpiration of the intermediate-suppressed layer hardly changed with daily PET (Figure 8). Similarly, in 2016, the transpiration of each canopy layer increased linearly with increasing daily PET, but the dominant and codominant layers were more sensitive to PET. Trees for the dominant and codominant layers lie in the upper and second layers of the forest, and take more favorable the spatial positions in the stand, greater exposure to light, and the stronger driving force that might increase sap flow than the intermediate-suppressed trees [16,20,21].
In the period of water-limited soil conditions, the daily transpiration of the dominant and codominant layers decreased rapidly with the soil moisture decline, while that of the intermediate-suppressed layer declined slightly (Figure 8). Trees from the intermediate-suppressed layer seem to be limited more by soil moisture and less sensitive to PET. Moreover, under the water-limited soil conditions, the average daily transpiration was reduced by 35.6%, 29.8% and 46.5% in the dominant, codominant and intermediate-suppressed layers, respectively, compared to the transpiration at the same PET in the period of well-watered soil conditions (estimated by Equation (11)). This occurred due to the shallow rooting system of the spruce trees and the soil thickness of no more than 60–100 cm in the forest in this study. For Qinghai spruce trees, with up to 95% of their active roots (fine roots for water and nutrient uptake) distributed within the upper 45 cm of the soil profile [49], the tree roots of the intermediate-suppressed layer were undeveloped, so that small trees could not absorb more soil water from the deeper soil layers and had to limit their water consumption, i.e., transpiration, when soil water was limited.
In this study, we only analyzed the variation of transpiration among canopy layers under the different weather and month conditions, and its responses to PET and VSM from July to October of 2015 and 2016. Therefore, it is difficult to build a transpiration model for all year due to limited data. Thus, it is necessary to follow the transpiration of Qinghai spruce with more years of observations and more sample trees with different canopy layers in future studies, to develop an integrated model describing the complex response of transpiration to the changing environment. In addition, there was the obviously vertical variations in weather conditions and forest structure (PAR, VPD, temperature, LAI) in a natural forest. Thus, in future studies, we will pay more attention to the conditions for different social positions, i.e., the vertical variations in weather condition and their effects on the transpiration of different canopy layers.

4.3. Implications for Tree Water Use

In this study, the transpiration of the intermediate-suppressed trees almost stopped when the soil water content below 0.15 m3·m−3, whereas the transpiration of the dominant and codominant trees became smaller but continued. This seems to suggest that, when severe drought occurs, the dominant and codominant trees can take water and keep photosynthesis activity with controlling transpiration to some extent, while the intermediate-suppressed trees are more likely to suffer from water stress. The intermediate-suppressed trees are generally shaded by the dominant and codominant trees from the more intense solar radiation and VPD, and the shade might enable intermediate-suppressed trees to survive, although severe soil drought has a strong impact on water use in the intermediate-suppressed trees. If extreme drought occurs after cutting the dominant and codominant trees, suppressed trees would be exposed to higher atmospheric evaporative demand and would also suffer from more severe soil drought because of an increase in forest-floor evaporation in a prolonged dry season [46]. This study reminds us that the upper trees need more water to be alive in any water conditions.

5. Conclusions

This study revealed the stand transpiration of Qinghai spruce and its variation among canopy layers and how PET and VSM affected transpiration at stand and canopy layer levels in the Qilian Mountains, Northwestern China. From July to October in 2015 and 2016, the cumulative stand transpiration was 54.84 and 40.97 mm. The largest contributor to the stand transpiration was the dominant layer, accounting for 55.65% and 55.75% of the cumulative stand transpiration, respectively, in 2015 and 2016. In another word, the larger trees were larger than their neighbors, which occupied a favorable social position in the forest, and transpired more.
The transpiration was sensitive to variations in PET and VSM in the Qinghai spruce forest. When the mean VSM of the 0 to 60 cm soil layer dropped below 0.21 m3·m−3, the daily stand transpiration was often limited by VSM, and it declined according to a significant positive linear correlation with VSM. However, the daily stand transpiration was limited by the daily PET in the period of well-watered soil conditions (VSM ≥ 0.21 m3·m−3) and rainy days, and it increased following a significant positive linear correlation with the daily PET. Moreover, the daily transpiration was more sensitive to PET changes in the dominant and codominant layers than in the intermediate-suppressed layers, while trees from the intermediate-suppressed layer seem to be limited more by soil moisture. Overall, the change in stand transpiration was mainly influenced by the dominant and codominant layers. Thus, a sustainable forest structure, considering the canopy layer, is important for forest-water management in the dryland regions.

Author Contributions

Conceptualization, Y.W. (Yanfang Wan), P.Y., and Y.W. (Yanhui Wang); instrument installation, X.L., S.W., and W.X.; investigation, Y.W. (Yanfang Wan), X.L., S.W., and W.X.; formal analysis, Y.W. (Yanfang Wan); writing—original draft preparation, Y.W. (Yanfang Wan) and P.Y.; writing—review and editing, Y.W. (Yanfang Wan), P.Y., Y.W. (Yanhui Wang), B.W., Y.Y., X.W., and Z.L. All authors have read and agreed to the published version of the manuscript.

Funding

This work was financially supported by the National Natural Science Foundation of China (41671025), the National Key R&D Program of China (2016YFC0501702 and 2017YFA0604702), and the Natural Science Foundation of Gansu Province (18JR4RA002).

Acknowledgments

We thank Ming Jin, Wenmao Jing, Weijun Zhao, Jian Ma and other staff of the Academy of Water Resource Conservation Forests of Qilian Mountains in Gansu Province for their assistance in the field work.

Conflicts of Interest

The authors declare no conflict of interest.

References

  1. Wang, Y.H.; Yu, P.T.; Xiong, W.; Shen, Z.X.; Guo, M.C.; Shi, Z.J.; Du, A.P.; Wang, L.M. Water-yield reduction after afforestation and related processes in the Semiarid Liupan Mountains, Northwest China. J. Am. Water Resour. Assoc. 2008, 44, 1086–1097. [Google Scholar] [CrossRef]
  2. Wallace, J.; McJannet, D. Processes controlling transpiration in the rainforests of north Queensland, Australia. J. Hydrol. 2010, 384, 107–117. [Google Scholar] [CrossRef]
  3. Razyaseef, N.; Yakir, D.; Schiller, G.; Cohen, S. Dynamics of evapotranspiration partitioning in a semi-arid forest as affected by temporal rainfall patterns. Agric. For. Meteorol. 2012, 157, 77–85. [Google Scholar] [CrossRef]
  4. Li, Z.H.; Yu, P.T.; Wang, Y.H.; Webb, A.A.; He, C.; Wang, Y.B.; Yang, L.L. A model coupling the effects of soil moisture and potential evaporation on the tree transpiration of a semi-arid larch plantation. Ecohydrology 2017, 1–11. [Google Scholar] [CrossRef]
  5. Tian, A.; Wang, Y.H.; Webb, A.A.; Liu, Z.B.; Yu, P.T.; Xiong, W.; Wang, X. Partitioning the causes of spatiotemporal variation in the sunny day sap flux density of a larch plantation on a hillslope in northwest China. J. Hydrol. 2019, 571, 503–515. [Google Scholar] [CrossRef]
  6. Chang, X.X.; Zhao, W.Z.; Liu, H.; Wei, X.; Liu, B.; He, Z.B. Qinghai spruce (Picea crassifolia) forest transpiration and canopy conductance in the upper Heihe River basin of arid northwestern China. Agric. For. Meteorol. 2014, 198–199, 209–220. [Google Scholar] [CrossRef]
  7. Piao, S.L.; Ciais, P.; Huang, Y.; Shen, Z.; Peng, S.; Li, J.; Zhou, L.; Liu, L.; Liu, H.; Ma, Y.; et al. The impacts of climate change on water resources and agriculture in China. Nature 2010, 467, 43–51. [Google Scholar] [CrossRef]
  8. IPCC. Climate Change 2014: Mitigation of Climate Change. Contribution of Working Group III to the Fifth Assessment Report of the Intergovernmental Panel on Climate Change; Edenhofer, O., Pichs-Madruga, R., Sokona, Y., Farahani, E., Kadner, S., Seyboth, K., Adler, A., Baum, I., Brunner, S., Eickemeier, P., et al., Eds.; Cambridge University Press: Cambridge, UK, 2014. [Google Scholar]
  9. Lyon, B.; Christie-Blick, N.; Gluzberg, Y. Water shortages, development, and drought in Rockland County, New York. J. Am. Water Resour. Assoc. 2005, 41, 1457–1469. [Google Scholar] [CrossRef] [Green Version]
  10. Li, J.B.; Cook, E.R.; D’arrigo, R.; Chen, F.H.; Gou, X.H. Moisture variability across China and Mongolia: 1951–2005. Clim. Dyn. 2009, 32, 1173–1186. [Google Scholar] [CrossRef]
  11. Sheffield, J.; Andreadis, K.M.; Wood, E.F.; Lettenmaier, D.P. Global and continental drought in the second half of the twentieth century: Severity-area-duration analysis and temporal variability of large-scale events. J. Clim. 2009, 22, 1962–1981. [Google Scholar] [CrossRef]
  12. Jackson, R.B.; Jobbagy, E.G.; Nosetto, M.D. Ecohydrology in a human-dominated landscape. Ecohydrology 2009, 2, 383–389. [Google Scholar] [CrossRef]
  13. Liu, Z.B.; Wang, Y.H.; Tian, A.; Webb, A.A.; Yu, P.T.; Xiong, W.; Xu, L.H.; Wang, Y.R. Modeling the response of daily evapotranspiration and its components of a larch plantation to the variation of weather, soil moisture, and canopy leaf area index. J. Geophys. Res. Atmos. 2018, 123, 7354–7374. [Google Scholar] [CrossRef]
  14. Herron, N.; Davis, R.; Jones, R. The effects of large-scale afforestation and climate change on water allocation in the Macquarie River catchment, NSW, Australia. J. Environ. Manag. 2002, 65, 369–381. [Google Scholar] [CrossRef]
  15. Wang, Y.H.; Xiong, W.; Yu, P.T.; Shen, Z.X.; Guo, M.C.; Guan, W.; Ma, C.M.; Ye, B.; Guo, H. Study on the evapotranspiration of forest and vegetation in dryland. Sci. Soil Water Conserv. 2006, 4, 19–26. [Google Scholar] [CrossRef]
  16. Granier, A. Evaluation of transpiration in a douglas-fir stand by means of sap flow measurements. Tree Physiol. 1987, 3, 309–320. [Google Scholar] [CrossRef] [PubMed]
  17. Lagergren, F.; Lindroth, A. Variation in sap flow and stem growth in relation to tree size, competition and thinning in a mixed forest of pine and spruce in Sweden. Forest Ecol. Manag. 2004, 188, 51–63. [Google Scholar] [CrossRef]
  18. Kume, T.; Tsuruta, K.; Komatsu, H.; Kumagai, T.; Higashi, N.; Shinohara, Y.; Otsuki, K. Effects of sample size on sap flux-based stand-scale transpiration estimates. Tree Physiol. 2010, 30, 129–138. [Google Scholar] [CrossRef] [Green Version]
  19. Zhao, X.W.; Ouyang, L.; Zhao, P.; Zhang, C.F. Effects of size and microclimate on whole-tree water use and hydraulic regulation in Schima superba trees. PeerJ 2018, 6, e5164. [Google Scholar] [CrossRef] [Green Version]
  20. Li, Z.H.; Wang, Y.H.; Yu, P.T.; Wang, Y.B.; Han, X.S.; Cao, G.X. Variation of sap flow density of Larix principis-rupprechtii with dominances and its impact on stand transpiration estimation. Forest Res. 2015, 28, 8–16. [Google Scholar] [CrossRef]
  21. Wan, Y.F.; Yu, P.T.; Liu, X.D.; Wang, S.L.; Wang, Y.H.; Xiong, W. Variation in sap flow density among levels of tree dominance in Picea crassifolia in the Qilian Mountains. Acta Ecol. Sin. 2017, 37, 3106–3114. [Google Scholar] [CrossRef] [Green Version]
  22. Zhang, X.; Wang, Y.J.; Wang, Y.Q.; Zhang, S.H.; Zhao, X.L. Effects of social position and competition on tree transpiration of a natural mixed forest in Chongqing, China. Trees 2019, 33, 719–732. [Google Scholar] [CrossRef]
  23. Xiong, W.; Wang, Y.H.; Yu, P.T.; Liu, H.L.; Xu, L.H.; Shi, Z.J.; Mo, F. Variation of sap flow among individual trees and scaling-up for estimation of transpiration of Larix principis-rupprechtii stand. Sci. Silva. Sin. 2008, 44, 34–40. [Google Scholar]
  24. Xiong, W.; Oren, R.; Wang, Y.H.; Yu, P.T.; Liu, H.L.; Cao, G.X.; Xu, L.H.; Wang, Y.N.; Zuo, H.J. Heterogeneity of competition at decameter scale: Patches of high canopy leaf area in a shade-intolerant larch stand transpire less yet are more sensitive to drought. Tree Physiol. 2015, 35, 470–484. [Google Scholar] [CrossRef] [PubMed]
  25. Gartner, K.; Nadezhdina, N.; Englisch, M.; Čermak, J.; Leitgeb, E. Sap flow of birch and Norway spruce during the European heat and drought in summer 2003. Forest Ecol. Manag. 2009, 258, 590–599. [Google Scholar] [CrossRef] [Green Version]
  26. Zhao, Y.H.; Liu, X.D.; Li, G.; Wang, S.L.; Zhao, W.J.; Ma, J. Phenology of five shrub communities along an elevation gradient in the Qilian Mountains, China. Forests 2018, 9, 58. [Google Scholar] [CrossRef] [Green Version]
  27. Wang, B.; Yu, P.T.; Zhang, L.; Wang, Y.H.; Yu, P.T.; Wang, S.L. Differential trends of Qinghai spruce growth with elevation in Northwestern China during the recent warming hiatus. Forests 2019, 10, 712. [Google Scholar] [CrossRef] [Green Version]
  28. Wan, Y.F.; Yu, P.T.; Li, X.Q.; Wang, Y.H.; Wang, B.; Yu, Y.P.; Zhang, L.; Liu, X.D.; Wang, S.L. Seasonal pattern of stem diameter growth of Qinghai spruce in the Qilian mountains, northwestern China. Forests 2020, 11, 494. [Google Scholar] [CrossRef]
  29. Chang, X.X.; Zhao, W.Z.; He, Z.B. Radial pattern of sap flow and response to microclimate and soil moisture in Qinghai spruce (Picea crassifolia) in the upper Heihe River basin of arid northwestern china. Agric. For. Meteorol. 2014, 187, 14–21. [Google Scholar] [CrossRef]
  30. Kraft, G. Beiträge zur Lehre Von Den Durchforstungen, Schlagstellungen und Lichtungshieben; Klindsworth’s Verlag: Hannover, Germany, 1884. [Google Scholar]
  31. Kaartinen, H.; Hyyppä, J.; Yu, X.; Vastaranta, M.; Hyyppä, H.; Kukko, A. An international comparison of individual tree detection and extraction using airborne laser scanning. Remote Sens. 2012, 4, 245–273. [Google Scholar] [CrossRef] [Green Version]
  32. Wang, Y.S.; Hyyppä, J.; Liang, X.L.; Kaartinen, H.; Yu, X.; Lindberg, E. International benchmarking of the individual tree detection methods for modeling 3-d canopy structure for silviculture and forest ecology using airborne laser scanning. IEEE Trans. Geosci. Remote Sens. 2016, 54, 1–17. [Google Scholar] [CrossRef] [Green Version]
  33. Zhang, L.; Yu, P.T.; Wang, Y.H.; Wang, S.L.; Liu, X.D. Biomass change of middle aged forest of Qinghai spruce along an altitudinal gradient on the north slope of Qilian Mountains. Sci. Silva. Sin. 2015, 51, 4–10. [Google Scholar] [CrossRef]
  34. Wang, B.; Yu, P.T.; Wang, S.L.; Wang, Y.H.; Liu, X.D.; Jin, M.; Zhang, X.L. Response of soil water storage to slope position of forestland in Qilian Mountains. Sci. Soil Water Conserv. 2016, 14, 101–108. [Google Scholar] [CrossRef]
  35. López-Bernal, Á.; Alcántara, E.; Testi, L.; Villalobos, F.J.; Phillips, N. Spatial sap flow and xylem anatomical characteristics in olive trees under different irrigation regimes. Tree Physiol. 2010, 30, 1536–1544. [Google Scholar] [CrossRef] [Green Version]
  36. Oren, R.; Phillips, N.; Ewers, B.; Pataki, D.; Megonigal, J. Sap-flux-scaled transpiration responses to light, vapor pressure deficit, and leaf area reduction in a flooded Taxodium distichum forest. Tree Physiol. 1999, 6, 337–347. [Google Scholar] [CrossRef] [PubMed] [Green Version]
  37. Shinohara, Y.; Tsuruta, K.; Ogura, A.; Noto, F.; Komatsu, H.; Otsuki, K.; Maruyama, T. Azimuthal and radial variations in sap flux density and effects on stand-scale transpiration estimates in a Japanese cedar forest. Tree Physiol. 2013, 5, 550–558. [Google Scholar] [CrossRef] [PubMed] [Green Version]
  38. Song, L.N.; Zhu, J.J.; Zhang, X.; Wang, K.; Lü, L.Y.; Zhang, X.L.; Hao, G.Y. Transpiration and canopy conductance dynamics of Pinus sylvestris var. mongolica in its natural range and in an introduced region in the sandy plains of Northern China. Agric. For. Meteorol. 2020, 281. [Google Scholar] [CrossRef]
  39. Allen, R.G.; Pereira, L.S.; Raes, D.; Smith, M. Crop Evapotranspiration-Guidelines for Computing Crop Water Requirements-FAO Irrigation and Drainage Paper 56; FAO: Roma, Italy, 1998; pp. 1–15. [Google Scholar]
  40. Johnson, J.W.; Lebreton, J.M. History and use of relative importance indices in organizational research. Organ. Res. Methods 2004, 7, 238–257. [Google Scholar] [CrossRef]
  41. Lane, D.M.; Murphy, K.R.; Marques, T.E. Measuring the importance of cues in policy capturing. Organ. Behav. Hum. Perform. 1982, 30, 231–240. [Google Scholar] [CrossRef]
  42. Liu, J.L.; Man, X.L.; Hu, Y. Response of tree sap flow of Larix gmelinii with various differentiation classes to multiple environmental factors. For. Res. 2016, 29, 726–734. [Google Scholar] [CrossRef]
  43. Small, E.E.; Mcconnell, J.R. Comparison of soil moisture and meteorological controls on pine and spruce transpiration. Ecohydrology 2010, 1, 205–214. [Google Scholar] [CrossRef]
  44. Fiora, A.; Cescatti, A. Diurnal and seasonal variability in radial distribution of sap flux density: Implications for estimating stand transpiration. Tree Physiol. 2006, 26, 1217–1225. [Google Scholar] [CrossRef] [PubMed] [Green Version]
  45. Jiménez, M.S.; Nadezhdina, N.; Cermák, J.; Morales, D. Radial variation in sap flow in five laurel forest tree species in Tenerife, Canary Islands. Tree Physiol. 2000, 20, 1149–1156. [Google Scholar] [CrossRef] [PubMed]
  46. Kume, T.; Takizawa, H.; Yoshifuji, N.; Tanaka, K.; Tantasirin, C.; Tanaka, N.; Suzuki, M. Impact of soil drought on sap flow and water status of evergreen trees in a tropical monsoon forest in northern Thailand. For. Ecol. Manag. 2007, 238, 220–230. [Google Scholar] [CrossRef]
  47. Ceulemans, R.; Rombold, J.S.; Kucera, J.; Brown, K.J.; Hinckley, T.M.; Sprugel, D.G. Crown conductance and tree and stand transpiration in a second growth Abies amabilis forest. Can. J. For. Res. 1997, 27, 797–808. [Google Scholar] [CrossRef]
  48. Sun, L.; Wang, C.K.; Yang, G.T.; Zhang, Q.Z.; Zhou, X.F. Sapflow flux of Pinus koraiensis plantation measured by thermal dissipation probes. Sci. Silva. Sin. 2007, 43, 8–14. [Google Scholar] [CrossRef]
  49. Tian, Q.Y.; He, Z.B.; Xiao, S.C.; Peng, X.M.; Ding, A.J.; Lin, P.F. Response of stem radial growth of Qinghai spruce (Picea crassifolia) to environmental factors in the Qilian Mountains of China. Dendrochronologia 2017, 44, 76–83. [Google Scholar] [CrossRef]
Figure 1. The digital elevation model (DEM) of the Heihe River basin and its location in China (a,b) and the location of the research plot in the Pailugou watershed (c).
Forests 11 00845 g001
Figure 2. The daily variation in weather parameters (precipitation (a,b), solar radiation (c,d), and vapor pressure deficit (e,f)), potential evapotranspiration (PET) (g,h), mean volumetric soil moisture of the 0 to 60 cm soil layer (i,j), and stand transpiration (T) (k,l) in the Qinghai spruce plot from July to October of 2015 and 2016.
Forests 11 00845 g002
Figure 3. The daily transpiration value (a) and ratio (b) of the dominant, codominant and intermediate-suppressed layers under the different weather conditions.
Forests 11 00845 g003
Figure 4. The monthly cumulative transpiration value and ratio of the dominant, codominant and intermediate-suppressed layers under the different month conditions in 2015 (a,c) and 2016 (b,d).
Forests 11 00845 g004
Figure 5. The relationship between the daily stand transpiration (T) and daily potential evapotranspiration (PET) in the period of well-watered soil conditions and rainy days of 2015.
Forests 11 00845 g005
Figure 6. Seasonal differences (Tdiff) between the measured transpiration (T) and simulated transpiration (Tp) by Equation (12), and the variation in mean volumetric soil moisture content (VSM) of the 0 to 60 cm soil layer and precipitation from 29 July to 14 October in 2015.
Forests 11 00845 g006
Figure 7. The relationship between the daily stand transpiration (T) and mean volumetric soil moisture (VSM) of the 0 to 60 cm soil layer in the period of water-limited soil conditions of 2015.
Forests 11 00845 g007
Figure 8. The different transpiration responses to PET and VSM among canopy layers in 2015.
Forests 11 00845 g008
Table 1. Forest structure in the Qinghai spruce plot (mean value ± standard deviation).
Canopy LayersNumber of
Trees
Average Tree Height (m)Average Diameter at Breast Height (cm)Average Leaf Biomass
(kg)
Total Sapwood Area (cm2)Percent of Plot Sapwood Area (%)
Dominant2118.1 ± 2.931.1 ± 6.224.7 ± 5.78735.3241.7
Codominant3513.9 ± 2.920.1 ± 3.114.8 ± 2.36747.0632.2
Intermediate-suppressed846.7 ± 2.89.3 ± 4.15.4 ± 3.15455.4526.1
Note: the area is 1250 m2.
Table 2. The characteristics of sample trees for sap flow measurement in the Qinghai spruce plot.
Canopy LayersTree No.Relative Tree HeightTree Height
(m)
Diameter at Breast Height
(cm)
Canopy Width
(m)
Canopy Thickness (m)Sapwood Thickness (mm)Sapwood Area
(mm2)
Leaf Biomass
(kg)
Dominant11.9320.533.554.914.351.34 42,27729.81
21.9320.522.954.817.739.39 21,51920.86
31.7919.037.656.715.356.88 53,29632.06
41.7418.523.455.114.539.88 22,29620.28
51.7418.523.314.810.239.74 22,07620.17
Codominant61.5616.515.683.611.732.84 11,96513.89
71.5516.418.113.814.534.90 14,82415.03
81.5116.017.614.810.834.46 14,21114.47
91.4315.215.162.815.632.42 11,39212.27
Intermediate-suppressed101.2413.210.432.49.428.80 67418.36
111.0611.212.433.86.730.28 85908.82
120.727.614.323.95.331.7410,4948.40
130.586.110.523.64.028.87 68215.67
Table 3. Linear regression models for transpiration of three canopy layers (Fi, mm·day−1) to PET and VSM.
FactorsCanopy LayersRegression EquationKdR2P
PETDominantF1 = 0.069PET − 0.0030.9380.8800.000
CodominantF2 = 0.037PET + 0.0020.8930.7970.000
Intermediate-suppressedF3 = 0.014PET + 0.0100.7830.6130.000
VSMDominantF1 = 3.738VSM − 0.4510.9650.9310.000
CodominantF2 = 2.680VSM − 0.3550.9540.9100.000
Intermediate-suppressedF3 = 2.143VSM − 0.3100.9910.9800.000
Note: Kd is the standardized coefficient; R2 is the coefficient of determination; P is the significance of the coefficient.

