Article

Estimation of Chilling and Heat Accumulation Periods Based on the Timing of Olive Pollination

1
Institute of Environmental Sciences (Botany), University of Castilla-La Mancha, 45071 Toledo, Spain
2
Department of Civil and Environmental Engineering, University of Perugia, 06121 Perugia, Italy
3
Laboratory of Palynology, Olive Tree Institute, BP. 208, Tunis 1082, Tunisia
4
Department of Botany and Plant Physiology, University of Malaga, 29071 Malaga, Spain
5
Department of Botany, Ecology and Plant Physiology, University of Cordoba, 14071 Cordoba, Spain
*
Author to whom correspondence should be addressed.
Forests 2020, 11(8), 835; https://doi.org/10.3390/f11080835
Submission received: 11 June 2020 / Revised: 16 July 2020 / Accepted: 28 July 2020 / Published: 1 August 2020
(This article belongs to the Special Issue Trees, Pollen and Allergies in Urban Areas)

Abstract

:
Research Highlights: This paper compares the thermal requirements in three different olive-growing areas in the Mediterranean region (Toledo, central Spain; Lecce, southeastern Italy; Chaal, central Tunisia). A statistical method using a partial least square regression for daily temperatures has been applied to study the chilling and heat requirements over a continuous period. Background and Objectives: The olive is one of the main causes of pollen allergy for the population of Mediterranean cities. The physiological processes of the reproductive cycle that governs pollen emission are associated with temperature, and thermal requirements strongly regulate the different phases of the plant’s life cycle. However, the point when several specific processes occur—Such as the phases within the dormancy period—Is unclear, and the transition between endodormancy and ecodormancy is not easily distinguishable from an empirical point of view. This work focuses on defining the thermal accumulation periods related to the temperature balance needed to meet the chilling and heat requirements for the metabolic activation and budbreak in olive trees. Results and Conclusions: Thermal accumulation patterns in olive trees are strongly associated with the bioclimatic conditions of olive-growing areas, and the olive flowering start dates showed significant differences between the three studied stations. Our results show that the chilling requirements were fulfilled between late autumn and early winter, although the chilling accumulation period was more evident in the coldest and most continental bioclimatic areas (central Spain). The heat accumulation period (forcing period) was clearly defined and showed a close relationship with the timing of olive flowering. Heat requirements were therefore used to generate accurate forecasting models to predict the beginning of the olive bloom and subsequent olive pollen emission. A forecasting model considering both the chilling and heat requirements was generated in Toledo, where the estimated days displayed an error of 2.0 ± 1.8 days from the observed dates. For Lecce, the error was 2.7 ± 2.5 days and for Chaal, 4.2 ± 2.4 days.

Graphical Abstract

1. Introduction

The olive (Olea europaea L.) is one of the main causes of pollen allergy for the population of Mediterranean cities. The phenological modeling of the olive life cycles allows olive pollen allergy sufferers to receive advanced warnings of the main periods of allergenic risk [1]. Olive trees are not only of interest from an allergological point of view; they also represent an important socioeconomic resource in the Mediterranean basin, where knowledge of floral phenology is very useful for good crop management and the optimization of agronomic tasks [2].
Olive trees are a very sensitive species with regard to temperature, and the plant’s thermal requirements strongly regulate the different phases of the life cycle of the olive [3,4], as well as other temperate fruit trees [5,6,7,8]. The induction, initiation and differentiation of the floral buds are three important processes in the olive reproductive cycle [9,10], in which the temperature recorded during the period between dormancy and budbreak (i.e., from winter or the previous autumn until early spring) plays a crucial role [11].
Dormancy is a physiological phenomenon resulting from the adaptation of the majority of woody plants in middle latitudes [12,13]. The climate in these areas is characterized by a marked seasonality and alternating favorable and non-favorable periods for plant development, according to the thermal conditions influenced by periodic seasons [14]. This behavior is related to frost resistance and allows plants to protect their vegetative and reproductive tissues in unfavorable conditions, mainly low temperatures in winter [15]. Other limiting environmental conditions, such as intense summer droughts, may also induce plants to initiate a specific latent period (in this case called as paradormancy) with a different biological meaning [12,16].
In winter, olive trees require specific chilling requirements to break the dormancy in buds [17]. The period when these chilling requirements are satisfied is known as endodormancy. Chilling units are accumulated during endodormancy until a given level is reached and ecodormancy then begins [16]. In this phase, the floral buds are ready to activate flowering and need to accumulate relatively warm temperatures (heat requirements) to start their metabolic development, bud swelling and the development of inflorescences from the floral buds (forcing period). The winter chill accumulation cannot be easily observed without experimentation, so little is known about the specific time span during which trees accumulate winter chill [18] and its importance for forcing periods.
Along with other factors, the thermal requirements are genetically established. Even different olive cultivars show variations in their chilling and heat levels that must be satisfied to promote budbreak [19], and thus exhibit different phenological patterns [20]. Geographical features also determine changes in thermal requirements, and different thermal levels have thus been calculated following a latitudinal, longitudinal or altitudinal gradient [5,21,22]. Biotic (pests) and anthropogenic factors (management) are also sources of phenological variability [11,23]. Due to this phenotypic plasticity, the numerical equations (e.g., the Utah model, dynamic model) used in thermal models are calibrated for each specific location [6,17], and, less frequently, the thermal accumulation periods are optimized independently for different olive-growing areas.
A large number of previous studies based on chilling and forcing periods have tended to use arbitrary accumulation periods or intuition-based definitions of the thermal accumulation periods [24] to calculate the chill and heat requirements [19]. The relevant optimal periods are often fitted using statistical procedures based on reducing the measurements of error (root mean square error, coefficient of variation, etc.) [25], assuming the reliable periods of thermal accumulation are critical for analyzing the different phases within the dormancy stage [7]. However, the changes in the flower buds during the different phases within the dormancy, i.e., endodormancy or ecodormancy, are imperceptible [18,26], and using predefined accumulation periods may lead to errors.
A statistical methodology developed by Luedeling et al. (2013b) [27] was used to study the continuous behavior of fruit trees according to their chilling and heat requirements [28]. This method has been widely used for deciduous woody fruit plants such as Prunus armeniaca Marshall, Prunus avium L., Prunus dulcis (Mill.) D.A.Webb, Castanea mollissima Blume, Juglans californica S. Watson, Pistacia vera L. or Vitis vinifera L. [8,24,29,30,31,32,33], but until now has sparsely been applied in olive trees to determine the critical temperature periods that influence floral phenology [34]. This methodology has also been combined for the first time with phenological data provided by numerical analyses of pollen patterns which reduce the local variability, after which the method is again optimized with these characteristics. This methodology has also been used to identify the temperature periods that cause changes in olive oil accumulation [35], therefore not only constrained to the phenological purposes.
The aims of this study were to estimate the periods of the year in which temperature influences the flowering dates, i.e., to determine the chilling and heat accumulation periods (forcing periods) in olive trees following a statistical method, and to calculate the thermal requirements in order to model the dates of the onset of the flowering period according to an optimized method based on the chilling and heat requirements during the accumulation periods in various stations in the Mediterranean region. This methodology has been implemented for forecasting purposes in olive trees, and the models estimating olive pollination with a sufficient accuracy provide advanced warnings of high risk pollination levels for allergy sufferers in Mediterranean cities.

2. Material and Methods

2.1. Phenological Data

The phenological data used in this work were the olive pollination start dates from three different sampling stations in the Mediterranean region (Figure 1): Toledo (Spain) for the period 2003–2016 (39°51′ N, 04°02′ W, 450 m above sea level (ASL)), Lecce (Italy) for the period 1999–2011 (40°25′ N, 18°03′ E, 36 m ASL) and Chaal (Tunisia) for the period 1999–2014 (34°34′ N, 10°19′ E, 78 m ASL). Lecce and Chaal are two sites near the coast that are characterized by flat surrounding areas, in an altitudinal range between 0 and 200 m above sea level in the case of Lecce and 0–300 m ASL in Chaal (Supplementary Materials Figure S1). These areas have large surfaces of olive groves. In contrast, Toledo is located in a more complex topographical area and in a wider altitudinal range between 400 and 1400 m ASL, although most of the olive-growing areas are located below 800 m ASL.
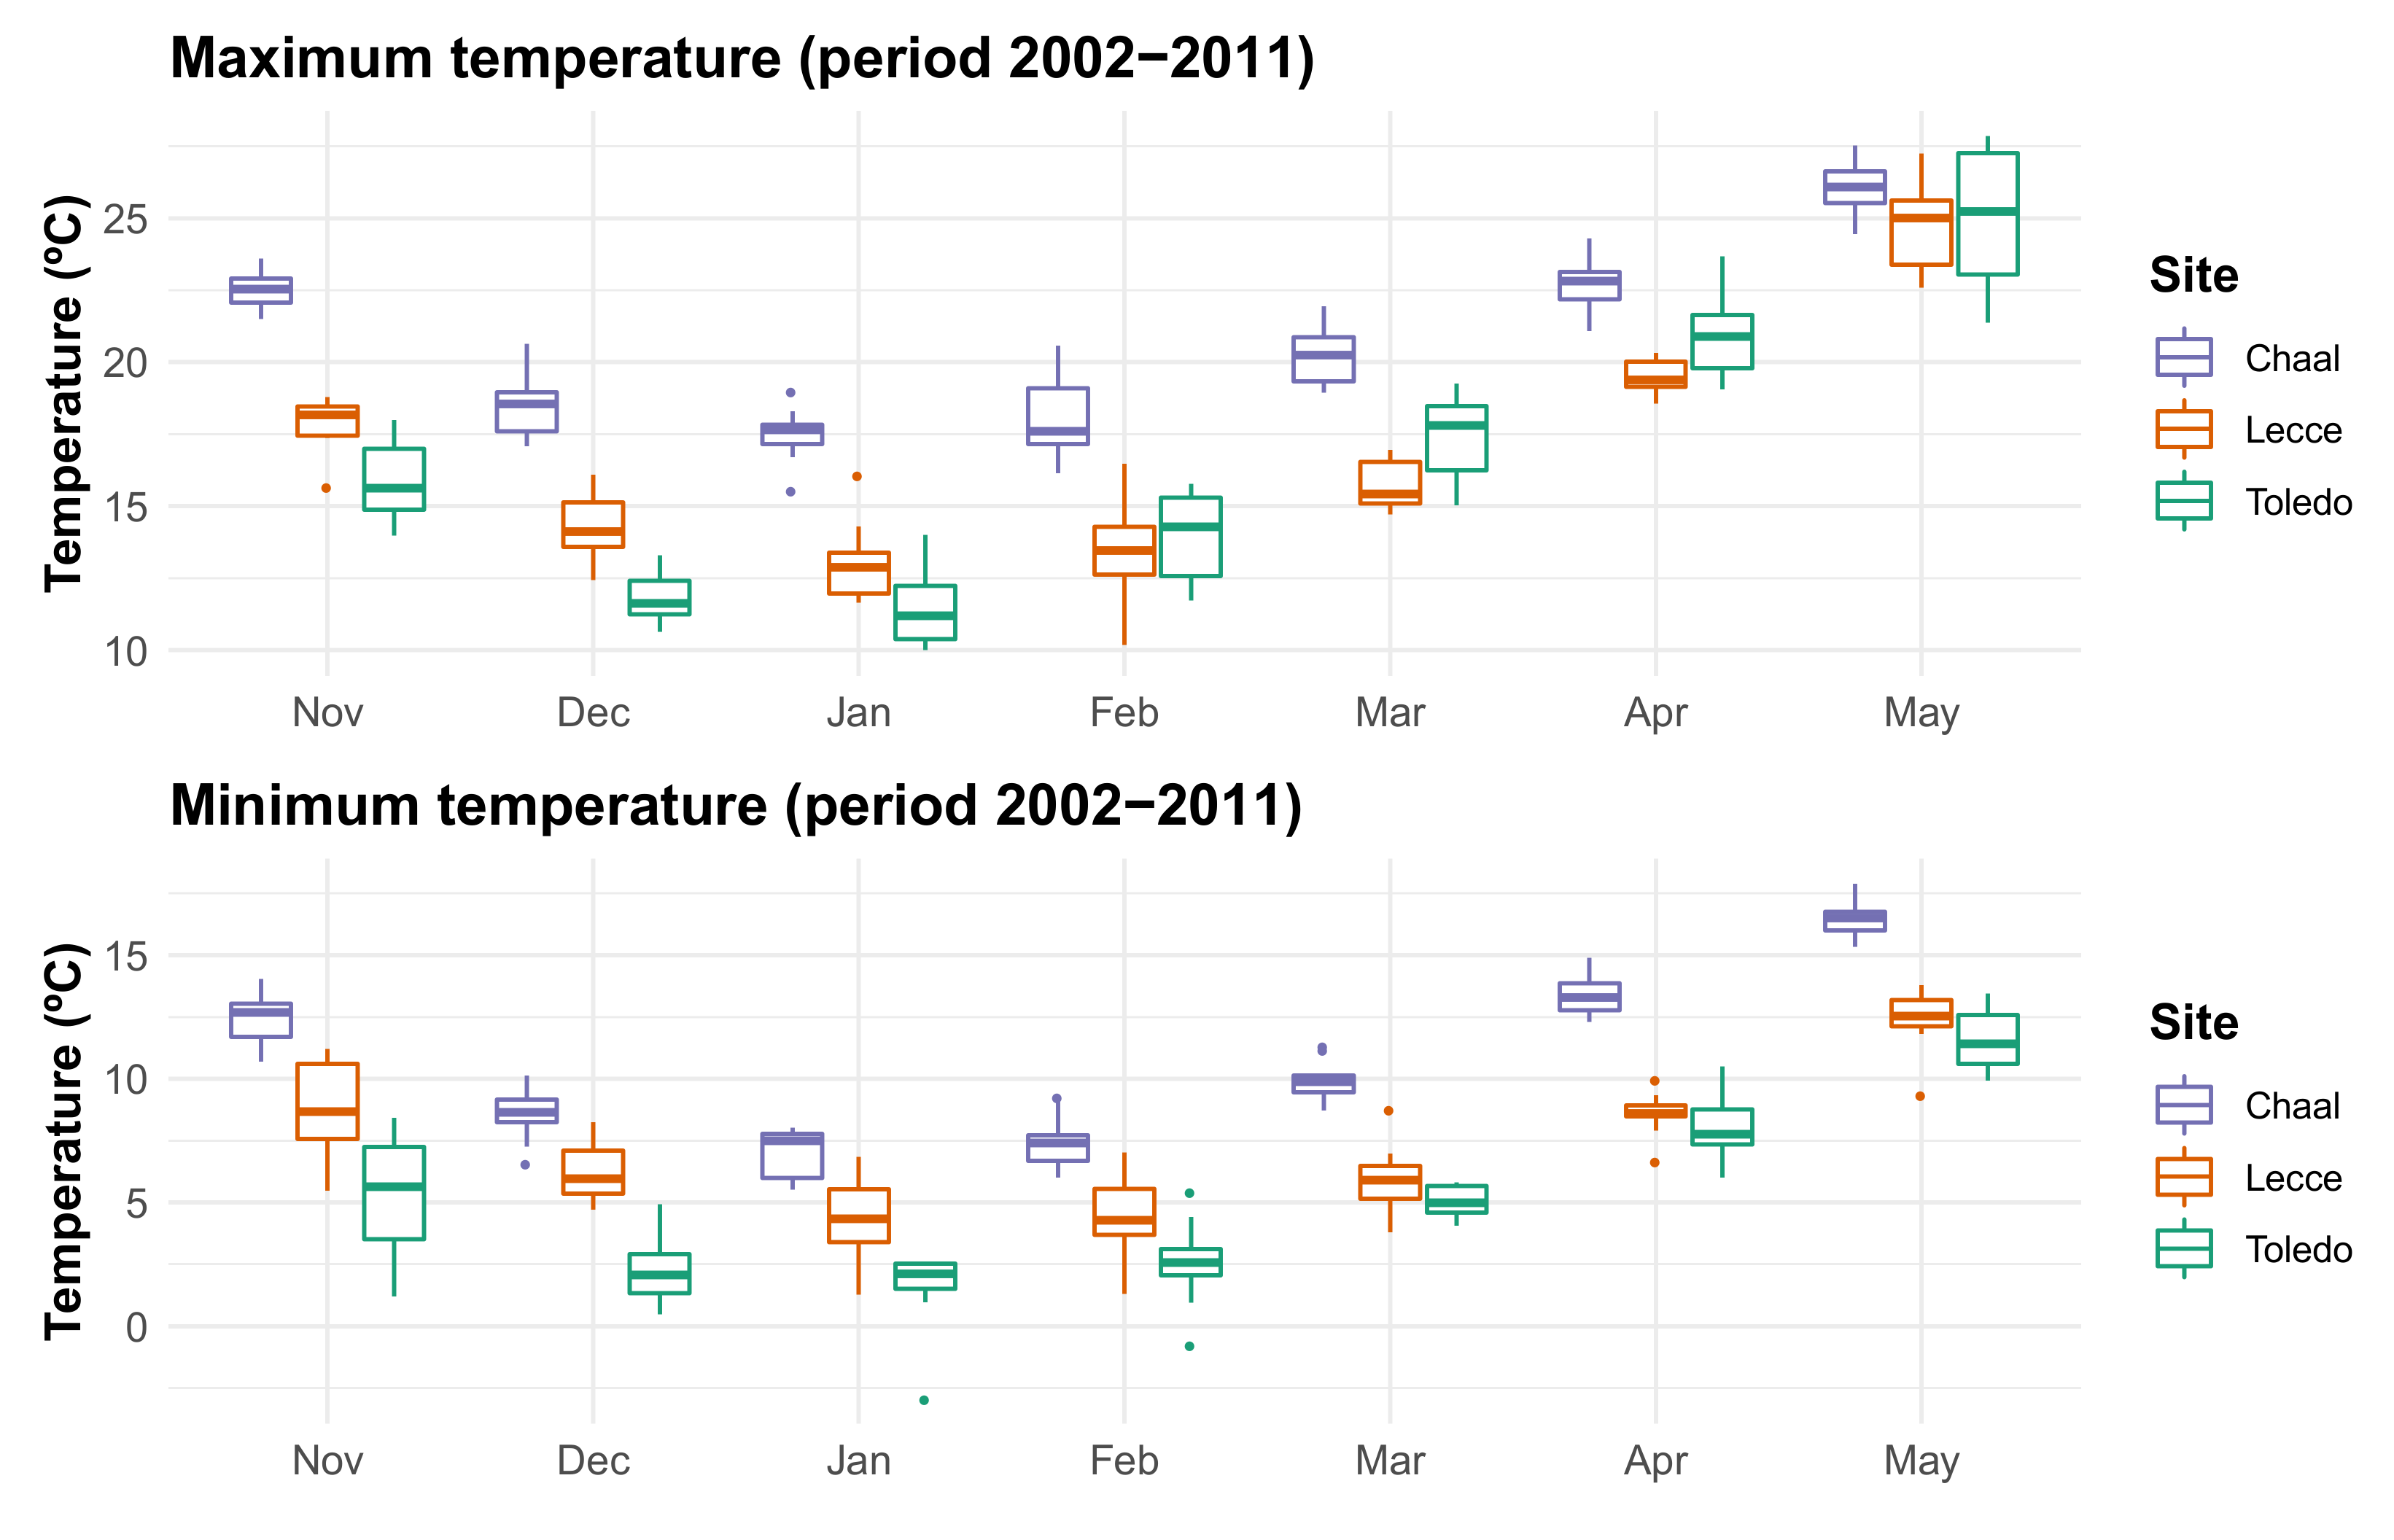
Lecce recorded higher maximum temperatures than Toledo during November–January, and the opposite during February–May, when Toledo showed slightly higher temperatures. However, the minimum monthly temperatures were significantly higher in Lecce than in Toledo for November–May. Chaal is located in warmer areas than the other Mediterranean locations (Figure 2). From a bioclimatic point of view, all the stations belong to the Mediterranean macroclimate, according to the classification proposed by Rivas-Martínez et al. (2017) [36]. Toledo and Lecce are located in xeric-oceanic and pluviseasonal-oceanic bioclimates, respectively, characterized by a wide annual range of temperatures and a marked summer drought. Thanks to its location in central Spain, Toledo has a higher continentality index and lower winter temperatures than Lecce, which is in the southeast corner of Italy. The annual accumulated rainfall in Toledo is also scarcer than Lecce and is located in the mesomediterranean belt, while Lecce is located in the thermomediterranean belt [37]. Chaal in Tunisia belongs to the desertic-oceanic bioclimate characterized by aridity during the entire year and an annual rainfall below 200 mm, and monthly average temperatures constantly above 10 °C, and is also located in the thermomediterranean belt [37]. For more details about the bioclimatic characterization of the studied areas, see Supplementary Materials (Tables S1–S3 and Figures S2–S4).
The timing of olive flowering was estimated according to an airborne pollen-based approach which indirectly measures the floral phenology and intensity of flowering [3,38]. Airborne pollen data were collected continuously using a Hirst-type volumetric pollen trap for Toledo in Spain and Lecce in Italy [39]. In Chaal (Tunisia), pollen was monitored using a Cour sampler [40], and the pollen amounts were downscaled to estimate the continuous comparable data with the pollen concentrations coming from the Hist-type trap [41]. The analysis of the pollen content in the atmosphere allows for the study of the phenology of a large area of olive crops. The pollen season must be defined to best estimate the onset of flowering from local areas and eliminate the effect of long-distance transport that is responsible for the influx of pollen from outside the flowering period in the territory [42].
The calculation of the pollen season (date of the onset of flowering) was based on the method proposed by Ribeiro et al. (2007) and modified by Cunha et al. (2015) [43,44]. This method consisted of annually fitting a non-linear logistic regression model to the daily accumulated curve for the olive pollen type. The start and end dates were mathematically calculated from asymptotes of the non-linear logistic curve. This method for defining the pollen season is based on the shape of the pollen curve and is independent of the annual pollen amount [43], making it optimal for the Olea pollen type in this work since it allows the methodology to be unified for olive crop areas with very different pollen emission rates (Supplementary Materials Figures S5–S7). R software [45] have been used for the calculation of the pollen season by using AeRobiology R package, which implements this method [46].

2.2. Meteorological Data

Daily minimum and maximum temperatures were provided by the weather stations nearest to the sampling sites. The weather stations belonged to the National Council of Agricultural Research in Italy, the Spanish Meteorological Agency in Spain and the National Meteorological Institute in Tunisia. Since the chill and heat calculations require hourly input data, these were estimated from the daily temperatures and the latitude using the idealized temperature curve [47,48,49].

2.3. Chilling and Heat Accumulation Periods

The accumulation periods were estimated following the methodology proposed by Luedeling et al. [27] for the training period selected between 2003 and 2014 for Toledo and Chaal (and only the period 2003–2011 for Lecce, due to unavailability of pollen data). This method followed a statistical model based on a continuous approach to the reproductive cycle in relation to the effects of temperature during the months prior to the flowering dates.
A partial least square (PLS) regression was used to estimate the most relevant periods when the thermal requirements influence the onset of flowering, i.e., the chilling and heat accumulation periods. The phenological date (onset of flowering) was used as the response variable, and the predictors were the daily mean temperatures for each day during the previous months (from November of the previous year to the flowering dates). Temperatures were subjected to an 12-day moving average to ensure that the accumulation periods were clearly recognizable from the statistical method recommended by Luedeling and Gassner [28]. The order of the moving average (12 days) was the result of the optimization process, but is very similar to the 11-day moving average applied by Luedeling et al. [27] in deciduous temperate trees.
The results of the PLS analysis revealed the effect of the temperature of each day on the onset of the flowering period, and the most influential days were highlighted using a variable importance in projection value (VIP) of 0.7, as adapted from Luedeling et al. [27], optimized in this study based on the best results of the model accuracy. The signs of the coefficients were also considered, since positive coefficients imply that the temperatures on these days were positively correlated with the flowering dates, i.e., lower temperatures during winter lead to earlier flowering dates (equivalent to the chilling accumulation period). In contrast, negative coefficients signify that the temperatures were negatively correlated with the flowering dates, i.e., higher temperatures in spring also contribute to earlier flowering (equivalent to the forcing period).
Potential periods with a significant accumulation of chilling and heat units were estimated from the results of the PLS regression, and these periods were then used to calculate the thermal requirements in relation to the flowering dates based on various chilling and forcing models. The package “chillR” for R software was used in order to estimate the chilling and forcing accumulation periods in a statistical way [27].

2.4. Chilling and Heat Models

Three different chilling models were tested, although only the results of the most suitable model for prediction were shown. The first was the chilling hours model [50], which accumulates all hours with temperatures between 0 and 7.2 °C. This approach has been widely used in olive chilling calculations [51].
The second model applied was the Utah model, which determines the chilling effectiveness according to different weights based on hourly temperature thresholds. This model does not assign chilling accumulation to temperatures below 1.4 °C. It assigns an accumulation of 0.5 for temperatures between 1.4 and 2.4 °C and between 9.1 and 12.4 °C, and an accumulation of 1 for temperatures between 2.4 and 9.1 °C. The chilling model assigns a reduction for the chilling effectiveness based on a negative accumulation of −0.5 for temperatures between 15.9 and 18 °C and −1 for temperatures above 18 °C [52].
Finally, the dynamic chilling model proposed by Fishman et al. (1987) [53] was applied too. This model assumes that the winter chill accumulation is the result of a two-step process. In the first step, low temperatures produce an intermediate chilling product. This intermediate product can be converted into the permanent chill accumulation at moderate temperatures, although it can be removed by high temperatures. The “chill portions” are summed throughout the winter. The equations of this model have been described by Darbyshire et al. [54] and were implemented for R software in the chillR package [27], as well as the rest of the chilling models used.
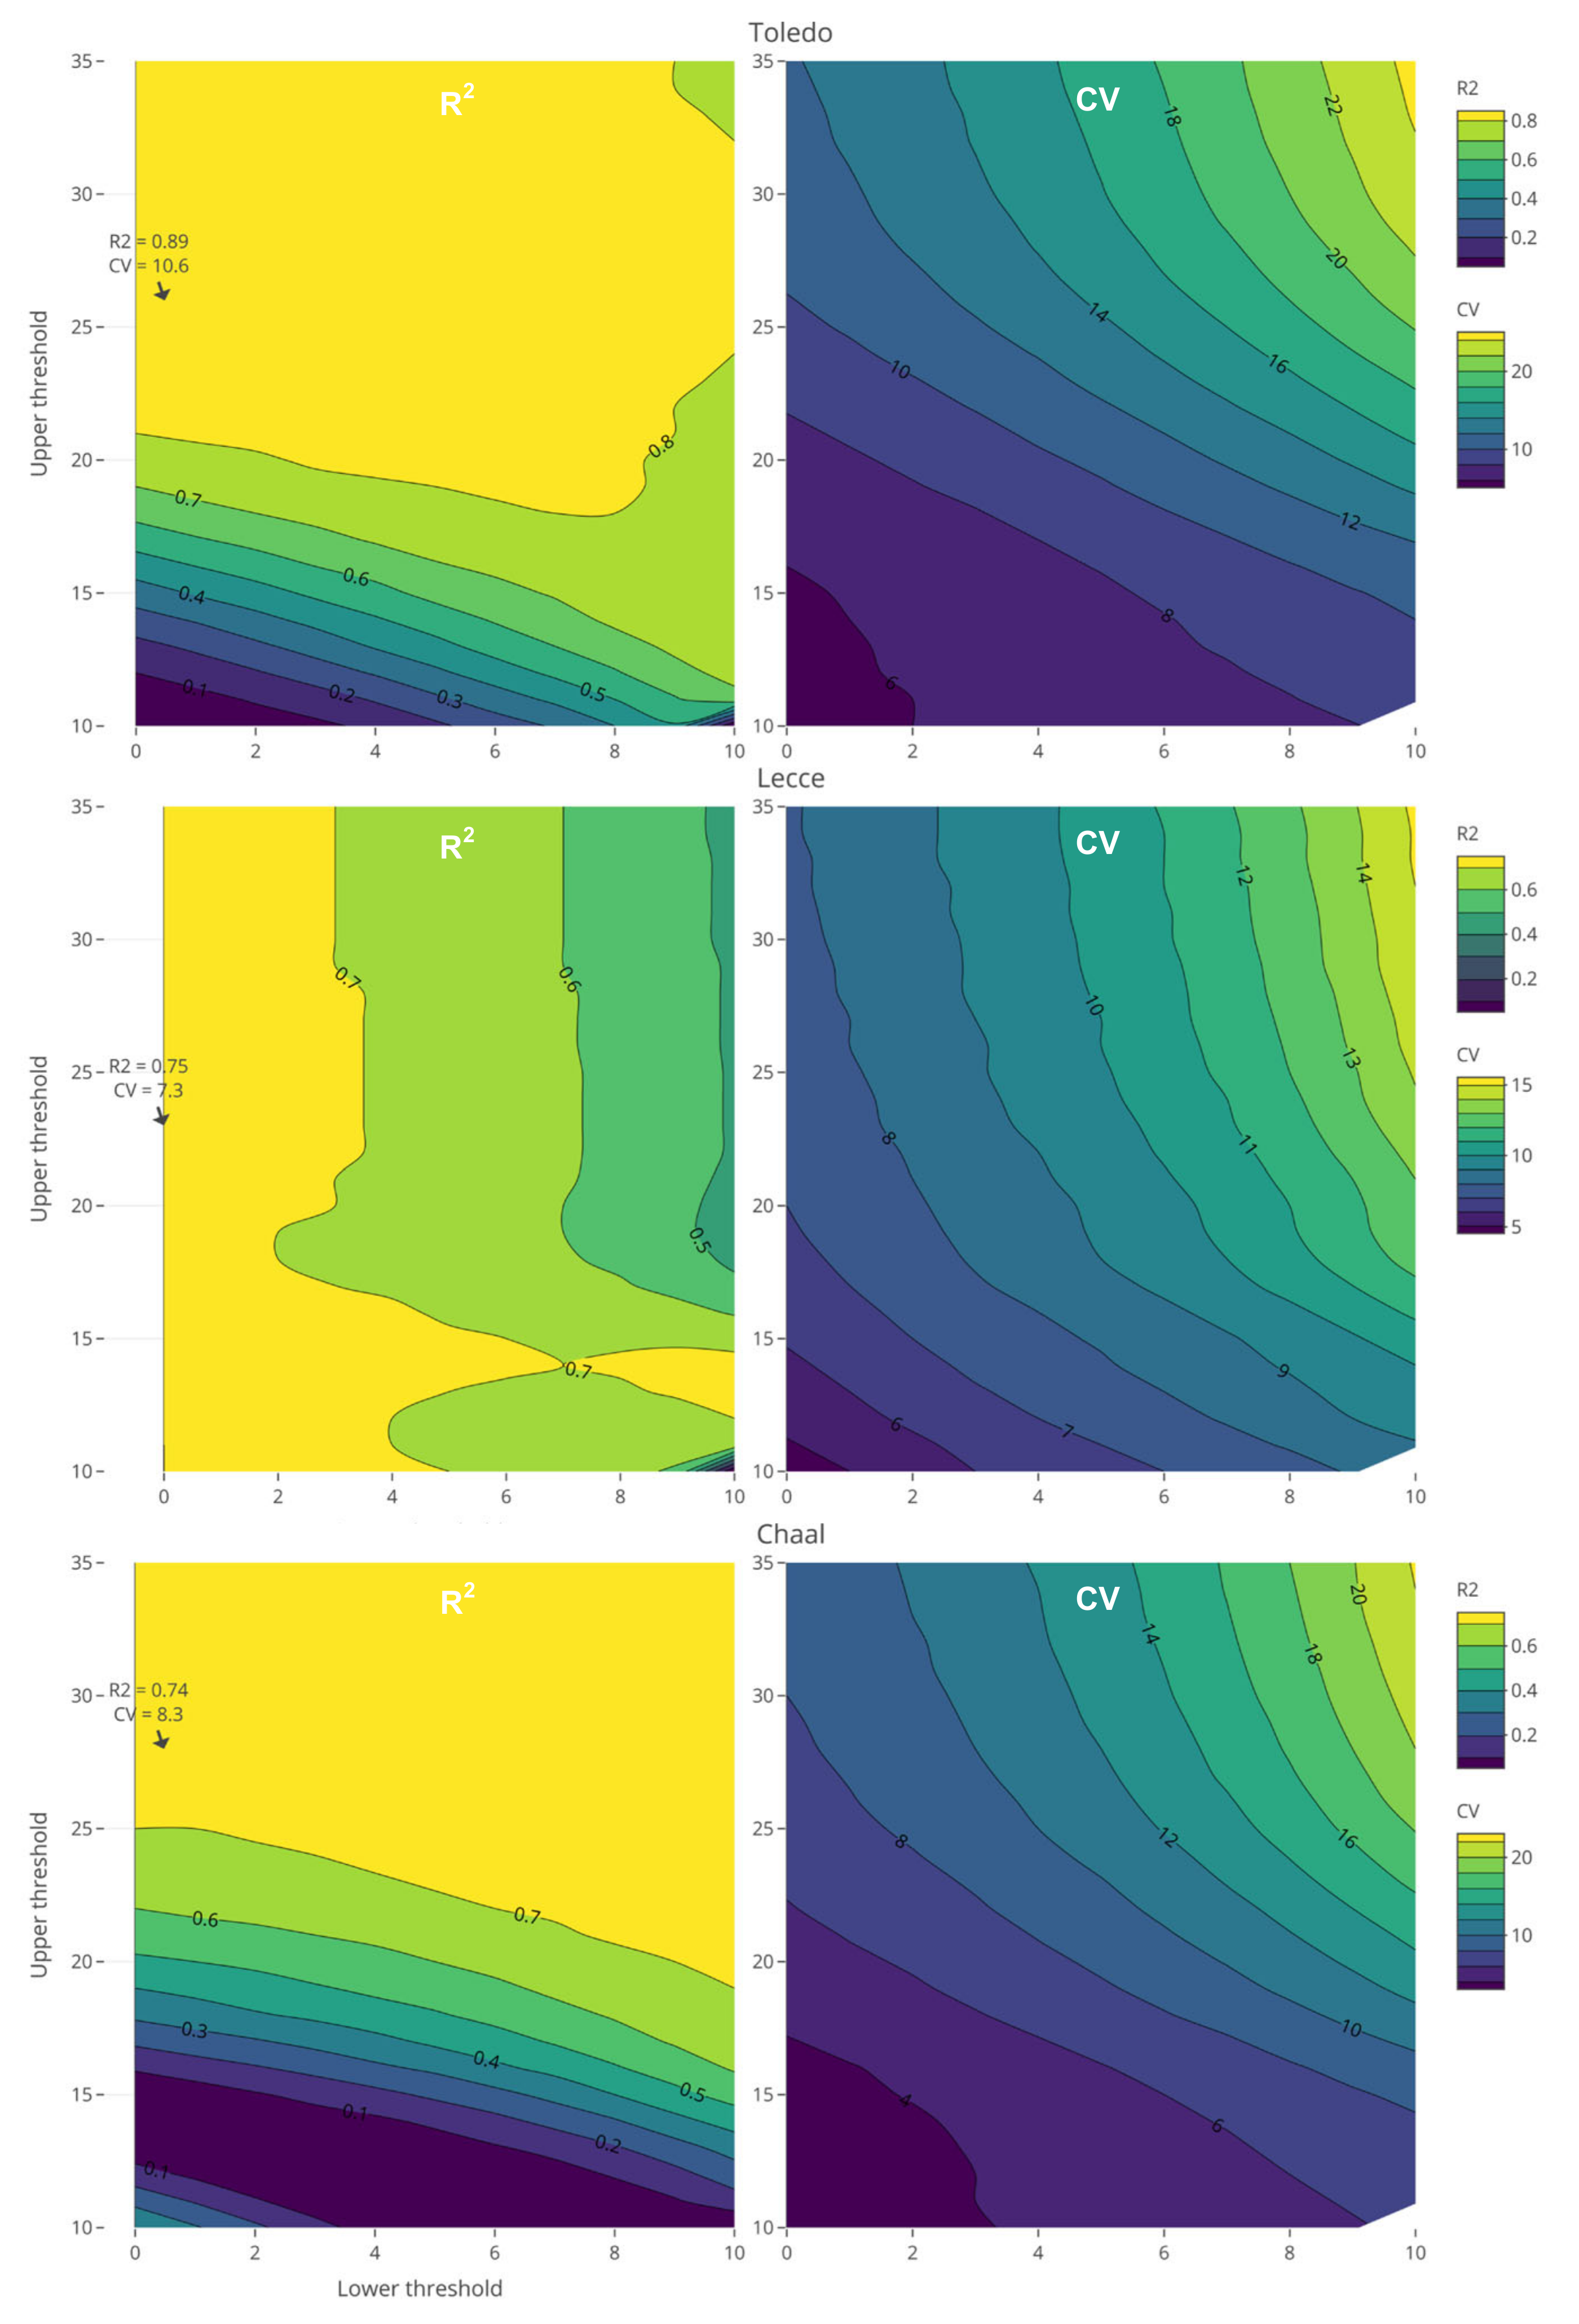
The heat model based on heat accumulation, which was used in this study, was proposed by Anderson et al. [55] for fruit trees. The heat accumulation (growing degree hours, GDHs) is based on three temperature estimates for physiological effects: a lower threshold for heat accumulation, upper threshold and critical temperature, above which heat is no longer effective. While the critical temperature has been adjusted to 36 °C [55], the lower and upper thresholds have been optimized in the olive trees from each study site. The optimization of the thresholds used in thermal forcing calculations was based on the accuracy of the models and the variability of the requirements, i.e., according to the greatest R2 for the models (relationships between the thermal accumulation and the flowering dates) and the lowest coefficient of variation in the year-to-year heat requirements. The lower threshold was evaluated considering values between 0 and 10 °C, and the upper threshold was evaluated considering values between 0 and 35 °C.
The chilling (chill portions) and heat accumulations (growing degree hours) were related to the onset of the flowering period by fitting linear regressions with the flowering dates. Forecasting was also done outside of the training period (2003–2014) for independent cases that were not included during the modeling process. The validation of independent cases (external validation) indicates the real accuracy of the model for preventing overfitting from the models. Specifically, two years were considered for external validation in Toledo (2015–2016), four years in Lecce (1999–2002) and ten years in Chaal (1993–2002), due to the different pollen time series available for the sites. The observed flowering dates were compared with the estimated dates using the estimations produced by the predictive chilling and heat accumulations. The mean absolute error (MAE) was shown for each site.

3. Results and Discussion

3.1. Flowering of Olive Trees

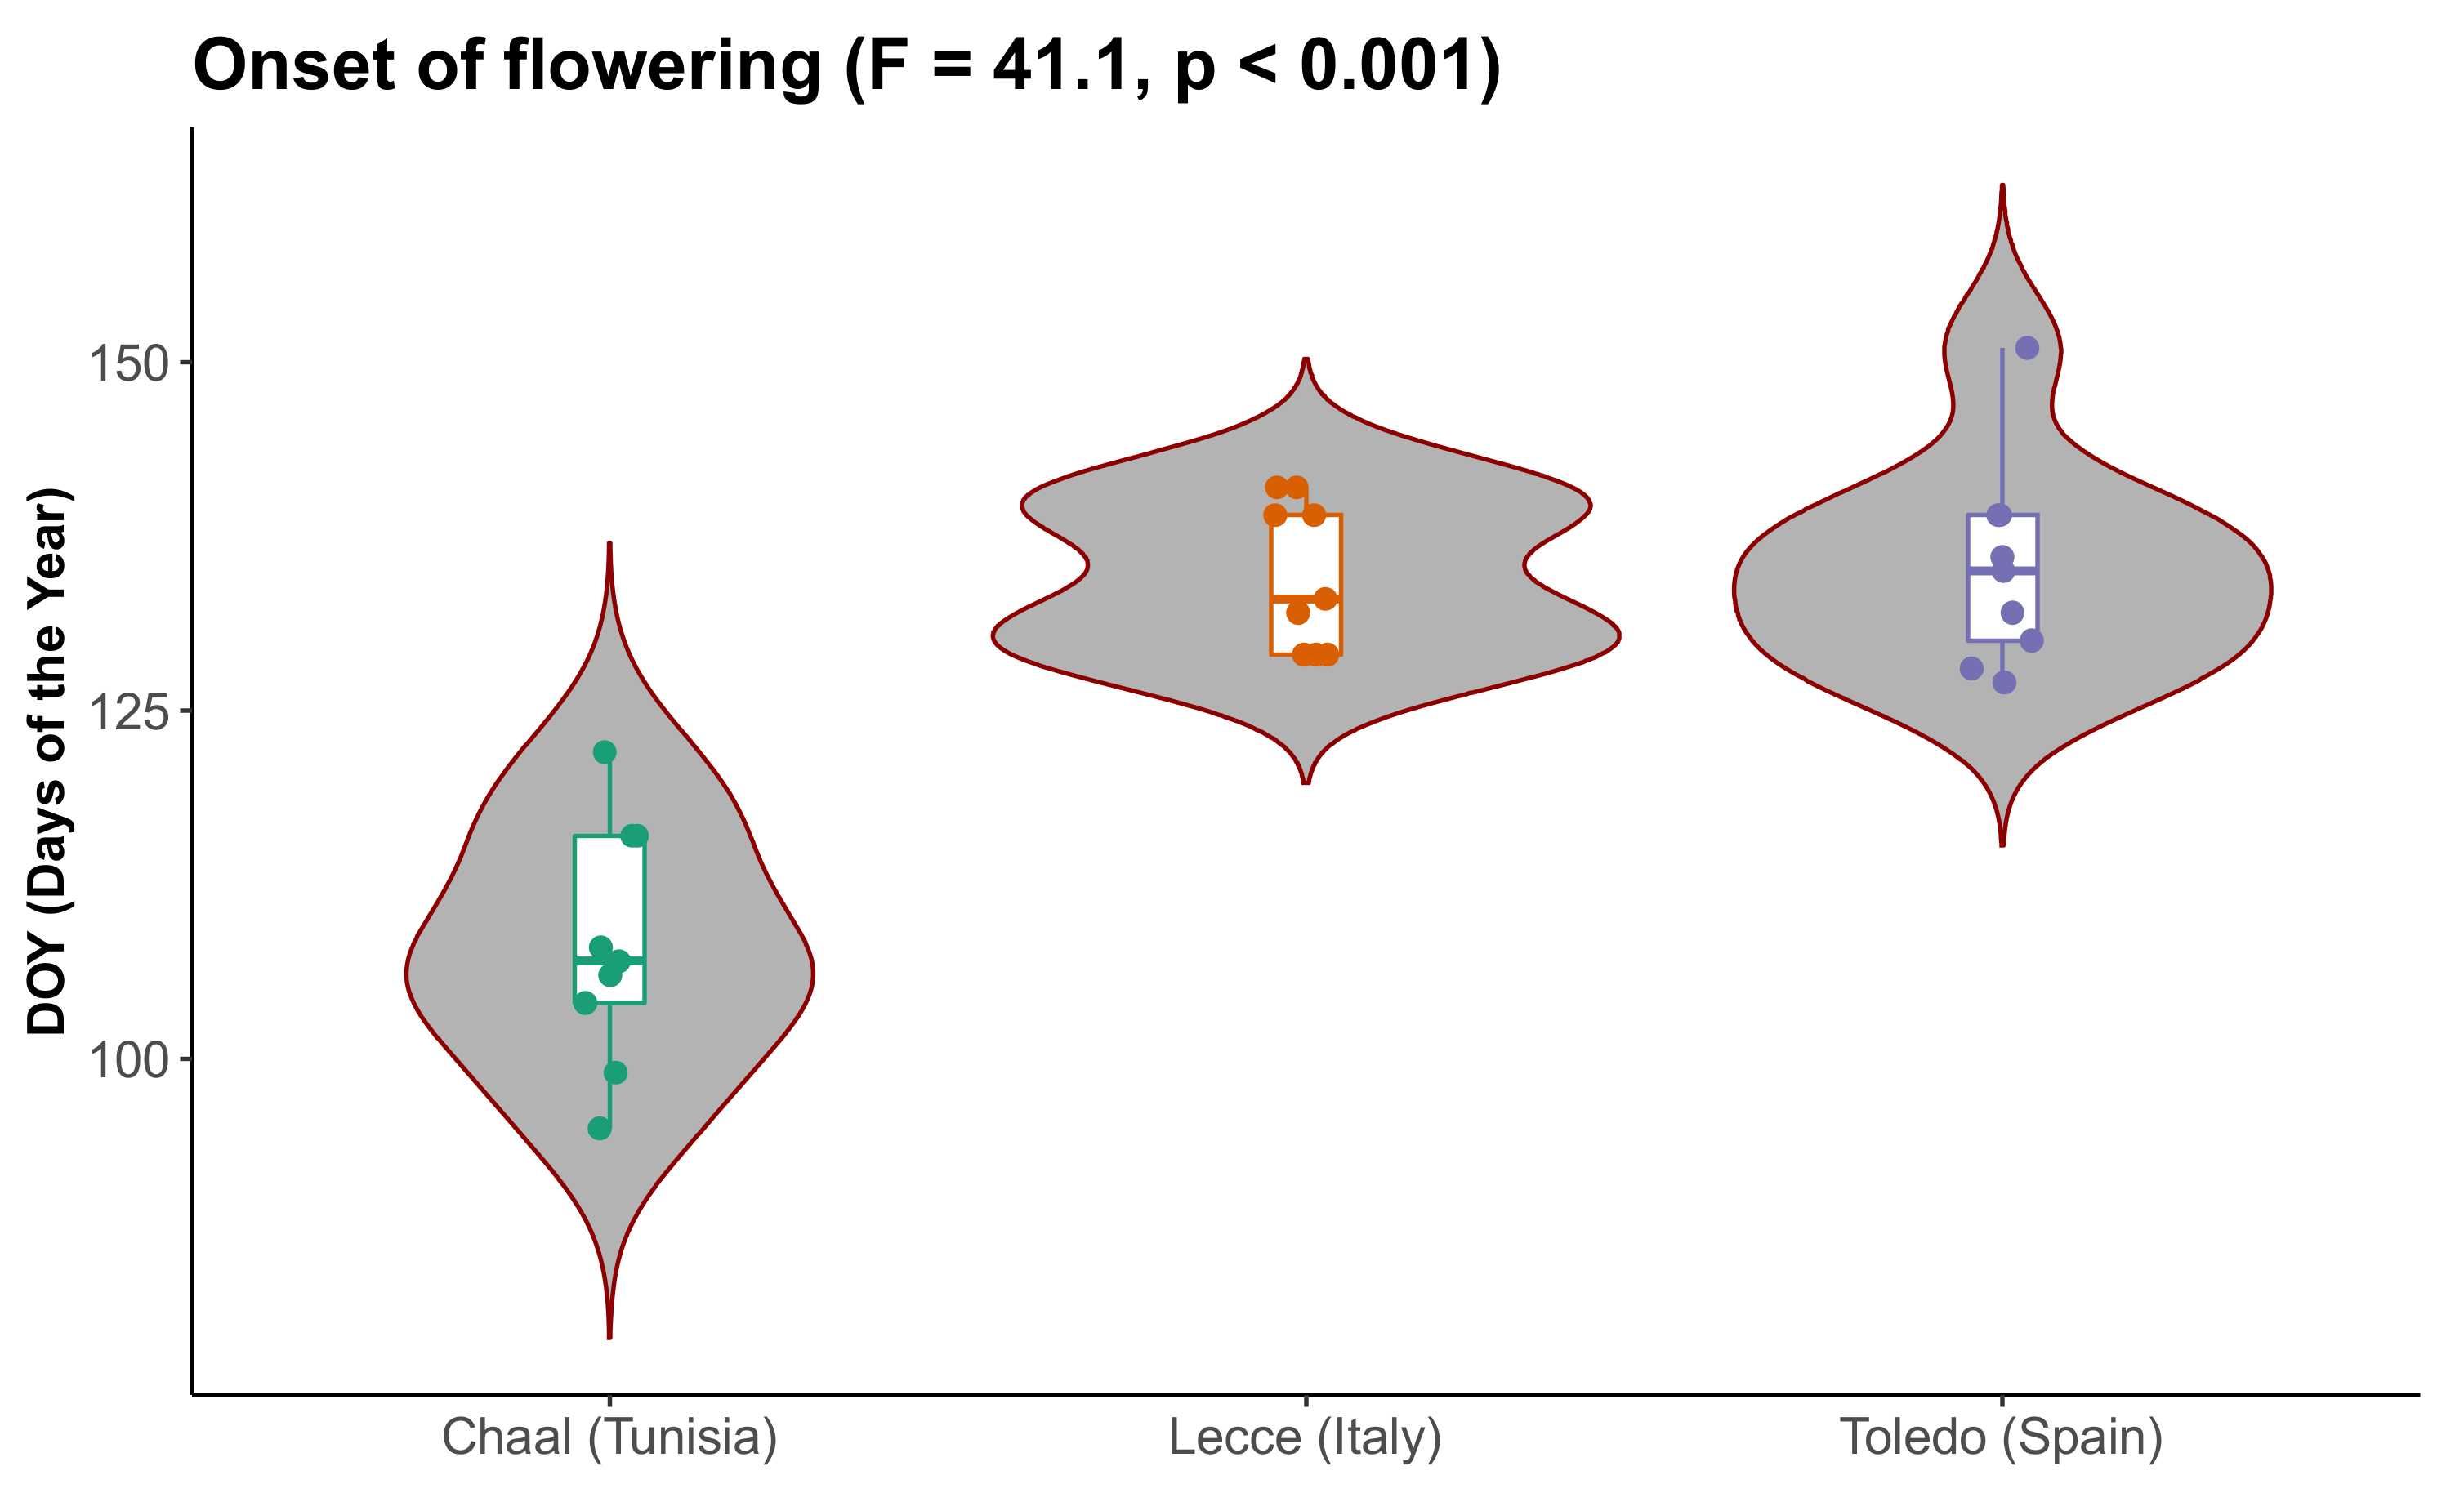
The olive flowering start dates showed significant differences between the studied areas (central Spain, southeastern Italy and central Tunisia (F = 41.1, p < 0.001; Figure 3)). Chaal (Tunisia) was the station where olive trees flower the earliest: the average day was the 18th April (DOY 108 ± 7, average value ± standard deviation).
The maximum and minimum monthly temperature during the olive preflowering period is noticeably higher in Chaal compared to the Toledo and Lecce stations (Figure 2). The onset of flowering occurs in southern Italy (Lecce) and central Spain (Toledo) on average on the 14th and 15th May (DOY 134 ± 5 and 135 ± 8), respectively.
The bioclimatic characterization of the respective study areas according to Rivas-Martínez et al. (2011) may explain these phenological differences, i.e., Chaal is located in warmer areas [56]. However, temperature levels are not the only relevant factor for floral phenology in olive trees; their distribution during the year (seasonality) and temperature ranges (continentality) are also important [25]. The maximum and minimum monthly temperatures between Toledo and Lecce showed different patterns: in general, the minimum monthly temperatures were significantly higher in Lecce than in Toledo for November–May (Figure 2), as winters are colder in Toledo due to its greater continentality. See the bioclimatological characterization in Figure 2 and the Supplementary Material [37].

3.2. Estimation of the Thermal Accumulation Periods

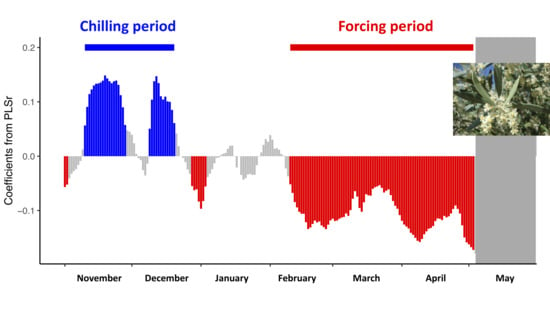
The critical phases to apply the chilling and heat models in Toledo (Spain), Lecce (Italy) and Chaal (Tunisia) were identified based on the results of the PLS analysis for the estimation of the thermal accumulation periods (Figure 4). From a physiological point of view, this statistical approach could be useful for a better understanding of the dormancy process, rather than considering arbitrary dates for the possible start of thermal accumulation [19]. This methodology relates the onset of flowering with the daily meteorological data in a continuous way, indicating the length of the chilling and heat accumulation periods (forcing periods) according to the positive (chilling requirements) or negative (heat requirements) coefficients for each daily temperature [27]. The identification of both the chilling and heat accumulation periods may therefore indicate the end date of endodormancy and the start date of the ecodormancy phase [16].
The transition between endodormancy and ecodormancy is not easily distinguishable, although physiological and anatomical changes have been reported in olive flower buds during dormancy compared to vegetative buds [57,58,59]. The flower buds of other tree species, such as sweet cherry, were differentiated and remained at an early dormant stage during the entire dormancy phenomenon, and no morphological changes were observed when the chilling requirements were fulfilled (end of endodormancy) [26]. The fact that endodormancy and ecodormancy phases are not clearly defined from a morphological point of view supports the idea that statistical approaches such as the ones used in this work may help analyze the biological meaning of temperature on the different processes involved in dormancy.
The critical period for the chilling accumulation was identified in Toledo from mid-November to late December (10th November–20th December). The Chaal and Lecce stations showed a shorter chilling accumulation period than Toledo. A short chilling period was identified in Lecce only during the second half of November and early December (29th November–10th December). In Chaal the chilling accumulation occurred between the 25th November and 18th December (Figure 4). Our results showed that chilling requirements were fulfilled between late autumn and early winter, after the moment in which Rallo and Martin (1991) hypothesized that floral initiation occurs. Thus, chilling must be fulfilled to release the ecodormancy of potentially reproductive olive buds [4].
The heat accumulation period was similar between both Chaal and Lecce from December 27th and 18th of December, respectively, to 4th and 23rd April, respectively, precisely when the chilling period occurred (Figure 4). The critical chilling and heat accumulation periods in terms of flowering dates were almost connected—i.e., the heat accumulation begins immediately when chilling accumulation ends—And cover a long period of time until the beginning of flowering.
However, the results for the Toledo station showed a longer period of time between the chilling and forcing periods that was significantly related to the onset of flowering; i.e., there is a period of time after the chilling requirements are fulfilled when the temperature is not statistically related to olive flowering. The heat accumulation period occurred later in the Lecce and Chaal sites, from mid-February (10th February) to early May (3rd May), at the beginning of the range of flowering start dates for the study period (Figure 4). The fact that the chilling and heat accumulation periods appear disconnected may be due to the greater continentality of Toledo, where the requirements for the release of ecodormancy are fulfilled later.

3.3. Calculation of the Thermal Requirements

The chilling hours model [50] was the optimal method to calculate the chilling requirements according to the accuracy of the forecasting in this study. The chilling (chilling hours, CH) and heat (growing degree hours, GDH) requirements of the olive trees for the three studied stations are shown in Table 1. However, obviously these measurements cannot be compared between the stations as these values have been calculated from different thermal requirement periods. However, this information is very valuable for assessing the interannual variability of the flowering start dates for the different sites.
The chilling requirements were an average of 395.9 ± 74.2 CH in the Toledo station, and a higher value than the chilling accumulations for both Lecce and Chaal stations (52.8 ± 36.2 and 39.6 ± 29.9 CH, respectively) due to their shorter accumulation period. The Utah [52] and dynamic methods [53] were also used to analyze the chilling requirements, but poor results were observed, mainly for Lecce and Chaal. Although the Utah and dynamic models have shown accurate results for modeling the phenology of temperate fruit trees [5,19], in our case the very short chilling periods statistically related to olive flowering did not allow for a comparison of the different models. The best results were obtained by the simplest model [50], possibly due to the shortness of the chilling accumulation periods. Several previous studies have reported that the Utah chilling model performs poorly in warm areas such as the Mediterranean region [27], and even Benmoussa et al. (2017a) proposed that new models for chilling calculations must be developed for warm areas such as Tunisia.
Therefore, as shown in the results, the relationship between the heat accumulation and the beginning of the flowering period was stronger than the relationship with the chilling accumulation. Menzel et al. (2006) [60] found that the temperature of the preceding months produced significant changes in the phenological event, and plants were more sensitive to spring temperatures when heat requirements were fulfilled. El Yaacoubi et al. (2014) suggested that heat accumulation in olive flowering is more important than the chilling requirements, and that the timing of the flowering period is closely associated with the heat requirements, as documented by other authors [51].
Luedeling et al. (2013b) in their work that proposed the statistical method used, indicated that the forcing period was much more clearly defined than the chilling period, which sometimes showed ambiguous periods for chilling fulfilment in woody fruit plants [24,33]. However, for other fruit trees such as Pistacia vera or Prunus dulcis, Benmoussa et al. (2017a, 2017b) and El Yaacoubi et al. (2019) [61] documented the chilling periods for several pistachio and almond trees cultivars that were much longer than the forcing period in warm areas of the Mediterranean region. Longer time series may be necessary for a better understanding of the relationship with chilling accumulations in warm areas [28].
In terms of the heat requirements, Lecce and Chaal were the stations with the highest accumulation (28,570.9 ± 2549.3 and 26,320.5 ± 2195.4 GDH, respectively), while the Toledo station recorded the lowest heat requirements (19,563.7 ± 2022.3 GDH (Table 1)), driven by the lowest temperatures of all the stations (Figure 3) and the shortest heat accumulations period statistically calculated in the Figure 4. The optimization of the heat models based on different thresholds (lower and upper thresholds) is shown in the Figure 5. Both thresholds have been optimized in olive trees based on the best results for the relationships between the thermal accumulation and flowering start dates (according to the greatest R2 coefficient) and the lowest coefficient of variation. The lowest selected threshold was similar for the three sites: 1 °C in Toledo and Chaal and 0 °C in Lecce. The optimal upper threshold was also similar for all stations, and varied between 23 and 28 °C. Toledo and Chaal registered the highest upper thresholds (26 and 28 °C, respectively), and Lecce the lowest upper threshold (23 °C); these thresholds were used for the heat models as the optimal in the olive trees for the stations studied. These results revealed minor differences in the thresholds used to calculate heat requirements with the method proposed by Anderson et al. (1986).
The relationships between the chilling and heat accumulation and the onset of the flowering period showed a strong influence of the heat accumulation (growing degree hours) for the three stations in the study (Figure 6), while a weaker relationship was observed between the chilling requirements and the onset of flowering. The strongest relationships in terms of the heat and chilling requirements were achieved for the Toledo station with R2 = 0.89 and R2 = 0.23, respectively. A greater understanding of the chilling phenomenon could be obtained by using phenological events related with the real metabolic activation in plants [18]. It would be interesting to study chilling and heat accumulation periods using a PLS approach, considering that phenological events affect the development of the vegetative cycle or budbreak time from field observations or remote sensing data [22,62,63].

3.4. Predictive Models and Applications

Olive trees have very specific thermal requirements and are therefore a very sensitive indicator of climate change [3]. Overall, a reduction in chilling accumulation and an increase in heat accumulation can be expected in the main olive-growing areas [64], which may significantly modify the phenological cycles and promote changes in the quantity and quality of olive harvests [14,65,66].
The results of this work have important implications in view of the effect of global warming on crucial Mediterranean-region agronomic trees such as olives. Climate change may lead to a deficient chilling fulfilment as a result of rising air temperatures in autumn and winter, and these alterations will be more pronounced in the Mediterranean area [67,68]. The timing of phenological olive tree development in relation to climate change (increasing temperature, extreme precipitation events, season shifts, etc.) is crucial during late winter and early spring, since the most sensitive stages of olive bud development occur around the budburst phenophase [17]. As both extreme meteorological conditions (i.e., frost events or heat waves) and plant phenology are related to seasonal temperatures, the risk of damage in the future will depend not only on the change in the frequency and occurrence of extreme events, but also on the shifting phenology of olive trees.
In practical terms, this work offers accurate predictions of the onset of the flowering period, which is one of the most important applications of this type of model [20,21]. Considering both the chilling and heat requirements in Toledo, a linear model was generated where the estimated days displayed a mean absolute error (MAE) of 4.4 days from the independent years. For Lecce, the error (MAE) was 4.8 days and for Chaal 4.4 days (Figure 7). These are important findings from a clinical point of view, since olive pollen is one of the most important causes of pollen allergy in the Mediterranean basin. The results of the forecasting models provide an accurate way to alert the allergic population of the start date of the highest levels of pollen exposure [69].
These forecasting models are based on relating the phenological events to the fulfilment of thermal requirements during the statistically calculated accumulation periods, in contrast to other statistical approaches that apply the premise that thermal requirements attain a specific constant level (thermal threshold), and that phenological events occur when the plant reaches that threshold [6]. However, the two approaches are not mutually exclusive but complementary, as they only differ in that they maintain the thermal units (thermal threshold models) or the accumulation period constant (our statistical approach).

4. Conclusions

The physiological processes and the environmental parameters that regulate the reproductive cycle of the olive tree are the subject of numerous studies. Our work focuses on defining the thermal accumulation periods related to the temperature balance needed to fulfil the chilling and heat requirements required for metabolic activation and budbreak time. The results shed some light on the theoretical approach of dormancy induction. From an empirical point of view, it is difficult to identify the point when the different processes that are part of the dormancy period occur—i.e., endodormancy and ecodormancy. Our results allow the chilling and heat accumulation periods to be defined for different locations using statistical models based on the behavior of the fruit trees according to the chilling and heat requirements in a continuous way. Thermal accumulation patterns in olive trees are strongly associated with the bioclimatic conditions in the olive-growing areas, so each station studied (Toledo, Spain; Lecce, Italy; Chaal, Tunisia) showed its own particularities due to its bioclimatic peculiarities within the Mediterranean macroclimate. The chilling period was more evident in colder and more continental bioclimatic areas, while the heat accumulation period was clearly defined and showed a close relationship with the timing of the olive flowering. Understanding the chilling periods in warmer areas requires the study of longer phenological time series and the consideration of other phenological events such as the development of the vegetative cycle or budbreak time. Heat requirements may be used to generate accurate forecasting models to predict the beginning of the olive bloom. Predictions with an average error of four days were generated in this work, which considers both the chilling and heat requirements in Mediterranean areas. The accuracy and error of the models predicting olive pollination are sufficient to alert allergy sufferers to the start of high allergenic risk periods in Mediterranean cities.

Supplementary Materials

The following are available online at https://www.mdpi.com/1999-4907/11/8/835/s1, Figure S1: Topographical characterization of the three sampling stations (Toledo, Lecce and Chaal) and olive crops in the surrounding areas, Figure S2: Bioclimatic characterization of Toledo (Spain), Figure S3: Bioclimatic characterization of Lecce (Italy), Figure S4: Bioclimatic characterization of Chaal (Tunisia), Figure S5: Calculation of the pollen season according to the logistic method for the entire pollen time-series for Toledo (Spain), Figure S6: Calculation of the pollen season according to the logistic method for the entire pollen time-series for Lecce (Italy), Figure S7: Calculation of the pollen season according to the logistic method for the entire pollen time-series for Chaal (Tunisia), Table S1: Climatic data for Toledo (Spain), Table S2: Climatic data for Lecce (Italy), Table S3: Climatic data for Chaal (Tunisia).

Author Contributions

Conceptualization, J.R., F.O. and R.P.-B.; methodology, J.R., B.L., A.P. and J.O.; software, J.R., B.L., A.P. and J.O.; validation, B.L., A.P., A.B.D. and J.O.; formal analysis, J.R., F.O., M.F. and R.P.-B.; investigation, A.B.D., M.M. and M.F.; resources, B.L., M.M., M.F. and R.P.-B.; data curation, J.R., F.O., B.L. and A.B.D.; writing—Original draft preparation, J.R. and F.O.; writing—Review and editing, J.R., F.O., A.B.D., B.L., A.P., J.O., M.M., M.F. and R.P.-B.; visualization, J.R., F.O., B.L., A.P. and J.O.; supervision, M.M., M.F. and R.P.-B.; project administration, M.M., M.F. and R.P.-B.; funding acquisition, M.M., M.F. and R.P.-B. All authors have read and agreed to the published version of the manuscript.

Funding

This research received no external funding.

Acknowledgments

B. Lara was supported by a predoctoral grant financed by the Castilla-La Mancha Government, the European Social Fund (FSE) and the Youth Employment Initiative (YEI). A. Picornell was supported by a predoctoral grant financed by the Ministry of Education, Culture and Sports of Spain, in the Program for the Promotion of Talent and its Employability (FPU15/01668).

Conflicts of Interest

The authors declare no conflicts of interest.

References

  1. Bonofiglio, T.; Orlandi, F.; Ruga, L.; Romano, B.; Fornaciari, M. Climate change impact on the olive pollen season in Mediterranean areas of Italy: Air quality in late spring from an allergenic point of view. Environ. Monit. Assess. 2013, 185, 877–890. [Google Scholar] [CrossRef]
  2. Rojo, J.; Pérez-Badia, R. Models for forecasting the flowering of Cornicabra olive groves. Int. J. Biometeorol. 2015, 59, 1547–1556. [Google Scholar] [CrossRef]
  3. Orlandi, F.; Garcia-Mozo, H.; Dhiab, A.B.; Galán, C.; Msallem, M.; Romano, B.; Abichou, M.; Dominguez-Vilches, E.; Fornaciari, M. Climatic indices in the interpretation of the phenological phases of the olive in mediterranean areas during its biological cycle. Clim. Chang. 2013, 116, 263–284. [Google Scholar] [CrossRef]
  4. Ramos, A.; Rapoport, H.F.; Cabello, D.; Rallo, L. Chilling accumulation, dormancy release temperature, and the role of leaves in olive reproductive budburst: Evaluation using shoot explants. Sci. Hortic. 2018, 231, 241–252. [Google Scholar] [CrossRef]
  5. Alburquerque, N.; García-Montiel, F.; Carrillo, A.; Burgos, L. Chilling and heat requirements of sweet cherry cultivars and the relationship between altitude and the probability of satisfying the chill requirements. Environ. Exp. Bot. 2008, 64, 162–170. [Google Scholar] [CrossRef]
  6. Darbyshire, R.; Pope, K.; Goodwin, I. An evaluation of the chill overlap model to predict flowering time in apple tree. Sci. Hortic. 2016, 198, 142–149. [Google Scholar] [CrossRef]
  7. Guo, L.; Dai, J.; Ranjitkar, S.; Yu, H.; Xu, J.; Luedeling, E. Chilling and heat requirements for flowering in temperate fruit trees. Int. J. Biometeorol. 2014, 58, 1195–1206. [Google Scholar] [CrossRef]
  8. Wenden, B.; Mariadassou, M. Sweet cherry phenology in the context of climate change: A systems biology approach. Acta Hortic. 2017, 31–38. [Google Scholar] [CrossRef]
  9. Fabbri, A.; Benelli, C. Review Article Flower bud induction and differentiation in olive. J. Hortic. Sci. Biotechnol. 2000, 75, 131–141. [Google Scholar] [CrossRef]
  10. Fernandez-Escobar, R.; Benlloch, M.; Navarro, C.; Martin, G.C. The time of floral induction in the olive. J. Am. Soc. Hortic. Sci. 1992, 117, 304–307. [Google Scholar] [CrossRef] [Green Version]
  11. Connor, D.J.; Fereres, E. The Physiology of Adaptation and Yield Expression in Olive. In Horticultural Reviews; Janick, J., Ed.; John Wiley & Sons, Inc.: Oxford, UK, 2010; ISBN 978-0-470-65088-2. [Google Scholar]
  12. Campoy, J.A.; Ruiz, D.; Egea, J. Dormancy in temperate fruit trees in a global warming context: A review. Sci. Hortic. 2011, 130, 357–372. [Google Scholar] [CrossRef]
  13. Picornell, A.; Buters, J.; Rojo, J.; Traidl-Hoffmann, C.; Menzel, A.; Bergmann, K.C.; Werchan, M.; Schmidt-Weber, C.; Oteros, J. Predicting the start, peak and end of the Betula pollen season in Bavaria, Germany. Sci. Total Environ. 2019, 690, 1299–1309. [Google Scholar] [CrossRef] [PubMed]
  14. Hänninen, H.; Tanino, K. Tree seasonality in a warming climate. Trends Plant Sci. 2011, 16, 412–416. [Google Scholar] [CrossRef] [PubMed]
  15. Luedeling, E. Climate change impacts on winter chill for temperate fruit and nut production: A review. Sci. Hortic. 2012, 144, 218–229. [Google Scholar] [CrossRef] [Green Version]
  16. Lang, G.A. Endo-, para-, and ecodormancy: Physiological terminology and classification for dormancy research. HortScience 1987, 22, 371–377. [Google Scholar]
  17. Orlandi, F.; Garcia-Mozo, H.; Ezquerra, L.V.; Romano, B.; Dominguez, E.; Galan, C.; Fornaciari, M. Phenological olive chilling requirements in Umbria (Italy) and Andalusia (Spain). Plant Biosyst. Int. J. Deal. Asp. Plant Biol. 2004, 138, 111–116. [Google Scholar] [CrossRef]
  18. Rallo, L.; Martin, G.C. The role of chilling and releasing olive floral buds from dormancy. HortScience 1991, 26, 1058–1062. [Google Scholar] [CrossRef] [Green Version]
  19. de Melo-Abreu, J.P.; Barranco, D.; Cordeiro, A.M.; Tous, J.; Rogado, B.M.; Villalobos, F.J. Modelling olive flowering date using chilling for dormancy release and thermal time. Agric. For. Meteorol. 2004, 125, 117–127. [Google Scholar] [CrossRef]
  20. Alcalá, A.R.; Barranco, D. Prediction of Flowering Time in Olive for the Cordoba Olive Collection. HortScience 1992, 27, 1205–1207. [Google Scholar] [CrossRef]
  21. Aguilera, F.; Fornaciari, M.; Ruiz-Valenzuela, L.; Galán, C.; Msallem, M.; Dhiab, A.B.; la Guardia, C.D.; del Mar-Trigo, M.; Bonofiglio, T.; Orlandi, F. Phenological models to predict the main flowering phases of olive (Olea europaea L.) along a latitudinal and longitudinal gradient across the Mediterranean region. Int. J. Biometeorol. 2015, 59, 629–641. [Google Scholar] [CrossRef]
  22. Rojo, J.; Pérez-Badia, R. Effects of topography and crown-exposure on olive tree phenology. Trees 2014, 28, 449–459. [Google Scholar] [CrossRef]
  23. Kumral, N.A.; Kovanci, B.; Akbudak, B. Pheromone trap catches of the olive moth, Prays oleae (Bern.) (Lep., Plutellidae) in relation to olive phenology and degree-day models. J. Appl. Entomol. 2005, 129, 375–381. [Google Scholar] [CrossRef]
  24. Martínez-Lüscher, J.; Hadley, P.; Ordidge, M.; Xu, X.; Luedeling, E. Delayed chilling appears to counteract flowering advances of apricot in southern UK. Agric. For. Meteorol. 2017, 237, 209–218. [Google Scholar] [CrossRef] [Green Version]
  25. Orlandi, F.; Vazquez, L.M.; Ruga, L.; Bonofiglio, T.; Fornaciari, M.; Garcia-Mozo, H.; Domínguez, E.; Romano, B.; Galan, C. Bioclimatic requirements for olive flowering in two Mediterranean regions located at the same latitude (Andalucia, Spain, and Sicily, Italy). Ann. Agric. Environ. Med. 2005, 12, 47. [Google Scholar] [PubMed]
  26. Fadón, E.; Rodrigo, J.; Herrero, M. Is there a specific stage to rest? Morphological changes in flower primordia in relation to endodormancy in sweet cherry (Prunus avium L.). Trees 2018, 32, 1583–1594. [Google Scholar] [CrossRef]
  27. Luedeling, E.; Kunz, A.; Blanke, M.M. Identification of chilling and heat requirements of cherry trees—A statistical approach. Int. J. Biometeorol. 2013, 57, 679–689. [Google Scholar] [CrossRef] [Green Version]
  28. Luedeling, E.; Gassner, A. Partial Least Squares Regression for analyzing walnut phenology in California. Agric. For. Meteorol. 2012, 158, 43–52. [Google Scholar] [CrossRef]
  29. Benmoussa, H.; Luedeling, E.; Ghrab, M.; Ben-Yahmed, J.; Ben-Mimoun, M. Performance of pistachio (Pistacia vera L.) in warming Mediterranean orchards. Environ. Exp. Bot. 2017, 140, 76–85. [Google Scholar] [CrossRef]
  30. Benmoussa, H.; Ghrab, M.; Ben-Mimoun, M.; Luedeling, E. Chilling and heat requirements for local and foreign almond (Prunus dulcis Mill.) cultivars in a warm Mediterranean location based on 30 years of phenology records. Agric. For. Meteorol. 2017, 239, 34–46. [Google Scholar] [CrossRef]
  31. Guo, L.; Dai, J.; Ranjitkar, S.; Xu, J.; Luedeling, E. Response of chestnut phenology in China to climate variation and change. Agric. For. Meteorol. 2013, 180, 164–172. [Google Scholar] [CrossRef]
  32. Luedeling, E.; Guo, L.; Dai, J.; Leslie, C.; Blanke, M.M. Differential responses of trees to temperature variation during the chilling and forcing phases. Agric. For. Meteorol. 2013, 181, 33–42. [Google Scholar] [CrossRef] [Green Version]
  33. Martínez-Lüscher, J.; Kizildeniz, T.; Vučetić, V.; Dai, Z.; Luedeling, E.; van Leeuwen, C.; Gomès, E.; Pascual, I.; Irigoyen, J.J.; Morales, F.; et al. Sensitivity of Grapevine Phenology to Water Availability, Temperature and CO2 Concentration. Front. Environ. Sci. 2016, 4. [Google Scholar] [CrossRef]
  34. el Yaacoubi, A.; Malagi, G.; Oukabli, A.; Hafidi, M.; Legave, J.-M. Global warming impact on floral phenology of fruit trees species in Mediterranean region. Sci. Hortic. 2014, 180, 243–253. [Google Scholar] [CrossRef]
  35. Navas-Lopez, J.F.; León, L.; Trentacoste, E.R.; de la Rosa, R. Multi-environment evaluation of oil accumulation pattern parameters in olive. Plant Physiol. Biochem. 2019, 139, 485–494. [Google Scholar] [CrossRef]
  36. Rivas-Martínez, S.; Penas, Á.; del Río, S.; González, T.E.D.; Rivas-Sáenz, S. Bioclimatology of the Iberian Peninsula and the Balearic Islands. In The Vegetation of the Iberian Peninsula; Springer: Berlin, Germany, 2017; pp. 29–80. [Google Scholar]
  37. Rivas-Martínez, S.; Rivas-Saenz, S.; Penas, A. Worldwide bioclimatic classfication system. Glob. Geobot. 2011, 1, 1–634. [Google Scholar]
  38. Oteros, J.; García-Mozo, H.; Hervás, C.; Galán, C. Biometeorological and autoregressive indices for predicting olive pollen intensity. Int. J. Biometeorol. 2013, 57, 307–316. [Google Scholar] [CrossRef]
  39. Hirst, J.M. An automatic volumetric spore trap. Ann. Appl. Biol. 1952, 39, 257–265. [Google Scholar] [CrossRef]
  40. Cour, P. Nouvelles techniques de d’etection des flux et des retombées polliniques: Étude de la sedimentation des pollens et des spores à la surface du sol. Pollen Spores 1974, 16, 103–141. [Google Scholar]
  41. Orlandi, F.; Oteros, J.; Aguilera, F.; Ben-Dhiab, A.; Msallem, M.; Fornaciari, M. Design of a downscaling method to estimate continuous data from discrete pollen monitoring in Tunisia. Environ. Sci. Process. Impacts 2014, 16, 1716–1725. [Google Scholar] [CrossRef]
  42. Rojo, J.; Pérez-Badia, R. Spatiotemporal analysis of olive flowering using geostatistical techniques. Sci. Total Environ. 2015, 505, 860–869. [Google Scholar] [CrossRef]
  43. Ribeiro, H.; Cunha, M.; Abreu, I. Definition of Main Pollen Season Using a Logistic Model. Ann. Agric. Environ. Med. 2007, 14, 259–264. [Google Scholar] [PubMed]
  44. Cunha, M.; Ribeiro, H.; Costa, P.; Abreu, I. A comparative study of vineyard phenology and pollen metrics extracted from airborne pollen time series. Aerobiologia 2015, 31, 45–56. [Google Scholar] [CrossRef]
  45. R Core Team. R: A Language and Environment for Statistical Computing; R Foundation for Statistical Computing: Vienna, Austria, 2019; Available online: https://www.R-project.org/ (accessed on 16 October 2019).
  46. Rojo, J.; Picornell, A.; Oteros, J. AeRobiology: The computational tool for biological data in the air. Methods Ecol. Evol. 2019, 1371–1376. [Google Scholar] [CrossRef] [Green Version]
  47. Almorox, J.; Hontoria, C.; Benito, M. Statistical validation of daylength definitions for estimation of global solar radiation in Toledo, Spain. Energy Convers. Manag. 2005, 46, 1465–1471. [Google Scholar] [CrossRef]
  48. Linvill, D.E. Calculating chilling hours and chill units from daily maximum and minimum temperature observations. HortScience 1990, 25, 14–16. [Google Scholar] [CrossRef] [Green Version]
  49. Linvill, D.E. Using maximum and minimum temperatures to determine chilling completion. In Proceedings of the II International Peach Symposium 254, Clemson, SC, USA, 19–23 June 1988; pp. 249–254. [Google Scholar]
  50. Weinberger, J.H. Chilling requirements of peach varieties. In Proceedings of the American Society for Horticultural Science; American Society for Horticultural Science: Alexandria, VA, USA, 1950; Volume 56, pp. 122–128. [Google Scholar]
  51. Gabaldón-Leal, C.; Ruiz-Ramos, M.; de la Rosa, R.; León, L.; Belaj, A.; Rodríguez, A.; Santos, C.; Lorite, I.J. Impact of changes in mean and extreme temperatures caused by climate change on olive flowering in southern Spain. Int. J. Climatol. 2017, 37, 940–957. [Google Scholar] [CrossRef]
  52. Richardson, E.A. A model for estimating the completion of rest for ’Redhaven’ and ’Elberta’ peach trees. Hortscience 1974, 9, 331–332. [Google Scholar]
  53. Fishman, S.; Erez, A.; Couvillon, G.A. The temperature dependence of dormancy breaking in plants: Mathematical analysis of a two-step model involving a cooperative transition. J. Theor. Biol. 1987, 124, 473–483. [Google Scholar] [CrossRef]
  54. Darbyshire, R.; Webb, L.; Goodwin, I.; Barlow, S. Winter chilling trends for deciduous fruit trees in Australia. Agric. For. Meteorol. 2011, 151, 1074–1085. [Google Scholar] [CrossRef]
  55. Anderson, J.L.; Richardson, E.A.; Kesner, C.D. Validation of chill unit and flower bud phenology models for “Montmorency” sour cherry. Acta Hortic. 1986, 71–78. [Google Scholar] [CrossRef]
  56. Aguilera, F.; Ruiz, L.; Fornaciari, M.; Romano, B.; Galán, C.; Oteros, J.; Dhiab, A.B.; Msallem, M.; Orlandi, F. Heat accumulation period in the Mediterranean region: Phenological response of the olive in different climate areas (Spain, Italy and Tunisia). Int. J. Biometeorol. 2014, 58, 867–876. [Google Scholar] [CrossRef] [PubMed]
  57. de la Rosa, R.; Rallo, L.; Rapoport, H.F. Olive Floral Bud Growth and Starch Content During Winter Rest and Spring Budbreak. HortScience 2000, 35, 1223–1227. [Google Scholar] [CrossRef] [Green Version]
  58. Fabbri, A.; Alerci, L. Reproductive and vegetative bud differentiation in Olea europaea L. J. Hortic. Sci. Biotechnol. 1999, 74, 522–527. [Google Scholar] [CrossRef]
  59. Pinney, K.; Polito, V.S. Flower initiation in “Manzanillo” Olive. Acta Hortic. 1990, 203–206. [Google Scholar] [CrossRef]
  60. Menzel, A.; Sparks, T.H.; Estrella, N.; Koch, E.; Aasa, A.; Ahas, R.; Alm-Kübler, K.; Bissolli, P.; Braslavská, O.; Briede, A.; et al. European phenological response to climate change matches the warming pattern. Glob. Chang. Biol. 2006, 12, 1969–1976. [Google Scholar] [CrossRef]
  61. el Yaacoubi, A.; Oukabli, A.; Legave, J.-M.; Ainane, T.; Mouhajir, A.; Zouhair, R.; Hafidi, M. Response of almond flowering and dormancy to Mediterranean temperature conditions in the context of adaptation to climate variations. Sci. Hortic. 2019, 257, 108687. [Google Scholar] [CrossRef]
  62. González-Naharro, R.; Quirós, E.; Fernández-Rodríguez, S.; Silva-Palacios, I.; Maya-Manzano, J.M.; Tormo-Molina, R.; Pecero-Casimiro, R.; Monroy-Colin, A.; Gonzalo-Garijo, Á. Relationship of NDVI and oak (Quercus) pollen including a predictive model in the SW Mediterranean region. Sci. Total Environ. 2019, 676, 407–419. [Google Scholar] [CrossRef]
  63. Testa, S.; Soudani, K.; Boschetti, L.; Borgogno-Mondino, E. MODIS-derived EVI, NDVI and WDRVI time series to estimate phenological metrics in French deciduous forests. Int. J. Appl. Earth Obs. Geoinf. 2018, 64, 132–144. [Google Scholar] [CrossRef]
  64. Santos, J.A.; Costa, R.; Fraga, H. Climate change impacts on thermal growing conditions of main fruit species in Portugal. Clim. Chang. 2017, 140, 273–286. [Google Scholar] [CrossRef]
  65. Benlloch-González, M.; Sánchez-Lucas, R.; Bejaoui, M.A.; Benlloch, M.; Fernández-Escobar, R. Global warming effects on yield and fruit maturation of olive trees growing under field conditions. Sci. Hortic. 2019, 249, 162–167. [Google Scholar] [CrossRef]
  66. Moriondo, M.; Ferrise, R.; Trombi, G.; Brilli, L.; Dibari, C.; Bindi, M. Modelling olive trees and grapevines in a changing climate. Environ. Model. Softw. 2015, 72, 387–401. [Google Scholar] [CrossRef]
  67. Giorgi, F.; Lionello, P. Climate change projections for the Mediterranean region. Glob. Planet. Chang. 2008, 63, 90–104. [Google Scholar] [CrossRef]
  68. Guiot, J.; Cramer, W. Climate change: The 2015 Paris Agreement thresholds and Mediterranean basin ecosystems. Science 2016, 354, 465–468. [Google Scholar] [CrossRef] [PubMed]
  69. Karatzas, K.D. Informing the public about atmospheric quality: Air pollution and pollen. Allergo J. 2009, 18, 212–217. [Google Scholar] [CrossRef]
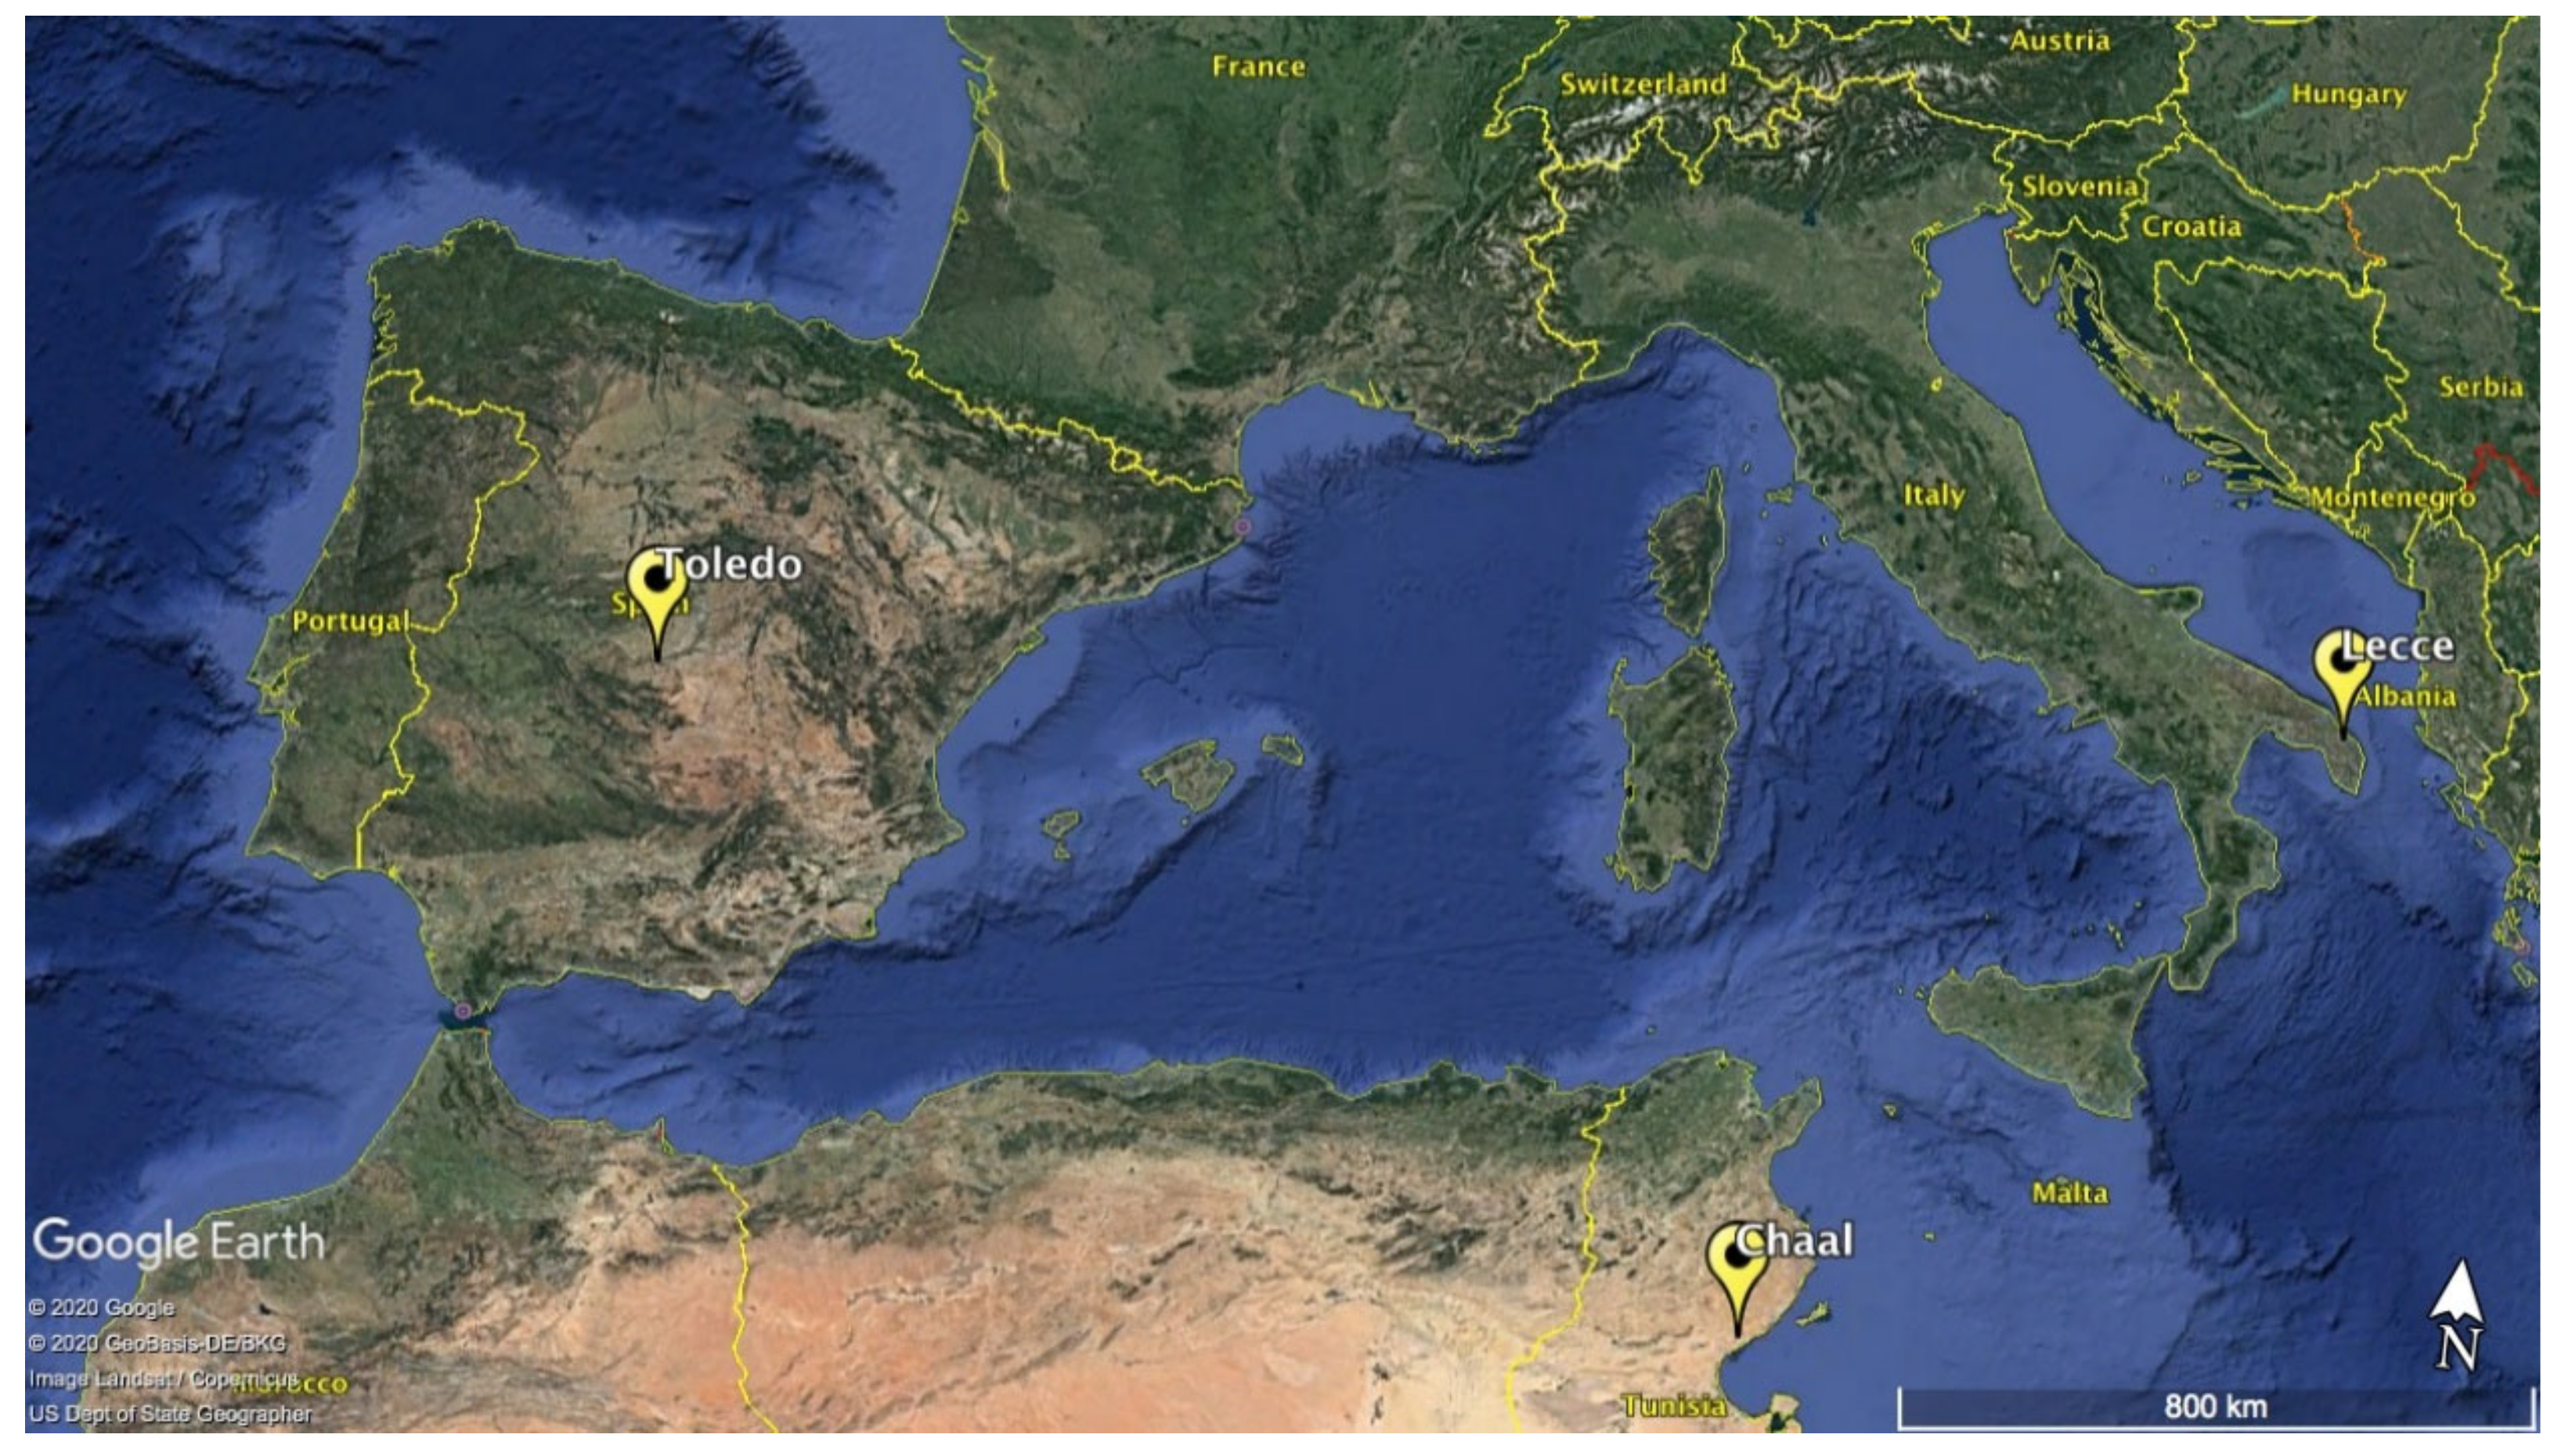
Figure 1. Location of the sampling stations (source: Google Earth©).
Forests 11 00835 g001
Figure 2. Meteorological data (average monthly maximum and minimum temperature) between the different sampling stations. Calculated for the period common to the three stations, 2002–2011.
Forests 11 00835 g002
Figure 3. Dispersion of the data of the start date of flowering in days of the year (DOY) for each station in the common study period (2003–2011).
Forests 11 00835 g003
Figure 4. Estimation of the chilling and heat accumulation periods according to the thermal requirements. The chilling periods are shown in blue and heat periods in red. Horizontal lines represent the proposed chilling period (blue) and heat period (red). The dark grey area represents the range (min–max) of the onset of flowering for the periods studied.
Forests 11 00835 g004
Figure 5. Selection of the most accurate heat accumulation thresholds based on the consensus between the maximum R2 coefficient (relationship heat accumulation—Onset of flowering) and lower coefficient of variation possible.
Forests 11 00835 g005
Figure 6. Regression analysis between the chilling and heat accumulation units with respect to the date of the onset of flowering (heat requirements have been calculated taking into account the optimum thresholds).
Forests 11 00835 g006
Figure 7. Estimated vs. observed start date of flowering based on the chilling and heat requirements.
Forests 11 00835 g007
Table 1. Calculations for the Chilling and Heat Requirements According to the Estimated Thermal Accumulation Periods (Heat Requirements have Been Calculated Based on the Optimal Thresholds). CH, Chill Hours; GDH, Growing Degree Hours.
Toledo (Spain)Lecce (Italy)Chaal (Tunisia)
SeasonsCHGDHSeasonsCHGDHSeasonsCHGDH
1998/199991.027,283.81998/199944.021,105.2
1999/200051.026,583.41999/200097.025,863.9
2000/200174.034,348.62000/200126.025,589.7
2001/2002140.030,364.12001/200267.025,914.5
2002/2003291.020,306.42002/20032.026,165.02002/200339.026,287.2
2003/2004407.015,657.42003/200439.026,735.22003/200490.025,392.7
2004/2005477.019,246.82004/200510.025,639.32004/200517.026,445.2
2005/2006414.021,110.12005/200661.026,560.82005/200625.026,388.6
2006/2007330.019,253.02006/200767.030,706.62006/20073.030,186.0
2007/2008451.020,848.82007/200848.029,016.22007/200818.028,153.6
2008/2009537.019,723.32008/200949.027,870.82008/200915.025,421.2
2009/2010374.019,344.02009/201023.031,526.82009/20100.025,137.1
2010/2011416.022,419.02010/201132.028,621.02010/201163.023,998.3
2011/2012368.017,636.9 2011/20120.025,447.6
2012/2013324.016,604.6 2012/201344.029,177.1
2013/2014482.022,149.6 2013/201492.027,302.5
2014/2015287.021,473.5
2015/2016385.018,119.2
Mean395.919,563.7Mean52.828,570.9Mean39.626,320.5
SD74.22022.3SD36.22549.3SD29.92195.4
CV%18.710.3CV%68.58.9CV%75.68.3