Article

Evaluation of Environmental Impact on Selected Properties of Lime (Tilia Cordata Mill.) Wood

1
Department of Wood Science and Thermal Technics, Faculty of Wood Technology, Poznań University of Life Sciences, Wojska Polskiego 38/42, 60-637 Poznań, Poland
2
Department of Chemistry, Faculty of Wood Technology, Poznań University of Life Sciences, Wojska Polskiego 75, 60-625 Poznań, Poland
3
Institute of Chemical Wood Technology, Faculty of Wood Technology, Poznań University of Life Sciences, Wojska Polskiego 38/42, 60-637 Poznań, Poland
*
Author to whom correspondence should be addressed.
Forests 2020, 11(7), 746; https://doi.org/10.3390/f11070746
Submission received: 31 May 2020 / Revised: 1 July 2020 / Accepted: 6 July 2020 / Published: 9 July 2020
(This article belongs to the Section Wood Science and Forest Products)

Abstract

:
The external and internal factors in the tree development process affect wooden structures and properties. They depend on, for example, a plant species, its age, part and growth conditions. The present study investigated the chemical structure and physical properties of the common urban tree species: small-leaved lime (Tilia cordata Mill.). The properties of trees growing in an urban agglomeration, by a roadside and in a forest, i.e., areas varying in degrees of an environmental stress impact, were compared. Tree-ring width and density, selected hygroscopic properties (sorption hysteresis and isotherms), wood chemical content (percentage content of: holocellulose, cellulose, pentosanes, lignin and substances soluble in 1% NaOH and EtOH) as well as the content of selected chemical elements (Fe, Zn, Cu, Pb, Cd, K, Na, Mg and Ca) were studied. The analysis of the case shows no impact of the environmental stress on the growth patterns characterized by ring width index (RWI). Two-factor analysis of variance (ANOVA) revealed impact significance of growth environment and cambial age on the content of each of the investigated components and chemical elements. There was a relationship demonstrated that for a tree growing in an agglomeration with the highest environmental stress the content of cellulose and lignin was the lowest, whereas the content of substances soluble in NaOH and EtOH was the highest. For mature wood growing under the same conditions, the results corresponded to the highest Zn, Cu, K, Na, Mg and Ca content. It was also shown that the environmental stress affected hygroscopicity which was the consequence of chemical component percentage content. The research proved that Tilia cordata Mill. responded to environmental stress with alternations in its chemical or/and physical properties.

1. Introduction

The impact of anthropogenic factors on the environment affects adversely trees’ growth and development. The knowledge of an environmental stress influence on the trees’ growth and development can be applied mainly to develop adequate methods of natural and economic environmental management. In this situation, information on tree species with high adaptability may be particularly useful for forest management and the wood industry. Moreover, due to the economic use of wood raw material (biomass), an equally important aspect is to determine the environmental stress impact on the properties of harvested wood, which will assess its suitability for a specific application.
The lowest environmental stress regards trees growing in a forest. This is determined by its natural microclimate, a positive impact of the natural environment related to decomposition of leaves and access to nutrients, the occurrence of mycorrhizal fungi, and natural protection of the stand against harmful pollution [1]. The moderate anthropogenic impact on the environment is characteristic of trees growing by alleys, traffic routes running through forest areas. Such trees are subjected to salt stress resulting from salinity of roads in winter. They are exposed to year-long car exhaust emissions and also their branches spreading over a road surface are damaged mechanically. Trees growing in cities are most vulnerable to environmental stress with their hindered access to soil to which access of air is also limited. They suffer from water and mycorrhizal fungi shortages in soil and roots are subject to cutting and damage. What is more, soil in agglomerations tends to be salt-laden and often chemically polluted, and atmospheric air is polluted with detrimental gases and dusts. Moreover, air temperature in cities is higher and air is drier. The thermal situation is often deteriorated by heat emission reflected back from walls and pavements.
Climate change observations in Poland indicate an explicit tendency of a temperature increase, a longer period of plant active growth and it beginning earlier, a drop in the number of days with snow cover, an increase in winter precipitation and a decrease in summer precipitation as well as an increase in maximum daily precipitation [2]. Tanguy De Jaegere et al. [3] and Erichsen et al. [4] observe a superior lime ability to adapt due to climate warming and research results by Barniak et al. [5] confirming the connection of Tilia cordata Mill. tree radial growth with climate.
Small-leaved lime (Tilia cordata Mill.) is one of two lime species present in Poland, along with large-leaved lime (Tilia platyphyllos L.). It grows all over the country [6]. The tree is up to 30 m tall with a diameter up to 2 m at the height of 1.3 m. The tree crown is ovoid and dense; it develops a strong rooting system with deep side roots spreading diagonally and widely [7]. Limes are usually resistant to frost, they grow in average soil, rather fertile and fresh, not too dry [8]. Current tree stands with small-leaved limes do not play a significant role in Polish forests. The share of the species in State Forests, which administer nearly 80% of the forest surface in Poland, is estimated as 9.4%, and it was stated as a prevailing species in about 2900 stands, with total surface of almost 6500 ha [9]. Tilia cordata Mill. is treated as one of the most useful trees in landscape planting and planting within urban agglomerations due to its aesthetic aspects [10]. The suitability of Tilia cordata Mill. for planting is determined by the fact that it is a good phytoremediant [11]. The amount of literature on the environmental stress impact on the species is moderate. For example, Popek et al. [12] stated that Tilia cordata Mill. microdusting has an adverse influence on photosynthesis and chlorophyll fluorescence in an assimilation apparatus. It was also proven that pollution in the form of car exhaust emissions result in reducing Tilia cordata Mill. seed production [13].
Disturbances to the growth and development of trees as a result of adverse effects of industry and anthropogenic factors on the environment may influence the wood chemical composition, which does not leave its properties unaffected. A polluted environment may cause a rise of heavy metal content in wood, i.e., lead and cadmium [14,15]. In the paper of Kiaei et al. [16] it was determined that there was a relationship between the content of elements such as nickel, lead, cadmium, zinc and iron and wood density. Moreover, Kiaei et al. [16] proved the relationship between selected heavy metal content and chemical composition and wood density. The paper results indicate that, for example, higher cadmium content in a wood tissue leads to high extractive substance content and low lignin content. Krutul et al. [15] investigating oak wood reported that environmental pollution affected distribution and content of biogenic elements i.e., potassium and calcium. Potassium content in oak sapwood growing in a polluted environment was determined to be as much as 15–35% higher than in the samples of the tree growing under limited environmental stress conditions.
The results of numerous studies conclude that wood hygroscopicity is determined by its chemical composition [17,18,19,20]. Simón et al. [21] determined the chemical composition of juvenile and mature wood of Abies alba Mill. wood i.e., extractives, lignin and carbohydrate polymer-cellulose and hemicellulose-content. Moreover, the hygroscopicity and thermodynamic properties of both wood types were studied in temperatures of 15, 35 and 50 °C. It was stated that mature Abies alba Mill. wood had more cellulose and hemicellulose content and less extractives content than the juvenile one. The mature wood sorption isotherms are above the juvenile wood isotherms in all three temperatures. It was also determined that the amount of energy involved in the sorption process is greater in the mature wood than in the juvenile wood. Majka and Olek [22] stated the sorption isotherms at 25 °C for the successive phases (i.e., initial desorption, adsorption and second desorption), sorption hysteresis and the fiber saturation point (FSP) of mature and juvenile lime (Tilia sp.) wood. It was concluded that juvenile wood was characterised by higher equilibrium moisture content than in the case of mature one.
The aim of the article is to assess indirectly the results of an environmental stress impact on Tilia cordata Mill. growing in urban agglomerations, by a roadside and in a forest i.e., under high, moderate and low stress conditions, respectively, comparing selected wood properties. The paper takes into account the determination of annual tree-ring width, density, wood chemical components as well as wood hygroscopicity.

2. Materials and Methods

2.1. Investigation Environment

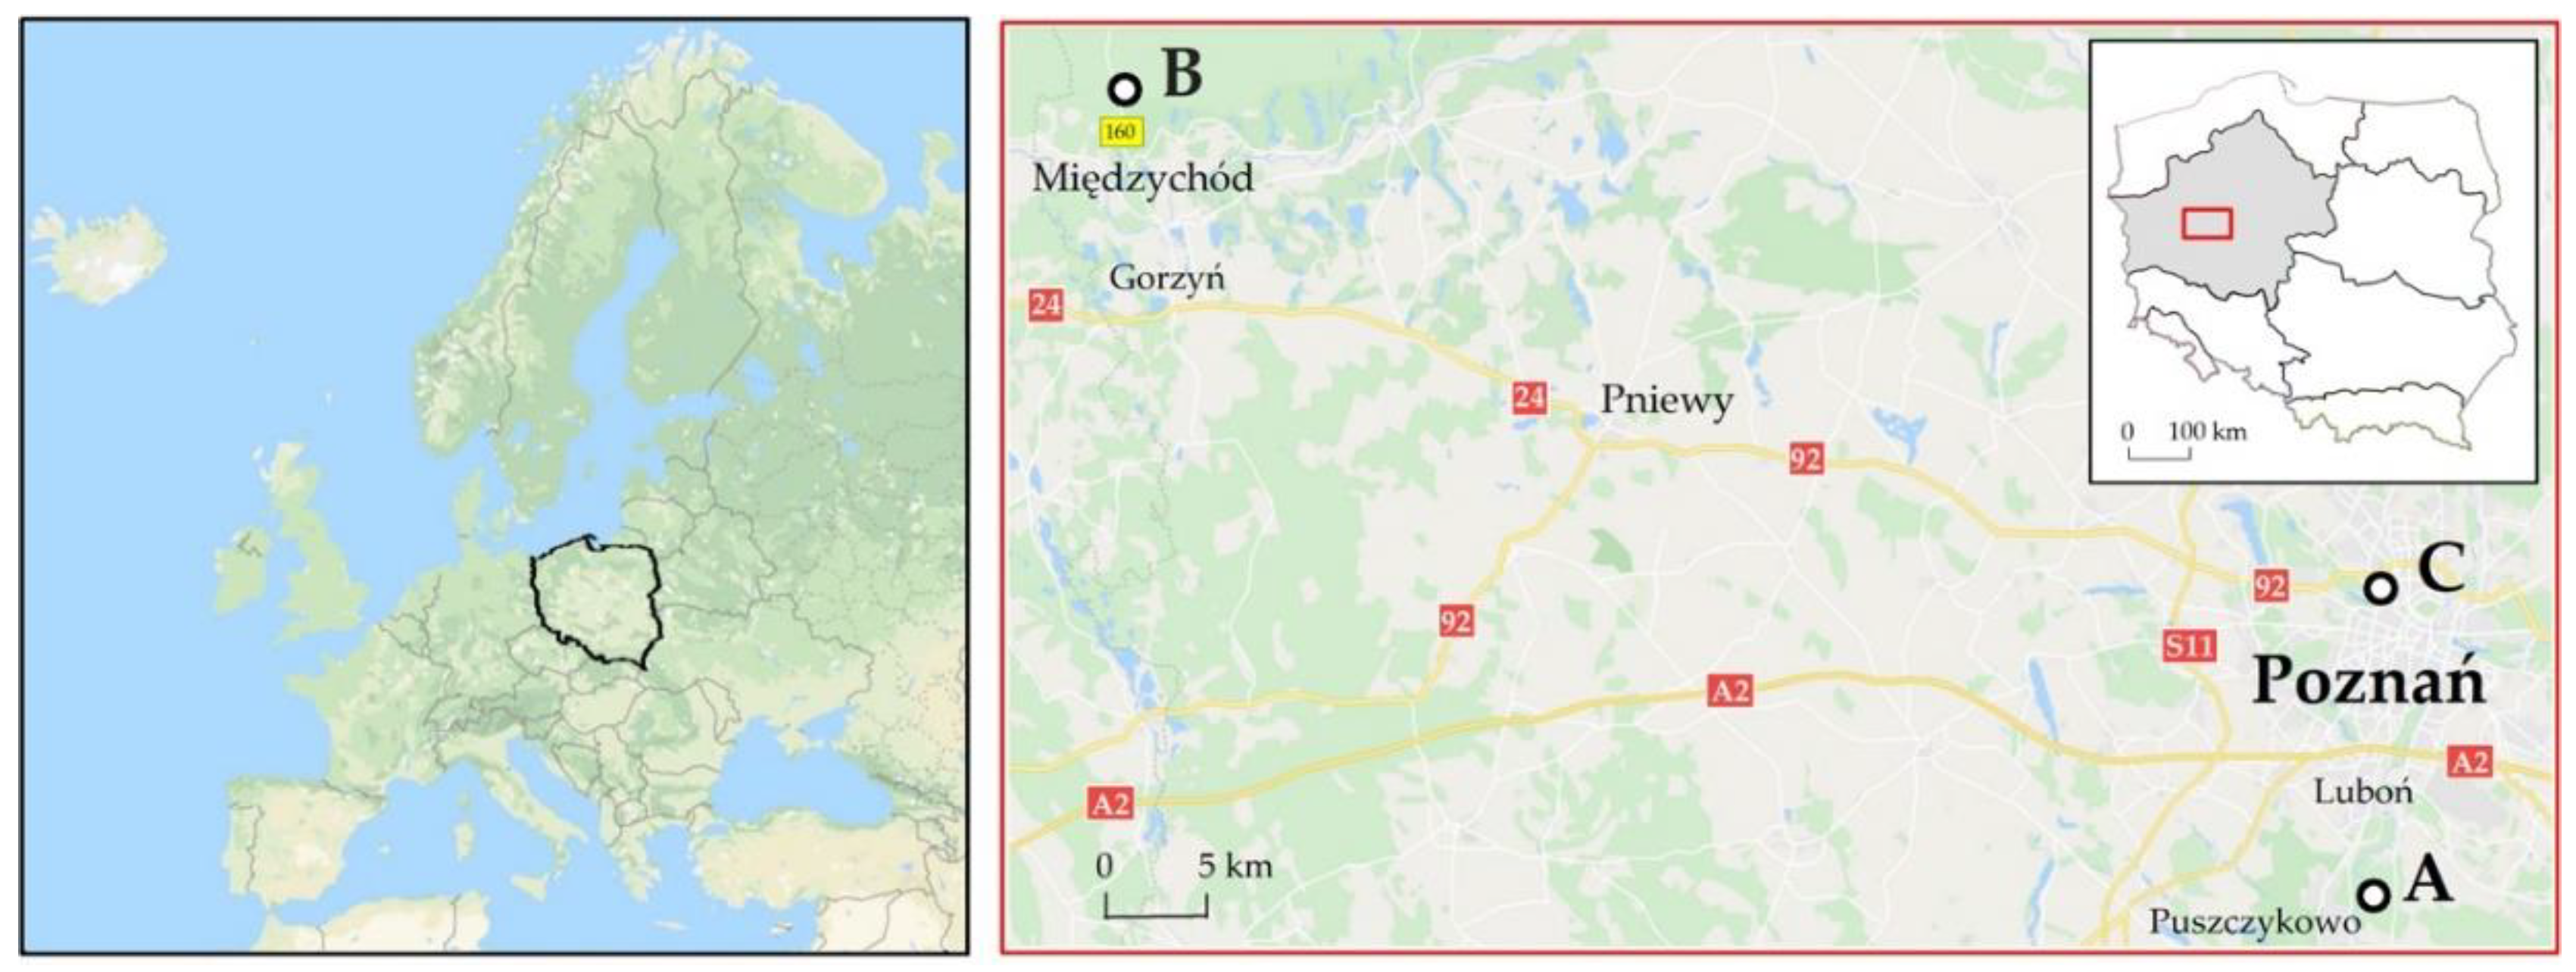
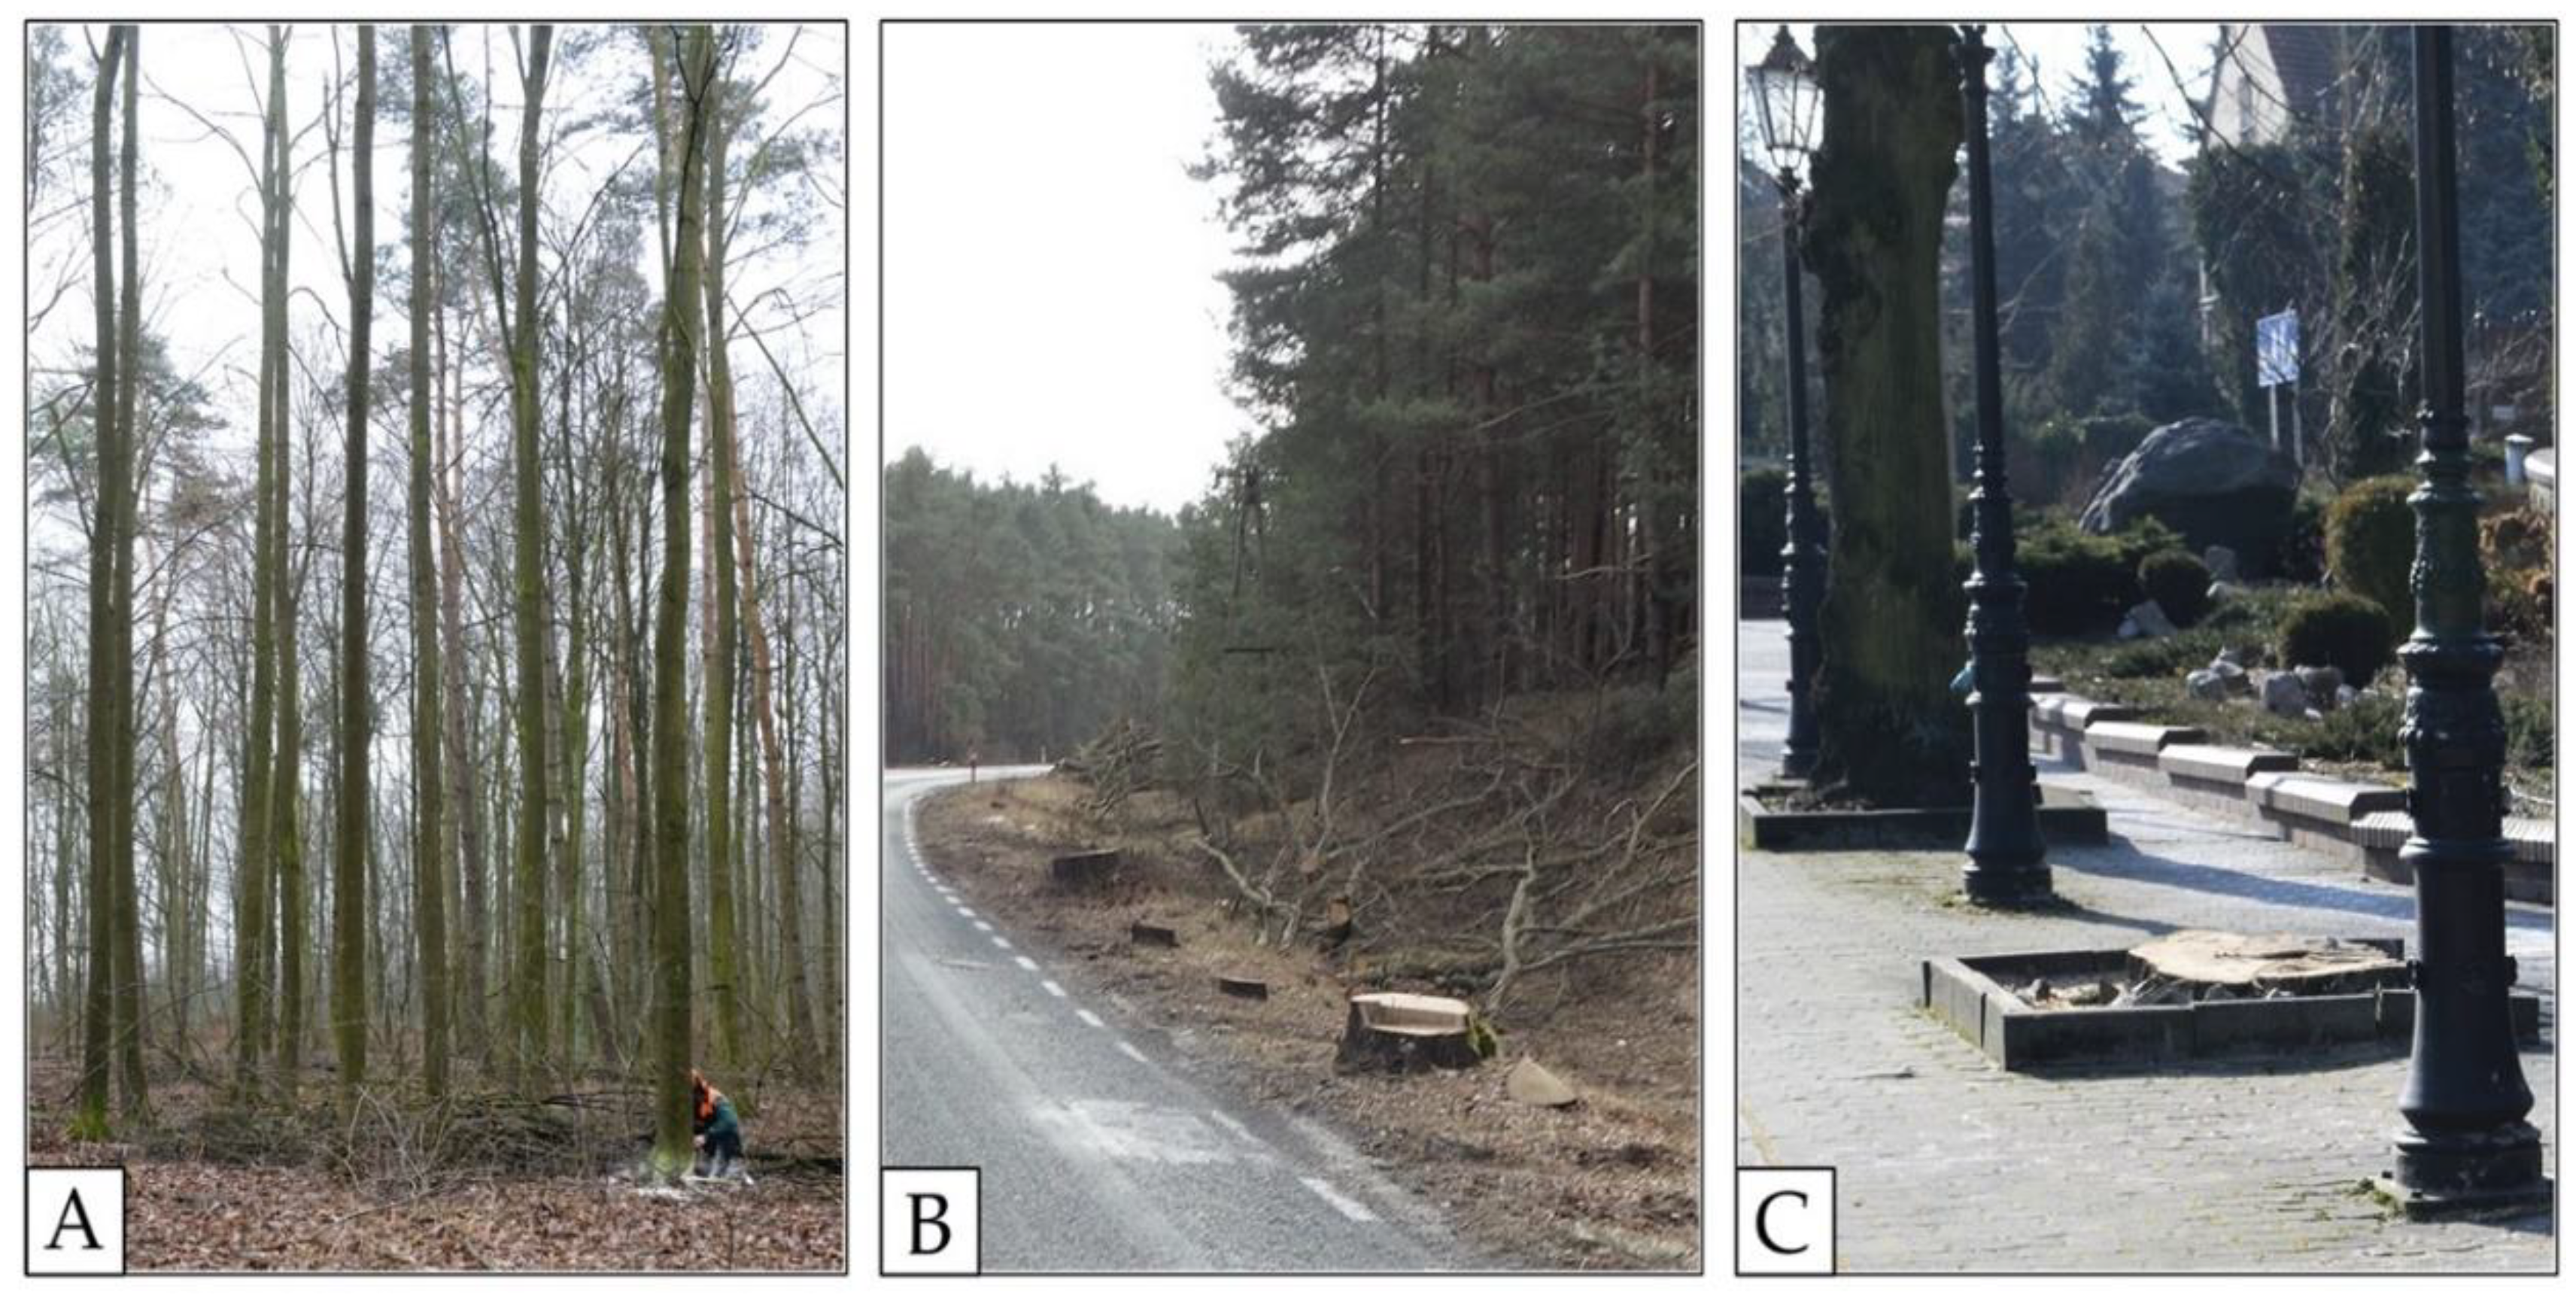
Tilia cordata Mill. trees were selected from the area of the Greater Poland-Pomerania Natural Forest Regions, located in North-Western Poland (Figure 1). The area is characterised by a similar climate, a similar geomorphologic layout, similar potential natural vegetation and forests [23,24,25]. The research used trees growing in three areas which had been chosen on the basis of a degree of an environmental stress impact. The selected trees were from the environment of the lowest stress, i.e., a forest (tree A—cambial age: 50 years old), of moderate stress, i.e., by a roadside running through forest areas (tree B—130 years old) and of the highest stress, i.e., in a big urban agglomeration (tree C—100 years old) (Figure 2).

2.2. Sampling

Discs of 60 mm (at breast height) and diameter 260, 530 and 460 mm for tree A, B and C, respectively were cut during a vegetation rest period, taking into account a North-South direction. Two twin main strips (1 and 2) were obtained from the discs. The main strips were radially oriented and included all tree rings from pith to bark. The scheme of a sample preparation is presented in Figure 3.

2.3. Ring Width Index (RWI) and Basic Density

The cross-section of the main strips 1 (see Figure 3) was sanded to improve visualization of the growth rings. The annual tree ring widths were measured with a Brinell’s magnifying glass with an accuracy of 0.1 mm. The tree rings series have been visually crossdated and detrended with R and RStudio [26]. Considering a higher level of growth when a tree is young, which is the tree’s natural biological growth trend, standardization was carried out applying a negative exponential curve technique in the dplR package [27,28]. Ring width indices (RWI) were generated by dividing the measured raw ring width by the model curve fit value [29].
For basic density measurements, the same strip of wood was split into smaller pieces, each containing 3 or 6 annual increments (depending on the ring width) in order to obtain about 10 mm-wide samples. Specimens’ dimensions were 20, 20, 10 ± 5 (for the longitudinal, tangential and radial directions, respectively). Basic density was calculated as a mass of oven-dry matter [g] per green wood volume [cm3].

2.4. Chemical Analysis

For a chemical analysis, juvenile and mature wood was used. The examined wood samples prepared according to the scheme presented in Figure 3 were then ground in a Fritsch Pulverisette 15 laboratory mill (Fritsch GmbH, Idar-Oberstein, Germany) and the 0.5–1.0 mm fraction was used.

2.4.1. Chemical Composition of Wood

Chemical analyses included the main chemical components’ content determination and were conducted according to well-established methodologies. Cellulose content was determined according to Seifert’s method [30], using a mixture of acetylacetone, 1.4-dioxane and hydrochloric acid to isolate cellulose. The holocellulose content analysis was conducted according to the chlorite method [30], using NaClO2 as a reagent. Pentosane content was determined according to the TAPPI standard method T 223 cm-01 [31] using hydrochloric acid and phloroglucinol. Acid-insoluble lignin was assessed according to the T 222 om-06 standard TAPPI method [32], using 72% sulphuric acid to hydrolyze and solubilise carbohydrates. Extractives soluble in alcohol were determined according to T 204 cm-97 [33], whereas sodium hydroxide solubility of wood was performed according to T 212 om-02 [34]. All the chemical analyses were repeated with three replicates for each sample and the maximum standard deviation of results within each test was considered as an indicator of the measurement error. The sum of lignin, holocellulose and extractive analysis consistently appears to be greater than 100% in some investigated materials since the results were calculated in relation to wood dry matter. This phenomenon results from the imperfection of classical wet methods which are used during lignocellulosic material main and minor constituents’ concentration determination [35,36].

2.4.2. Chemical Elements of Wood

The samples (0.5000 g) were mineralised with nitric acid (Avantor Performance Materials, Gliwice, Poland) in a semi-closed microwave mineralisation MARSXpress system (CEM Corporation, Matthews, NC, USA). The content of Fe, Zn, Cu, Pb Cd, K, Na, Mg, Ca in the samples was analysed by means of FAAS, using a Spectra 280 AA spectrometer (Agilent Technologies, Santa Clara, CA, USA). The calibration curve was prepared from the serial dilution of a standard Fe, Zn, Cu, Pb, Cd, K, Na, Mg, Ca solution (Sigma-Aldrich, Hamburg, Germany). The correctness of the method was verified using the Poplar Leaf certified reference material NCS DC 73, 350 (NACIS, China). The final results were average values of three simultaneous measurements.

2.5. Sorption Properties

The sorption experiments were made with the dynamic vapour sorption (DVS) apparatus (DVS Advantage 2, Surface Measurement Systems, London, UK). The EMC values were registered for 12 levels of air relative humidity (RH) in the full sorption cycles (i.e., adsorption and desorption) at a flow rate of 150 cm3/s and a temperature of 20 °C. The pre-set RH values ranged from 0% to 95% and back to 0%. Prior to the experiments, the wood samples prepared as for a chemical analysis had been separately stored in a desiccator over phosphorus pentoxide (P2O5) for two weeks leading to an MC close to dry mass. The average dry mass of each sample (0.125–0.250 mm fraction) was ca. 8 ± 0.5 mg; the pre-dried samples were additionally equilibrated in the DVS apparatus in dry nitrogen. After that, the RH was stepwise increased. It was assumed that the hygroscopic equilibrium was obtained at a given air RH value when the mass change was less than 0.0005%/min for at least 60 min. The procedure was repeated for each RH step for the adsorption/desorption modes and the EMC values were calculated.
The adsorption/desorption isotherms were calculated by the Guggenheim, Anderson, and de Boer (GAB) equation [37]:
E M C = M m K C R H ( 1 K R H ) ( 1 K R H + C K R H )
where Mm (kg/kg) is the monolayer moisture content; C (-), equilibrium constant related to the monolayer sorption; and K (-), equilibrium constant related to the multilayer sorption; RH (-) is the air relative humidity.
The GAB model was often rewritten into the same form directly used during fitting [38,39,40]:
R H E M C = a + b R H + c R H 2
where
a = 1 M m C K
b = ( C 2 ) M m C
c = K ( 1 C ) M m C
The parameters of Equation (2) were estimated from a plot of RH/EMC versus RH by regression analysis of the experimental sorption data. The last-square method was used to estimate the coefficients of Equation (2). The GAB model parameters (Equation (1)) were then calculated: K is the solution of quadratic equation:
a K 2 + b K + c = 0
and then
C = b a K + 2
M m = 1 b + ( 2 K a )
Proposed by Majka et al. [41], the estimators of the sorption hysteresis, i.e., the maximum difference of EMC for desorption and adsorption (ΔEMCmax), and of the hysteresis loop (H) were used.

2.6. Statistical Analysis

The experimental data were statistically analysed using STATISTICA 13.3 software (TIBCO Software Inc., Palo Alto, CA, USA). An analysis of variance (two-factor ANOVA) was performed to test whether cambial age and growth environment had an effect on chemical composition of the examined wood. Significance was established at the p < 0.05. Tukey’s honest significant difference tests (post-hoc) were applied in order to analyse the significant difference of mean values.

3. Results

3.1. Ring Width Index and Basic Density

Time series of ring width index (RWI) were plotted against date (Figure 4). Collected data covered the period from 1966 to 2017 for tree growth in a forest (A), 1886–2017 for tree growth by a roadside (B) and 1918–2017 for tree growth in an urban agglomeration (C). In general, the trees in all environments represented similar growth patterns (i.e., ring width index—RWI) with some low and high episodes, e.g., 1945–1960 for the roadside tree (B), i.e., growing under moderate stress conditions. All of the investigated trees showed a decrease in radial growth in the early 2000s.
Above the RWI time series, sample basic density from corresponding calendar years has been plotted (Figure 4). In diffuse-porous trees, radial variation of wood density differs between species [42,43,44]. Fukuzawa [42] reported for Tilia japonica (Miq.) Simonk. a wood density increases with the distance from pith. Wood basic density radial variation, characteristic for diffuse-porous trees, was retained only for a tree growing under the lowest environmental stress conditions, i.e., in the forest (tree A). In the described case, juvenile wood near pith is characterised by distinctly lower basic density (approx. 250 kgm−3) than mature wood near bark (approx. 450 kgm−3). For trees growing near the forest road and in the urban agglomeration (B and C), density undergoes certain fluctuations, but basically does not vary between their pith and a girth. A minor difference of juvenile and mature wood density which was recorded for trees B and C may result from an influence of moderate and high environmental stress conditions, respectively. What is more, for the forest and by-roadside tree (A and B), mature wood basic density coincides with the values reported in literature (in range 0.41–0.50 g/cm3) [45,46]. In the tree wood growing in the urban agglomeration (C), with the highest environmental stress, juvenile and mature wood basic density is at a lower level, i.e., 0.30–0.40 kg/m3.

3.2. Chemical Analysis

3.2.1. Chemical Composition of Wood

In the range of wood chemical composition percentage content analysis, main components i.e., holocellulose, cellulose, pentosanes and lignin as well as components soluble in 1% NaOH and in ethanol were determined. Table 1 presents the results of a multifactor variation analysis (two-factor ANOVA) for the investigated chemical composition. The analysis results indicate the significance of an environmental impact on content of each of the presented components (for p < 0.05). Additionally, cambial age is a factor influencing substantially the investigated wood chemical composition excluding pentosanes and substances soluble in NaOH (p > 0.05). A factor interaction (a × b) was also stated in every case, excluding pentosane content.
Table 2 shows the content of the investigated wood chemical components. As far as the juvenile wood is concerned, the total carbohydrate content (holocellulose) ranged from 75.7% to 85.8%. The juvenile wood from the tree growing under moderate environmental stress i.e., by the roadside (B) was characterised by the lowest holocellulose content. At the same time, statistically significant differences (α = 0.05) of mean holocellulose content in a tissue of the compared trees were stated. Slightly higher holocellulose content was determined for the mature wood of the investigated trees. In the case described, the content varied from 85.8% to 86.6%. There were no statistically significant differences in average holocellulose content in the mature wood. Cellulose content in the juvenile wood ranged from 42.8% to 44.6%. The most cellulose amount was determined for the tree wood growing by the roadside (B), whereas for the mature wood cellulose content ranged more widely from 41.6% to 46.7%. The highest cellulose content was determined for the tree growing under the lowest environmental conditions, i.e., in the forest (A), and the lowest for the tree growing under the highest environmental stress, i.e., the urban agglomeration (C). According to literature data [47], content of that component in lime wood ranges from 43.2% to 54.0%, therefore the determined content does not diverge significantly from it. The content of pentosanes, major hemicellulose components of biomass, varied in the investigated tree’s juvenile wood from 20.5% to 24.5%. Considering literature data i.e., 19.7–20.4% [47], the determined percentage content is slightly higher. For the mature wood, pentosane content was at an even higher level i.e., 23.0–23.9% and did not display difference significance.
Lignin content in the juvenile wood of the compared trees ranged from 20.2% to 22.1%. Difference significance was reported merely for the results for the tree growing under moderate environmental stress i.e., by the roadside (B). In the mature wood, lignin percent content was lower than in the juvenile wood and ranged from 17.9% to 20.1%. Difference significance was determined also only for the results obtained for the tree growing by the roadside (B). For the wood, both in the juvenile and mature area, the largest amount of lignin was determined. However, all the values obtained for the researched trees are at a low level comparing with literature data [47].
Holocellulose to lignin content ratio (H/L) is an absolute value which gives a possibility to estimate numerical relationships between carbohydrate components and lignin. Lower values were determined for the juvenile wood and higher ones for the mature wood, which means that carbohydrate content in proportion to lignin in the juvenile wood is lower, whereas in the mature wood it is higher. For the tree growing by the roadside (B), both the juvenile and mature, the coefficient was the lowest.
The substances soluble in NaOH and EtOH were determined from the group of soluble components. The substances soluble in NaOH are wood components such as hemicelluloses, low-polymerised lignin, amorphous cellulose, fats as well as waxes. For the juvenile wood, their content ranged from 24.4% to 26.8%. In the mature wood, it changed in the wider range: from 20.0% to 33.4%. The majority of components from the group were determined in the wood from the tree growing under the highest environmental stress, i.e., the urban agglomeration (C), whereas the smallest number under the lowest environmental stress, were in the forest (A). The substances soluble in EtOH are the components from the group of lipid compounds, i.e., mainly resins, fats, waxes and others. Their content in the juvenile wood ranged from 3.3% to 9.3%, whereas in the mature wood this was slightly higher and varied from 5.4 to 14.0%. The highest compound group content, similar to the compounds soluble in 1% NaOH, was determined in the both wood areas from the tree growing in the urban agglomeration (C). Compared with literature data [47], it is clear that percentage content of the both analysed groups of chemical components in lime wood growing in the urban agglomeration exceeds it greatly.
The results obtained for the juvenile and mature wood revealed that they showed similar reactions involving increasing or decreasing biosynthesis intensity of selected chemical components depending on the volume of environmental stress. It was observed that in both the juvenile and mature wood of the trees growing in the urban agglomeration (C), i.e., under high stress conditions, there was the least cellulose and lignin and the most substances soluble in NaOH and EtOH compared with the remaining trees. It can be concluded that despite the juvenile and mature wood being developed in various tree growth periods and differing in anatomy [48,49,50], they demonstrated a similar response to environmental stress.

3.2.2. Chemical Elements of Wood

Table 3 presents the results of the two-factor ANOVA for the investigated groups of the elements’ chemical composition i.e., Fe, Zn, Cu, Pb, Cd, respectively. The analysis results indicate the significant effect of both included factors, i.e., cambial age and environment on the content of each of the included components (for p < 0.05). Also stated are statistically significant interactions of factors (a × b) for all the analysed cases of the investigated chemical composition in lime wood.
The content of the selected heavy metals (Table 4) determined in the juvenile and mature wood changed to a very high extent. The differences of the obtained results were statistically significant. In the juvenile wood, the highest value of iron (75.4 mg/kg) was determined for the tree growing in the urban agglomeration, i.e., under the highest environmental conditions (C). In the juvenile wood of the trees growing in two remaining locations with lower environmental stress, in the forest (A) and by the roadside (B), iron was determined at the level of 51.2 and 36.4 mg/kg, respectively.
The highest content of zinc and copper was determined in the mature wood of the tree growing in the urban agglomeration, i.e., under the highest environmental stress conditions (C). In the wood, the least cellulose and lignin but the most soluble substances were determined (see Table 2). The mature wood of the tree growing in the forest, i.e., under the lowest environmental stress (A), contained the lowest content of zinc, copper, lead and cadmium yet the most cellulose (see Table 2). The results of higher content of heavy metals in the wood stemming from the trees from more polluted areas were also mentioned in the article by Krutul et al. [15]. The authors investigating oak wood, obtained from an unpolluted area, determined a lack or trace amounts of lead. Moreover, according to Watmough et al. [51,52], lead content in sugar maple wood (Acer saccharum Marshall) ranged from 0.5 to 1.5 mg/kg. The lead concentration results at 0 level presented in this article and determined in the mature lime wood from the tree growing in the forest (A) confirm that as well. To compare, cadmium content in oak (Quercus petraea Liebl.) wood from a non-polluted environment was from 0.02, 0.01 and 0.15 mg/kg in the sapwood, heartwood and bark, respectively [14]. In the presented research, cadmium was determined at a distinctly higher level in the mature wood growing under the highest or moderate environmental stress, i.e., in the urban agglomeration (C) 0.3 mg/kg and by the roadside (B) 1.4 mg/kg, respectively. The lowest zinc and cadmium content, as in the mature wood, was determined in the juvenile wood growing under the lowest environmental stress (A), i.e., in the forest (Zn: 23.7 mg/kg and Cd: 0.1 mg/kg).
Table 5 presents the two-factor ANOVA results for the investigated chemical composition groups of elements i.e., K, Ca, Na, Mg, respectively. The analysis results show a substantial influence of both included factors, i.e., cambial age and environment on the content of each of the included components (for p < 0.05). The statistically significant interactions of factors (a × b) for all the analysed cases of the investigated chemical composition in Tilia cordata Mill. wood also occurred.
The potassium, sodium, magnesium and calcium content (Table 6) in the juvenile and mature wood changed to a high extent and differences between the results were statistically significant. In the juvenile wood, the highest potassium, sodium and calcium concentration was determined in the tree by the roadside (B), for which environmental stress was moderate (K: 3376.3 mg/kg, Na: 3186.6 mg/kg and Ca: 9732.2 mg/kg). However, the biggest amount of magnesium was determined in the juvenile tree wood growing in the forest, i.e., in the area with the lowest environmental stress (A) (Mg: 1446.8 mg/kg). The lowest concentration of elements was determined in the juvenile wood of the tree growing in the urban agglomeration, i.e., under the highest environmental conditions (C) (K: 410.6 mg/kg, Na: 1814.3 mg/kg, Mg: 536.0 mg/kg, Ca: 5100.9 mg/kg). It is worth noticing that for the mature tree wood growing under those conditions (i.e., C), the highest volume of potassium, sodium, magnesium and calcium was determined (K: 3337.6 mg/kg, Na: 3400.0 mg/kg, Mg: 898.5 mg/kg, Ca: 3189.8mg/kg), whereas the lowest content of elements, excluding magnesium, for the mature wood was determined for the tree growing under the lowest environmental stress (A), i.e., in the forest (K: 1307.7 mg/kg, Na: 1161.9 mg/kg, Ca: 1902.7 mg/kg).
For the mature wood from the urban agglomeration, i.e., growing under the highest environmental stress (C), in which the highest potassium, sodium, magnesium and calcium content was determined, there was the lowest content of cellulose and lignin and the largest number of soluble substances (Table 2). However, in the mature wood from the least polluted area (A), i.e., from the forest, with the lowest content of potassium, sodium and calcium, the highest content of cellulose and the lowest content of soluble substances was determined (see Table 2).
In our research, relationships between very high potassium and calcium content and heavy metal content e.g., zinc, cadmium and copper were noticed. In the wood of the tree growing in more polluted areas (C and B) in which potassium and calcium were determined at a very high level (mature wood K: 3337.6 mg/kg, Ca: 3189.8 mg/kg; juvenile wood K: 3376.3, Ca: 9732.2 mg/kg), zinc, copper and cadmium were also determined in the highest concentration (mature wood Zn: 78.6 mg/kg, Cu: 26.3 mg/kg; juvenile wood Zn: 33.5, Cd: 0.5 mg/kg). Moreover, relationships between very high calcium concentration and very low iron content can be reported for the juvenile wood of the tree growing by the roadside (B). The reported relationships between calcium and iron can also be observed in the mature wood of the tree growing in the area of the lowest stress, i.e., the forest (A). In the wood, calcium was determined at the lowest level, which corresponded with the highest iron content. Such high iron concentration compared with low calcium concentration confirms the results presented by Krutul et al. [15] who proved that plants accumulate iron when soil pH is low. When soil contains a huge amount of calcium, iron transforms into a form inaccessible to plants and it is not accumulated by them.
3.3. Sorption Properties

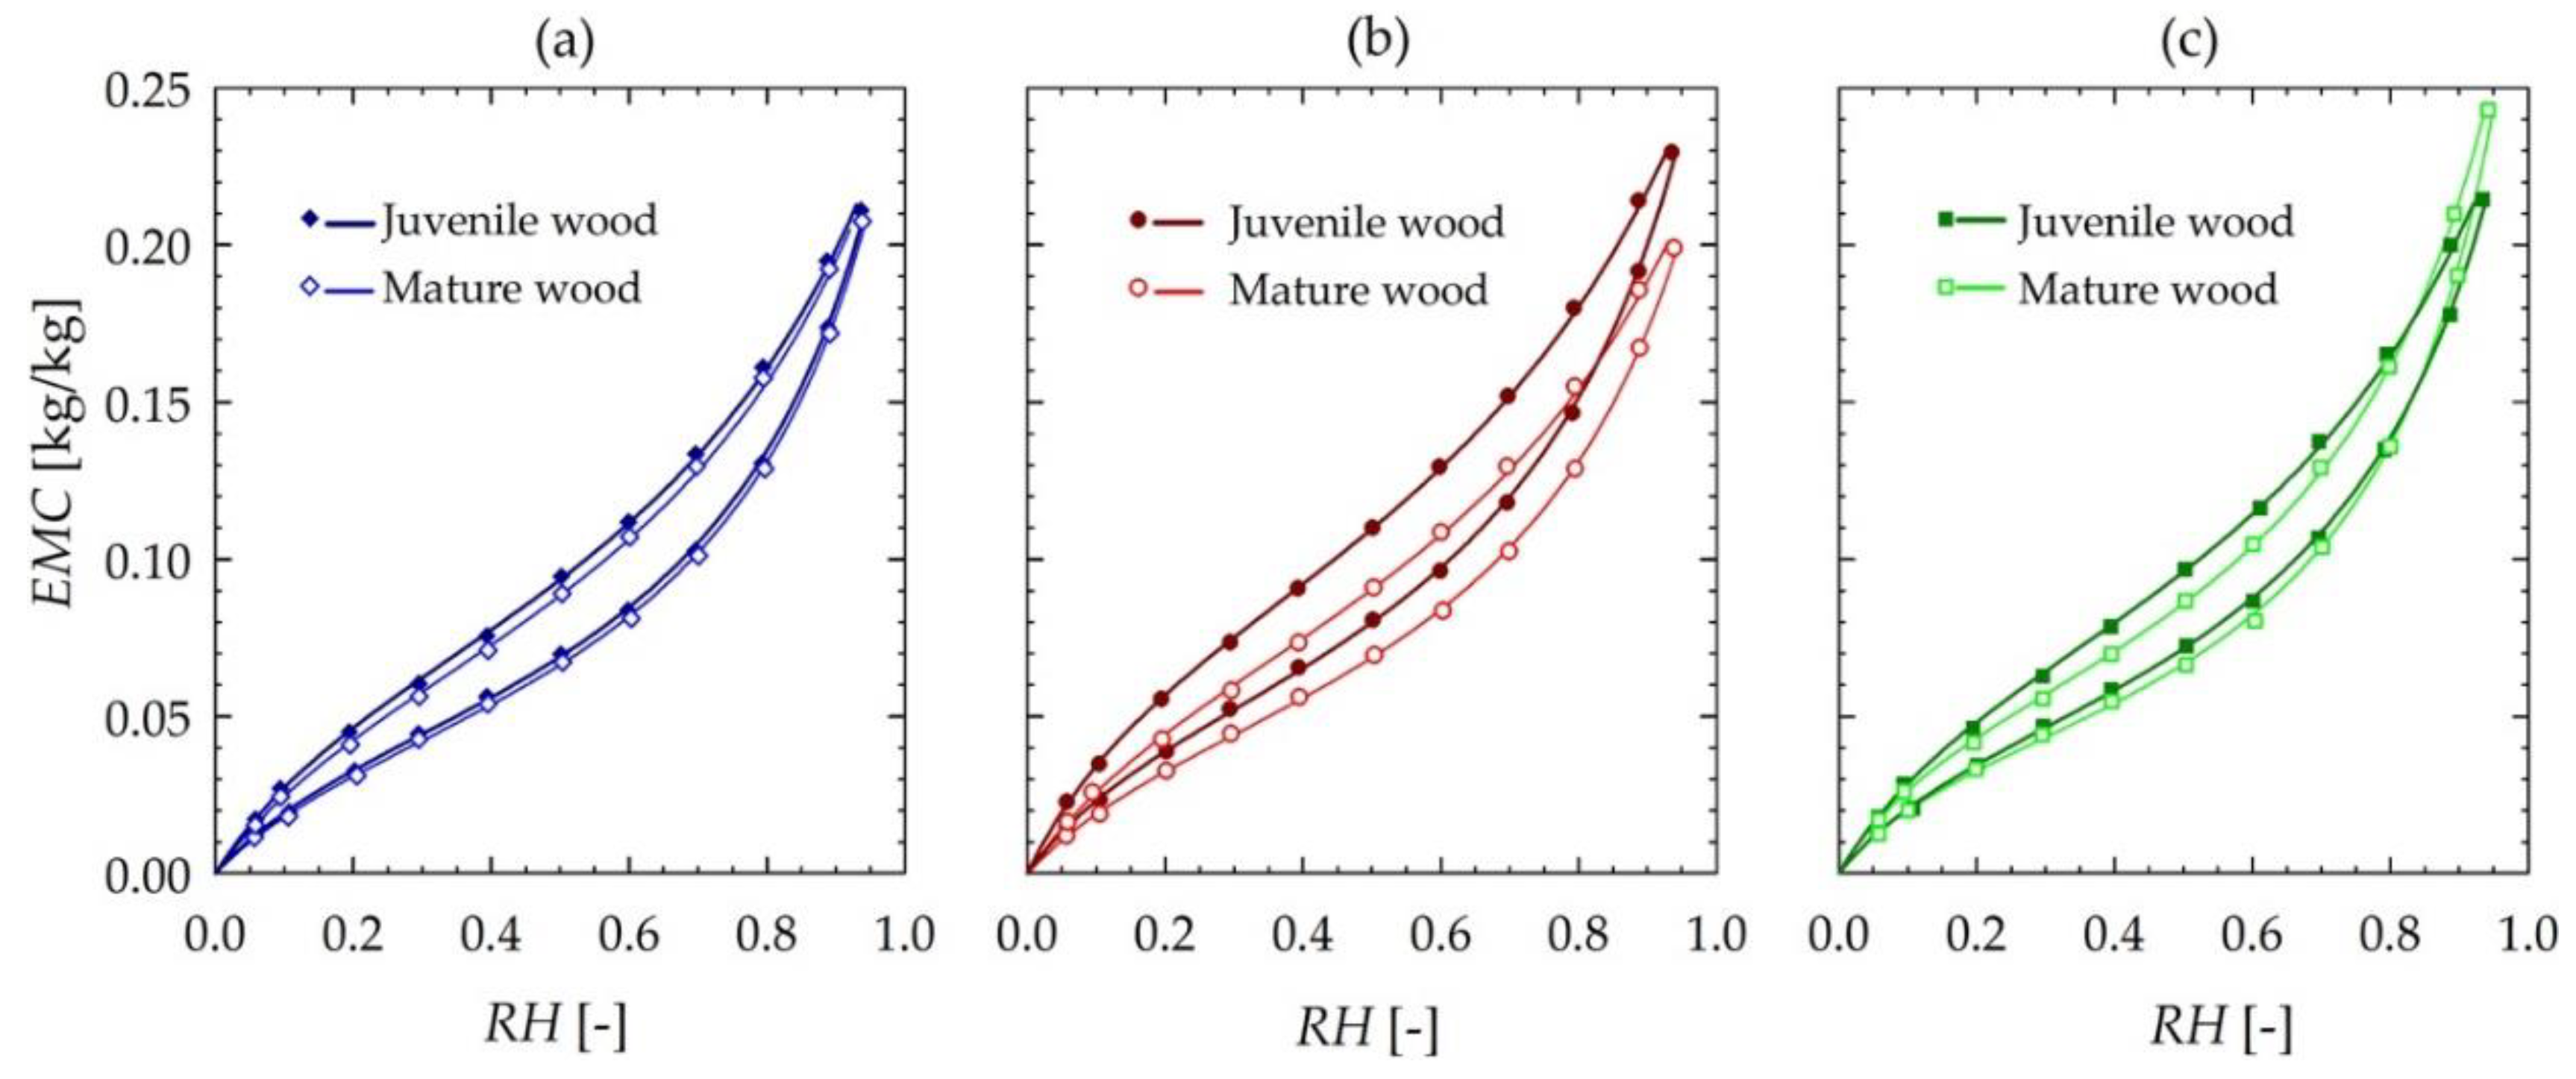
The results of sorption experiments are presented in Figure 5. Each plot consists of two sets of isotherm loops, i.e., juvenile and mature wood taking into account growth conditions. The isotherms were constructed by calculating the GAB model to each set of experimental data, i.e., measured EMC values are also depicted in the plots. The GAB sorption model is separately fitted to juvenile and mature wood samples for which adsorption and desorption isotherms were determined. Figure 6 typifies ratio RH/EMC versus air relative humidity for adsorption and desorption of juvenile lime wood. The fitting results for all the sets of the wood samples are presented in Table 7.
The sorption experiments’ results presented in Figure 5 generally support earlier conclusions that hygroscopic properties of juvenile and mature lime wood differ [22]. The lowest differentiation of hygroscopic properties regards the juvenile and mature wood tissue of the tree growing under low stress conditions (A), i.e., in the forest (see Figure 5a). In the case described, equilibrium moisture content which is gained by the juvenile wood is slightly higher than for the mature wood in all the range of air relative humidity (0–0.95). In the remaining cases, i.e., regarding moderate and high stress, (B and C) respectively, a higher variety of the mature and juvenile wood hygroscopic properties was reported. However, it is peculiar that for the tree growing under high stress conditions, i.e., in the urban agglomeration (C), for air relative humidity near saturation (RH above 0.90), the juvenile wood shows explicitly lower equilibrium moisture content than the mature one.
The obtained values of the saturation moisture content of the monolayer (Mm coefficient of the GAB model) are higher for an adsorption phase than for a desorption one. Furthermore, water sorption phenomena in juvenile wood are characterised by considerably higher Mm values than in mature wood. A mature wood tissue of the tree growing in the urban agglomeration (C) was characterised by the lowest accessibility of the primary sorption sites.
The values of the C coefficient were higher than 2 for all the estimated isotherms, i.e., the necessary condition for classifying the isotherms as type II of Brunauer’s classification was satisfied [53]. Moreover, all the isotherms can be classified as the fully sigmoidal type II because the additional condition proposed by Lewicki [54] i.e., the conjunction of the relations 5.57 < C < ∞ and 0.24 < K < 1 was satisfied (Table 7).
The C values were significantly higher than K, which indicates much higher sorption heat of the monolayer as compared to the multilayer [55]. It was stated that the C values for the juvenile wood tissues were higher than for the mature wood (for the tree growing in the forest (A) and by the roadside (B)). However, for the wood tissues obtained from the tree growing in the urban agglomeration (C), the value of the parameter was higher for the mature wood tissue. It can be interpreted that the monolayer water was bound more strongly to the primary sorption sites. A higher parameter C value means that removing monolayer water within the wood structure as it required more heat to remove water.
The K coefficient is related to the multilayer water. The coefficient was significantly lower than 1 for all the studied sorption isotherms (Table 7), which complied with its physical meaning [37]. A decrease of the K coefficient was interpreted by Timmermann et al. [56] as a less structured state of the multilayer. In each of the analysed cases, the adsorption phase was characterised by higher values of the K parameter. Furthermore, the mature wood tissue obtained from the tree growing in the urban agglomeration was characterised by the highest K parameter values, which means that multilayer water was of the highest order degree of both remaining cases.
The obtained descriptors of sorption hysteresis are presented in Figure 7 and Table 8. It was found that the juvenile wood is characterised by a slightly higher sorption hysteresis than the mature wood. Additionally, the highest sorption hysteresis was recorded for the juvenile wood gained from the by the roadside tree (B).

4. Discussion

4.1. Physical Properties

This study shows that in the investigated cases of Tilia cordata Mill., the environment did not affect the growth patterns characterised by RWI. There are no noticeable differences between RWI even if we consider a different growth pattern of trees at remarkably different ages, since the age-related trend in ring widths was removed by detrending.
The tree basic density from the urban agglomeration is the lowest among the researched trees. Taking into consideration the growth conditions of the compared trees, the reason might lie in soil hydrological process interferences in which the tree grew and restricted rooting volume—usually developed and deep [57], due to a paved surface [28]. Wood density depends mainly on a wood structure. In the investigated cases, lower wood density of the tree growing under the highest environmental stress conditions, i.e., in the urban agglomeration, does not reflect in distinctly reduced annual growth rings’ width indices of the tree. It confirms the thesis that for diffuse-porous deciduous species, the width of annual rings influences wood density moderately [58,59]. The observed density differences may result from the differences in porosity [59,60].
For the wood of the tree growing under the lowest environmental stress, i.e., in the forest, pith areas of the wood were characterised by explicit lower density. As mentioned, this is a natural relationship in many species of diffuse-porous trees in which juvenile wood including rings located the closest to the pith is distinguished with lower density than a tissue further from it [42,61,62]. The trend was not observed in the trees from the roadside and urban agglomeration, which may suggest that the polluted environment caused interferences of a natural relationship between density and cambial age.

4.2. Chemical Composition of Wood

The amount of wood components like carbohydrates and lignin depends on, e.g., the plant species, age, plant part and growth conditions. The growth condition factors effecting wood chemical composition are temperature, light intensity, amount of water, food, photoperiod, climatic conditions and geographical conditions [63,64]. The pollution influence is vital but still insufficiently recognized. According to general information from literature [65,66], the cellulose and lignin content as well as other wood components change under the influence of air pollution.
Waliszewska et al. [67] proved that holocellulose and cellulose content in elm which grew with the addition of arsenic was lower than in wood which grew without the element. Also Mleczek et al. [68] showed that for plants growing in a polluted area, holocellulose and cellulose was lower than for plants growing in a non-polluted area. For the Tilia cordata Mill. trees investigated, reducing holocellulose content was recorded only for the tree growing under moderate stress conditions, i.e., by the roadside. Major differences, in accordance with the observations by Waliszewska et al. [67] and Mleczek et al. [68], were shown for cellulose content. The lowest content of the component was determined in the mature and juvenile wood of the tree growing under the highest stress conditions, i.e., the urban agglomeration. The similar observations concerning cellulose content reduction influenced by pollution from sulphur mining were described by Krutul et al. [15]. Considering the above, one can conclude that growth in a high-stress environment resulted in cellulose biosynthesis inhibition both in the juvenile period and when lime wood was a mature plant. In the mature wood, the highest biogenic elements’ content i.e., K, Na, Mg or Ca including heavy metals, i.e., Zn and Cu, was determined.
The results of the previous research do not offer a possibility to address the question of whether lignin percentage content in plants growing under high environmental stress conditions is higher or lower than in plants growing under low environmental stress conditions. Waliszewska et al. [67] claims that in the wood of elm trees growing with an addition of arsenic to the substrate, the amount of lignin was greater in comparison to the level in wood of elm growing without an addition of arsenic. Similar observations were made by Krutul et al. [69] for pine trees growing in a polluted environment. Nevertheless, Mleczek et al. [68] reported the reduction in lignin content in S. viminalis L. stems growing in a polluted area. The contradiction is likely to originate from the complexity of factors influencing chemical composition mentioned at the beginning. Wood cambial age affects greatly lignin content [70,71,72]. In the trees investigated, the least amount of lignin was determined in the juvenile and mature wood growing in the urban agglomeration, which, as for cellulose, may indicate biosynthesis inhibition of the component under heavier pollution conditions.
The results of determining soluble component content in the compared trees indicate explicitly that their content is higher, both in juvenile and mature wood, for the wood of the tree growing in the urban agglomeration, i.e., under high stress conditions. The literature clearly shows that biosynthesis of components such as resins, tannins, waxes, fats, flavonoids or lignans is more intense in plants growing in polluted areas [66,67,68,73]. Those are the components which play the protective role in a plant and are of biocide and antioxidant character [74]. The natural durability of wood is usually correlated to its extractives content and composition [75,76,77,78]. As can be concluded from the conducted research and from the literature, they also play a protective role against pollution.

4.3. Chemical Elements of Wood

It can be observed both in our research and in the paper by Krutul et al. [14,15] that environmental pollution definitely affects the content of not only lead but also cadmium, especially in mature wood and cadmium like lead may be a pollution indicator considering environment pollution factors. Moreover, Marković et al. [79] reported that lead concentration in lime wood, obtained from four locations in Serbia, may be correlated to traffic intensity. Huge differences in the concentration of that element in lime wood obtained from trees growing in the vicinity of main roads as opposed to those coming from forest areas were noticed. The differences in cadmium concentration in wood were reported in the paper by Kiaei et al. [16], in which they were explained by high extractive content and low lignin content in wood, among other reasons. In our research, low cadmium content in mature lime wood can be correlated to low content of substances soluble in NaOH and relatively low lignin content.
Similar to the presented studies, Krutul et al. [15] showed that environment pollution influences potassium, sodium and calcium distribution and content in wood. Potassium is absorbed by trees in an ion form and is characterised by high mobility, therefore the authors discovered the highest content of the element in sapwood coming from polluted environment (higher by 15–35% compared to “non-polluted” samples). In our research, the relationship between very high potassium and calcium content and heavy metals’ content, e.g., zinc and cadmium can be observed. In the wood from the area of the highest and moderate stress, i.e., the urban agglomeration and the roadside, in which potassium and calcium were determined at very high levels, zinc, copper and cadmium were also determined in the highest concentrations. The oak wood research results [15] show that iron content in wood depends merely on trees’ habitat not on a polluted environment whereas our research results indicate that in juvenile wood the differences between heavy metals’ content, including iron for three investigated locations, were statistically significant. The highest iron concentration for juvenile wood was determined for the wood from the urban agglomerations. Furthermore, it was also observed that the lowest cellulose content was determined in the wood.
Kiaei et al. [16] noticed that there were significant differences between the content of elements such as nickel, lead, cadmium, zinc and iron and wood density. However, the relationship between copper and wood density was not displayed. Moreover, relationships between elements’ content (except for lead) and chemical composition (except for cellulose content) and wood density were reported. In our research, relationships were found between low cellulose and lignin content in the lime mature wood coming from the area of the highest stress, i.e., the urban agglomeration, and high zinc and copper content.
Krutul et al. [15] stated that pollution affected calcium and potassium distribution and content in oak wood in cross-section and longitudinal section, and magnesium content is higher in sapwood from unpolluted areas than in samples gained from a polluted area. In our research, relationships between high potassium and sodium content and low lignin content in mature wood from the urban agglomeration were shown. Also, such relationships between potassium chloride and sodium chloride and lignin content in cultivated plants were noted by Liu et al. [80].

4.4. Sorption Properties

The results of sorption experiments and chemical composition analysis confirmed a significant influence of the presence of extractives on the course and scope of sorption phenomena. However, in terms of the influence of air with a higher RH, the juvenile wood achieved higher EMC despite the significantly low cellulose content as compared to the mature wood. For high RH (above 0.80) the significantly lower EMC of the mature wood (excluding the wood obtained from the tree growing in the urban agglomeration) compared to the juvenile wood is the effect of different content of extractives. The role of extractives in the sorption phenomenon was described previously and it was pointed out that their high concentration causes the decrease in EMC [18,21]. The removal of extractives resulted in higher EMC as well as in a higher rate of sorption both in adsorption and in desorption [20]. Hernandez [17] citing the work of Spalt [19] states that wood containing high concentrations of extractives shows low EMC, especially when RH is above 50%. Moreover, Spalt [19]) states that wood extractives have little effect on monolayer sorption (for low RH values), while they had an appreciable effect on polylayer sorption (for high RH values).

5. Conclusions

  • This study shows that in the investigated cases of Tilia cordata Mill. environment stress did not affect the growth patterns characterized by RWI.
  • Tilia cordata Mill. density research may suggest that environmental stress results in interfering with natural relationships of density and cambial age.
  • Growth environment and cambial age influence significance on the content of each of the investigated components and chemical elements was shown.
  • Both the juvenile and mature lime (Tilia cordata Mill.) wood respond to environmental stress with an increase in soluble substance content, playing the protective role in the wood, and with a decrease in structural component content, i.e., cellulose and lignin.
  • Mature wood of the Tilia cordata Mill. trees growing under the highest environmental stress conditions, the highest content of elements Zn, Cu, K, Na, Mg and Ca is accompanied by the lowest percentage content of the main components (cellulose and lignin) and the highest percentage of soluble components.
  • Differentiation of the juvenile and mature lime wood hygroscopic properties is enhanced by an adverse environmental stress impact.
  • High environmental stress results in rising extractives’ content, which leads to a wood hygroscopicity increase.
  • The sorption analysis results performed with parameters of GAB models show that the effect of high environmental stress is that the monolayer water was bound stronger to the primary sorption sites.

Author Contributions

Conceptualization: W.K.; methodology and investigation: W.K., I.R., J.M. M.G. and M.Z.; writing-original draft preparation: J.M., I.R., M.G., M.Z. and W.K.; writing-review and editing: M.Z.; preparing tables and figures, J.M.; performing statistical analysis: J.M.; supervision: W.K. All authors have read and agreed to the published version of the manuscript.

Funding

The article was financed within the Ministry of Science and Higher Education programme—“Regional Initiative Excellence” 2019–2022, project No. 005/RID/2018/19.

Acknowledgments

The authors thank the Polish State Forests, and in particular the Babki Forest District and the Międzychód Forest District for their assistance in obtaining wood material for research.

Conflicts of Interest

The authors declare no conflicts of interest.

References

  1. Rudawska, M.; Wilgan, R.; Janowski, D.; Iwański, M.; Leski, T. Shifts in taxonomical and functional structure of ectomycorrhizal fungal community of Scots pine (Pinus sylvestris L.) underpinned by partner tree ageing. Pedobiologia 2018, 71, 20–30. [Google Scholar] [CrossRef]
  2. Liszewska, M. Klimat w Polsce w XXI wieku—Prawdopodobne kierunki zmian. In Materiały Pierwszego Panelu Ekspertów w Ramach prac nad Narodowym Programem Leśnym; Rykowski, K., Ed.; Perspektywa Klimatów Lokalnych; Instytut Badawczy Leśnictwa: Sękocin Stary, Poland, 2013; pp. 35–44. [Google Scholar]
  3. De Jaegere, T.; Hein, S.; Claessens, H. A review of the characteristics of small-leaved lime (Tilia cordata Mill.) and their implications for silviculture in a changing climate. Forests 2016, 7, 56. [Google Scholar] [CrossRef] [Green Version]
  4. Erichsen, E.O.; Wolff, K.; Hansen, O.K. Genetic and clonal structures of the tree species Tilia cordata mill. in remnants of ancient forests in Denmark. Popul. Ecol. 2019, 61, 243–255. [Google Scholar] [CrossRef]
  5. Barniak, J.; Wilczyński, S.; Krąpiec, M. Dendrochronologia lipy drobnolistnej (Tilia cordata Mill.) z południowej Polski. Stud. Mater. CEPL W Rogowie 2014, 16, 74–80. [Google Scholar]
  6. Jaworski, A. Charakterystyka Hodowlana Drzew i Krzewów Leśnych; PWRiL: Warszawa, Poland, 2011. [Google Scholar]
  7. Tomanek, J. Botanika Leśna; PWRiL: Warszawa, Poland, 1987. [Google Scholar]
  8. Seneta, W.; Dolatowski, J. Dendrologia, 3rd ed.; Wydawnictwo Naukowe PWN: Warszawa, Poland, 2006. [Google Scholar]
  9. Gil, W.; Zajączkowski, G. Występowanie drzewostanów z udziałem lipy drobnolistnej (Tilia cordata Mill.) na terenie zarządzanym przez Lasy Państwowe. Sylwan 2014, 158, 743–753. [Google Scholar]
  10. Białobok, S. (Ed.) . Lipy; Arkadia: Poznań, Poland, 1991. [Google Scholar]
  11. Sadowiec, K.J.; Gawroński, S.W. Przydatność wybranych gatunków lip (Tilia sp.) do fitoremediacji powietrza z zanieczyszczeń pyłowych. Woda-Śr.-Obsz. Wiej. 2013, 13, 131–148. [Google Scholar]
  12. Popek, R.; Łukowski, A.; Karolewski, P.; Oleksyn, J. Wpływ zanieczyszczeń powietrza pyłem zawieszonym o różnym pochodzeniu na wzrost i kondycję pięciu gatunków drzew i krzewów. In Drzewa i Lasy w Zmieniającym się Środowisku. Materiały Konferencyjne; Tomaszewski, D., Jagodziński, A.M., Eds.; Bogucki Wydawnictwo Naukowe: Kórnik, Poznań, Poland, 2016; pp. 320–322. [Google Scholar]
  13. Erofeeva, E.A. Dependence of drooping birch (Betula pendula) and lime tree (Tilia cordata) relative seed production as a new seed production index on the intensity of motor traffic pollution. Adv. Environ. Biol. 2014, 8, 282–286. [Google Scholar]
  14. Krutul, D.; Zawadzki, J.; Radomski, A.; Zielenkiewicz, T.; Antczak, A. The content of chemical substances in the bark, rose and wood of common oak (Quercus petraea Liebl.). Ann. Wars. Univ. Life Sci. SGGW For. Wood Technol. 2007, 61, 82–387. [Google Scholar]
  15. Krutul, D.; Zielenkiewicz, T.; Zawadzki, J.; Radomski, A.; Antczak, A.; Drozdzek, M. Influence of urban environment originated heavy metal pollution on the extractives and mineral substances content in bark and wood of oak (Quercus robur L.). Wood Res-Slovak. 2014, 59, 177–190. [Google Scholar]
  16. Kiaei, M.; Kord, B.; Chehalmardian, A.; Moya, R.; Farsi, M. Mineral content in relation to radial position, altitude, chemical properties and density of Persian ironwood. Maderas Cienc. Tecnol. 2015, 17, 657–672. [Google Scholar] [CrossRef] [Green Version]
  17. Hernández, R.E. Moisture sorption properties of hardwoods as affected by their extraneous substances, wood density, and interlocked grain. Wood Fiber Sci. 2007, 39, 132–145. [Google Scholar]
  18. Jankowska, A.; Drożdżek, M.; Sarnowski, P.; Horodeński, J. Effect of extractives on the equilibrium moisture content and shrinkage of selected tropical wood species. BioResources 2017, 12, 597–607. [Google Scholar] [CrossRef]
  19. Spalt, H.A. Water vapor sorption by wood. For. Prod. J. 1958, 8, 288–295. [Google Scholar]
  20. Vahtikari, K.; Rautkari, L.; Noponen, T.; Lillqvist, K.; Hughes, M. The influence of extractives on the sorption characteristics of Scots pine (Pinus sylvestris L.). J. Mater. Sci. 2017, 52, 10840–10852. [Google Scholar] [CrossRef]
  21. Simón, C.; Esteban, L.G.; de Palacios, P.; Fernández, F.G.; Martín-Sampedro, R.; Eugenio, M.E. Thermodynamic analysis of water vapour sorption behaviour of juvenile and mature wood of Abies alba Mill. J. Mater. Sci. 2015, 50, 7282–7292. [Google Scholar] [CrossRef]
  22. Majka, J.; Olek, W. Sorption properties of mature and juvenile lime wood (Tilia sp.). Folia For. Pol. B 2008, 39, 65–75. [Google Scholar]
  23. Kondracki, J. Geografia Regionalna Polski; Wydawnictwo Naukowe PWN: Warszawa, Poland, 2001. [Google Scholar]
  24. Woś, A. Klimat Polski; Wydawnictwo Naukowe PWN: Warszawa, Poland, 1999. [Google Scholar]
  25. Zielony, R.; Kliczkowska, A. Regionalizacja Przyrodniczo-Leśna Polski 2010; Dyrekcja Generalna Lasów Państwowych: Warszawa, Poland, 2012. [Google Scholar]
  26. R Core Team R. A Language and Environment for Statistical Computing; Version 3.0.3; R Foundation for Statistical Computing: Vienna, Austria, 2014. [Google Scholar]
  27. Bunn, A.; Korpela, M.; Biondi, F.; Campelo, F.; Mérian, P.; Qeadan, F.; Zang, C.; Buras, A.; Cecile, J.; Mudelsee, M. Package ‘dplR’. 2020; Available online: https://cran.r-project.org/web/packages/dplR/dplR.pdf (accessed on 9 July 2020).
  28. Moser, A.; Rahman, M.A.; Pretzsch, H.; Pauleit, S.; Rötzer, T. Inter- and intraannual growth patterns of urban small-leaved lime (Tilia cordata mill.) at two public squares with contrasting microclimatic conditions. Int. J. Biometeorol. 2017, 61, 1095–1107. [Google Scholar] [CrossRef]
  29. Speer, J.H. Fundamentals of Tree-Ring Research; University of Arizona Press: Tuscon, AZ, USA, 2010. [Google Scholar]
  30. Browning, B.L. The Chemistry of Wood; Interscience Publishers: New York, NY, USA, 1967. [Google Scholar]
  31. Technical Association of the Pulp and Paper Industry. Pentosans in Wood and Pulp, T 223 cm-01; Technical Association of the Pulp and Paper Industry: New York, NY, USA, 2001; p. 5. [Google Scholar]
  32. Technical Association of the Pulp and Paper Industry. Acid Insoluble Lignin in Wood and Pulp, T 222 cm-06; Technical Association of the Pulp and Paper Industry: New York, NY, USA, 2006; p. 5. [Google Scholar]
  33. Technical Association of the Pulp and Paper Industry. Solvent Extractives of Wood and Pulp, T 204 cm-97; Technical Association of the Pulp and Paper Industry: New York, NY, USA, 2007; p. 12. [Google Scholar]
  34. Technical Association of the Pulp and Paper Industry. One Percent Sodium Hydroxide Solubility of Wood and Pulp, T 212 cm-02; Technical Association of the Pulp and Paper Industry: New York, NY, USA, 2002; p. 6. [Google Scholar]
  35. Krzyżaniak, M.; Stolarski, M.J.; Waliszewska, B.; Szczukowski, S.; Tworkowski, J.; Załuski, D.; Śnieg, M. Willow biomass as feedstock for an integrated multi-product biorefinery. Ind. Crops Prod. 2014, 58, 230–237. [Google Scholar] [CrossRef]
  36. Pizzo, B.; Giachi, G.; Fiorentino, L. Evaluation of the applicability of conventional methods for the chemical characterization of waterlogged archaeological wood. Archaeometry 2010, 52, 656–667. [Google Scholar] [CrossRef]
  37. Timmermann, E.O. Multilayer sorption parameters: BET or GAB values? Colloids Surf. Physicochem. Eng. Asp. 2003, 220, 235–260. [Google Scholar] [CrossRef] [Green Version]
  38. Babiak, M. Sorption isotherms of wood. In Fundamentals of Wood Drying; Perré, P., Ed.; A.R.BO.LOR: Nancy, France, 2007; pp. 67–86. [Google Scholar]
  39. Schär, W.; Rüegg, M. The evaluation of GAB constants from water vapour sorption data. Lebensm. Wiss. Technol. 1985, 18, 225–229. [Google Scholar]
  40. Skaar, C. Hygroexpansion in wood. In Wood-Water Relations; Springer: Berlin/Heidelberg, Germany, 1988; pp. 122–176. [Google Scholar]
  41. Majka, J.; Czajkowski, Ł.; Olek, W. Effects of cyclic changes in relative humidity on the sorption hysteresis of thermally modified spruce wood. BioResources 2016, 11, 5265–5275. [Google Scholar] [CrossRef] [Green Version]
  42. Fukazawa, K. Juvenile Wood of Hardwoods Judged by Density Variation. IAWA J. 1984, 5, 65–73. [Google Scholar] [CrossRef]
  43. Gartner, B.L.; Lei, H.; Milota, M.R. Variation in the Anatomy and Specific Gravity of Wood within and Between Trees of Red Alder (Alnus Rubra Bong.). Wood Fiber Sci. 2007, 29, 10–20. [Google Scholar]
  44. Yanchuk, A.D.; Micko, M.M. Radial variation of wood density and fibre length in trembling aspen. IAWA J. 1990, 11, 211–215. [Google Scholar] [CrossRef]
  45. Callesen, I.; Nilsson, L.O.; Schmidt, I.K.; Vesterdal, L.; Ambus, P.; Christiansen, J.R.; Högberg, P.; Gundersen, P. The natural abundance of 15 N in litter and soil profiles under six temperate tree species: N cycling depends on tree species traits and site fertility. Plant Soil 2013, 368, 375–392. [Google Scholar] [CrossRef] [Green Version]
  46. Dünisch, O. Relationship between anatomy and vibration behaviour of softwoods and hardwoods. IAWA J. 2017, 38, 81–98. [Google Scholar] [CrossRef] [Green Version]
  47. Wagenführ, R.; Scheiber, C. Holzatlas; Fachbuchverlag: Leipzig, Germany, 1985. [Google Scholar]
  48. Helińska-Raczkowska, L.; Fabisiak, E. Radial variation of earlywood vessel lumen diameter as an indicator of the juvenile growth period in ash (Fraxinus excelsior L.). Holz Als Roh-Und Werkstoff 1999, 57, 283–286. [Google Scholar] [CrossRef]
  49. Nawrot, M.; Pazdrowski, W.; Walkowiak, R.; Szymański, M.; Kaźmierczak, K. Analysis of coniferous species to identify and distinguish juvenile and mature wood. J. For. Sci. 2014, 60, 143–153. [Google Scholar] [CrossRef] [Green Version]
  50. Yang, K.C.; Benson, C.A.; Wong, J.K. Distribution of juvenile wood in two stems of Larix laricina. Can. J. For. Res. 1986, 16, 1041–1049. [Google Scholar] [CrossRef]
  51. Watmough, S.A.; Hutchinson, T.C.; Sager, E.P.S. Changes in tree ring chemistry in sugar maple (Acer saccharum) along an urban–rural gradient in southern Ontario. Environ. Pollut. 1998, 101, 381–390. [Google Scholar] [CrossRef]
  52. Watmough, S.A.; Hutchinson, T.C. Historical changes in lead concentrations in tree-rings of sycamore, oak and Scots pine in north-west England. Sci. Total Environ. 2002, 293, 85–96. [Google Scholar] [CrossRef]
  53. Brunauer, S. The Adsorption of Gases and Vapors; Princeton University Press: London, UK; Oxford University Press: Princeton, NJ, USA, 1943. [Google Scholar]
  54. Lewicki, P.P. The applicability of the GAB model to food water sorption isotherms. Int. J. Food Sci. Technol. 1997, 32, 553–557. [Google Scholar] [CrossRef]
  55. de Oliveira, G.H.H.; Corrêa, P.C.; de Oliveira, A.P.L.R.; dos Reis, R.C.; Devilla, I.A. Application of GAB model for water desorption isotherms and thermodynamic analysis of sugar beet seeds. J. Food Process Eng. 2017, 40, e12278. [Google Scholar] [CrossRef]
  56. Timmermann, E.O.; Chirife, J.; Iglesias, H.A. Water sorption isotherms of foods and foodstuffs: BET or GAB parameters? J. Food Eng. 2001, 48, 19–31. [Google Scholar] [CrossRef]
  57. Pigott, C.D. Tilia cordata Miller. J. Ecol. 1991, 79, 1147–1207. [Google Scholar] [CrossRef]
  58. Gryc, V.; Vavrčík, H.; Rybníček, M.; Přemyslovská, E. The relation between the microscopic structure and the wood density of European beech (Fagus sylvatica L.). J. For. Sci. 2008, 54, 170–175. [Google Scholar] [CrossRef] [Green Version]
  59. Kollman, F.; Côté, W. Principles of Wood Science and Technology; Solid Wood–Wood Based Materials; Springer: Berlin /Heidelberg, Germany, 1984; Volume I–II. [Google Scholar]
  60. Usta, İ. Comparative study of wood density by specific amount of void volume (porosity). Turk. J. Agric. For. 2003, 27, 1–6. [Google Scholar]
  61. Zobel, B.J.; Sprague, J.R. Juvenile Wood in Forest Trees; Springer Series in Wood Science; Springer: Berlin/Heidelberg, Germany, 1998; ISBN 978-3-642-72128-1. [Google Scholar]
  62. Zobel, B.J.; van Buijtenen, J.P. Wood Variation. Its Causes and Control; Springer: Berlin/Heidelberg, Germany, 1989. [Google Scholar]
  63. Ayaşlıgil, Y. The ecology and natural spread of woody plants in park and gardens. J. İÜ For. Fac. Ser. B 1989, 39, 89–100. [Google Scholar]
  64. Doğu, D.A. The factors affecting wood structure. J. East. Mediterr. For. Res. Inst. 2002, 8, 81–102. [Google Scholar]
  65. Waliszewska, B. Wpływ warunków wzrostu na zawartość węglowodanów w wybranych odmianach wierzb krzewiastych. In Reakcje Biologiczne Drzew na Zanieczyszczenia Przemysłowe; Siwecki, R., Ed.; Wyd. Nauk: Poznań, Poland, 2002. [Google Scholar]
  66. Waliszewska, B.; Prądzyński, W. Podstawowy skład chemiczny i stopień polimeryzacji celulozy w jednorocznych i wieloletnich wierzbach krzewiastych rosnących przy autostradzie A-2. In Proceedings of the 4th National Symposium on Biological Responses of Trees to Industrial Pollution, Poznań-Kórnik, Poland, 23–25 May 2002; pp. 725–732. [Google Scholar]
  67. Waliszewska, B.; Mleczek, M.; Zborowska, M.; Goliński, P.; Rutkowski, P.; Szentner, K. Changes in the chemical composition and the structure of cellulose and lignin in elm wood exposed to various forms of arsenic. Cellulose 2019, 26, 6303–6315. [Google Scholar] [CrossRef] [Green Version]
  68. Mleczek, M.; Gąsecka, M.; Waliszewska, B.; Magdziak, Z.; Szostek, M.; Rutkowski, P.; Kaniuczak, J.; Zborowska, M.; Budzyńska, S.; Mleczek, P. Salix viminalis L.—A highly effective plant in phytoextraction of elements. Chemosphere 2018, 212, 67–78. [Google Scholar] [CrossRef] [PubMed]
  69. Krutul, D.; Dzbeński, W.; Makowski, T.; Zawadzki, J. Influence of environment pollution on the chemical composition of bark and wood of Scoth pine (Pinus sylvestris L.). Wood Struct. Prop. 2006, 6, 67–70. [Google Scholar]
  70. Bao, F.C.; Jiang, Z.H.; Jiang, X.M.; Lu, X.X.; Luo, X.Q.; Zhang, S.Y. Differences in wood properties between juvenile wood and mature wood in 10 species grown in China. Wood Sci. Technol. 2001, 35, 363–375. [Google Scholar] [CrossRef]
  71. Dünisch, O.; Richter, H.G.; Koch, G. Wood properties of juvenile and mature heartwood in Robinia pseudoacacia L. Wood Sci. Technol. 2010, 44, 301–313. [Google Scholar] [CrossRef]
  72. Latorraca, J.V.; Dünisch, O.; Koch, G. Chemical composition and natural durability of juvenile and mature heartwood of Robinia pseudoacacia L. An. Acad. Bras. Ciênc. 2011, 83, 1059–1068. [Google Scholar] [CrossRef] [Green Version]
  73. Krutul, D.; Zielenkiewicz, T.; Radomski, A.; Zawadzki, J.; Drożdżek, M.; Antczak, A. Influence of urban environment originated heavy metals pollution on the content of extractives, cellulose and lignin in the oak wood. Ann. Wars. Univ. Life Sci. For. Wood Technol 2010, 71, 410–416. [Google Scholar]
  74. Teaca, C.A.; Roşu, D.; Mustaţă, F.; Rusu, T.; Roşu, L.; Roşca, I.; Varganici, C.D. Natural Bio-Based Products for Wood Coating and Protection against Degradation: A Review. BioResources 2019, 14, 4873–4901. [Google Scholar]
  75. Andrady, A.L.; Torikai, A.; Redhwi, H.H.; Pandey, K.K.; Gies, P. Consequences of stratospheric ozone depletion and climate change on the use of materials. Photochem. Photobiol. Sci. 2015, 14, 170–184. [Google Scholar] [CrossRef] [Green Version]
  76. Carter, F.L.; Garlo, A.M.; Stanley, J.B. Termiticidal components of wood extracts: 7-methyljuglone from Diospyros virginiana. J. Agric. Food Chem. 1978, 26, 869–873. [Google Scholar] [CrossRef]
  77. Santana, A.L.; Maranhão, C.A.; Santos, J.C.; Cunha, F.M.; Conceição, G.M.; Bieber, L.W.; Nascimento, M.S. Antitermitic activity of extractives from three Brazilian hardwoods against Nasutitermes corniger. Int. Biodeterior. Biodegrad. 2010, 64, 7–12. [Google Scholar] [CrossRef]
  78. Taylor, A.M.; Gartner, B.L.; Morrell, J.J.; Tsunoda, K. Effects of heartwood extractive fractions of Thuja plicata and Chamaecyparis nootkatensis on wood degradation by termites or fungi. J. Wood Sci. 2006, 52, 147–153. [Google Scholar] [CrossRef]
  79. Marković, D.M.; Milošević, I.R.; Vilotić, D. Accumulation of Mn and Pb in linden (Tilia platyphyllos Scop.) bark and wood. Environ. Sci. Pollut. Res. 2013, 20, 136–145. [Google Scholar] [CrossRef] [PubMed]
  80. Liu, X.Y.; Jin, J.Y.; He, P.; Gao, W.; Li, W.J. Effect of potassium chloride on lignin metabolism and its relation to resistance of corn to stalk rot. Sci. Agric. Sin. 2007, 40, 2780–2787. [Google Scholar]
Figure 1. The location of the investigated Tilia cordata Mill. trees in Greater Poland–Pomerania natural forest regions (grey area). (A)—cambial age: 50 years old; (B)—130 years old; (C)—100 years old.
Forests 11 00746 g001
Figure 2. The illustration of the growth environment of the compared Tilia cordata Mill. trees ((A)—forest, (B)—roadside, (C)—urban agglomeration).
Forests 11 00746 g002
Figure 3. The scheme of a sample preparation (h—breast diameter (1.3 m), 1—main strip for ring width and basic density measurements, 2—main strip for chemical composition, content of chemical elements and sorption measurements, (a)—cutting pattern of the samples for basic density measurements, (b)—cutting pattern of the samples for chemical composition, content of chemical elements and sorption measurements, d1—distance from the pith (3 annual rings), d2—distance from the bark (6 annual rings), dimension in mm).
Forests 11 00746 g003
Figure 4. The radial pattern of basic density and standardised tree-ring width (RWI) of lime (Tilia cordata Mill.) wood taking into account growth conditions (A—forest, B—roadside, C—urban agglomeration, dots represent experimental data).
Forests 11 00746 g004
Figure 5. Experimental sorption data (dots) and results of modelling (lines) with Guggenheim, Anderson, and de Boer (GAB) model of the juvenile and mature lime (Tilia cordata Mill.) wood at 20 °C take into account growth conditions (a)—forest (A), (b)—roadside (B), (c)—urban agglomeration (C).
Forests 11 00746 g005
Figure 6. Plotted experimental data (points) and fitted curves (lines) by Equation (2) of the ratio relative humidity (RH)/EMC versus air relative humidity for adsorption and desorption at 20 °C of juvenile lime (Tilia cordata Mill.) wood (tree growth in the forest (A)).
Forests 11 00746 g006
Figure 7. The sorption hysteresis ΔEMC of the (a) juvenile and (b) mature lime (Tilia cordata Mill.) wood at 20 °C taking into account growth conditions (A—forest, B—roadside, C—urban agglomeration).
Forests 11 00746 g007
Table 1. Two-factor analysis of variance (ANOVA) tables for chemical composition of lime (Tilia cordata Mill.) wood taking into account the effect of cambial age and environment.
Chemical CompositionEffectSSdfMSF-Valuep-Value
HolocelluloseCambial age (a)81.71181.71193.010.000
Environment (b)93.93246.96110.940.000
a × b83.25241.6398.330.000
CelluloseCambial age (a)1.3011.3013.980.003
Environment (b)24.51212.25132.190.000
a × b20.51210.26110.620.000
PentosansCambial age (a)1.1011.100.790.392
Environment (b)16.6528.335.990.017
a × b7.4123.702.670.114
LigninCambial age (a)18.61118.61147.470.000
Environment (b)13.1926.6052.280.000
a × b0.0620.030.230.801
Substances soluble in NaOHCambial age (a)1.0911.091.650.228
Environment (b)87.67243.8366.110.000
a × b171.62285.81129.420.000
Substances soluble in alcoholCambial age (a)29.04129.04326.610.000
Environment (b)62.68231.34352.510.000
a × b100.14250.07563.190.000
SS—a sum of squares, df—degrees of freedom, M—mean squares, F—Fisher’s F-test.
Table 2. Chemical composition of lime (Tilia cordata Mill.) wood.
Wood SamplesHolocellulose [%]Cellulose [%]Pentosans [%]Lignin [%]HC/LSubstances Soluble in NaOH [%]Substances Soluble in Alcohol [%]
Cambial AgeEnvironment
Juvenile woodA85.8 c ± 0.643.2 a ± 0.223.7 a ± 1.720.5 a ± 0.74.224.4 a ± 0.26.7 b ± 0.5
B75.7 a ± 0.344.6 b ± 0.220.5 a ± 0.622.1 b ± 0.33.425.3 a ± 0.53.3 a ± 0.1
C84.2 b ± 1.042.8 a ± 0.624.5 a ± 1.620.2 a ± 0.34.226.8 b ± 0.19.3 c ± 0.4
Mature woodA86.6 a ± 1.046.7 c ± 0.223.4 a ± 1.018.4 a ± 0.54.720.0 a ± 0.25.4 a ± 0.1
B86.0 a ± 0.143.9 b ± 0.223.0 a ± 0.620.1 b ± 0.14.324.7 b ± 1.77.8 b ± 0.1
C85.8 a ± 0.341.6 a ± 0.223.9 a ± 0.817.9 a ± 0.14.833.4 c ± 0.514.0 c ± 0.2
Literature data [47]-43.2–54.019.7–20.418.3–29.3-23.56.5 1
1 substances soluble in alcohol—benzene 1:1.Mean value (n = 3) ± standard deviation; identical superscripts (a, b, c) denote no significant difference (p < 0.05) between mean values according to post-hoc Tukey’s honest significant difference (HSD) test.
Table 3. Two-factor ANOVA tables for chemical composition of elements (Fe, Zn, Cu, Pb, Cd) of lime (Tilia cordata Mill.) wood taking into account the effect of cambial age and environment.
Chemical CompositionEffectSSdfMSF-Valuep-Value
FeCambial age (a)72,530172,53023,6700.000
Environment (b)12,582262,92620,5360.000
a × b132,446266,22321,6120.000
ZnCambial age (a)887.11887.17152.50.000
Environment (b)3707.921853.914,9480.000
a × b3941.121970.515,8890.000
CuCambial age (a)16.68116.68103.940.000
Environment (b)262.212131.11816.740.000
a × b643.342321.672003.90.000
PbCambial age (a)21.98121.9836.750.000
Environment (b)269.782134.89225.540.000
a × b582.292291.15486.800.000
CdCambial age (a)0.34510.369.140.000
Environment (b)2.24421.12224.790.000
a × b0.83720.483.900.000
SS—a sum of squares, df—degrees of freedom, M—mean squares, F—Fisher’s F-test.
Table 4. Chemical composition of elements (Fe, Zn, Cu, Pb, Cd) of lime (Tilia cordata Mill.) wood.
Wood SamplesFe [mg/kg]Zn [mg/kg]Cu [mg/kg]Pb [mg/kg]Cd [mg/kg]
Cambial AgeDistrict
Juvenile woodA51.2 b ± 1.323.7 a ± 0.214.5 c ± 0.418.3 c ± 0.60.1 b ± 0.0
B36.4 a ± 0.333.5 b ± 0.69.9 b ± 0.410.5 b ± 1.40.5 a ± 0.1
C75.4 c ± 0.723.9 a ± 0.28.1 a ± 0.20.7 a ± 0.10.4 a ± 0.1
Mature woodA419.8 b ± 3.68.6 a ± 0.04.3 a ± 0.30.0 a0.2 a ± 0.0
B61.5 a ± 0.736.1 b ± 0.37.7 b ± 0.316.0 c ± 0.61.4 c ± 0.0
C62.5 a ± 1.778.6 c ± 0.426.3 c ± 0.66.9 b ± 1.00.3 b ± 0.1
Mean value (n = 3) ± standard deviation; identical superscripts (a, b, c) denote no significant difference (p < 0.05) between mean values according to post-hoc Tukey’s HSD test.
Table 5. Two-factor ANOVA tables for chemical composition of elements (K, Ca, Na, Mg) of lime (Tilia cordata Mill.) taking into account the effect of cambial age and environment.
Chemical CompositionEffectSSdfMSF-Valuep-Value
KCambial age (a)686,5731686,573470.900.000
Environment (b)4,575,28622,287,6431569.040.000
a × b14,885,33627,442,6685104.750.000
CaCambial age (a)80,238,479180,238,4794739.800.000
Environment (b)19,422,76429,711,382573.660.000
a × b26,038,807213,019,403769.070.000
NaCambial age (a)196,8761196,8761111.570.000
Environment (b)3,923,06121,961,53111,074.880.000
a × b7,546,60923,773,30421,304.230.000
MgCambial age (a)571,6441571,6449641.010.000
Environment (b)490,1792245,0894133.540.000
a × b1,163,2022581,6019808.940.000
SS—a sum of squares, df—degrees of freedom, M—mean squares, F—Fisher’s F-test.
Table 6. Chemical composition of elements (K, Na, Mg, Ca) in lime (Tilia cordata Mill.) wood.
Wood SamplesK [mg/kg]Na [mg/kg]Mg [mg/kg]Ca [mg/kg]
Cambial AgeEnvironment
Juvenile woodA1815.2 b ± 10.01953.4 b ± 8.21446.8 c ± 16.65119.7 a ± 114.9
B3376.3 c ± 12.13186.6 c ± 8.01103.7 b ± 6.09732.2 b ± 242.2
C410.6 a ± 8.71814.3 a ± 8.2536.0 a ± 2.25100.9 a ± 149.1
Mature woodA1307.7 a ± 17.41161.9 a ± 3.3719.5 b ± 0.31902.7 a ± 27.2
B2128.6 b ± 6.81764.9 b ± 8.4399.3 a ± 1.32192.3 b ± 64.1
C3337.6 c ± 89.93400.0 c ± 28.0898.5 c ± 6.03189.8 c ± 51.3
Mean value (n = 3) ± standard deviation; identical superscripts (a, b, c) denote no significant difference (p < 0.05) between mean values according to post-hoc Tukey’s HSD test.
Table 7. Estimated coefficients of the sorption GAB model for juvenile and mature lime (Tilia cordata Mill.) wood.
Wood SamplesSorptionabcR2MmKC
Cambial AgeEnvironmentPhase [kg/kg]
Juvenile woodAAds.4.00313.25−13.540.98580.05050.81896.042
Des.2.8478.902−7.8090.99010.07710.71416.379
BAds.3.26211.75−11.530.99210.05890.80246.491
Des.2.1827.971−6.4380.99590.09140.68087.365
CAds.3.67413.30−13.350.99020.05180.81896.420
Des.2.6778.961−7.7960.98900.07810.71666.672
Mature woodAAds.4.37813.21−13.810.98600.04900.82195.671
Des.3.2508.917−8.2220.98100.07320.72875.766
BAds.4.18312.49−12.610.98860.05220.79705.747
Des.3.0868.638−7.5090.98140.07730.69616.021
CAds.3.52316.39−16.830.98810.04450.86607.371
Des.2.71411.93−11.420.99570.06130.80837.438
Table 8. Sorption hysteresis loop (H), maximum difference in equilibrium moisture content for desorption and adsorption (ΔEMCmax) and corresponding air relative humidity (RH) indices for lime (Tilia cordata Mill.) wood.
Wood SamplesHΔEMCmaxRH
Cambial AgeEnvironment[Arb. Units][kg/kg][-]
Juvenile woodA0.01840.0280.70
B0.02190.0320.67
C0.01830.0280.70
Mature woodA0.01680.0260.73
B0.01620.0250.70
C0.01570.0250.78