Article

Aboveground Carbon Storage and Cycling of Flooded and Upland Forests of the Brazilian Pantanal

by
Osvaldo Borges Pinto, Jr.
1,
Ana Carolina Amorim Marques
1 and
George L. Vourlitis
2,*
1
Programa de Pós-Graduação em Ciências Ambiental, Universidade de Cuiabá (UNIC), Cuiabá, Mato Grosso 78065-900, Brazil
2
Department of Biological Sciences, California State University, San Marcos, CA 92096, USA
*
Author to whom correspondence should be addressed.
Forests 2020, 11(6), 665; https://doi.org/10.3390/f11060665
Submission received: 18 April 2020 / Revised: 3 June 2020 / Accepted: 9 June 2020 / Published: 11 June 2020
(This article belongs to the Special Issue Forests Carbon and Water Dynamics)

Abstract

:
Tropical forests and savanna (cerrado) are important carbon (C) sinks; however, few data exist for seasonally flooded forests. We quantified the annual rates of aboveground net primary production (ANPP) over a five-year period for two forests, an upland mixed forest and a seasonally flooded cerrado forest, located in the northern Pantanal region of Brazil. We hypothesized that rates of ANPP would be higher for the mixed forest than the cerrado forest because seasonal flooding can limit rates of tree growth. ANPP was calculated as the sum of the annual litter production measured from litterfall traps and the stem growth increment measured from dendrometers and tree density. ANPP varied between 3.8–5.5 MgC ha−1 y−1 for the flooded forest and 1.6–4.6 MgC ha−1 y−1 for the upland forest. Litter production accounted for 57% of the ANPP, and the difference in ANPP between the upland and flooded forests was due to consistently higher litter production in the flooded forest. Annual variations in ANPP were not correlated with annual precipitation, presumably because the hydrology of these sites is driven more by the flood stage of the Cuiaba River than by local precipitation. However, consistent declines in forest floor litter mass occurred at both sites, suggesting that C storage may be responding to some unknown disturbance that occurred prior to our sampling campaign. Seasonal variation in rainfall exerted an important control on litter production dynamics, with leaf litter production increasing during the dry season and stem and reproductive litter production increasing during the wet season. While there are few studies of seasonally flooded tropical forests, our data suggest that the seasonally flooded and upland forests of the northern Pantanal can act as appreciable aboveground C sinks.

1. Introduction

Tropical forests, including rain and seasonal forest and savanna (cerrado), are important carbon (C) sinks and account for approximately 65% of the global terrestrial C storage [1]. However, large spatial variations in species composition and structure, climate, and hydrology increase the uncertainty around C storage estimates [2,3,4,5]. This is especially true in the cerrado domain, where aboveground C stocks can vary by a factor of 2–4 between cerrado forests, woodlands, and grasslands, respectively [5,6,7], often over small (<1 km) spatial scales. These large spatial variations in C storage are attributed to land use and disturbance [8,9], soil type and fertility [5,7,10], and hydrology [11,12,13].
Cerrado in the Pantanal region of Brazil is a complex mosaic of upland and seasonally flooded forests and woodlands [14,15] that are of vital importance in the national and international context [11,16]. The Pantanal covers approximately 160,000 km2, most of which is located in southwestern Brazil, but extends into Bolivia, Paraguay, and Argentina [11]. Most of the Pantanal is considered wetland, with flooding occurring in the wet season when rivers overbank and inundate the surrounding floodplains [17]. This periodic flooding shapes the landscape and results in different plant communities [18]; however, some areas always remain dry [19]. The forests that are seasonally flooded are referred to as hyperseasonal, because the flooded period is followed by a period of prolonged (ca. five-month) drought [11,12,14,17]. While seasonal flooding is the defining feature of much of the Pantanal, none of the >500 tree species are endemic to the Pantanal, and many tree species can be found in both upland and hyperseasonal forests [11,20,21]. Thus, upland and hyperseasonal forests often have similar tree species composition, structure (height, density, and leaf area index), and species richness [4,7,11,12,14,17,18,19,20,21,22]. Even so, upland and hyperseasonal forests can have large differences in aboveground C storage, litter production, and the rates of C cycling [21,22], but multi-year patterns are unknown, and it is possible that interactions between flooding and climate may alter patterns of C storage and cycling [5].
Here we quantify the annual rates of aboveground net primary production (ANPP) and the components of ANPP (wood C storage and litter dynamics), over a five-year period for two forests, an upland mixed forest and a seasonally flooded cerrado forest, located in the northern Pantanal region of Brazil. While these forests have different hydrology, they are separated by approximately 200 m, share approximately 35% of their tree species composition, and have similar forest structural and soil properties [21]. We hypothesize that the rates of ANPP will be higher for the upland mixed forest because seasonal flooding can limit rates of growth [17,23] for trees in the cerrado forest and the mixed forest has higher soil fertility [7,21].

2. Materials and Methods

2.1. Characteristics of the Study Area

This study was conducted between July 2014 and July 2019 at Baia das Pedras, located in the northern Pantanal approximately 130 km southwest of Cuiaba, Mato Grosso, Brazil. Measurements were made in an upland mixed forest (16°30′15.202″ S:56° 24′ 15.304″ W) and a seasonally flooded (hyperseasonal) cerrado forest (16°30′31.139″ S:56° 24′ 24.505″ W). The climate is tropical wet (Aw) according to the Köppen classification, with well-defined rainy (October–April) and dry (May–September) seasons [24]. The average annual air temperature ranges from a maximum of 32 °C and a minimum of 17 °C [25]. The mean annual precipitation is 1383 mm, based on records from 1901 to 2003 in Cuiabá, with the highest monthly mean precipitation (ca. 220 mm) in January and the lowest (ca. 10 mm) in July [18].
The site characteristics were described in detail in [21]; however, the hyperseasonal (cerrado) forest experiences approximately 0.3 m of flooding during the wet season (February–April), while the mixed forest never experiences flooding [22,26]. Both sites have similar canopy height (8–10 m) and tree density (1440–1480 trees/ha), but leaf area index is significantly higher in the upland mixed forest. Approximately 34% of all tree species occur in both forests; however, the mixed forest has a higher proportion of palms (Attalea phalerata Mart. ex Spreng.) than the hyperseasonal forest [21]. The soils are clay-rich Plinthosols [27], and while both stands have similar soil texture and bulk density, the upland forest has higher phosphorus (P) and pH and the flooded forest has higher total C [21].

2.2. Collection of Litter Fall and Litter Pool

Each site had six circular 1.13 m diameter (1 m2) × 1 m tall litterfall traps constructed from metal frames and 1 mm nylon mesh. Litter was collected monthly, cleaned to remove dirt and other debris, dried at 70 °C for 72 h (or until constant weight), and separated into leaves, stems, and reproductive components (flowers, fruits, and seeds). Litter pool stocks were measured monthly in randomly located areas adjacent to each litterfall trap by collecting surface litter from a 25 cm diameter (490 cm2) circular quadrat. Litterpool samples were cleaned of dirt and other inorganic debris, and dried at 70 °C for 72 h or until constant weight. Litterpool and fall samples were weighed to two decimal places using a digital balance. Litter collected in the litterfall traps and forest floor were analyzed for C concentration using the Walkley–Black method [7], and litterfall and litter pool dry mass (gdw/m2) were converted to C units (gC/m2) by multiplying the dry mass by the C concentration.

2.3. Measurement of Wood C Increment

Measurements of wood C storage were described in detail in [5]. Field sampling was conducted during the dry season (July–August) when hyperseasonal forests were accessible, and errors in estimating woody biomass due to trunk water storage were minimized [5]. Tree density and stem growth increment were measured using permanent 100 m long transects randomly established in each stand. Transects were used instead of large plots, which are often used for forest inventories [2,4], because there was high small-scale variation in the vegetation that precluded the use of large inventory plots [5,7,12]. Tree density was measured every 5 m along each 100 m transect using the point-quarter method, where each sample point was divided into 4 quarters, and the distance between the closest tree (≥3 cm in diameter) and the sample point in each quarter was measured [7]. Some trees were the closest tree in different quadrants at two adjacent sampling points, thus, there were a variable number of trees tagged at each study site for the subsequent measurement of circumference and growth increment (n = 39 and 75 trees/stand in the mixed and cerrado forests, respectively). Measured trees were tagged and identified to genus and species (if possible). The tagged trees that died were noted, and new trees (>3 cm in diameter) that were closest to the sample point were tagged and identified. Tree density (D = trees/ha) was calculated for each measurement point as D = 10,000/(Σdq/nq)2, where dq is the distance between the closest tree in each quarter q, nq is the number of quarters per sample point (4), and 10,000 is the conversion from trees/m2 to trees/ha [7]. The average tree density per stand (Ds) was calculated from the tree density estimated for each sample point along the 100 m transect (n = 20).
Wood density (ρ; g/cm3) was measured for each tagged tree in each stand by extracting a wood core with an increment borer. Wood samples were measured for volume, dried at 70 °C for 1 week, and weighed to the nearest 0.01 g using a digital balance. Trunk ρ was calculated as the dry mass of wood divided by the volume of the fresh wood core, and wood C concentration was measured from the dried cores using a wet combustion (Walkley–Black) method [7].
Trunk circumference at breast height (BH) was measured annually during the dry season (July–August) for all tagged trees, and annual stem growth increment was measured using plastic spring-loaded dendrometer bands [28]. Circumference was converted to diameter at BH (DBH), and aboveground biomass (AGB; kg/tree) was calculated from DBH, tree height (h), and wood density (ρ) using established equations for tropical forest trees [29,30]. AGB was converted to C units (AGC; kgC/tree) by multiplying AGB by the wood C concentration, and the aboveground wood C pool (MgC/ha) was calculated by multiplying AGC by the average stand density (Ds). The annual wood C growth increment (MgC ha−1 y−1) was calculated as the difference in the wood C pool during the current year minus the wood C pool measured during the previous year [5]. The wood C increment was not measured for palms, due to difficulties in measuring tree height, and thus, growth rate [31].

2.4. Data Analysis

Litter C production per year (LFC) was calculated by summing the monthly litter production from each litterfall trap. Annual rates of litter decomposition (D) were estimated by first calculating the annual decomposition rate constant (k) as LF/LF + LP, where LF = annual litterfall and LP = average annual litter pool size, and then assuming steady state, decomposition was calculated as LF − LP × k [22,32]. Aboveground net primary production (ANPP) was calculated as the sum of the annual litter fall C and the annual wood C increment: LFC + WC. This calculation neglects C losses associated with herbivory, decaying standing wood, and volatile C emissions [33], which may be substantial for tropical forests [34,35]; however, the magnitude of these losses is highly uncertain for these forests. The likely consequence of omitting these losses is an underestimation of ANPP [33].
Differences in C storage and cycling between the forest stands were not statistically tested because of a lack of site replication; however, 95% confidence intervals were calculated for mean quantities to allow comparisons between the stands. Correlations between monthly precipitation and litter dynamics (D, LFC, and LPC) were quantified using cross-correlation, due to the potential for time lags between precipitation and litter dynamics [36]. Statistical analyses were conducted using MS Excel 2013 and NCSS statistical software (Version 7, NCSS, LLC, Kaysville, UT, USA).

3. Results

3.1. Litter Dynamics

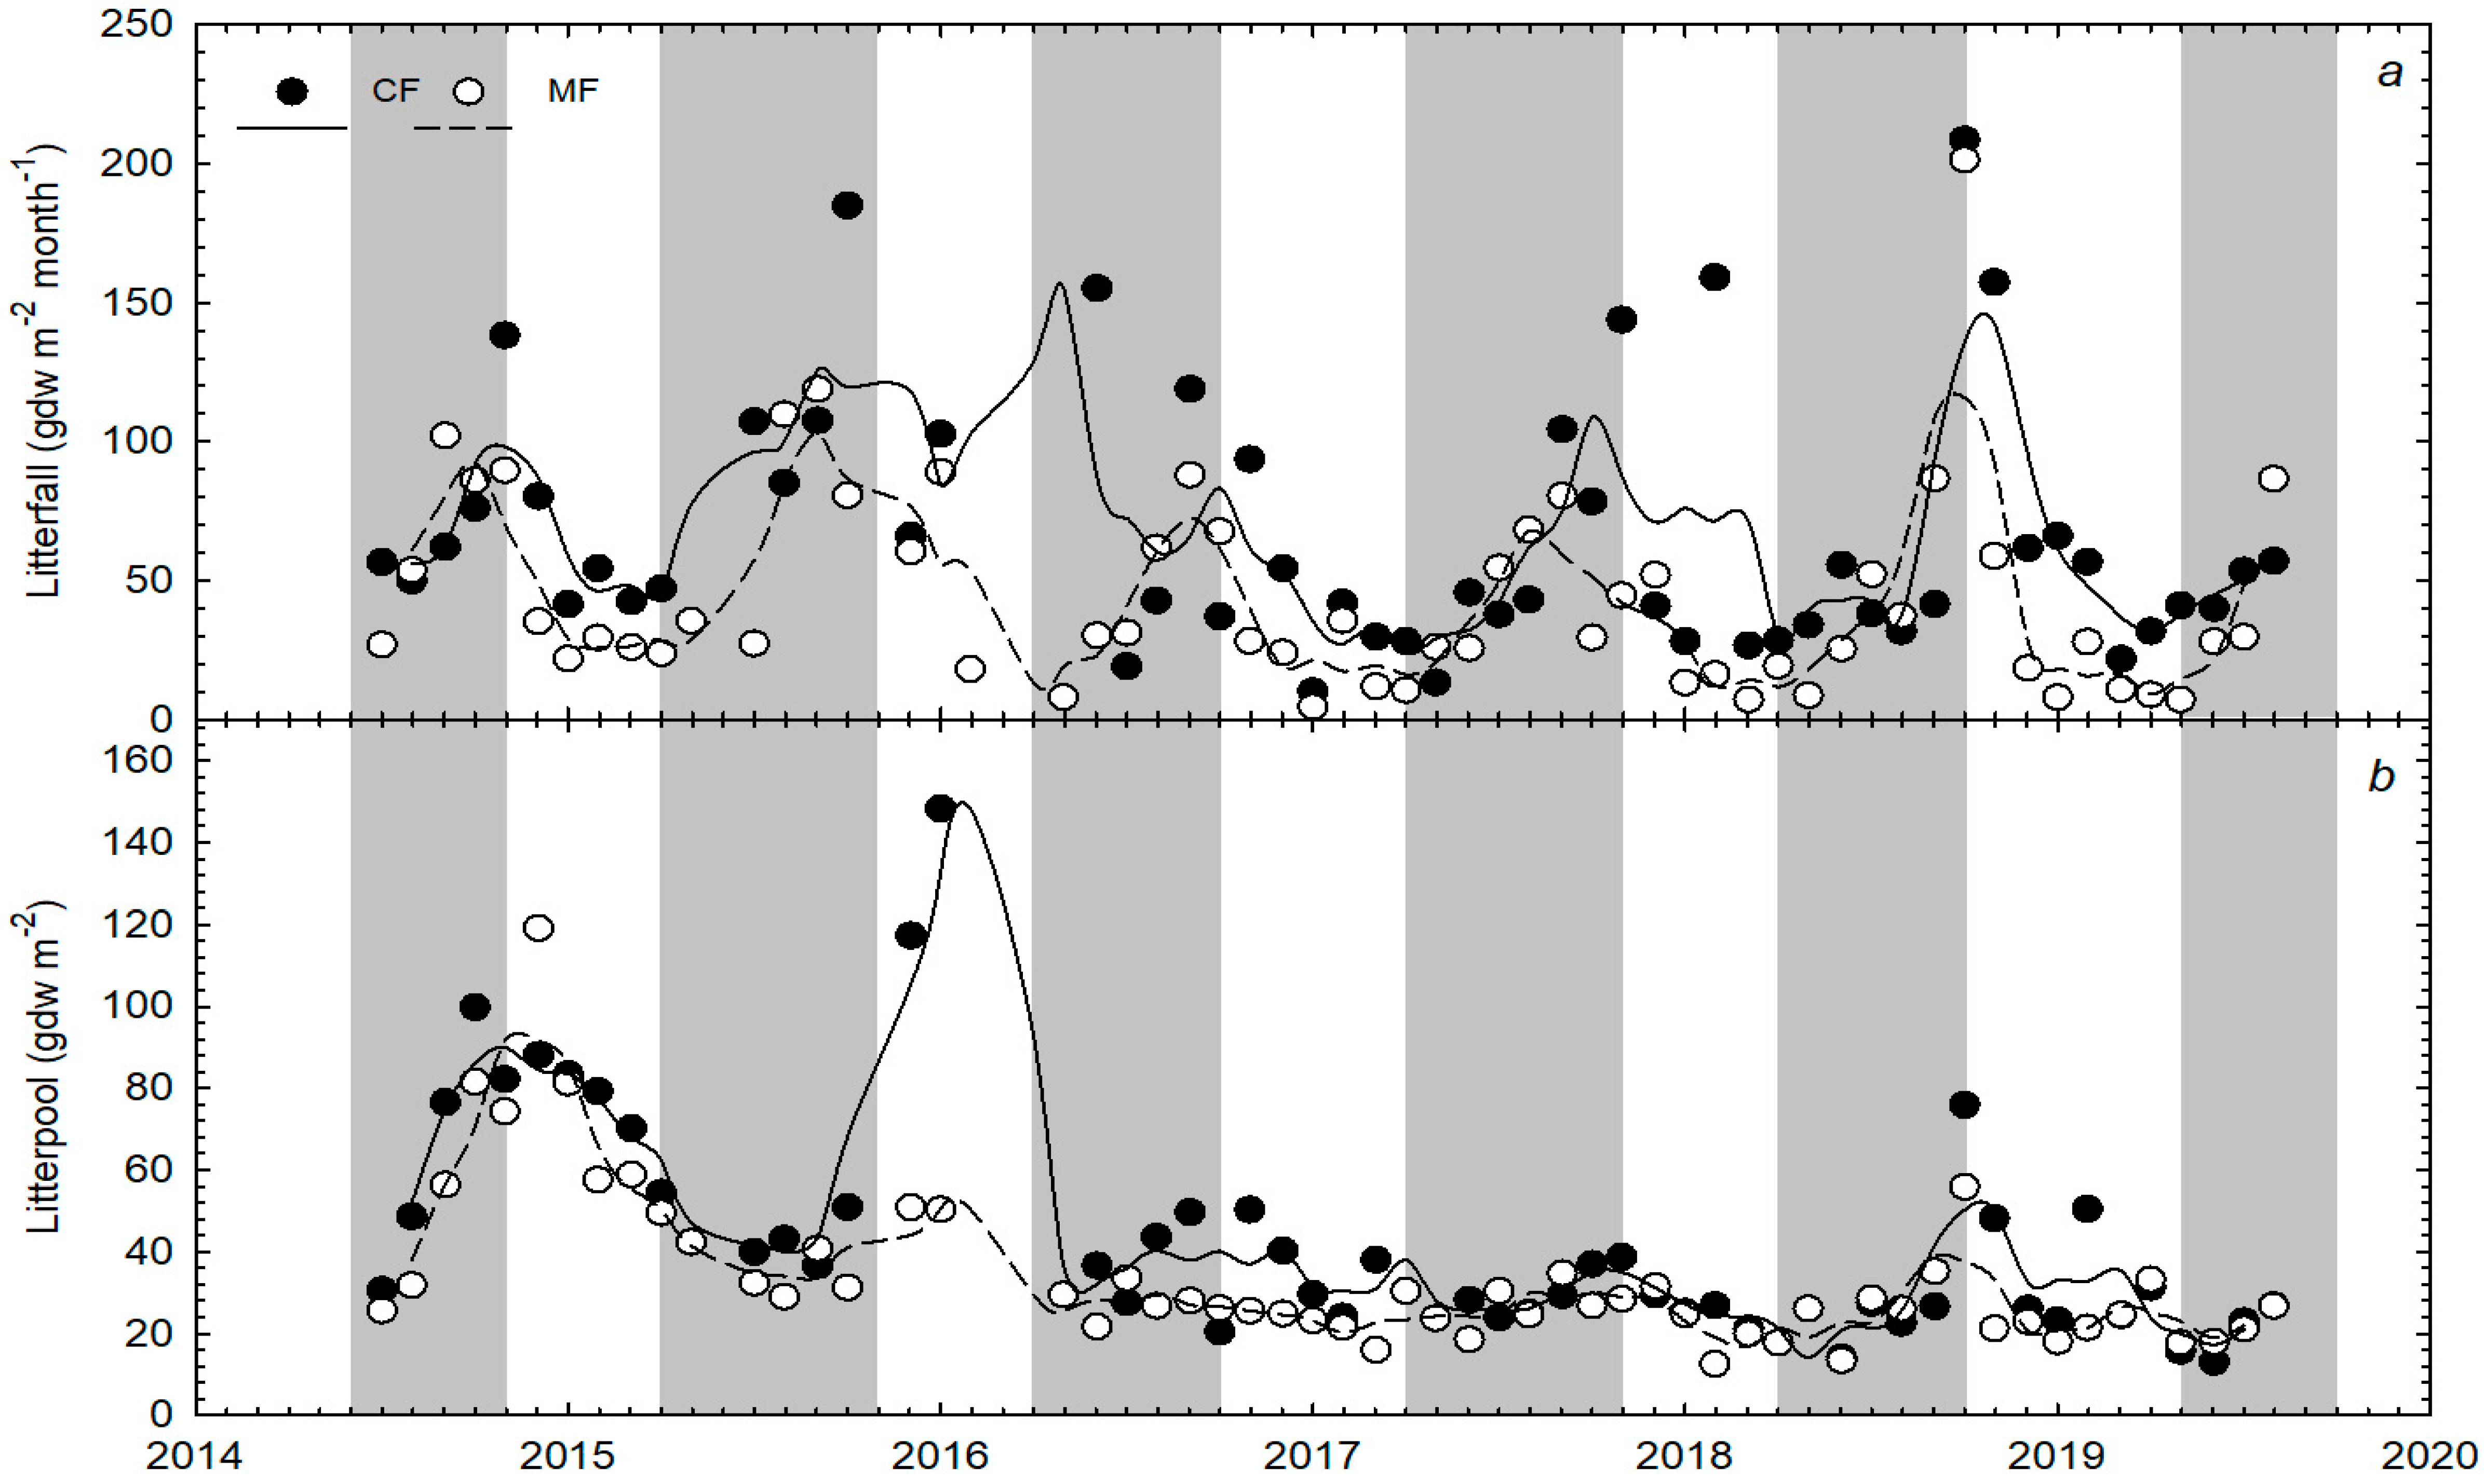
Rates of litter production were highest at the end of the dry season in August–October and lowest in the wet season for both forests (Figure 1a). Litter production was negatively correlated with precipitation; however, the maximum correlation observed for litter production lagged behind precipitation by 1–2 months for the mixed and cerrado forests, respectively (Table 1). Litter inputs also had an effect on the dynamics of the forest floor litter pool, which was highest in October and November and lowest at the end of the wet season in April and May (Figure 1b). As with litter production, the size of the forest floor litter pool was negatively correlated with precipitation, but the maximum correlation was observed when the litter pool size lagged behind precipitation by 3 months (Table 1).
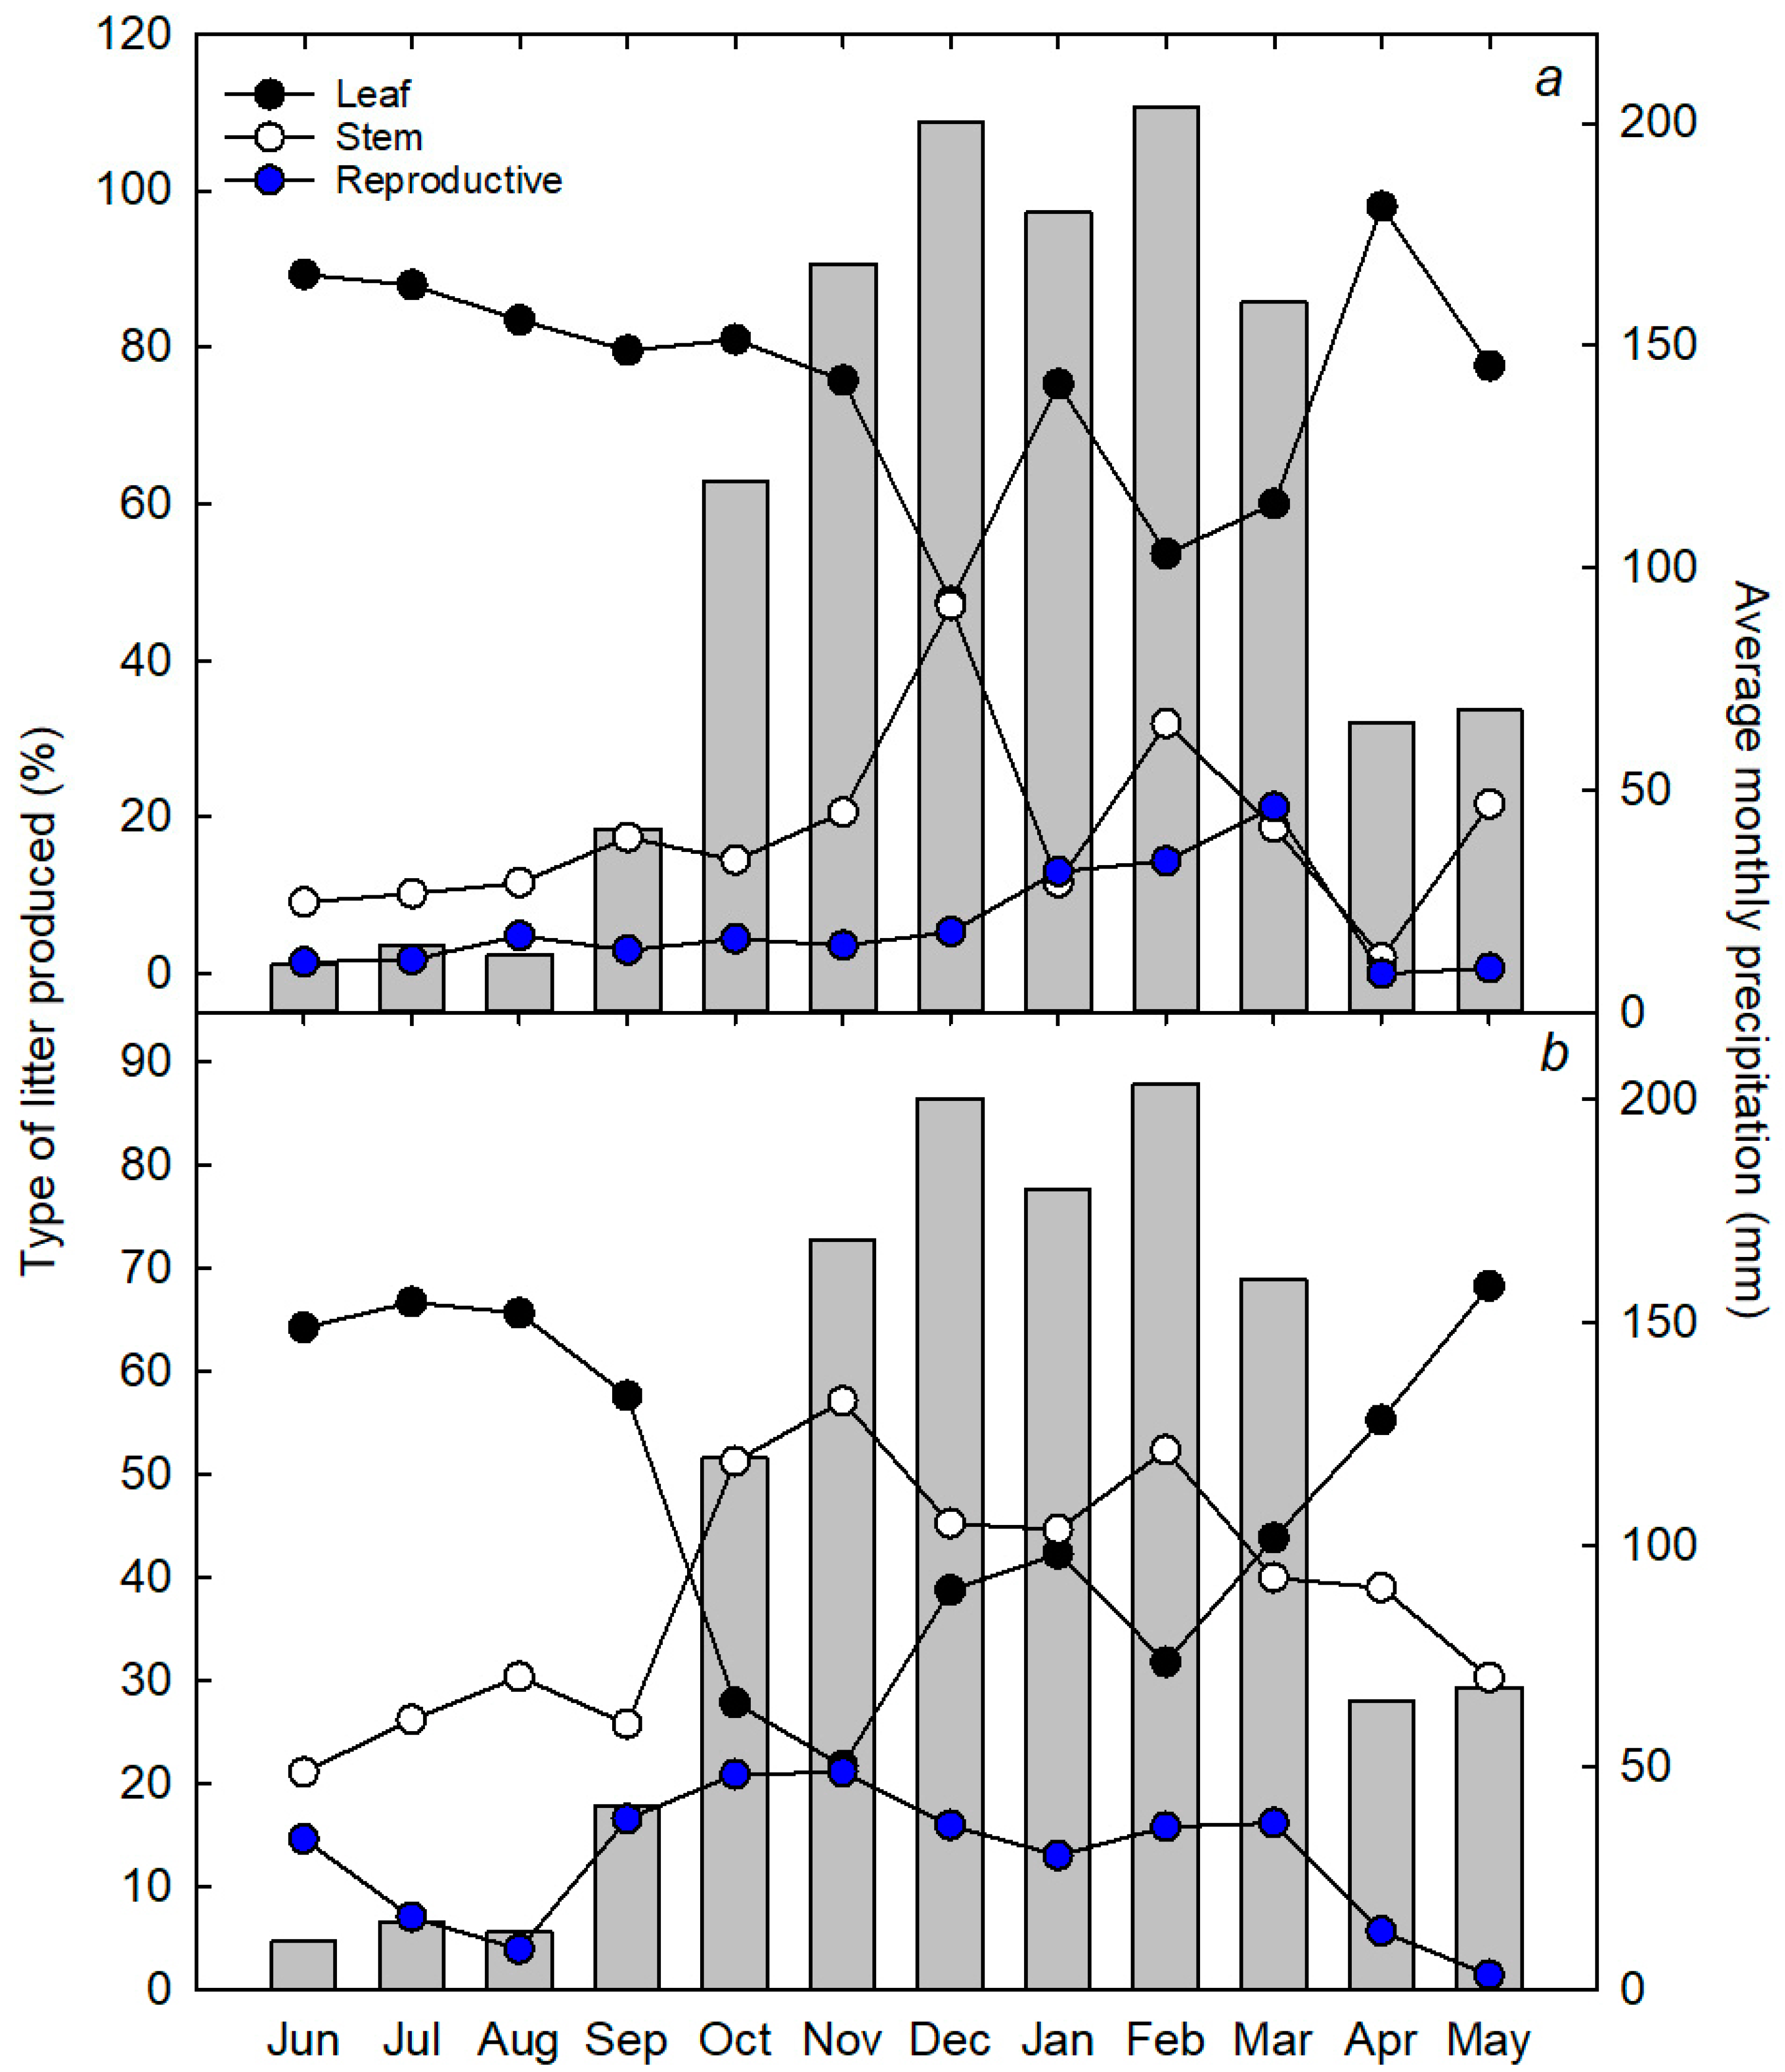
More than 50% of all litter produced in the cerrado forest consisted of leaf litter, followed by stem and reproductive litter (Figure 2a). Leaf litter was the dominant form of litter produced during the dry season (June–September) and during the wet-dry season transition (March–May), while in the wet season, stem litter production either equaled or exceeded leaf litter production (Figure 2b). As a result, leaf litter production was negatively correlated with precipitation, while stem litter production was positively correlated with precipitation (Table 1). Reproductive litter was positively correlated with precipitation for the cerrado forest but not the mixed forest (Table 1) even though reproductive litter production was generally higher in the wet season for both forests (Figure 2). On average, leaf litter accounted for 76% and 49%, stem litter accounted for 18% and 39%, and reproductive litter accounted for 6% and 12% of the total litter produced in the cerrado and mixed forests, respectively.
Monthly patterns of litter production were variable with higher rates of litter production generally observed at the end of the dry season and lower values of litter production observed during the wet season (Figure 3a). The average rates of litter production were higher for the cerrado forest, even though maximum (208 and 201 gdw/m2 for cerrado and mixed forests, respectively) and minimum values (10 and 5 g/m2 for cerrado and mixed forests, respectively) were similar for both forests. Neither forest exhibited a statistically significant trend in monthly litter production over the five-year study period (Figure 3a).
In contrast, the average monthly forest floor litter pool size declined significantly over the study period for both forests (Figure 3b), and on average, litter pool size declined by 10.4 gdw m−2 month−1 for cerrado forests (R2 = 0.35; p < 0.001) and 7.7 gdw m−2 month−1 for mixed forests (R2 = 0.37; p < 0.001). Litter pool sizes were similar for both forests, with the exception of a large peak in pool size in the cerrado forest in December 2015–January 2016, and were on average 20–90 gdw/m2 during the first year of the study period (2014–15) and 20–50 g/m2 during the last year of the study period (2018–19; Figure 3b). Litter pool size tended to increase during the dry season due to an increase in litter inputs, and decline during the wet season as litter inputs declined.

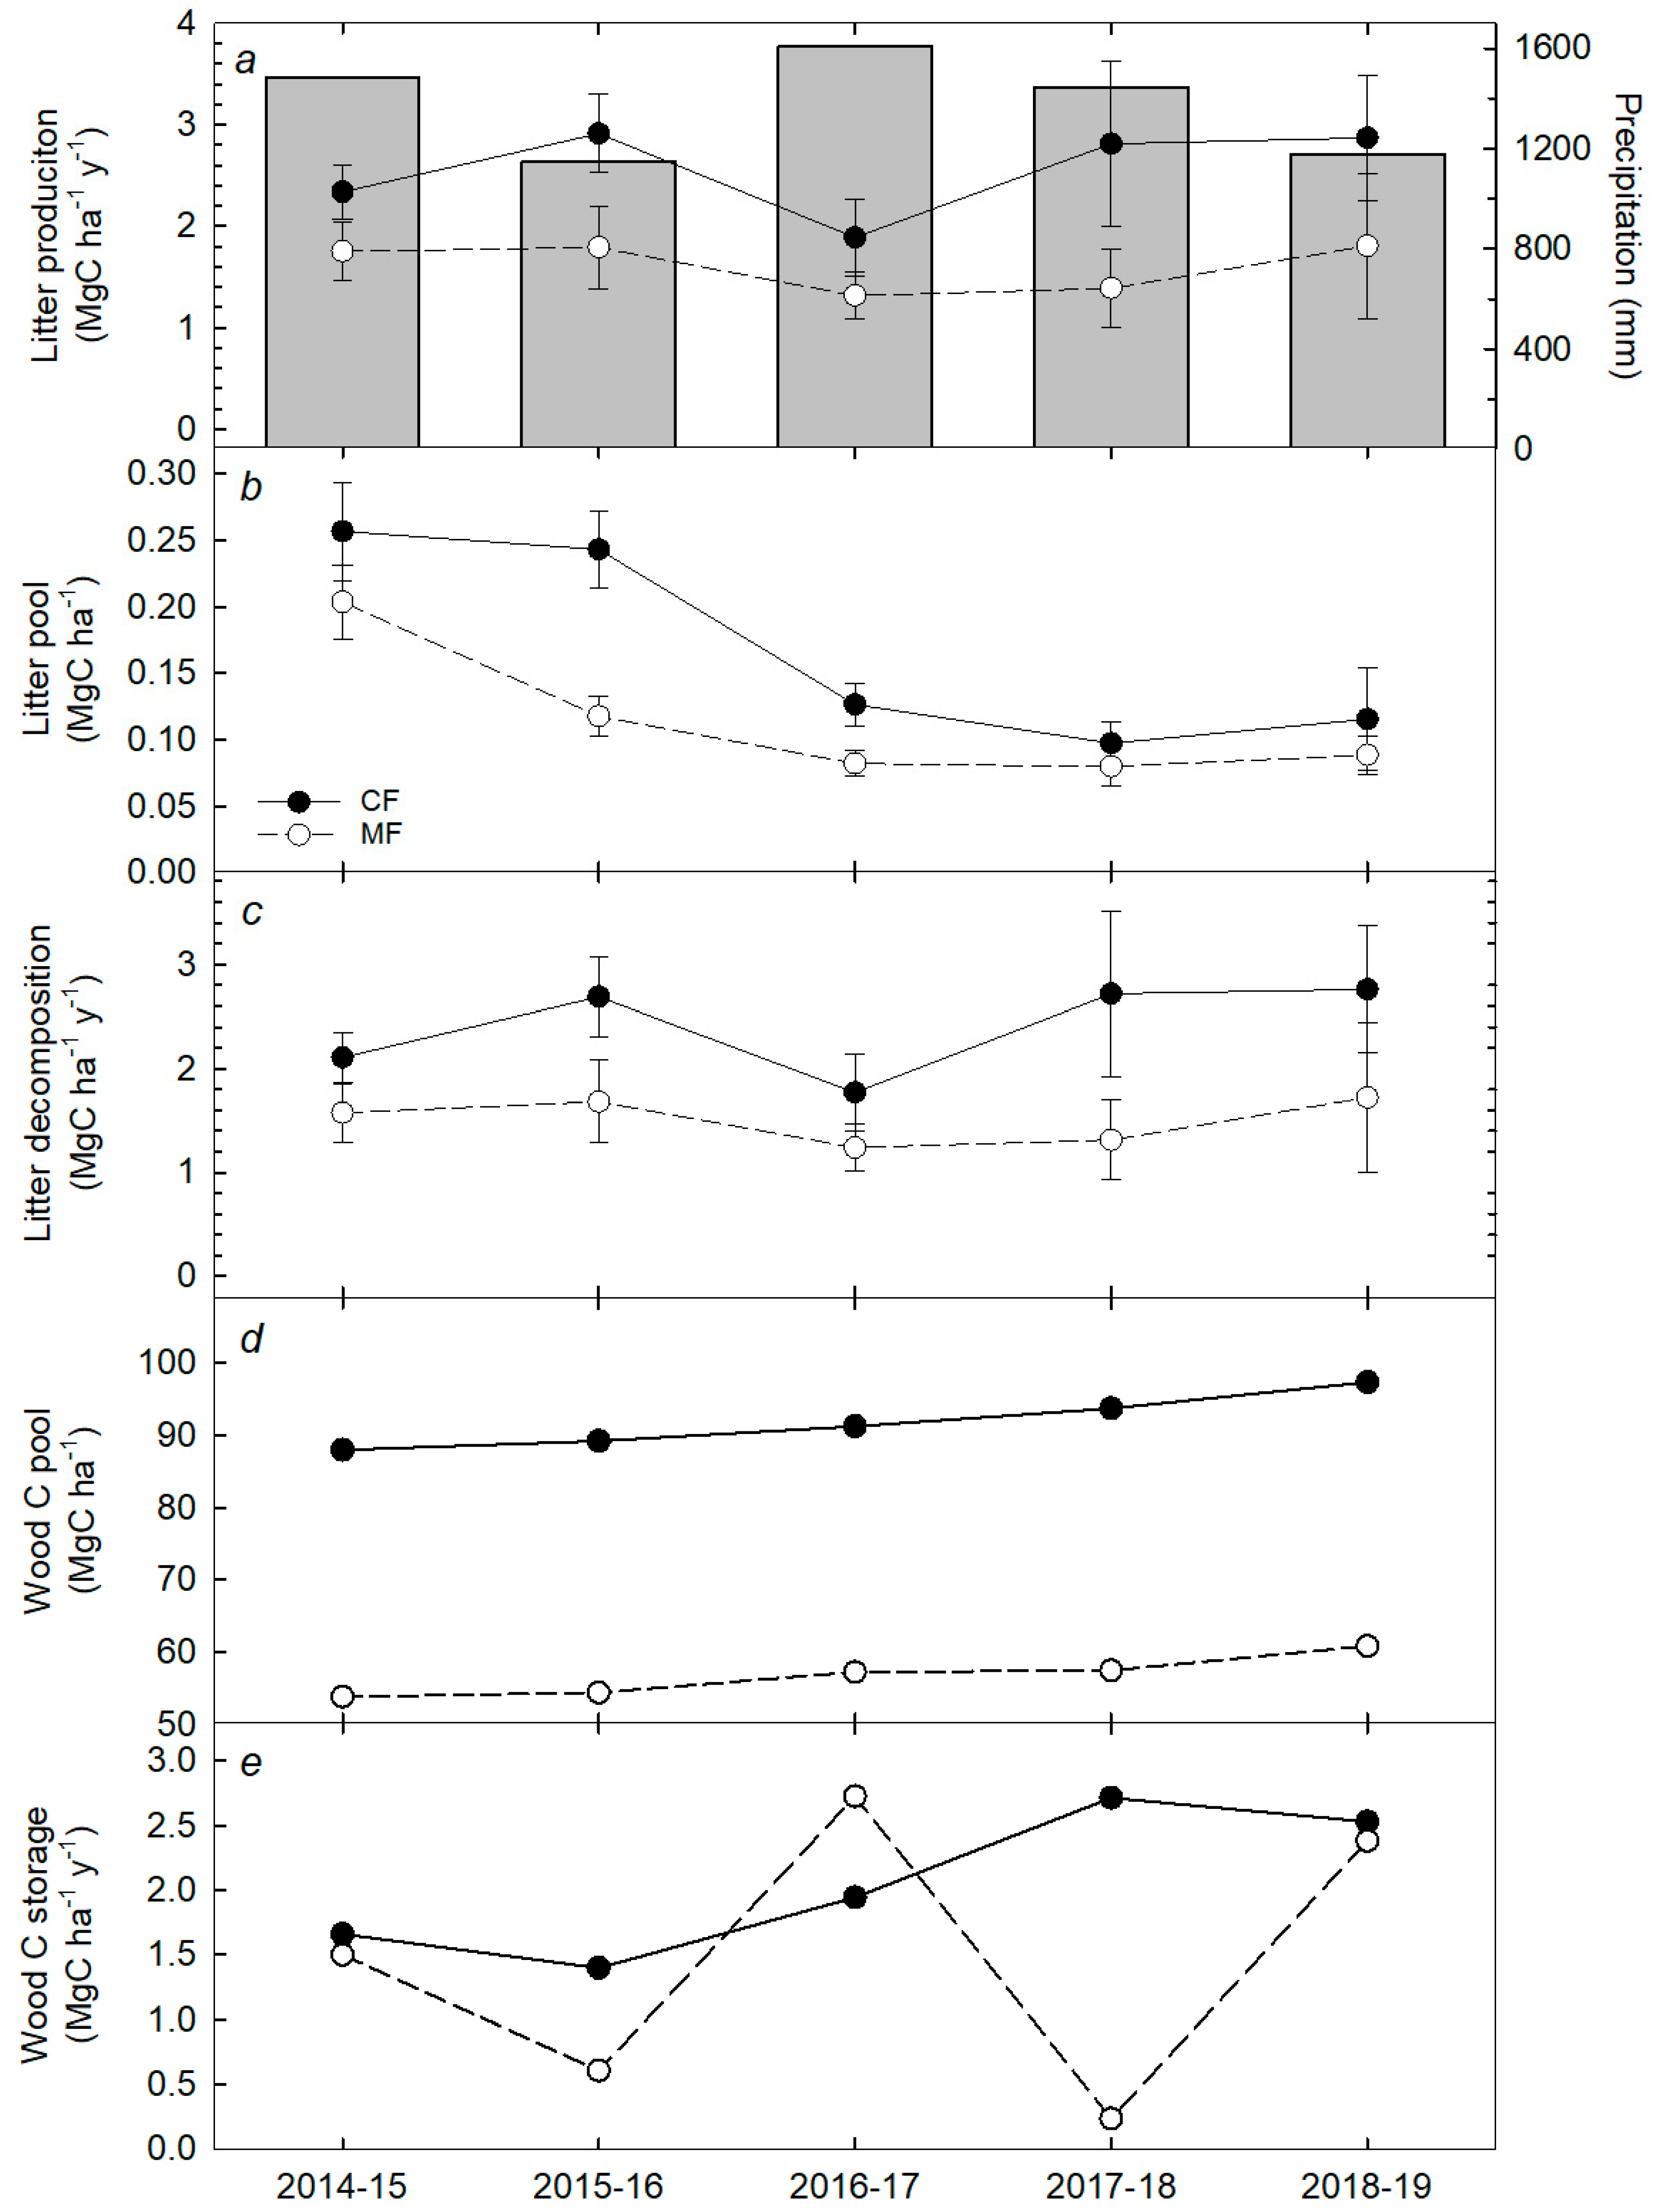
3.2. Annual Rates of Aboveground C Cycling Components

Annual rates of litter production (Figure 4a), litter pool size (Figure 4b), litter decomposition (Figure 4c), and wood C pool size (Figure 4d) were higher for the cerrado forest during the study period. Litter production ranged between 1.9–2.9 MgC ha−1 y−1 for the cerrado forest and 1.3–1.8 MgC ha−1 y−1 for the mixed forest, and was highest in 2015–16 and lowest in 2016–17 for both sites (Figure 4a). Litterpool size varied between 0.26 and 0.20 MgC/ha in 2014–15 for the cerrado and mixed forest, respectively, and declined consistently over time (Figure 4b). Litter decomposition rates varied between 1.8–2.8 MgC ha−1 y−1 for the cerrado forest and 1.2–1.7 MgC ha−1 y−1 for the mixed forest, and temporal patterns were identical to those observed for litter production (Figure 4c). Wood was the largest C aboveground pool, ranging between 88–97 MgC/ha for the cerrado forest and 54–60 MgC/ha for the mixed forest, and wood C pools increased for both forests over the study period (Figure 4d). However, the annual rates of wood C storage were more variable, especially for the mixed forest (Figure 4e). For the cerrado forest, wood C storage increased from a minimum of 1.4 MgC ha−1 y−1 in 2015–16 to a high of 2.7 Mg ha−1 y−1 in 2017–18, while for the mixed forest, wood C storage was 0.2 MgC ha−1 y−1 in 2017–18 and 2.7 MgC ha−1 y−1 in 2016–17 (Figure 4e).
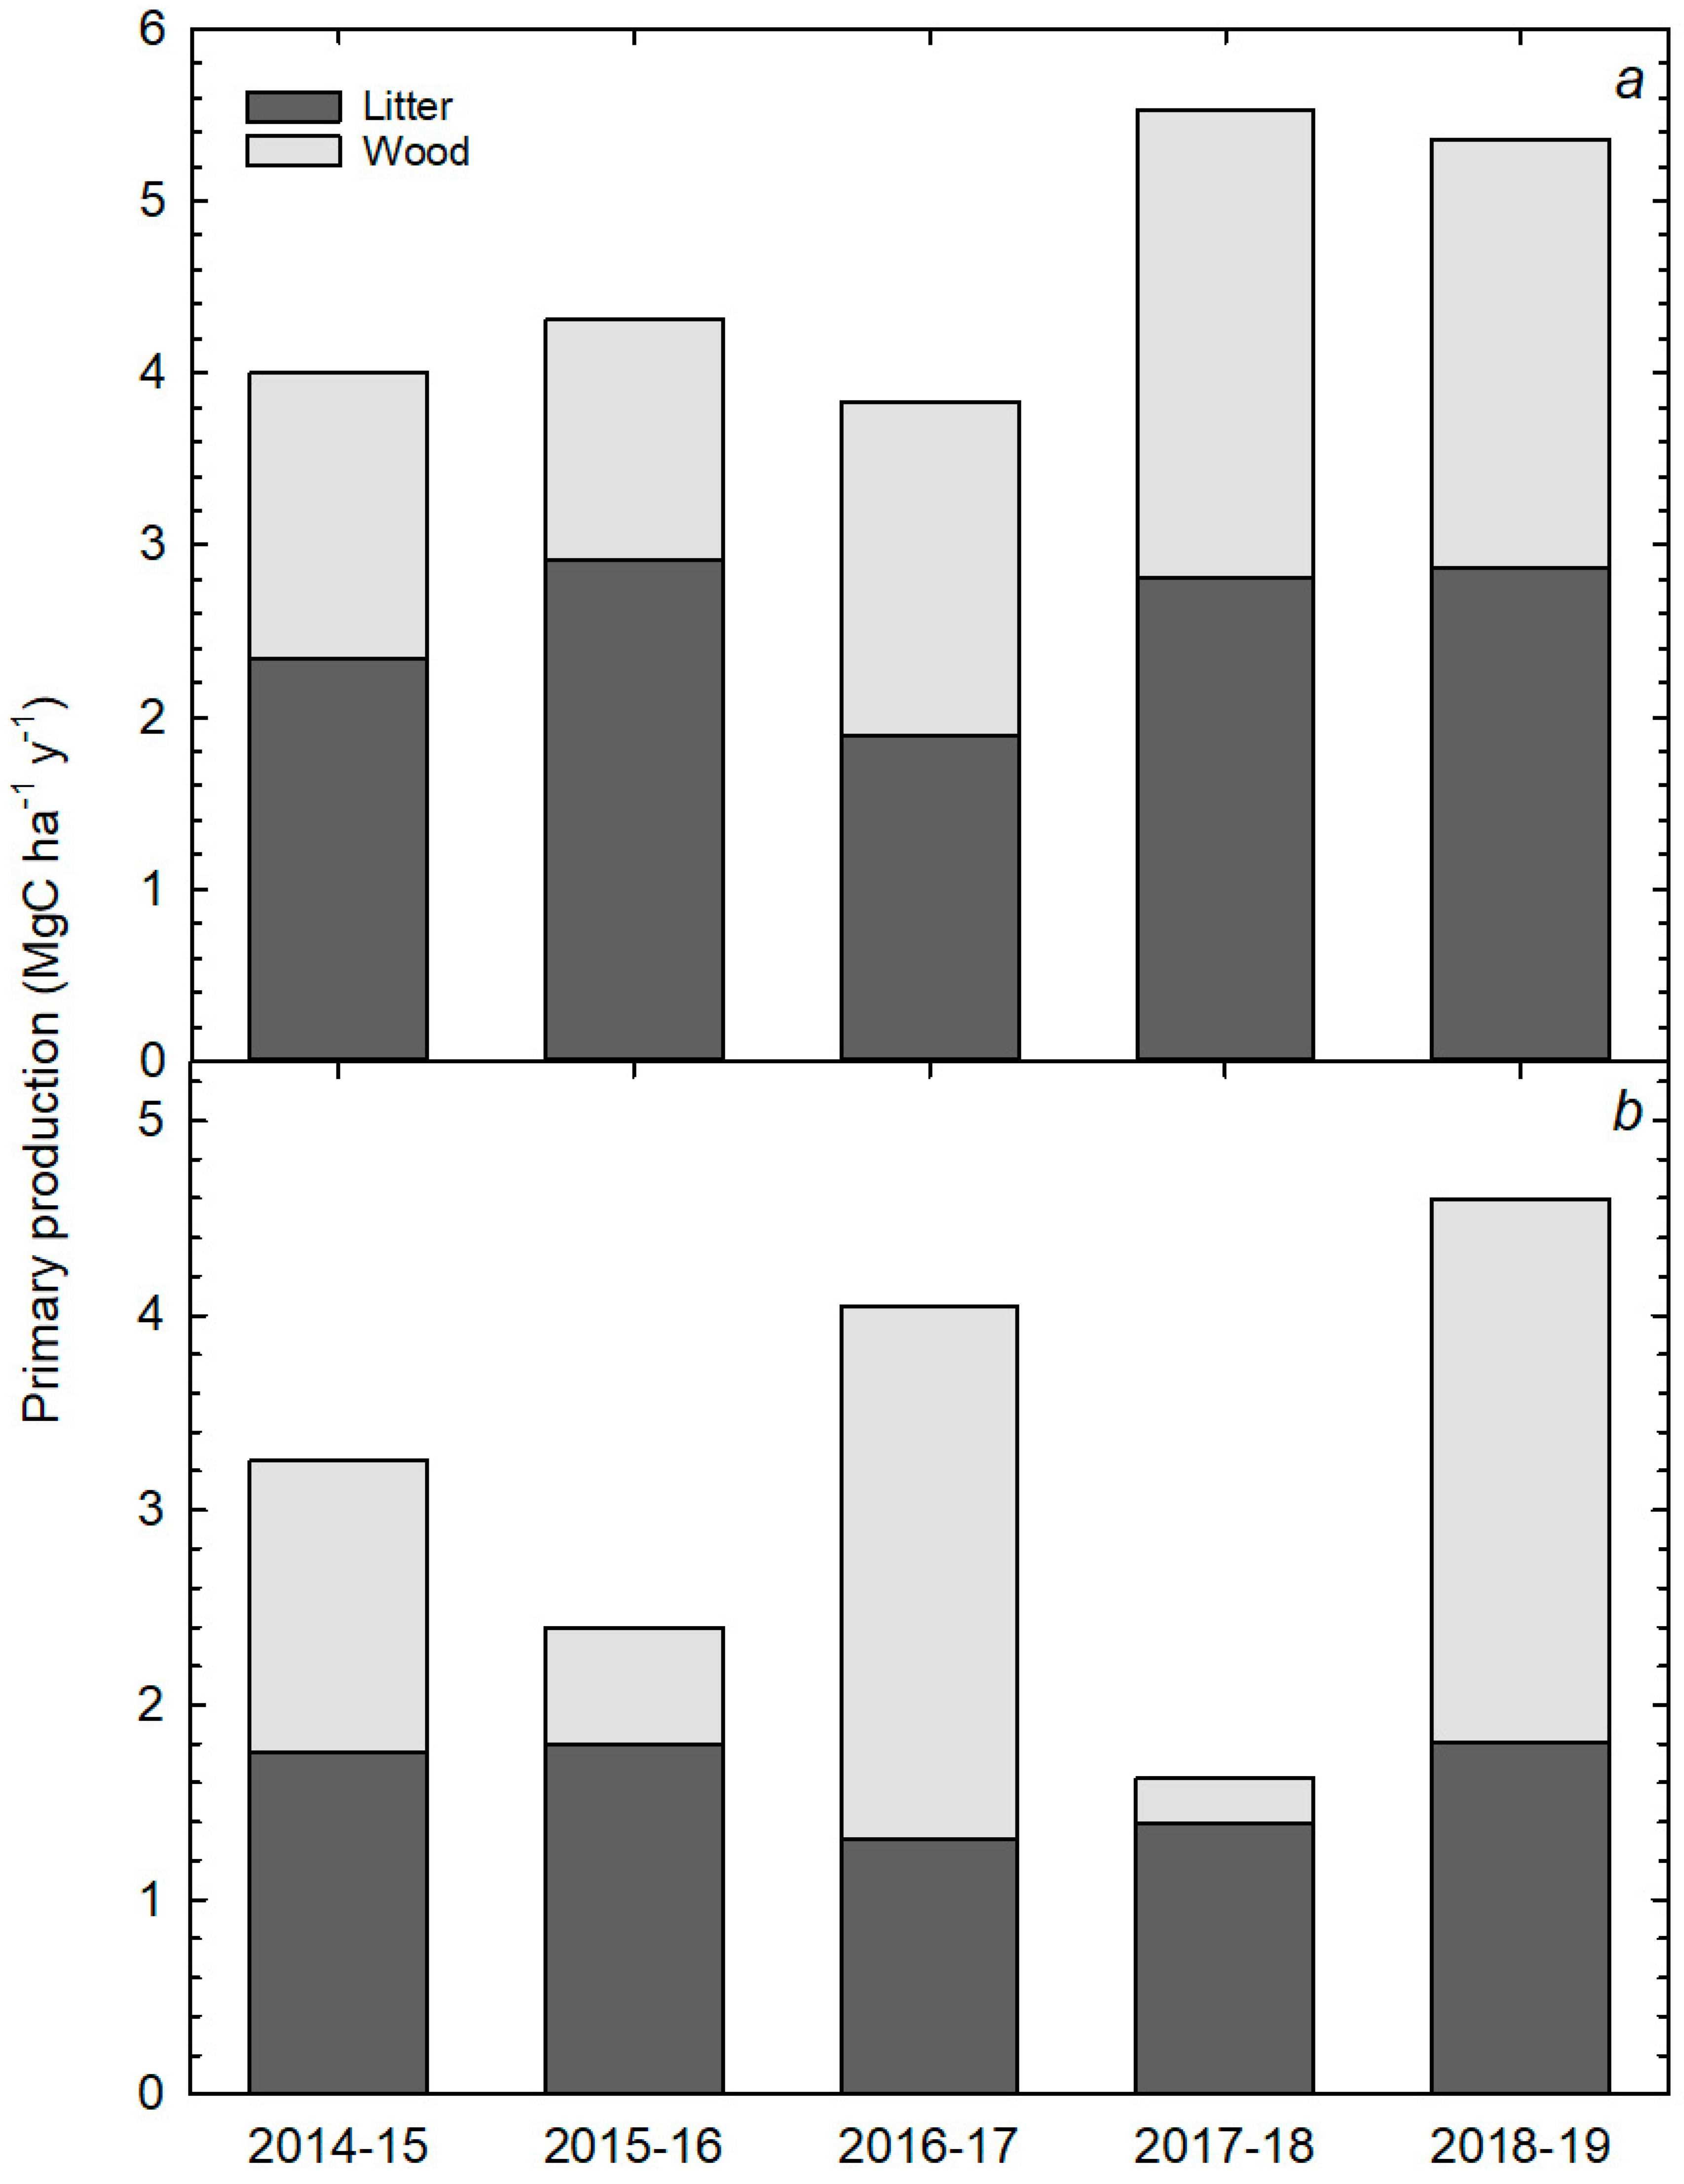
Aboveground net primary production (ANPP), calculated as the sum of the annual wood C storage and litter production, varied between 3.8–5.5 MgC ha−1 y−1 for the cerrado forest (Figure 5a) and 1.6–4.6 MgC ha−1 y−1 for the mixed forest (Figure 5b). The highest rate of ANPP was observed in 2018–19 for both forests, while the lowest rate of ANPP was observed in 2016–17 for the cerrado forest and 2017–18 for the mixed forest. While temporal patterns and rates of ANPP were different for each forest, the percent contribution of litter production and wood C increment to the total ANPP was remarkably similar for both forests: 56% and 43%, respectively (Figure 5).

4. Discussion

4.1. Stand Differences in Aboveground C Cycling and Storage

We hypothesized that rates of ANPP would be higher in the upland mixed forest because the mixed forest had higher nutrient availability and seasonal flooding would limit rates of growth in the cerrado forest. However, our results indicate that the cerrado forest had consistently higher rates of ANPP during the five-year study period, largely because of higher leaf litter production in the cerrado forest, as rates of wood C storage were similar for both forests. The higher litter production is interesting given that average tree density is similar for both forests and leaf area index is higher for the upland forest [21]. However, a review of litter production in Amazonian forests [37] found that leaf litter production was significantly higher in flooded forests, and it is possible that the hyperseasonal nature of the cerrado forest (seasonal flooding followed by seasonal drought) leads to higher leaf abscission and loss. Rates of leaf abscission can increase in response to anoxia that occurs during flooding [23] and during drought that occurs during the dry season [38,39], and it is possible that these seasonal stressors enhance leaf production and turnover. Conversely, it is also possible that annual litter production was underestimated in the mixed forest, because palms, which are abundant in the mixed forest, can trap high amounts of litter in their crowns [37]. However, the mixed forest also had a lower surface litter pool, suggesting that litter inputs were probably lower as well. While not measured, there could also have been differences in coarse woody litter production between the two stands, which would affect estimates of ANPP. Estimates of tree mortality were 4.6%/year for the cerrado forest and 7.9%/year for the mixed forest, suggesting that coarse litter production may have been slightly higher in the mixed forest.
The cerrado forest also had a higher rate of litter decomposition as indicated by mass balance. The higher rates of decomposition in the cerrado forest may occur because flooding increases the rate of leaching from litter, which hastens the initial stages of mass loss [40,41]. In turn, increases in labile C release can increase microbial abundance, diversity, and/or activity, resulting in the priming of microbial metabolism and an increase in litter decomposition [40,42]. Differences in tree species composition also affect litter decomposition because of differences in litter quality such as lignin and/or nutrient content [40,43,44]. Previous research has indicated that trees in the seasonally flooded forest have higher N and P concentrations than in the upland forest [45], suggesting that the cerrado forest litter was more easily decomposed than the mixed forest litter.

4.2. Seasonal Variations in Litter Production

Seasonal variations in litter production and forest floor litter pool size were large and lagged behind seasonal variations in precipitation. In particular, seasonal variations in wet and dry cycles are important drivers of leaf expansion and abscission and reproduction for these and other seasonal forests [34,36]. Our data indicate that the majority of leaf abscission occurs throughout the dry season when water deficits and/or changes in photoperiod accelerate leaf shedding by deciduous and semi-deciduous trees. This period also increases leaf abscission in evergreen trees [34], indicating that water deficits that occur during the dry season, even in areas exposed to seasonal flooding, are strong enough to reduce leaf area in these forests [38,39,46]. However, there also appears to be a secondary peak in January for the cerrado forest, when soil anoxia that develops during the seasonal peak flooding [42] can increase leaf abscission [23]. Stem litter production increased during the wet season when periodically strong winds from storms increase stem damage and breakage. Reproductive litter production was also higher during the wet season, when increases in water availability promote stem growth and reproduction [34,36,47].

4.3. Annual Variations in Aboveground C Cycling and Storage Components

None of the components of aboveground C storage were correlated with annual variations in annual rainfall, which is in contrast to the reports in [5] for a larger set of cerrado forests and woodlands in the Pantanal and the Cuiaba Basin of southern Mato Grosso, Brazil. This discrepancy is likely to be because the hydrology of the northern Pantanal is driven more by the stage height of the Cuiaba River than by local precipitation [48]. However, one of the most striking trends was the consistent decline in the forest floor litter pool during the study period. This trend is hard to interpret based on the inconsistent temporal trend in litter production and the general increase in wood C storage observed over the study period. Furthermore, trends in forest floor pool size were unrelated to climate variations (precipitation, temperature) over the study period (data not shown). One possible explanation is that there was some event prior to the study period that caused a large increase in the forest floor litter pool, and that the pool was slowly readjusting over the study period. Such large-scale legacies have been reported from other Amazonian tropical forests (e.g., see [35,49]) and are often due to severe climate anomalies such as El Niño, which cause widespread tree mortality in Amazonian forests and woodlands. Severe El Niño events occurred in 2005 and 2015 [50], and these events caused large declines in tree growth and C storage for much of the Amazon Basin [51], especially for forests and woodlands in the southern basin [5,41]. Estimates of tree mortality during the 2015 El Niño were as a high as 18% for the mixed forest but only 5% for the cerrado forest. Thus, the warm/dry conditions affected the upland mixed forest more than the cerrado forest, presumably because the cerrado forest had a higher, more stable water table throughout the El Niño period than the mixed forest [26,42]. Given that both sites had already experienced a decline in the surface litter pool prior to the 2015 El Niño, whatever event caused the high initial surface litter pool happened prior to the study period and was presumably large enough to affect both sites similarly. Clearly, this interpretation is speculative, and it is unclear why both sites showed such consistent decline in the forest floor litter pool with the data in hand.

4.4. Comparisons to Other Studies

The average (±sd) aboveground ANPP during the five-year study period was 4.6 ± 0.8 MgC ha−1 y−1 for the seasonally flooded cerrado forest and 3.2 ± 1.2 MgC ha−1 y−1 for the upland mixed forest (Figure 5). According to a review [52], seasonally flooded forests of the Amazon Basin have an average (±sd) ANPP of 4.2 ± 1.8 MgC ha−1 y−1, which is comparable to the estimate reported here. Additionally, [5,30] reported values of woody C storage of between 2.6–2.9 MgC ha−1 y−1 for seasonally flooded forests in the Pantanal, which would amount to an ANPP of 4.3–4.9 MgC ha−1 y−1 if adjusted for the contribution of litter production to ANPP (ca. 56%; Figure 5). This estimated contribution of litter production to the overall ANPP is similar to that reported for other tropical forests [2]. Aboveground C stocks were estimated to be between 58 MgC/ha for the mixed forest and 92 MgC/ha for the cerrado forest, which is similar to that reported for other Pantanal forests [30]. Finally, [46] reported rates of litter production to be 7.5–10.3 Mg ha−1 y−1 on a dry mass basis, or 2.6–3.6 MgC ha−1 y−1 (assuming a mean litter C concentration of 35%) for similar forests in the Pantanal, which is comparable to the cerrado forest but higher than our estimates for the mixed forest (Figure 4a). Thus, while data are generally limited for seasonally flooded tropical forests [52], our results appear to be comparable to those reported in the literature.

5. Conclusions

Aboveground net primary production (ANPP) varied between 3.8–5.5 MgC ha−1 y−1 for a seasonally flooded forest and 1.6–4.6 MgC ha−1 y−1 for an upland forest located in the northern Pantanal region of Brazil measured over a five-year period. Most of the ANPP was due to litter production (56%) while the remainder was from wood C storage. Annual variations in ANPP, or any of the measured aboveground storage components, were not correlated with annual variations in precipitation, presumably because the hydrology of these sites is driven more by flooding of the Cuiaba River than by local precipitation. However, consistent declines in the forest floor litter mass observed at both sites suggest the possibility of legacy effects on aboveground C storage from a disturbance prior to our sampling campaign. Seasonal variation in rainfall exerted an important control on litter production dynamics, with leaf litter production triggered by a decline in rainfall during the dry season and stem and reproductive litter production triggered by an increase in rainfall during the wet season. While there are few studies of seasonally flooded tropical forests, our data compare well to previous studies and suggest that seasonally flooded and upland forests of the northern Pantanal can act as appreciable aboveground C sinks.

Author Contributions

Conceptualization, O.B.P.J. and G.L.V.; methodology, O.B.P.J. and G.L.V.; formal analysis, O.B.P.J., A.C.A.M., and G.L.V.; investigation, O.B.P.J., A.C.A.M., and G.L.V.; resources, O.B.P.J. and G.L.V.; data curation, O.B.P.J., A.C.A.M., and G.L.V.; writing—original draft preparation, O.B.P.J., A.C.A.M., and G.L.V.; writing—review and editing, O.B.P.J., A.C.A.M., and G.L.V.; project administration, O.B.P.J. and G.L.V.; funding acquisition, O.B.P.J. and G.L.V. All authors have read and agreed to the published version of the manuscript.

Funding

This work was funded by in part by the Coordination of Improvement of Higher Education Personnel (CAPES) Science without Borders Program (n. 401908/2012-7), a productivity scholarship funded by the National Council for Scientific and Technological Development and the Ministry of Science and Technology (CNPq n. 304575/2017-8), the National Science Foundation-Office of International Sciences and Engineering (NSF-OISE 0968245), the Coordenação de Aperfeiçoamento de Pessoal de Nível Superior-Brasil (CAPES)-Finance Code 001, and the FUNADESP-Fundação Nacional de Desenvolvimento do Ensino Superior Particular.

Acknowledgments

We thank the Federal University of Mato Grosso (UFMT-PGFA) and University of Cuiabá (UNIC) for laboratory and office space and the use of a field vehicle, SESC-Pantanal and Clovis Miranda for access to the field sites and logistical support, and the Xomanoflux group for the field support.

Conflicts of Interest

The authors declare no conflict of interest. The funders had no role in the design of the study; in the collection, analyses, or interpretation of data; in the writing of the manuscript, or in the decision to publish the results.

References

  1. Schlesinger, W.H.; Bernhardt, E.S. Biogeochemistry: An Analysis of Global Change, 3rd ed.; Academic Press: Waltham, MA, USA, 2013; p. 668. [Google Scholar]
  2. Clark, D.A.; Clark, D.B.; Oberbauer, S.F. Field-quantified responses of tropical rainforest aboveground productivity to increasing CO2 and climatic stress, 1997–2009. J. Geophys. R.-Biogeosci. 2013, 118, 783–794. [Google Scholar] [CrossRef]
  3. Cleveland, C.C.; Townsend, A.R.; Taylor, P.; Alvarez-Clare, S.; Bustamante, M.M.C.; Chuyong, G.; Dobrowski, S.Z.; Grierson, P.; Harms, K.E.; Houlton, B.Z.; et al. Relationships among net primary productivity, nutrients and climate in tropical rain forest: A pan-tropical analysis. Ecol. Lett. 2011, 14, 1313–1317. [Google Scholar] [CrossRef]
  4. Quesada, C.A.; Phillips, O.L.; Schwarz, M.; Czimczik, C.I.; Baker, T.R.; Patino, S.; Fyllas, N.M.; Hodnett, M.G.; Herrera, R.; Almeida, S.; et al. Basin-wide variations in Amazon forest structure and function are mediated by both soils and climate. Biogeosciences 2012, 9, 2203–2246. [Google Scholar] [CrossRef] [Green Version]
  5. Vourlitis, G.L.; Zappia, A.; Pinto, O.B., Jr.; Arruda, P.H.Z.; Santanna, F.B.; Dalmagro, H.J.; Lobo, F.A.; Nogueira, J.S. Spatial and temporal variations in aboveground woody carbon storage for cerrado forests and woodlands of Mato Grosso, Brazil. J. Geophys. R.-Biogeosci. 2019, 124. [Google Scholar] [CrossRef]
  6. Miranda, S.C.; Bustamante, M.; Palace, M.; Hagen, S.; Keller, M.; Ferreira, L.G. Regional variations in biomass distribution in Brazilian savanna woodland. Biotropica 2014, 46, 125–138. [Google Scholar] [CrossRef] [Green Version]
  7. Vourlitis, G.L.; Lobo, F.A.; Pinto, O.B., Jr.; Dalmagro, H.J.; Arruda, P.H.Z.; Nogueira, J.S. Variations in aboveground vegetation structure along a nutrient availability gradient in the Brazilian Pantanal. Plant Soil 2015, 389, 307–321. [Google Scholar] [CrossRef]
  8. Hoffmann, W.A.; Geiger, E.L.; Gotsch, S.G.; Rossatto, D.R.; Silva, L.C.R.; Lau, O.L.; Haridasan, M.; Franco, A.C. Ecological thresholds at the savanna-forest boundary: How plant traits, resources and fire govern the distribution of tropical biomes. Ecol. Lett. 2012, 15, 759–768. [Google Scholar] [CrossRef] [PubMed]
  9. Silva, L.C.R.; Hoffmann, W.A.; Rossatto, D.R.; Haridasan, M.; Franco, A.C.; Horwath, W.R. Can savannas become forests? A coupled analysis of nutrient stocks and fire thresholds in central Brazil. Plant Soil 2013, 373, 829–842. [Google Scholar] [CrossRef]
  10. Lopes, A.S.; Cox, F.R. Cerrado vegetation in Brazil: An edaphic gradient. Agron. J. 1977, 69, 828–831. [Google Scholar] [CrossRef]
  11. Junk, W.J.; Nunes da Cunha, C.; Wantzen, K.M.; Petermann, P.; Strussmann, C.; Marques, M.I.; Adis, J. Biodiversity and its conservation in the Pantanal of Mato Grosso, Brazil. Aquat. Sci. 2006, 68, 278–309. [Google Scholar] [CrossRef]
  12. Nunes da Cunha, C.; Junk, W.; Leitão-Filho, H. Woody vegetation in the Pantanal of Mato Grosso, Brazil: A preliminary typology. Amazoniana 2007, 19, 159–184. [Google Scholar]
  13. Ribeiro, J.F.; Walter, B.M.T. As Principais Fitofisionomias do Bioma Cerrado. In Cerrado Ecologia e Flora; Sano, S.M., Pedrosa de Almeida, S., Ribeiro, J.F., Eds.; Emprapa Informacao Technologica, Ministerio da Agricultura, Pecuaria e Abastecimento, Brasilia: Districto Federal, Brasil, 2008; Volume 1, pp. 151–212. [Google Scholar]
  14. Pott, A.; Oliveiraa, A.K.M.; Damasceno-Junior, G.A.; Silva, J.S.V. Plant diversity of the Pantanal wetland. Brazil J. Biol. 2011, 71, 265–273. [Google Scholar] [CrossRef] [PubMed]
  15. Cardoso, E.L.; Santos, S.A.; Urbanetz, C.; Filho, A.C.; Naime, U.J.; Silva, M.L.N.; Curi, N. Relação entre solos e unidades da paisagem no ecossistema Pantanal. Pesq. Agropec. Bras. 2016, 51, 1231–1240. [Google Scholar] [CrossRef]
  16. Boni, P.V.; Gradella, F.D.S.; Decco, H.F. Comparação granulométrica com vistas para o entendimento sedimentar em áreas úmidas no Pantanal da Nhecolândia-MS. Per. Elet. Fórum Amb. Alta Paulista 2016, 12, 2. [Google Scholar] [CrossRef] [Green Version]
  17. Dalmagro, H.J.; Lathuillière, M.J.; Vourlitis, G.L.; Campos, R.C.; Pinto, O.B., Jr.; Johnson, M.S.; Ortiz, C.E.R.; Couto, E.G. Soil oxidation-reduction potential and its impacts on plant physiology in seasonally inundated soils of the Brazilian Pantanal. J. Veg. Sci. 2016, 27, 568–577. [Google Scholar] [CrossRef]
  18. Fantin-Cruz, I.; Girard, P.; Zeilhofer, P.; Collischonn, W.; Nunes Da Cunha, C. Unidades fitofisionômicas em mesoescala no Pantanal Norte e suas relações com a geomorfologia. Biota Neotropica 2010, 10, 31–38. [Google Scholar] [CrossRef]
  19. Nunes da Cunha, C.; Junk, W.J. Distribution of woody plant communities along the flood gradient in the Pantanal of Pocone, Mato Grosso, Brazil. Int. J. Ecol. Environ. Sci. 2001, 27, 63–70. [Google Scholar]
  20. Pott, A.; Pott, V.J. Plantas do Pantanal; Empresa Brasileira de Pesquisa, Agropecuaria, Centro de Pesquisa Agropecuaria do Pantanal: Corumba, MS, Brasil, 1994; p. 319. [Google Scholar]
  21. Vourlitis, G.L.; Hentz, C.S.; Pinto, O.B., Jr.; Carneiro, E.; Nogueira, J.S. Soil N, P, and C dynamics of upland and seasonally flooded forests of the Brazilian Pantanal. Glob. Ecol. Conserv. 2017, 12, 227–240. [Google Scholar] [CrossRef]
  22. Pinto Junior, O.B.; Vourlitis, G.L.; Carneiro, E.M.; Dias, M.D.F.; Hentz, C.; Nogueira, J.D.S. Interactions between Vegetation, hydrology, and litter inputs on decomposition and soil CO2 efflux of tropical forests in the Brazilian Pantanal. Forests 2018, 9, 281. [Google Scholar] [CrossRef] [Green Version]
  23. Kozlowski, T.T. Responses of woody plants to flooding and salinity. Tree Phys. 1997, 17, 490. [Google Scholar] [CrossRef]
  24. Nunes da Cunha, C.; Junk, W. Year-to-year changes in water level drive the invasion of Vochysia divergens in Pantanal grasslands. Appl. Veg. Sci. 2004, 7, 103–110. [Google Scholar]
  25. Biudes, M.S.; Machado, N.G.; Danelichen, V.H.M.; Souza, M.C.; Vourlitis, G.L.; Nogueira, J.S. Ground and remote sensing-based measurements of leaf area index in a transitional forest and seasonal flooded forest in Brazil. Int. J. Biomet. 2013. [Google Scholar] [CrossRef] [PubMed]
  26. Lathuillière, M.J.; Pinto, O.B., Jr.; Johnson, M.S.; Jassal, R.S.; Dalmagro, H.J.; Leite, N.K.; Speratti, A.B.; Krampe, D.; Couto, E.G. Soil CO2 concentrations and efflux dynamics of a tree island in the Pantanal wetland. J. Geophys. Res. Biogeosci. 2017, 122, 2154–2169. [Google Scholar] [CrossRef]
  27. Couto, E.G.; Oliveira, V.A. The Soil Diversity of the Pantanal. In The Pantanal: Ecology, Biodiversity, and Sustainable Management of a Large Neotropical Seasonal Wetland; Junk, W.J., da Silva, C.J., Nunes da Cunha, C., Wantzen, K.M., Eds.; Pensoft Publishers: Sofia-Moscow, Bulgaria, 2011; pp. 71–102. [Google Scholar]
  28. Marthews, T.R.; Metcalfe, D.; Malhi, Y.; Phillips, O.; Huaraca Huasco, W.; Riutta, T.; Ruiz Jaén, M.; Girardin, C.; Urrutia, R.; Butt, N.; et al. Measuring Tropical Forest Carbon Allocation and Cycling: A RAINFOR-GEM Field Manual for Intensive Census Plots (v2.2); Global Ecosystems Monitoring Network. 2012. Available online: http://gem.tropicalforests.ox.ac.uk/ (accessed on 29 September 2014).
  29. Chave, J.; Rejou-Mechain, M.; Burquez, A.; Chidumayo, E.; Colgan, M.S.; Deltiti, W.B.C.; Duque, A.; Eid, T.; Fearnside, P.M.; Goodman, R.C.; et al. Improved allometric models to estimate the aboveground biomass of tropical trees. Glob. Chang. Biol. 2014, 20, 3177–3190. [Google Scholar] [CrossRef] [PubMed]
  30. Schöngart, J.; Arieira, J.; Felfili Fortes, C.; de Arruda, E.C.; Nunes da Cunha, C.N. Age-related and stand-wise estimates of carbon stocks and sequestration in the aboveground coarse wood biomass of wetland forests in the northern Pantanal, Brazil. Biogeoscinces 2011, 8, 3407–3421. [Google Scholar] [CrossRef] [Green Version]
  31. del Valle, J.I.; Guarin, J.R.; Sierra, C.A. Unambiguous and low-cost determination of growth rates and ages of tropical trees and palms. Radiocarbon 2014, 56, 39–52. [Google Scholar] [CrossRef]
  32. Olsen, J.S. Energy Storage and the Balance of Producers and Decomposers in Ecological Systems. Ecology 1963, 44, 322–331. [Google Scholar] [CrossRef] [Green Version]
  33. Clark, D.A.; Brown, S.B.; Kicklighter, D.W.; Chambers, J.Q.; Thomlinson, J.R.; Ni, J. Measuring net primary production in forests: Concepts and field methods. Ecol. Appl. 2001, 11, 356–370. [Google Scholar] [CrossRef]
  34. Dalmolin, Â.C.; Lobo, F.A.; Vourlitis, G.; Silva, P.R.; Dalmagro, P.R.; Antunes, M.Z., Jr.; Ortíz, C.E.R. Is the dry season an important driver of phenology and growth for two Brazilian savanna tree species with contrasting leaf habits? Plant Ecol. 2015, 216, 407–417. [Google Scholar] [CrossRef]
  35. Keller, M.; Alencar, A.; Asner, G.P.; Braswell, B.; Bustamante, M.; Davidson, E.; Feldpausch, T.; Fernandes, E.; Goulden, M.; Kabat, P.; et al. Ecological Research in the Large Scale Biosphere Atmosphere Experiment in Amazonia (LBA): Early Results. Ecol. Appl. 2004, 14, S3–S16. [Google Scholar] [CrossRef] [Green Version]
  36. Sanches, L.; Valentini, C.M.A.; Pinto, O.B., Jr.; Nogueira, J.S.; Vourlitis, G.L.; Biudes, M.S.; da Silva, C.J.; Bambi, P.; Lobo, F.A. Seasonal and interannual litter dynamics of a tropical semideciduous forest of the southern Amazon Basin, Brazil. J. Geophys. Res.-Biogeosci. 2008, 113, G04007. [Google Scholar] [CrossRef] [Green Version]
  37. Chave, J.; Navarrete, D.; Almeida, S.; lvarez, E.A.; Aragao, L.E.; Bonal, D.; Chatelet, P.; Silva Espejo, J.; Goret, J.-Y.; von Hildebrand, P.; et al. Regional and temporal patterns of litterfall in tropical South America. Biogeosci. Discuss. 2009, 6, 7565–7597. [Google Scholar] [CrossRef]
  38. Wieder, R.K.; Wright, S.J. Tropical forest litter dynamics and dry season irrigation on Barro Colorado Island, Panama. Ecology 1995, 76, 1971–1979. [Google Scholar] [CrossRef]
  39. Valentini, C.M.A.; Sanches, L.; de Paula, S.R.; Vourlitis, G.L.; Nogueira, J.S.; Pinto, O.B., Jr.; Lobo, F.A. Soil respiration and aboveground litter dynamics of a tropical transitional forest in northwest Mato Grosso, Brazil. J. Geophys. Res. Biogeosci. 2008, 113, G00B10. [Google Scholar] [CrossRef]
  40. Powers, J.S.; Montgomery, R.A.; Adair, E.C.; Brearley, F.Q.; DeWalt, S.J.; Castanho, C.T.; Chave, J.; Deinert, E.; Ganzhorn, J.U.; Gilbert, M.E.; et al. Decomposition in tropical forests: A pan-tropical study of the effects of litter type, litter placement and mesofaunal exclusion across a precipitation gradient. J. Ecol. 2009, 97, 801–811. [Google Scholar] [CrossRef] [Green Version]
  41. Dalmagro, H.J.; de Arruda, P.H.Z.; Vourlitis, G.L.; Lathuillière, M.J.; Nogueira, J.S.; Couto, E.G.; Johnson, M.S. Radiative forcing of methane fluxes offsets net carbon dioxide uptake for a tropical flooded forest. Glob. Chang. Biol. 2019, 25, 1967–1981. [Google Scholar] [CrossRef]
  42. Johnson, M.S.; Couto, E.G.; Pinto, O.B., Jr.; Milesi, J.; Amorim, R.S.S.; Messias, I.A.M.; Biudes, M.S. Soil CO2 dynamics in a tree island soil of the Pantanal: The role of soil water potential. PLoS ONE 2013, 8, e64874. [Google Scholar] [CrossRef]
  43. Fanin, N.; Hättenschwiler, S.; Barantal, S.; Schimann, H.; Fromin, N. Does variability in litter quality determine soil microbial respiration in an Amazonian rainforest? Soil Biol. Biochem. 2011, 43, 1014–1022. [Google Scholar] [CrossRef]
  44. Fang, X.; Zhao, L.; Zhou, G.; Huang, W.; Liu, J. Increased litter input increases litter decomposition and soil respiration but has minor effects on soil organic carbon in subtropical forests. Plant Soil 2015, 392, 139–153. [Google Scholar] [CrossRef]
  45. Vourlitis, G.L.; Lobo, F.A.; Lawrence, S.; Holt, K.; Zappia, A.; Pinto, O.B., Jr.; Nogueira, J.S. Nutrient resorption in tropical savanna forests and woodlands of central Brazil. Plant Ecol. 2014, 215, 963–975. [Google Scholar] [CrossRef]
  46. Haase, R. Litterfall and nutrient return in seasonally flooded and non-flooded forest of the Pantanal, Mato Grosso, Brazil. For. Ecol. Manag. 1999, 117, 129–147. [Google Scholar] [CrossRef]
  47. Breitsprecher, A.; Bethel, J.S. Stem-growth periodicity of trees in a tropical wet forest of Costa Rica. Ecology 1990, 71, 1156–1164. [Google Scholar] [CrossRef]
  48. Girard, P. Hydrology of Surface and Ground Water in the Pantanal Floodplains. In The Pantanal: Ecology, Biodiversity and Sustainable Management of a Large Neotropical Seasonal Wetland; Junk, W.J., da Silva, C.J., Nunes da Cunha, C., Wantzen, K.M., Eds.; Pensoft Publishers: Sofia, Bulgaria, 2010; pp. 103–126. [Google Scholar]
  49. Condit, R.; Hubbell, S.P.; Foster, R.B. Mortality rates of 205 neotropical tree and shrub species and the impact of a severe drought. Ecol. Monogr. 1995, 65, 419–439. [Google Scholar] [CrossRef]
  50. Zhu, J.; Zhang, M.; Zhang, Y.; Zeng, X.; Xiao, X. Response of tropical terrestrial gross primary production to the super El Niño event in 2015. J. Geophys. R. Biogeosci. 2018, 123, 3193–3203. [Google Scholar] [CrossRef]
  51. Phillips, O.L.; Aragão, L.E.O.C.; Lewis, S.L.; Fisher, J.B.; Lloyd, J.; Lopez-Gonzalez, G.; Malhi, Y.; Monteagudo, A.; Peacock, J.; Quesada, C.A.; et al. Drought sensitivity of the Amazon rainforest. Science 2009, 323, 1344–1347. [Google Scholar] [CrossRef] [Green Version]
  52. Sjögersten, S.; Black, C.R.; Evers, S.; Hoyos-Santillan, J.; Wright, E.L.; Turner, B.L. Tropical wetlands: A missing link in the global carbon cycle? Glob. Biogeochem. Cycles 2014, 28, 1371–1386. [Google Scholar] [CrossRef]
Figure 1. Mean (±95% confidence interval; n = 6) monthly rates of litter production (a) and litter pool size (b) presented as dry mass per unit area (gdw m−2) for the seasonally flooded cerrado forest (CF: closed symbols; solid lines) and the upland mixed forest (MF: open symbols; dashed lines) during the 2014–19 study period. The solid bars in both panels are the average monthly rainfall for the same period.
Forests 11 00665 g001
Figure 2. Mean monthly proportion of leaf (black symbols), stem (white symbols), and reproductive material (blue symbols) relative to the total litter produced for the seasonally flooded cerrado forest (a) and the upland mixed forest (b) during the 2014–19 study period. The solid bars in both panels are the average monthly rainfall for the same period.
Forests 11 00665 g002
Figure 3. Mean monthly rate of total litterfall (a) and litter pool mass (b) presented as dry mass per unit area (gdw m−2) for the seasonally flooded cerrado forest (CF: closed symbols) and the upland mixed forest (MF: open symbols) during the 2014–19 study period. The shaded areas depict the dry season (precipitation < 100 mm/month) and the solid and dashed lines depict a three-month running average for the cerrado and mixed forests, respectively.
Forests 11 00665 g003
Figure 4. Mean (±95% confidence interval; n = 6) annual litter production and precipitation (a), litter pool mass (b), decomposition rate (c), and total aboveground wood C pool size (d) and aboveground wood C storage (e) for the seasonally flooded cerrado forest (CF: closed symbols, solid lines) and the upland mixed forest (MF: open symbols, dashed lines) during the 2014–19 study period.
Forests 11 00665 g004
Figure 5. Mean aboveground primary production from litter (dark gray) and wood (light gray) for each year of the study period in the seasonally flooded cerrado forest (a) and the upland mixed forest (b).
Forests 11 00665 g005
Table 1. Cross-correlation coefficients (r) and time lags between selected average monthly litter production and pool variables and average monthly precipitation over the 2014–2019 study period for the upland mixed and hyperseasonal cerrado forests of the northern Pantanal. A time lag of 0 months indicates that the litter variable was correlated with the precipitation of the current month, while a lag > 0 indicates that the litter variable lagged behind precipitation by the number of months indicated in the lag. N = 12 months, critical r = |0.576|, NS = not statistically significant (p > 0.05).
VariableUnitsMixed ForestCerrado Forest
rLag (Months)rLag (Months)
Litterfallgdw/m2−0.871−0.762
Litterpoolgdw/m2−0.803−0.753
Leaf litter%−0.840−0.790
Stem litter%0.8600.650
Reproductive litter%NS0.630