Article

Quality Control of Thermally Modified Timber Using Dynamic Vapor Sorption (DVS) Analysis

1
Biotechnical Faculty, University of Ljubljana, 1000 Ljubljana, Slovenia
2
Slovenian National Building and Civil Engineering Institute, 1000 Ljubljana, Slovenia
3
Faculty of Chemistry and Chemical Technology, University of Ljubljana, 1000 Ljubljana, Slovenia
4
Wood Biology and Wood Products, University of Goettingen, 37077 Goettingen, Germany
5
Sitik d.o.o., 1295 Ivančna Gorica, Slovenia
*
Author to whom correspondence should be addressed.
Forests 2020, 11(6), 666; https://doi.org/10.3390/f11060666
Submission received: 13 May 2020 / Revised: 3 June 2020 / Accepted: 9 June 2020 / Published: 11 June 2020
(This article belongs to the Special Issue Performance of Wood and Wood-Based Materials)

Abstract

:
The importance of thermal modification is increasing worldwide. Increased use of thermally modified timber (TMT) has resulted in a need for reliable quality control, comprising control of variation of the production within defined limits, allowing third-party control in the case of certification and the regulation of customer complaints and claims. Techniques are thus needed to characterise the modification of quality in terms of improved target properties of TMT during industrial production, and of TMT products that have been in service for an arbitrary time. In this study, we aimed to utilise dynamic vapor sorption (DVS) for this purpose. Norway spruce (Picea abies) and European beech (Fagus sylvatica) samples were thermally modified at different temperatures according to different heat treatment techniques: (1) the Silvapro process based on an initial vacuum; (2) an air heat treatment, whereby samples were wrapped in aluminium foil; (3) thermal modification of wood samples in the ambient atmosphere in a laboratory oven. Wood samples from closed processes were analysed for validation. TMT was characterised with respect to mass loss, colour and density. Mass loss of wood due to modification (MLTM) was correlated with factors derived from DVS analysis. The present DVS measurements suggest that the equilibrium wood moisture content (EMC95% RH), the time to reach 10% wood moisture content (t10% MC), and the elongation factor, c, derived from a logarithmic function, can serve as alternative parameters to characterise the quality of several thermal modification processes. Further studies are recommended using other wood species, different modification processes and further parameters gained from DVS measurements to understand the robustness and the predictive power of the applied technique.

1. Introduction

Wood in structural applications is often exposed to weathering and degrading organisms [1]. It therefore needs to be protected to slow the natural process of biodeterioration [2,3]. In nature, biodegradation is fundamental and desirable, but when the wood is used for structural purposes, degradation needs to be inhibited [4]. In the past, degradation was predominately controlled by the use of biocides [5]. However, the importance of wood preservatives has decreased significantly during the past two decades, not at least due to the changed attitude of consumers and the ban of the most common and effective preservatives, especially in Europe [6]. Research and commercial interest have consequently focused on alternative approaches, such as wood modification [7]. Among various modification techniques, thermal modification is the most important in terms of traded volumes. Up to 500,000 m3 of thermally modified timber (TMT) is produced annually in Europe [8].
TMT is produced in an oxygen-reduced environment at temperatures between 160 °C and 240 °C. This can be achieved with different methods, such as the use of hot oil, water-saturated steam, superheated steam, nitrogen gas, or an initial vacuum [9,10]. In general, higher modification temperatures and longer modification duration result in more severe changes of various wood properties. During the heat treatment, a multitude of chemical reactions take place, leading to changes in the primary wood cell wall components, and a darkening of the material. Among other changes, TMT is more resistant to fungal decay and more dimensionally stable compared to untreated wood, which qualifies it for indoor and outdoor use as cladding, decking, flooring, garden furniture and window joinery [11].
The increased use of TMT has resulted in a need for reliable quality control, comprising control of the variation of production within defined limits, allowing third-party control in the case of certification and the regulation of customer complaints and claims [12,13]. The measures used for quality control can either be targeted properties or certain auxiliary indicators, such as the mass loss (MLTM) that occurs due to gasification of the wood substance during the process. Mass loss measurements can be conducted on small samples or an entire treatment batch, and they can be done subsequently or online. Since MLTM is easy to determine and correlate with various other wood properties that are affected by thermal modification, such as elasto-mechanical properties, colour, biological durability and dimensional stability, it is one of the most frequent parameters for quality control of TMT [14,15,16,17]. However, MLTM cannot be determined when the initial wood mass is unknown. Therefore, MLTM measurements cannot be used for subsequent quality assessment of products in service and customer complaint management. For this reason, alternative methods for quality control of TMT have been developed, such as colour assessment [18,19,20], various spectroscopy techniques [21,22], nuclear magnetic resonance [23], electron paramagnetic resonance [24,25], thermal techniques such as thermal gravimetric analysis (TGA) [14,26], elasto-mechanical testing [9], impact ball milling [27] and chemical analysis [28]. Most of the techniques mentioned above are either destructive or cannot be used for testing material that is weathered from service, since weathering affects the respective measurand itself [29]. Furthermore, it is preferable to determine at least one of the main target properties of TMT, rather than exclusively indirect auxiliary measures.
Sorption of wood is highly affected by heat treatment. It might serve as a quality indicator, since the reduction of accessible hydroxyl groups is one of the primary goals of thermal modification [30]. The equilibrium moisture content (EMC) of TMT is thus much lower than that of untreated wood in a given climate [31]. Long-term monitoring of wood moisture content has indicated that the response of TMT to relative humidity (RH) remains fairly constant during weathering, and the sorption properties of wood below the surface are not significantly affected by weathering [32], at least for wood exposed in use class 2 and 3.1 [33]. Sorption properties could therefore serve as an alternative method for quality control, even after TMT has been in outdoor use for several years. The methods for sorption assessment of wood are not standardised and can vary a lot [34,35]. For this study, a gravimetric sorption apparatus based on dynamic vapour sorption (DVS) was used. DVS is fairly fast, precise and versatile. This method can be applied to freshly treated wood or wood that is already in service. The objective of this study was to elucidate the suitability of DVS measurements for the quality assessment of TMT.

2. Material and Methods

2.1. Material

The experiments were performed with Norway spruce (Picea abies) and European beech (Fagus sylvatica), representing commonly used softwoods and hardwoods in Europe that are frequently subject to thermal modification. The wood originated from Slovenia and was without visible signs of decay, discolouration or growth anomalies. Ten matched specimens of 20 × 30 × 500 mm3 were thermally modified and afterwards cut to 12 × 12 × 30 mm3 (R × T × L). All specimens were made of the same tree. Planks were obtained from a local sawmill. Samples were free of growth anomalies, decay and blue stain infestation. Samples were oven dried prior to thermal modification.
Three different modification procedures were applied to show the robustness of the designated method for quality control. Firstly, a commercial Silvapro process based on an initial vacuum [17] was applied. Secondly, samples were tightly wrapped in aluminium foil to decrease the oxidation processes, and modified in the ambient atmosphere in a laboratory oven [16]. Thirdly, samples were modified in the ambient atmosphere in a laboratory oven accepting unlimited oxidation [36]. All processes ran at normal pressure in an open system, allowing the removal of degradation products. Spruce wood was modified at 200, 210, 220 and 230 °C. Beech wood was modified at slightly lower temperatures, i.e., 180, 200, 210 and 220 °C, as it is more sensitive to thermal degradation than spruce. The holding time was always three hours. The MLTM of oven-dry specimens was calculated at the end of the process, based on the oven-dry mass before and after treatment. Each modification was performed with four replicates.
For comparison, only Norway spruce wood was modified in a closed system process at 160 °C (0.1 MPa, 0.3 MPa) and 170 °C (0.8 MPa) in laboratory scale. The applied process was based on the Firmolin process described by Willems [37]. It consisted of four steps: constant pre-vacuum at <14 kPa for 50 min, temperature increase at a rate of 12 °C per hour until the peak temperature (160 °C, 170 °C) was reached with simultaneous increasing of pressure up to 0.1 MPa or 0.3 MPa (160 °C) and 0.8 MPa (170 °C), a holding phase at the peak temperature for three hours, followed by a cooling phase at a rate of 20 °C per hour until 65 °C. The vessel was opened, specimens removed and the corrected MLTM calculated based on the oven-dry specimens’ mass before and after treatment.

2.2. Characterisation of Thermally Modified Timber (TMT)

After three weeks of conditioning in normal laboratory conditions, the samples were analysed to determine the basic properties of the TMT. The envelope density (ρ0) [38] of oven-dry wood was determined with GeoPyc 1365 (Micromeritics, Germany). The envelope density was measured on five oven-dried replicate specimens (12 × 12 × 30 mm3). GeoPyc is a displacement measurement equipment. The method utilises free-flowing solid, compression and displacement measurement to determine the envelope volume. Instead of mercury, Dry Flo (registered trademark, Micromeritics Instrument Corporation, Norcross, GA, USA), a free-flowing solid was used. First, the sample chamber was filled with Dry Flo only and, under rotating movement and desired pressure, the volume of the sand was calculated. Secondly, the sample was positioned in Dry Flo, which was agitated and gently consolidated around the tested sample. Dry Flo particles do not penetrate the wood. The total volume of sand and sample was measured. The sample envelope volume was calculated from the difference in volume between the two measurements. For determining the envelope density of the wood samples, a chamber with 12.7 mm internal diameter was used. A standard consolidation force of 28 N and a 0.1284 cm3/mm conversion factor for this chamber were used, according to the operating manual. This force was low enough to avoid any damage to the wood structure. A volume ratio between the sample and the Dry Flo media (25% by volume) was applied according to the manufacturer’s recommendation [39,40].
Changes in colour are among the first indicators of thermal cell wall modification. The surface of the samples was not sanded or planed before the measurements. There were no condensates determined on the surface, which might affect the colour. The samples were scanned before cutting to smaller sizes. The longitudinal side of each sample (five in total per modification) was scanned. The colour was evaluated using the CIE L*a*b* colour space system according to three axes: the lightness (L) increases from 0 (black) to 100 (white), the a-axis extends from green (−) to red (+), and the b-axis from blue (−) to yellow (+) [41]. Scanning was performed with an HP Scanjet G4050. The average colour of the entire scanned surface was calculated directly with CorelDRAW software [42].

2.3. DVS Analysis of TMT

Samples for DVS analysis were milled in a Retsch SM 2000 cutting mill (Retsch GmbH, Haan, Germany) with a Conidur® perforation sieve with 1.0 mm perforations. Milled wood samples were conditioned at 20 ± 0.2 °C and 1 ± 1% RH through blowing with dry air. Analysis of the wood samples was performed using a DVS apparatus (DVS Intrinsic, Surface Measurement Systems Ltd., London, UK). A small amount (approximately 400 mg) of pre-conditioned wood chips was placed on the sample holder, which was suspended in a microbalance within a sealed, thermostatically controlled chamber, in which a constant flow of dry compressed air was passed over the sample at a flow rate of 200 cm3/s and a temperature of 25 ± 0.2 °C. The schedule for DVS had two steps: 0% and 95% RH. The DVS maintained a given RH until the weight change of the sample was less than 0.002%/min for at least 10 min. The running time, target RH, actual RH, and sample weight were recorded three times per min throughout the isotherm run.
After the DVS analysis, equilibrium moisture content at 95% RH (EMC95% RH), the time needed to reach equilibrium state (t95% RH), the time needed to reach the half value of the equilibrium moisture content (tEMC/2), and the time required to reach 10% moisture content (t10% MC) were determined. Additionally, graphs were made; the measurement time was plotted on the abscissa, the moisture content was plotted on the ordinate, and an elongation factor, c, was derived from the logarithmic function y = c × ln(x) + b. Only the first 800 measurements were considered for the calculations.

3. Results and Discussion

3.1. Properties of Thermally Modified Timber (TMT)

The following subchapter aims to describe the material used in the subsequent DVS analysis. In each description, we primarily focused on the modification of wood in the open system and not on the material modified in the closed system. Material modified in the closed process served for comparison of two different groups of thermal modification procedures, and for validation of the idea. The primary parameter that describes the quality of the modified wood is the modification temperature and respective MLTM after modification. As shown by Welzbacher et al. [16], MLTM increases with increasing temperature and/or duration of the treatment. This relationship was confirmed in our experiments, as shown in Table 1. As expected, the highest MLTM was determined for unwrapped samples modified in a laboratory oven, in which oxidation processes were not hindered. The lowest MLTM of spruce wood samples was determined for specimens wrapped in aluminium foil. The foil prevented evaporation of degradation products. Condensation of the degradation products was thus likely to take place. For example, spruce wood samples modified at the highest temperature (230 °C) lost 12.3% when modified unwrapped in the oven in an ambient atmosphere, and only 8.2% when wrapped in foil (Table 1). Since samples from the same board were modified within the same process, the difference can be ascribed to wrapping only. Wrapping results in a higher pH of the samples, compared to samples modified according to the Silvapro procedure determined in parallel experiments, as reported by Repič [43].
Similarly, as reported for MLTM, colour changes increased with increasing modification temperature. The higher the modification temperature, the darker the colour of the wood, as can be seen from the L* coordinate in Table 1. The average L* of non-modified spruce wood was 83.8. This value decreased to 53.3 on specimens modified at 200 °C according to the Silvapro procedure, and reached a minimum with spruce wood specimens modified at 230 °C according to the same procedure (34.8). A similar relationship was found for beech wood samples (Table 1). This phenomenon is well known and has been described in detail previously [9,10,18]. The darker colour of TMT originates from chemical changes in the main cell wall polymers, where Klason lignin is more affected than the polysaccharides. This is associated with the generation of chromophoric groups, mainly an increase in carbonyl groups [44]. The highest variation (as seen from standard variation) in colour was observed with unwrapped samples modified in the oven. In contrast, the colour of wrapped samples that were modified according to the SilvaPro process was fairly uniform (Table 1), likely as aluminium foil distributes temperature on the surface uniformly.

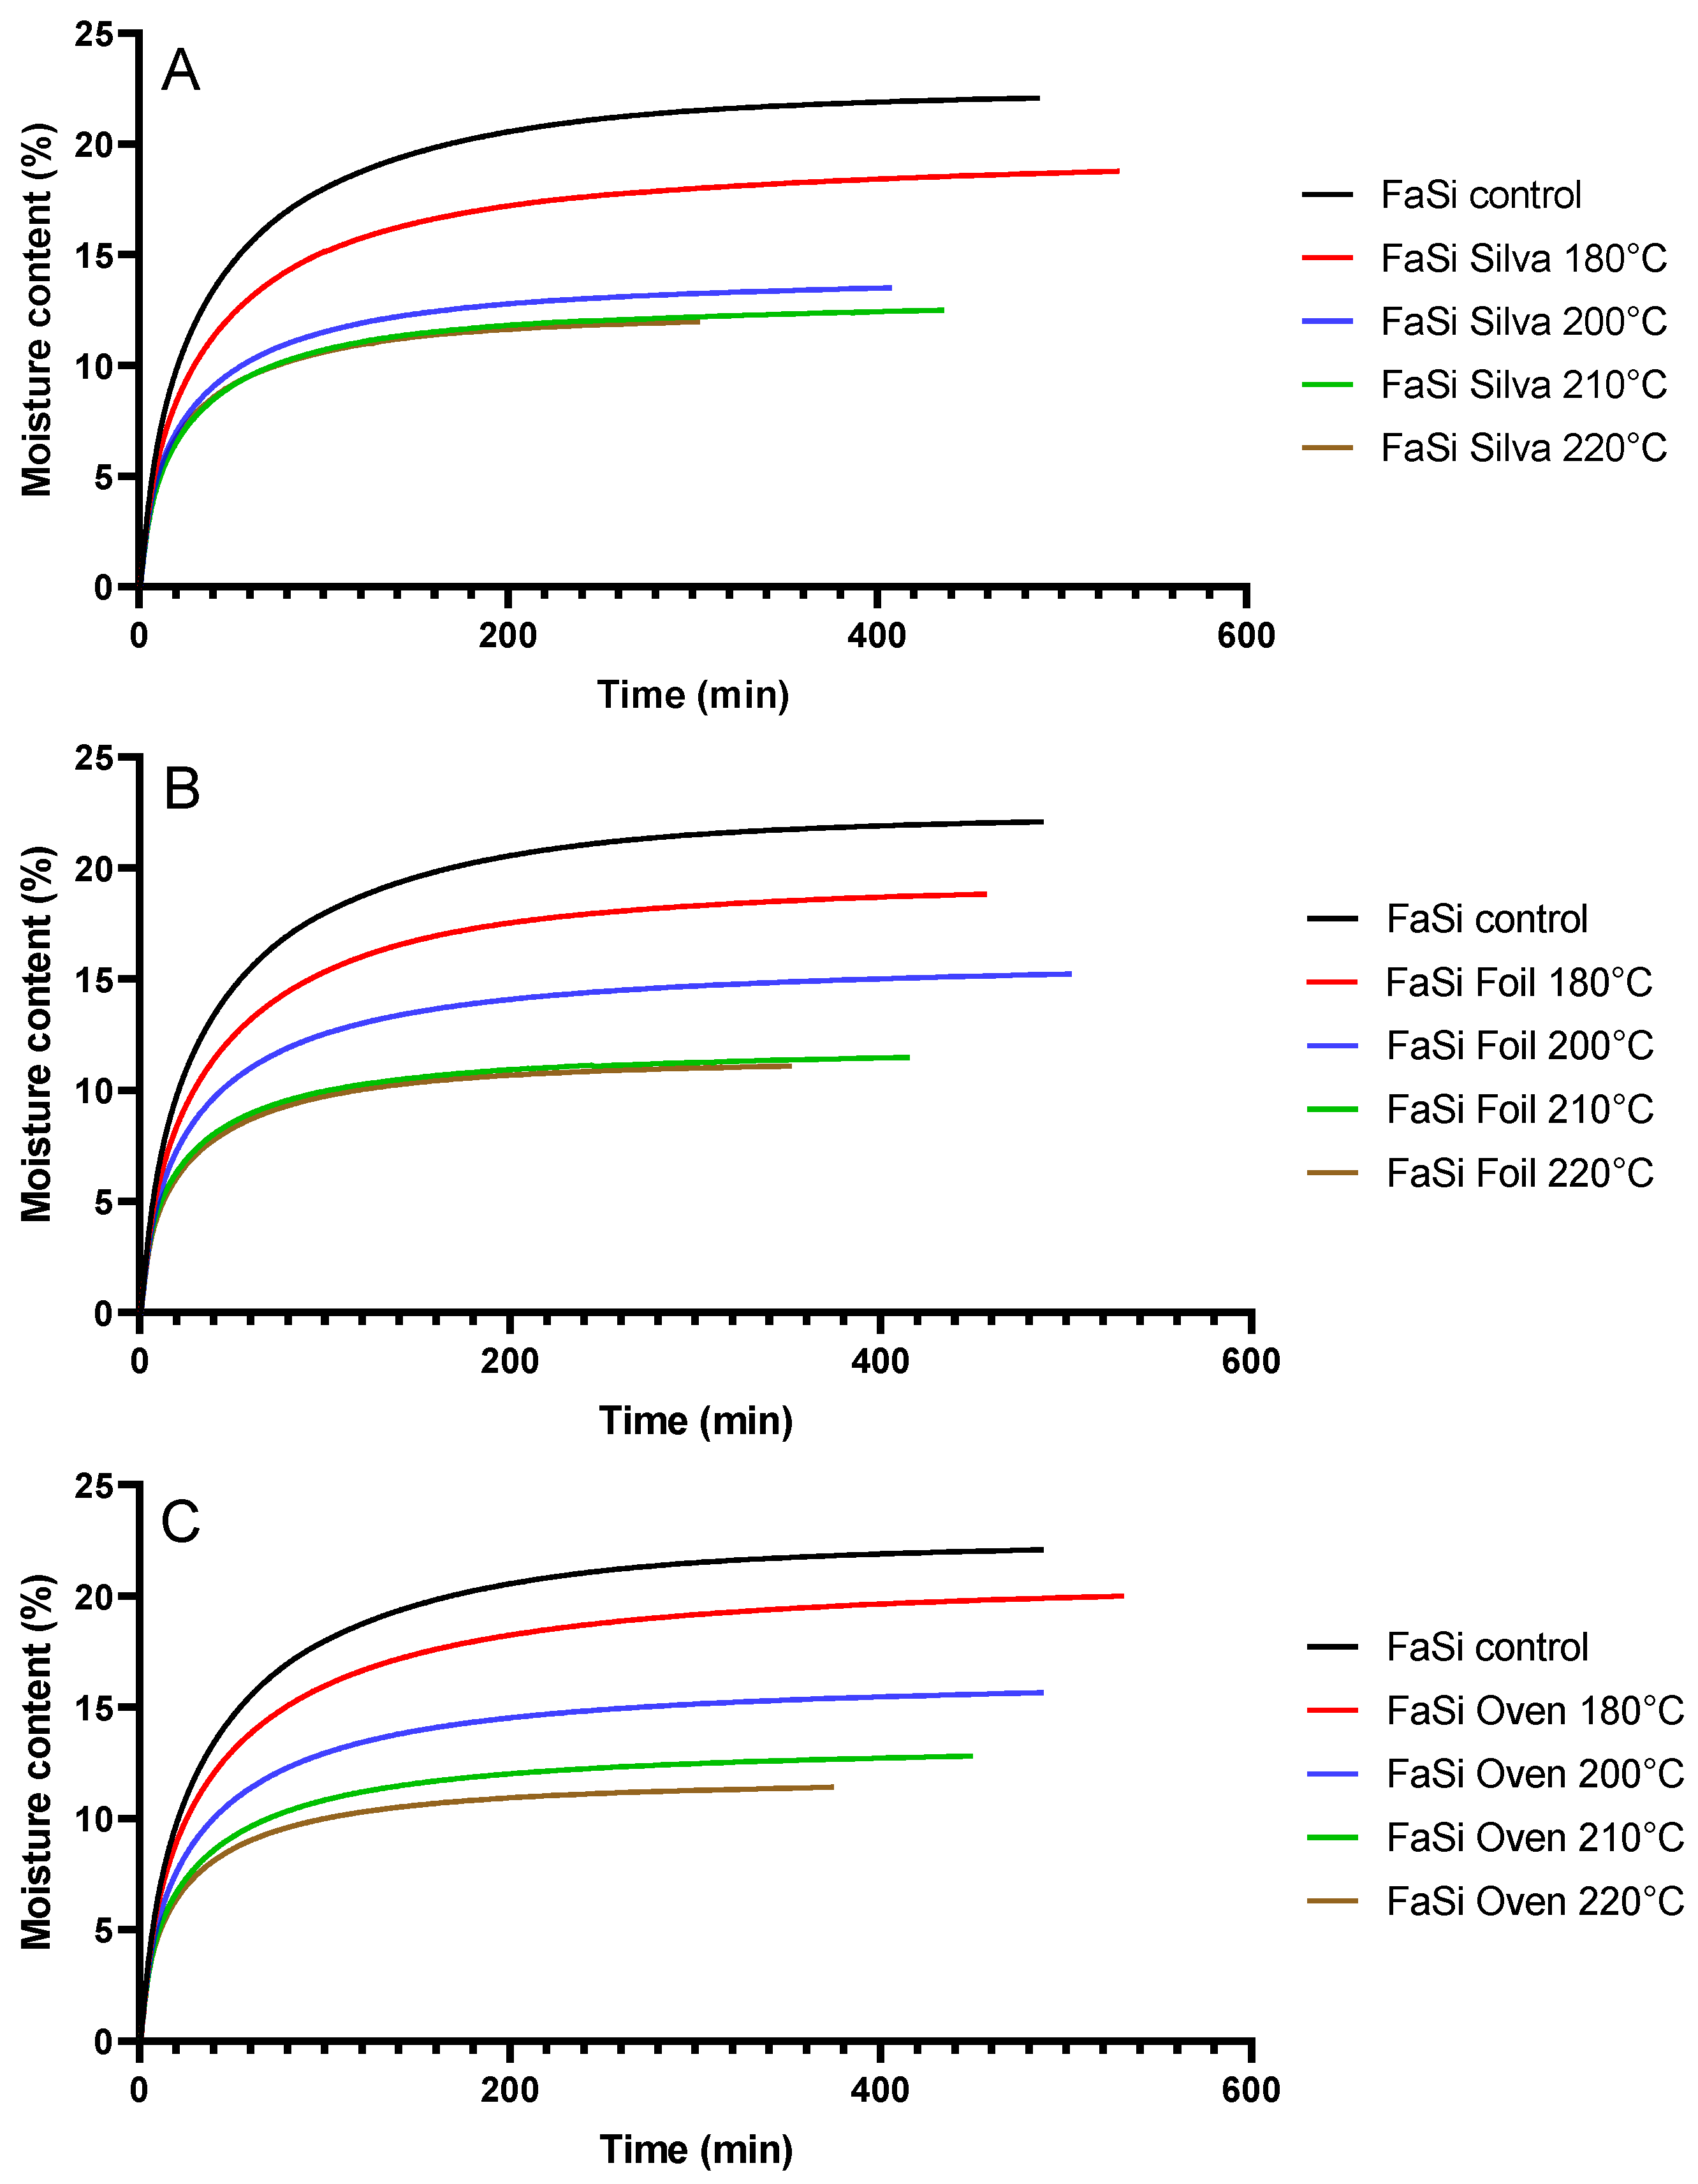
3.2. DVS Analysis of TMT

The main aim of this study was to utilise dynamic vapour sorption (DVS) analysis for the quality control of TMT and to find an indicator that adequately reflects the degree, and hence the quality, of thermal modification. DVS analysis followed two steps: at 0% RH, to record the absolutely dry mass of the sample in the test, followed by a second step at 95% RH, until the equilibrium moisture content of the sample was reached. Parameters obtained during DVS analysis were compared to the MLTM of the samples during thermal modification. The typical increase in the MC during conditioning can be seen from Figure 1 and Figure 2. The increase in the sample mass followed a logarithmic function. The increase in the MC during the initial phase of the experiment was faster. Thereafter, a steady decrease in the absorption of water vapour continued until reaching the equilibrium state.
As reported in the literature [9,10,12,16,45], thermal modification has a considerable effect on the EMC of wood. The EMC of wood at 95% RH (EMC95% RH) decreased with increasing modification intensity (Figure 1 and Figure 2; Table 2). The lowest EMC95% RH of the samples were observed for specimens modified at the highest temperature, which appeared to be independent of the applied modification procedure. The average EMC95% RH of modified spruce wood ranged between 12.3% (Silvapro, 230 °C) and 13.1% (oven, 230 °C). The EMC95% RH of non-modified spruce was considerably higher (21.7%). Although lower temperatures were used for the modification of beech wood, the EMC95% RH of the beechwood modified at the highest temperature was lower than that of spruce wood. It ranged between 11.1% (wrapped, 220 °C) and 12.0% (Silvapro, 220 °C). The effect of the lower modification temperatures on the EMC95% RH of the samples was smaller. None of the modified samples had an EMC95% RH higher than those of the control specimens (Table 2). A similar ratio between the EMC95% RH of TMT and that of the controls supported previous findings reported by Jalaludin et al. [45] and Olek et al. [46]. This phenomenon can be ascribed to a substantial loss of hemicelluloses, resulting in an overall reduction of free and accessible sorption sites (OH groups), and potential cross-linking reactions. Finally, cellulose crystallinity increased, resulting in a reduction of accessible OH groups [10].
In general, it can be seen that modified samples conditioned faster than non-modified samples (Figure 1 and Figure 2, Table 2). This became evident for wood modified at higher temperatures. For example, the control spruce samples needed 532 min to reach equilibrium at 95% RH. In contrast, samples modified at the highest temperature of 230 °C needed only 245 min (wrapped samples) and 300 min (samples modified in the oven). A similar ratio was found for beech wood (Table 2). This finding is in line with a DVS analysis of thermally modified acacia and sesendok wood reported by Jalaludin et al. [45].
Two other parameters based on time were even more indicative; namely, the time to reach an MC that equals half of the EMC95% RH (tEMC/2), and the time needed to reach 10% MC (t10% MC). For example, the tEMC/2 of control spruce wood specimens was 21.7 min but modified spruce needed 14.9 min when treated at 210 °C, and only 11.6 min when treated at 230 °C. It took slightly longer to reach 10% MC with beech wood specimens, but the ratio between non-modified and modified wood was similar. The time needed for the wood to reach 10% MC was also somewhat indicative. Untreated beechwood took 55 min to absorb 10% of the water, while the time required for beech wood modified at 220 °C to absorb the same amount of water was almost double (Table 2).
The last indicator was derived from the logarithmic curve fitted to DVS data. Factor c is an elongation factor of the logarithmic curve. An elongation factor higher than 1 stretches the curve; thus, wood with a higher EMC should have a higher elongation factor than modified wood. This factor varied between 4.23 for non-modified beech and 1.86 for beech modified at 220 °C in the oven (Table 2).

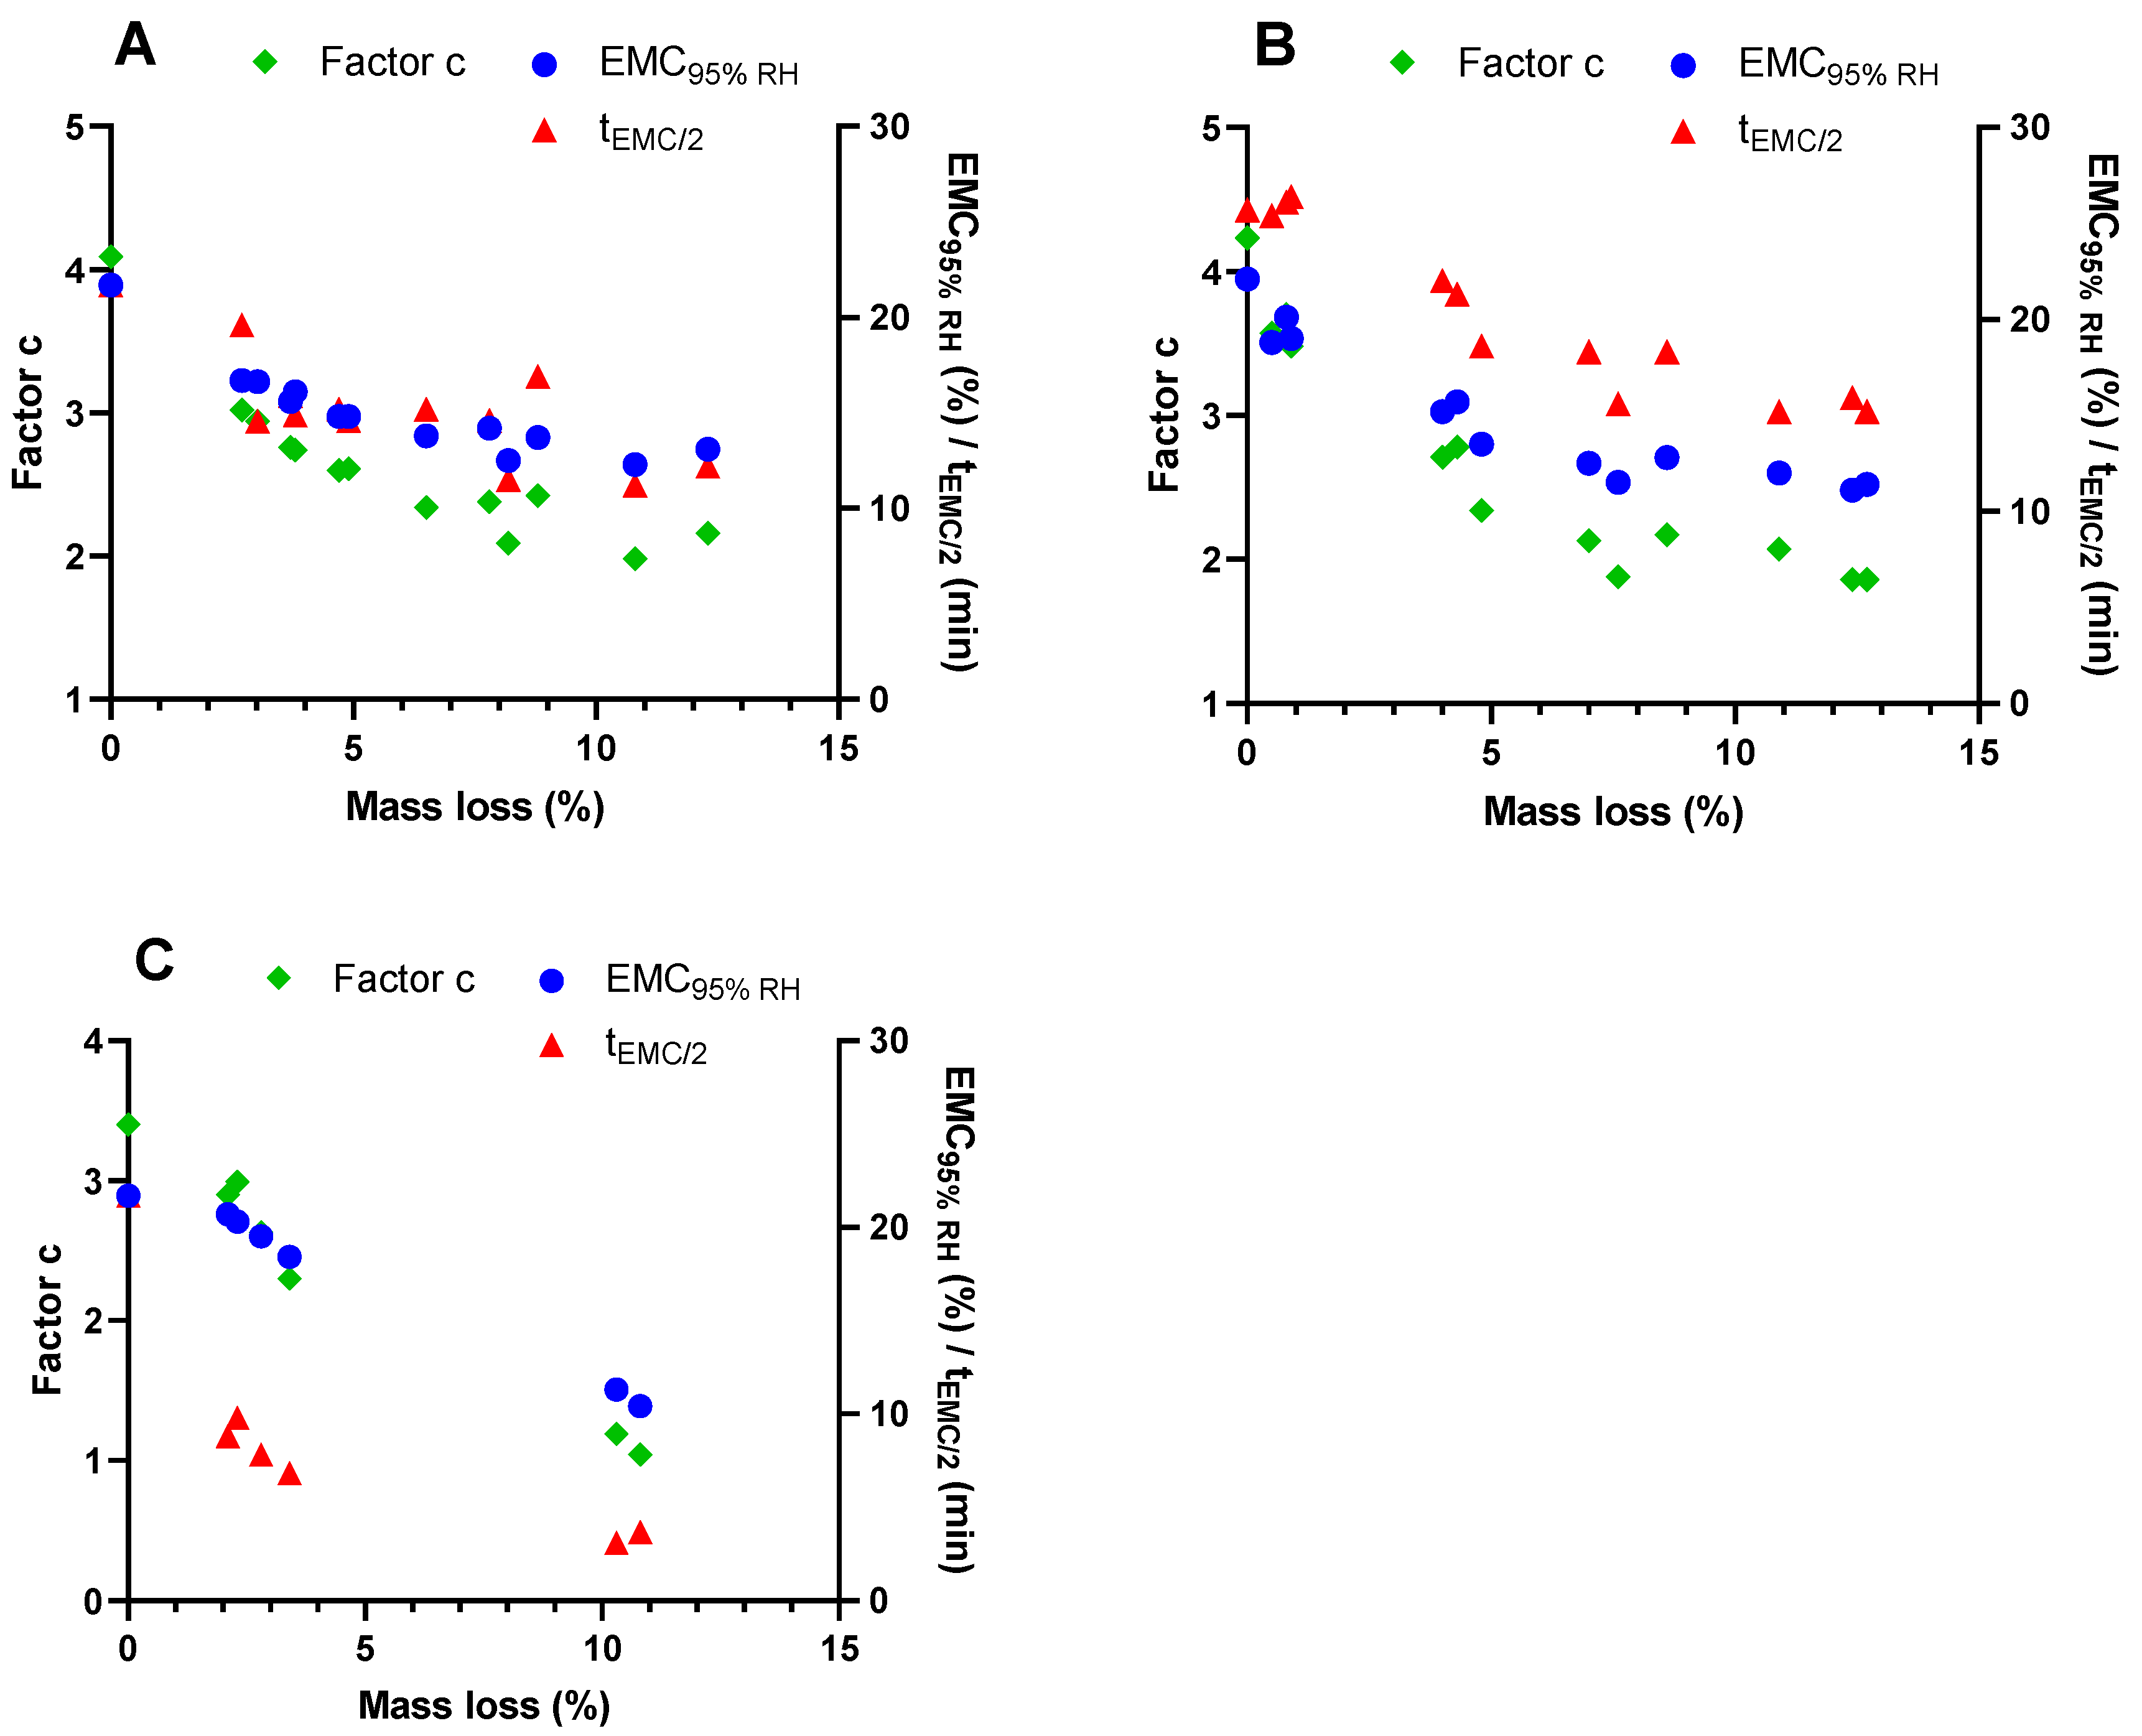
3.3. Correlations between Modification Intensity and DVS-Derived Parameters

A correlation between indicators described in the previous sections and mass loss due to thermal modification was established. For comparison, L*—lightness, one of the most frequently used indicators [9,10,18] was applied. Colour values, predominantly the lightness, are among the very few properties that are not affected by the treatment temperature [16]. This means that the correlation between MLTM and colour is the same for 180 °C and 220 °C [18]. The correlations are displayed in Table 3 and are summarised for all treatments. As expected, we found a fairly good correlation between MLTM and the L* parameter. The Pearson correlation coefficient between MLTM and L* was −0.88 for spruce and −0.90 for beech wood. However, L* is a very appropriate indicator for both freshly modified wood and potentially even for weathered wood if the grey surface layer is removed. Other indicators derived from colour analysis (a* and b*) seemed less suitable. Similarly, the density of modified wood was less indicative due to the natural variability of the wood. As specimens were milled prior to DVS analysis, the influence of density was minimised. In contrast, indicators derived from sorption analysis appeared more suitable. Among these, EMC at 95% RH (EMC95% RH) and the time required for wood to reach a certain threshold (t95% RH, t10% MC) were very indicative. For example, the Pearson coefficient for the correlation between t10% MC and MLTM was 0.85 for spruce and 0.93 for beech. A striking, statistically significant correlation was determined between MLTM and the elongation factor c, i.e., −0.87 for spruce and −0.91 for beech wood specimens (Table 3; Figure 3).
To study the applicability of the developed method, DVS analysis of wood modified in a closed process was also performed. On the one hand, the same calibration curves could not be applied to modified wood from closed and open systems (Figure 3), which is in line with previous publications [15,47]. On the other hand, we found a fairly good correlation between some of the indicators, namely tEMC/2 (r = −0.97), t10% MC (r = −1.0) and c (r = −0.99). These data indicate the robustness of this method and its suitability for assessing the modification rate with wood modified in different processes. However, the same parameters cannot be applied on wood modified in open and closed systems.

4. Conclusions

The mass loss (MLTM) of wood due to thermal degradation is one of the most frequently used indicators of treatment efficiency in thermal modification processes. However, it can only be determined immediately after the modification process, provided that the initial wood mass is known. In this study, DVS measurements were conducted with TMT from different treatment processes, and their suitability for quality control was evaluated. The following can be concluded from the obtained results:
  • Lightness, L*, correlated well with MLTM, but the a* and b* coordinates did not. Since TMT is not UV stable, its colour changes during light exposure and weathering.
  • Various parameters derived from DVS analysis of, in total, 26 different TMT materials showed high potential to predict the treatment intensity of thermal modification reliably and might, therefore, serve as quality control indicators.
  • The equilibrium moisture content at 95% RH (EMC95% RH), the time needed to reach equilibrium state (t95% RH), the time needed to reach half value of the equilibrium moisture content (tEMC/2), the time required to reach 10% MC (t10% MC), and factor c derived from a logarithmic function (y = c × ln(x) + b), were among the most promising indicators.
  • The current DVS measurements suggest that EMC95% RH, t10% MC and factor c could be used as alternative parameters to determine the quality of the modification process.
  • Further work with other wood species, different modification approaches, and also other parameters gained from DVS measurements than described here, is recommended to understand the robustness of the new proposed quality control parameters.
  • DVS measurements were found to be a suitable method for the assessment of the modification degree of wood modified according to the Silvapro method.
  • Aluminium foil has a positive effect on the performance of thermally modified wood in an open thermal modification system.
  • Future studies should also show whether DVS-derived indicators can predict the outdoor moisture performance of TMT.

Author Contributions

Conceptualisation, M.H., R.C.K. and G.R.; methodology, M.H. and D.K.; software, M.H.; validation, C.B., L.E., B.L. and M.H.; formal analysis, R.R., D.K. and M.H.; investigation, R.R. and D.K.; resources, M.H. and R.C.K.; data curation, M.H.; writing—original draft preparation, M.H.; writing—review and editing, R.R., B.L., D.K., R.C.K., G.R., C.B. and L.E.; visualisation, M.H.; supervision, M.H. and R.C.K.; project administration, M.H. and R.C.K.; funding acquisition, M.H. and R.C.K. All authors have read and agreed to the published version of the manuscript.

Funding

The authors acknowledge the support of the Slovenian Research Agency (ARRS) within the framework of research project L4-7547 and, research program P4-0015, and the infrastructural centre (IC LES PST 0481-09). Part of the presented research was also supported by the following projects: Sustainable and Innovative Construction of Smart Buildings—TIGR4smart (C3330-16-529003) and Wood Products over a Lifetime (WOOLF-OP20.03520).

Acknowledgments

Maximilian Wentzel is acknowledged for performing the heat treatment at the University of Goettingen.

Conflicts of Interest

The authors declare no conflict of interest.

References

  1. Cheung, K.C.K. Wooden Structures. Ref. Modul. Mater. Sci. Mater. Eng. 2019, 1, 1–14. [Google Scholar] [CrossRef]
  2. Humar, M.; Kržišnik, D.; Lesar, B.; Brischke, C. The performance of wood decking after five years of exposure: Verification of the combined effect of wetting ability and durability. Forests 2019, 10, 903. [Google Scholar] [CrossRef] [Green Version]
  3. Zabel, R.A.; Morrell, J.J. Wood Microbiology: Decay and its Prevention, 2nd ed.; Academic Press: Amsterdam, The Netherlands, 2020; ISBN 9780128194652 0128194650. [Google Scholar]
  4. Kutnik, M.; Suttie, E.; Brischke, C. European standards on durability and performance of wood and wood-based products—Trends and challenges. Wood Mater. Sci. Eng. 2014, 9, 122–133. [Google Scholar] [CrossRef]
  5. Richardson, B.A. Wood Preservation, 2nd ed.; E. & F.N. Spon: London, UK, 1993; ISBN 9780203474037. [Google Scholar]
  6. Humar, M. Protection of the bio-based material. In Performance of Bio-based Building Materials; Dennis, J., Brischke, C., Eds.; Woodhead Publishing: Duxford, UK, 2017; pp. 187–240. ISBN 9780081009925. [Google Scholar]
  7. Militz, H. Wood Modification in Europe in the year 2015: A Success Story? In Proceedings of the Eighth European Conference on Wood Modification, Helsinki, Finland, 26–27 October 2015; Mark, H., Rautkari, L., Tuuli, U., Brigitte, J., Militz, H., Eds.; pp. 1–4. [Google Scholar]
  8. Goli, G.; Todaro, L. Wood Modification in Europe: Processes, Products, Applications; GESAAF—University of Florence: Florence, Italy, 2018; p. 41. [Google Scholar]
  9. Esteves, B.M.; Pereira, H.M. Wood modification by heat treatment: A review. BioResources 2009, 4, 370–404. [Google Scholar]
  10. Hill, C.A.S. Wood Modification: Chemical, Thermal and Other Processes; John Wiley and Sons: Hoboken, NJ, USA, 2006; ISBN 9780470021729. [Google Scholar]
  11. Ugovšek, A.; Šubic, B.; Rep, G.; Humar, M.; Lesar, B.; Thaler, N.; Brischke, C.; Jones, D.; Lozano, J.I. Performance of Windows and façade elements made of thermally modified Norway spruce (Picea abies) in different climatic conditions. In Proceedings of the WCTE 2016—World Conference on Timber Engineering, Vienna, Austria, 22–25 August 2016. [Google Scholar]
  12. Willems, W.; Lykidis, C.; Altgen, M.; Clauder, L. Quality control methods for thermally modified wood: COST action FP0904 2010-2014: Thermo-hydro-mechanical wood behaviour and processing. Holzforschung 2015, 69, 875–884. [Google Scholar] [CrossRef]
  13. Candelier, K.; Thevenon, M.F.; Petrissans, A.; Dumarcay, S.; Gerardin, P.; Petrissans, M. Control of wood thermal treatment and its effects on decay resistance: A review. Ann. Forest Sci. 2016, 73, 571–583. [Google Scholar] [CrossRef] [Green Version]
  14. Cerc Korošec, R.; Lavrič, B.; Rep, G.; Pohleven, F.; Bukovec, P. Thermogravimetry as a possible tool for determining modification degree of thermally treated Norway spruce wood. J. Therm. Anal. Calorim. 2009, 98, 189–195. [Google Scholar] [CrossRef]
  15. Altgen, M.; Welzbacher, C.; Humar, M.; Willems, W.; Militz, H. Bestimmung der Behandlungsqualitat von Thermoholz mithilfe von Schnellverfahren. Holztechnologie 2012, 6, 44–49. [Google Scholar]
  16. Welzbacher, C.R.; Brischke, C.; Rapp, A.O. Influence of treatment temperature and duration on selected biological, mechanical, physical and optical properties of thermally modified timber. Wood Mater. Sci. Eng. 2007, 2, 66–76. [Google Scholar] [CrossRef]
  17. Rep, G.; Pohleven, F.; Kosmerl, S. Development of the industrial kiln for thermal wood modification by a procedure with an initial vacuum and commercialisation of modified Silvapro wood. In Proceedings of the 6th European Conference on Wood Modification; Jones, D., Militz, H., Petrič, M., Pohleven, F., Humar, M., Pavlič, M., Eds.; University of Ljubljana: Ljubljana, Slovenia, 2012; pp. 11–17. [Google Scholar]
  18. Brischke, C.; Welzbacher, C.R.; Brandt, K.; Rapp, A.O. Quality control of thermally modified timber: Interrelationship between heat treatment intensities and CIE L*a*b* color data on homogenized wood samples. Holzforschung 2007, 61, 19–22. [Google Scholar] [CrossRef]
  19. Sundqvist, B.; Karlsson, O.; Westermark, U. Determination of formic-acid and acetic acid concentrations formed during hydrothermal treatment of birch wood and its relation to colour, strength and hardness. Wood Sci. Technol. 2006, 40, 549–561. [Google Scholar] [CrossRef]
  20. Torniainen, P.; Elustondo, D.; Dagbro, O. Industrial validation of the relationship between color parameters in thermally modified spruce and pine. BioResources 2016, 11, 1369–1381. [Google Scholar] [CrossRef] [Green Version]
  21. Bächle, H.; Zimmer, B.; Wegener, G. Classification of thermally modified wood by FT-NIR spectroscopy and SIMCA. Wood Sci. Technol. 2012, 46, 1181–1192. [Google Scholar] [CrossRef]
  22. Tong, L.; Zhang, W.; Lu, W. Prediction of colour change of thermally modified wood by near infrared spectroscopy. J. Near Infrared Spectrosc. 2016, 24, 563–569. [Google Scholar] [CrossRef]
  23. Hietala, S.; Maunu, S.L.; Sundholm, F.; Jämsä, S.; Viitaniemi, P. Structure of thermally modified wood studied by liquid state NMR measurements. Holzforschung 2002, 56, 522–528. [Google Scholar] [CrossRef]
  24. Altgen, M.; Welzbacher, C.; Humar, M.; Militz, H. ESR-spectroscopy as a potential method for the quality control of thermally modified wood. In Proceedings of the Current and Future Trends of Thermo-Hydro-Mechanical Modification of Wood Opportunities for New Markets; Navi, P., Ed.; Université de Lorraine: Nancy, France, 2012; pp. 132–134. [Google Scholar]
  25. Xiuyan, J. ESR technology—An effective method for researching wood surface modification. J. Northeast For. Univ. 1995, 6, 73–75. [Google Scholar] [CrossRef]
  26. Candelier, K.; Hannouz, S.; Elaieb, M.; Collet, R.; Dumarçay, S.; Pétrissans, A.; Gérardin, P.; Pétrissans, M. Utilization of temperature kinetics as a method to predict treatment intensity and corresponding treated wood quality: Durability and mechanical properties of thermally modified wood. Maderas Ciencia Tecnol. 2015, 17, 253–262. [Google Scholar] [CrossRef] [Green Version]
  27. Rapp, A.O.; Brischke, C.; Welzbacher, C.R. Interrelationship between the severity of heat treatments and sieve fractions after impact ball milling: A mechanical test for quality control of thermally modified wood. Holzforschung 2006, 60, 64–70. [Google Scholar] [CrossRef]
  28. Šušteršic, Ž.; Mohareb, A.; Chaouch, M.; Pétrissans, M.; Petrič, M.; Gérardin, P. Prediction of the decay resistance of heat treated wood on the basis of its elemental composition. Polym. Degrad. Stab. 2010, 95, 94–97. [Google Scholar] [CrossRef]
  29. Kržišnik, D.; Lesar, B.; Thaler, N.; Humar, M. Influence of natural and artificial weathering on the colour change of different wood and wood-based materials. Forests 2018, 9, 488. [Google Scholar] [CrossRef] [Green Version]
  30. Lillqvist, K.; Källbom, S.; Altgen, M.; Belt, T.; Rautkari, L. Water vapour sorption properties of thermally modified and pressurised hot-water-extracted wood powder. Holzforschung 2019, 73, 1059–1068. [Google Scholar] [CrossRef]
  31. Li, T.; Cheng D, l.i.; Avramidis, S.; Wålinder, M.E.P.; Zhou, D. guo Response of hygroscopicity to heat treatment and its relation to durability of thermally modified wood. Constr. Build. Mater. 2017, 144, 671–676. [Google Scholar] [CrossRef]
  32. Humar, M.; Lesar, B.; Kržišnik, D. Moisture Performance of Façade Elements Made of Thermally Modified Norway Spruce Wood. Forests 2020, 11, 348. [Google Scholar] [CrossRef] [Green Version]
  33. CEN. European Standard EN 350—Durability of wood and wood-based products. In Testing and Classification of the Durability to Biological Agents of Wood and Wood-Based Materials; CEN: Brussels, Belgium, 2016. [Google Scholar]
  34. Brischke, C.; Alfredsen, G. Wood-water relationships and their role for wood susceptibility to fungal decay. Appl. Microbiol. Biotechnol. 2020, 104, 3781–3795. [Google Scholar] [CrossRef] [PubMed]
  35. Fredriksson, M. On wood-water interactions in the over-hygroscopic moisture range-mechanisms, methods, and influence of wood modification. Forests 2019, 10, 779. [Google Scholar] [CrossRef] [Green Version]
  36. Aytin, A.; Korkut, S. Effect of thermal treatment on the swelling and surface roughness of common alder and wych elm wood. J. For. Res. 2016, 27, 225–229. [Google Scholar] [CrossRef]
  37. Willems, W. A Novel Economic Large-scale Production Technology for High-quality Thermally Modified Wood. In 4th European Conference on Wood Modification; Engelund, F., Militz, H., Eds.; SP Technical Research Institute of Sweden: Stockholm, Sweden, 2009; pp. 31–35. ISBN 9789186319366. [Google Scholar]
  38. Brewe, C.E.; Levine, J. Weight or Volume for Handling Biochar and Biomass? Biochar J. 2015. Available online: www.biochar-journal.org/en/ct/71 (accessed on 4 May 2020).
  39. Macias, K.A.; Carvajal, M.T. The influence of granule density on granule strength and resulting compact strength. Chem. Eng. Sci. 2012, 72, 205–213. [Google Scholar] [CrossRef]
  40. Micromeritics Instrument Corporation. GeoPyc 1365 Operator Manual; Micromeritics Instrument Corporation: Norcross, GA, USA, 2017. [Google Scholar]
  41. Commission Internationale De L’Eclairage CIE Technical Report; Techniques de l’ingénieur: Paris, France, 2004; Volume 552, ISBN 978-3-901-90633-6.
  42. Pavlic, M.; Kricej, B.; Tomazic, M.; Petric, M. Influence of biocide pre-treatment of wood on performance of exterior coatings. Surface Coatings Int. Part B Coat. Trans. 2005, 88, 41–48. [Google Scholar] [CrossRef]
  43. Repic, R.; Repič, R.; Repic, R. Alternative methods for quality assesment of thermally modified wood. Master’s Thesis, Biotechnical Faculty, University of Ljubljana, Ljubljana, Slovenia, 2018. [Google Scholar]
  44. González-Peña, M.M.; Hale, M.D.C. Colour in thermally modified wood of beech, Norway spruce and Scots pine. Part 1: Colour evolution and colour changes. Holzforschung 2009, 63, 385–393. [Google Scholar] [CrossRef]
  45. Jalaludin, Z.; Hill, C.A.S.; Xie, Y.; Samsi, H.W.; Husain, H.; Awang, K.; Curling, S.F. Analysis of the water vapour sorption isotherms of thermally modified acacia and sesendok. Wood Mater. Sci. Eng. 2010, 5, 194–203. [Google Scholar] [CrossRef]
  46. Olek, W.; Majka, J.; Czajkowski, Ł. Sorption isotherms of thermally modified wood. Holzforschung 2013, 67, 183–191. [Google Scholar] [CrossRef]
  47. Wentzel, M.; Altgen, M.; Militz, H. Analyzing reversible changes in hygroscopicity of thermally modified eucalypt wood from open and closed reactor systems. Wood Sci. Technol. 2018, 52, 889–907. [Google Scholar] [CrossRef]
Figure 1. Dynamic vapor sorption (DVS) sorption curves of Norway spruce (PiAb) wood modified according to different procedures: Silavapro (Silva) (A); modification of samples wrapped in aluminium foil (foil) (B); modification that took place in an ambient atmosphere in the oven (oven) (C).
Forests 11 00666 g001
Figure 2. DVS sorption curves of European beech (FaSi) wood modified according to different procedures: Silavapro (Silva) (A); modification of samples wrapped in aluminium foil (foil) (B); modification that took place in an ambient atmosphere in the oven (oven) (C).
Forests 11 00666 g002
Figure 3. Correlation between mass loss of Norway spruce (A), European beech (B) and reference thermally treated spruce (C) wood after modification, and selected indicators derived from DVS analysis of modified wood.
Forests 11 00666 g003
Table 1. Characteristics of thermally modified wood. Standard deviations are displayed in parenthesis.
WoodTemperature (°C)ProcessMass Loss (%)Density (kg/m3)CIE Parameters
L*a*b*
SpruceControl/0.0432 (10)83.8 (1.3)6.5 (0.4)10.4 (0.4)
200Silvapro3.7 (0.2)383 (8)53.3 (1.7)9.6 (0.5)10.4 (0.4)
Al-foil2.7 (0.2)377 (4)59.1 (2.4)8.9 (0.5)11.3 (0.3)
Oven3.0 (0.3)400 (24)56.6 (1.8)9.0 (0.3)10.4 (0.4)
210Silvapro4.9 (0.3)410 (8)45.0 (3.5)10.7 (0.4)10.3 (0.4)
Al-foil3.8 (0.1)401 (5)51.9 (1.1)10.1 (0.3)11.5 (0.4)
Oven4.7 (0.3)376 (13)47.9 (6.5)9.9 (0.9)9.9 (0.4)
220Silvapro7.8 (0.2)384 (7)39.0 (3.9)10.3 (0.2)8.6 (1.0)
Al-foil6.5 (0.3)387 (7)47.5 (2.3)10.7 (0.4)10.6 (0.6)
Oven8.8 (1.0)420 (42)36.3 (5.2)10.3 (0.5)8.1 (1.4)
230Silvapro10.8 (1.0)347 (10)34.8 (2.9)10.1 (0.4)8.1 (0.9)
Al-foil8.2 (0.4)370 (8)42.0 (1.4)10.9 (0.0)10.1 (0.3)
Oven12.3 (1.2)393 (9)38.2 (5.4)10.2 (1.0)8.7 (1.9)
BeechControl/0.0690 (38)75.4 (1.7)6.5 (0.2)6.7 (0.4)
180Silvapro0.9 (0.0)734 (10)54.5 (1.7)8.0 (0.3)7.8 (0.2)
Al-foil0.5 (0.1)672 (9)62.0 (1.7)7.3 (0.4)8.6 (0.2)
Oven0.8 (0.1)714 (4)61.0 (3.1)6.7 (0.8)7.1 (0.5)
200Silvapro4.8 (0.6)729 (5)41.4 (2.4)9.4 (0.0)7.8 (0.4)
Al-foil4.0 (0.1)735 (12)45.3 (3.8)9.7 (0.4)9.1 (0.4)
Oven4.3 (0.5)720 (8)45.4 (3.6)9.2 (0.2)8.4 (0.4)
210Silvapro7.0 (0.5)717 (3)39.9 (1.7)9.2 (0.2)7.2 (0.4)
Al-foil7.6 (0.6)685 (5)36.9 (0.7)9.9 (0.0)7.5 (0.2)
Oven8.6 (0.4)702 (3)35.8 (1.9)8.9 (0.5)6.3 (1.0)
220Silvapro10.9 (0.3)704 (14)31.2 (2.1)7.7 (0.4)4.8 (0.5)
Al-foil12.4 (0.2)660 (8)32.1 (1.2)8.3 (0.3)5.5 (0.5)
Oven12.7 (0.8)719 (7)35.0 (2.4)8.6 (0.2)6.1 (0.6)
Spruce1601 bar2.3479 (2)76.5 (2.4)8.3 (0.3)10.7 (0.3)
2.1420 (2)73.2 (0.9)8.3 (0.7)10.9 (0.4)
3 bar2.8437 (7)65.7 (2.5)9.0 (1.0)11.4 (1.0)
3.4396 (8)66.7 (0.8)9.0 (0.5)11.3 (0.0)
1708 bar10.3396 (7)49.1 (2.4)10.2 (0.8)9.9 (0.5)
10.8397 (10)45.5 (1.6)10.9 (0.4)9.9 (0.0)
Table 2. Influence of thermal modification procedures on factors derived from DVS analysis: maximum equilibrium moisture content (EMC95% RH), time to reach equilibrium moisture content (t95% RH), time to reach half value of the equilibrium moisture content (tEMC/2), time required to reach 10% moisture content (t10% MC) and factor c derived from logarithmic function y = c × ln(x) + b.
WoodTemperature (°C)ProcessEMC95% RH
(%)
t95% RH
(min)
tEMC/2
(min)
t10% MC
(min)
Factor c
SpruceControl/21.753221.718.34.09
200Silvapro15.634615.928.42.76
Al-foil16.750119.630.53.02
Oven16.626514.621.72.94
210Silvapro14.827914.630.52.61
Al-foil16.143814.925.12.74
Oven14.834015.231.52.60
220Silvapro14.239614.635.22.38
Al-foil13.843415.241.02.34
Oven13.743016.945.42.42
230Silvapro12.325911.243.31.98
Al-foil12.524511.543.72.09
Oven13.130012.238.62.16
BeechControl/22.148825.721.04.23
180Silvapro19.062726.429.83.48
Al-foil18.845825.429.13.57
Oven20.160626.125.43.70
200Silvapro13.540918.655.52.34
Al-foil15.250422.044.02.71
Oven15.748821.340.02.78
210Silvapro12.543618.372.82.13
Al-foil11.541615.6101.91.88
Oven12.845118.369.72.17
220Silvapro12.030515.274.52.07
Al-foil11.135315.9117.11.86
Oven11.437515.2100.61.86
Spruce1601 bar20.34339.89.52.99
20.74638.88.52.90
3 bar19.54737.88.12.63
18.44886.88.52.30
1708 bar11.31833.120.31.19
10.42303.754.51.04
Table 3. Pearson correlation coefficients (r) between mass loss (MLTM) of Norway spruce and European beech wood after modification, and selected indicators derived from DVS analysis, density and colour (CIEL*a*b* analysis) of modified wood. For validation, wood modified in the closed system was also analysed (Spruce UG). p indicates the statistical significance of correlations.
IndicatorSpruceBeechSpruce UG
rprprp
EMC95% RH−0.870.0001−0.92<0.0001−0.77<0.0001
t95% RH−0.510.0749−0.800.0010−0.970.0003
tEMC/2−0.760.0026−0.94<0.00010.730.0434
t10% MC0.850.00020.93<0.0001−1.000.0643
c−0.870.0001−0.91<0.0001−0.99<0.0001
Density−0.440.1366−0.220.5073−0.600.1475
L*−0.88<0.0001−0.90<0.0001−0.970.0003
a*0.680.01110.410.16140.920.0032
b*−0.770.0020−0.670.0114−0.680.0931

