Article

Leachability and Decay Resistance of Wood Polyesterified with Sorbitol and Citric Acid

Norwegian Institute of Bioeconomy Research (NIBIO), PO Box 115, NO-1431 Ås, Norway
Forests 2020, 11(6), 650; https://doi.org/10.3390/f11060650
Submission received: 10 May 2020 / Revised: 2 June 2020 / Accepted: 4 June 2020 / Published: 6 June 2020

Abstract

:
Research Highlights: Polyesterification of wood with sorbitol and citric acid (SCA) increases decay resistance against brown-rot and white-rot fungi without reducing cell wall moisture content but the SCA polymer is susceptible to hydrolysis. Background and Objectives: SCA polyesterification is a low-cost, bio-based chemical wood modification system with potential for commercialisation. Materials and Methods: This study investigates moisture-related properties and decay resistance in SCA-modified wood. Scots pine sapwood was polyesterified at 140 °C with various SCA solution concentrations ranging from 14–56% w/w. Dimensional stability was assessed and leachates were analysed with high-performance liquid chromatography (HPLC). Chemical changes were characterized with attenuated total reflection Fourier-transform infrared spectroscopy (ATR-FTIR) and spectra were quantitatively compared with peak ratios. Low-field nuclear magnetic resonance (LFNMR) relaxometry was used to assess water saturated samples and decay resistance was determined with a modified EN113 test. Results: Anti-swelling efficiency (ASE) ranged from 23–43% and decreased at higher weight percentage gains (WPG). Reduced ASE at higher WPG resulted from increased water saturated volumes for higher treatment levels. HPLC analysis of leachates showed detectable citric acid levels even after an EN84 leaching procedure. ATR-FTIR analysis indicated increased ester content in the SCA-modified samples and decreased hydroxyl content compared to controls. Cell wall water assessed by non-freezing moisture content determined with LFNMR was found to increase because of the modification. SCA-modified samples resisted brown-rot and white-rot decay, with a potential decay threshold of 50% WPG. Sterile reference samples incubated without fungi revealed substantial mass loss due to leaching of the samples in a high humidity environment. The susceptibility of the SCA polymer to hydrolysis was confirmed by analysing the sorption behaviour of the pure polymer in a dynamic vapour sorption apparatus. Conclusions: SCA wood modification is an effective means for imparting decay resistance but, using the curing parameters in the current study, prolonged low-level leaching due to hydrolysis of the SCA polymer remains a problem.

1. Introduction

Susceptibility of wood to fungal degradation shortens service life and is one of the primary factors limiting the use of wood in constructions today. Traditionally, biodegradation has been mitigated by treatments with biocides, but the use of these chemicals is increasingly restricted due to environmental and health concerns [1]. Alternatively, resistance to fungal decay can be improved by chemical wood modification, which by definition is a wood protection system using a nontoxic mode of action [2]. Although commercial chemical modification processes such as thermal modification, acetylation and furfurylation are gaining market share [3,4], growth is constrained by higher production costs compared to traditional wood preservation methods. Thus, a low-cost wood protection system with a non-toxic mode of action is needed.
Polyesterification of bio-based chemicals in wood as an impregnation chemical modification technique is a field which has been gaining research attention over the past decade [5,6,7,8,9,10,11,12,13]. One promising method utilising relatively low-cost chemicals is polyesterification using sorbitol and citric acid (SCA) [14,15]. The uncatalyzed reaction of citric acid with alcohols or polyols is thought to proceed through a cyclic anhydride intermediate formed by dehydration of the citric acid (Figure 1a,b) which then reacts with a hydroxyl group in the alcohol/polyol (Figure 1c) to form an ester (Figure 1d) [16]. Doll et al. [17] proposed that the polymerization reaction for citric acid and sorbitol continues by further condensation reactions in the initial ester to form an additional cyclic anhydride (Figure 1e) and/or anhydrosorbitol ring (Figure 1f) and then further condensation reactions with hydroxyl groups form a polyester. Centolella and Razor [18] demonstrated the formation of a polyester from citric acid and sorbitol for use as an additive in food products. SCA polyesters have also been explored for application as controlled release hydrogels [19], biomedical tissue scaffolds [20], antiscalants in detergents [21] and surface coatings [22].
Research into the use of SCA polyesters for impregnation chemical wood modification is more limited. Kiljunen et al. [23] mention the combination of citric acid and sorbitol, along with many other water soluble reagents, in their patent on wood impregnation with polyols and crosslinking agents containing carboxyl groups. They used a curing temperature of 120 °C and sodium hypophosphite as a catalyst to obtain SCA-modified wood with weight percentage gains (WPG) in the range of 9–18% after leaching. Recently, Larnøy et al. [14] used higher solution concentrations without a catalyst and showed that SCA-modified Scots pine cured at 140 °C was resistant to leaching of reactant chemicals and hindered fungal growth from brown-rot, white-rot and mould fungi. Mubarok et al. [15] tested two curing temperatures, 140 and 160 °C, and various SCA solution concentrations for the modification of European beech wood. They also demonstrated increased decay resistance of the modified wood and showed that SCA modification lowered thermal decomposition temperature, suggesting the modified wood has fire retardant properties. Furthermore, they showed that the treatment solution was stable up to four months, indicating the impregnation solution would be reusable in an industrial application. These properties make SCA wood modification an attractive technique for upscaling and commercialisation.
Like other wood modification techniques, the non-toxic decay resistance imparted by SCA modification is likely linked to wood moisture content reduction. In order to metabolise wood, decay fungi require cell wall moisture to function as a transport medium for secreted compounds/enzymes and as a reactant in hydrolytic saccharification [24,25]. Although the exact mechanism behind enhanced decay resistance in modified wood remains unclear, it is generally acknowledged that a critical contributing factor is exclusion of water from the wood cell wall [26,27,28,29]. Thermal modification reduces water uptake by degrading hydrophilic hemicellulose [30] and crosslinking wood polymers, preventing them from expanding to accommodate water molecules [31]. Bulking cell wall modifications, like acetylation, reduce cell wall moisture content by replacing hydroxyl groups with less hydrophilic acetyl groups [32,33,34] and filling the cell wall with physically larger chemical groups [35,36]. Impregnation chemical modifications, like furfurylation, polymerise chemicals within the cell wall where they block space available for water molecules [37,38]. This same space-filling mechanism should also reduce cell wall moisture content in SCA-modified wood. However, in addition to bulking the cell wall, the SCA polymer will also introduce unreacted hydroxyl groups which can serve as additional sorption sites for water molecules (Figure 1). This is like the situation for wood modified with 1,3-dimethylol-4,5-dihydroxyethyleneurea (DMDHEU) which bulks the cell wall and crosslinks the wood polymers but also adds hydroxyl groups in the crosslinking agent [39,40,41]. This interplay between cell wall bulking and addition of hydroxyl groups in the modification polymer makes SCA-modified wood an interesting material for exploring wood–water interactions and their relevance for fungal decay.
The goal of this study is to investigate the leachability and decay resistance of SCA-modified wood. Scots pine sapwood is SCA modified at 140 °C and dimensional stability is determined. Leachates are analysed with HPLC and the effect of leaching on chemical composition is assessed with attenuated total reflectance Fourier transform infrared spectroscopy (ATR-FTIR). Water-saturated samples are characterised with low-field nuclear magnetic resonance (LFNMR) and finally decay resistance against brown-rot and white-rot fungi is demonstrated.

2. Materials and Methods

2.1. Sample Preparation and Treatment

Defect-free Scots pine (Pinus sylvestris) sapwood was conditioned at 20 °C/65% relative humidity (RH) and cut to dimensions specified in Table 1 for the various analyses. The samples were treated using different concentrations of a sorbitol and citric acid stock solution. The stock solution (pH 2, density = 1.28 g/cm−3) was prepared from powdered citric acid (VWR Chemicals, CAS 77-92-9) and D-Sorbitol (Ecogreen Oleochemicals GmbH, CAS 50-70-4) in a 3:1 molar ratio of citric acid to sorbitol. The solids were dissolved in deionised water at room temperature to make a stock solution of 56% w/w concentration. The stock solution was then diluted to the concentrations listed in Table 1. Only 31% and 39% solution concentrations were chosen for ATR-FTIR, LFNMR and leachate analysis because preliminary decay trials indicated the limit for protection was in this range.
For treatment, the samples were impregnated with the specified concentration of solution by performing a 30-min pre-vacuum of 40 mbar followed by a 2-h pressure phase at 8 bars. The samples were then cured for 18 h at 140 °C and leached according to EN 84 [42]. Control samples were impregnated with water and subjected to the same curing procedure as the treated samples, except for control samples for the decay tests which received no treatment.

2.2. Dimensions Analysis

Samples for dimensional measurements were oven dried at 103 °C for 18 h then stored in a desiccator for half an hour before they were weighed on a Mettler Toledo scale ME303 (1 mg accuracy) and all three dimensions were measured using a MITOTOYO Absolute 543-460B digimatic indicator (0.001 mm accuracy). The samples were marked such that the same spot would be used for measuring dimensions throughout the experiment. The samples were then treated as described above and leached according to EN 84. The samples were then submerged in deionised water, held down under weights and a 2 kPa vacuum was applied for 1 h. The vacuum was removed, and the samples were left for 24 h before their weights and dimensions were obtained in the water saturated state. Lastly, the samples were dried again at 103 °C for 18 h and dimensions and weights were obtained.
The bulking coefficients (BC) and anti-swelling efficiencies (ASE) of the modified samples were calculated as follows:
B C = V m , d V u , d V u , d 100 %
A S E = V u , w V u , d V m , w V m , d V u , w V u , d 100 %
where V represents volume and the indices m, u, d and w represent modified, unmodified, dry and wet, respectively.

2.3. Analysis of Leachate

Leachates from the EN 84 procedure were analysed for the 10 × 5 × 5 mm samples used for ATR-FTIR and LFNMR analysis. The samples were leached individually in 2 mL Eppendorf tubes in five times the wood volume of deionised water, i.e., 1.25 mL [42]. The wood samples were removed and moved to new Eppendorf tubes between water changes to minimize water loss. The procedure specifies 10 water changes over the course of 14 days, the first 2 h after vacuum impregnation, the second and third after 24 and 48 h, respectively, and thereafter seven more changes not less than one day and not more than three days apart. To simplify comparison, only leachates in which the wood sample had been submerged for one day were analysed with HPLC. Additionally, an 11th leachate in which the samples had been submerged seven days and a 12th leachate of 21 days were included.
Leachates were analysed on an Agilent 1260 Infinity II LC with IR detector and variable wavelength UV detector (Agilent Technologies, Palo Alto, CA, USA). A mobile phase of 5 mM sulfuric acid was used with a 0.6 mL min−1 flow rate. An Aminex HPX-87H column (Bio-Rad, Hercules, CA, USA) was used at 50 °C and the injection volume was 20 µL per sample. Calibration curves were generated for both citric acid and sorbitol using six standard solutions of known concentration.

2.4. Attenuated Total Reflectance Fourier Transform Infrared (ATR-FTIR) Spectroscopy

To reduce the impact of oven drying on sample chemistry, dry weights for the samples used for ATR-FTIR and LFNMR analysis were obtained by vacuum drying at 60 °C with a 2 kPa vacuum for 36 h. These samples were measured with ATR-FTIR after treatment, prior to leaching and again after leaching according to EN 84 with an additional 11th leaching of seven days. The samples were vacuum dried and placed over molecular sieves for 30 min before the analysis. Samples were measured on the tangential face at the same position for both measurements before and after leaching. In addition to the wood samples, pure SCA polymer was measured. The stock solution was cured at 140 °C for 18 h and then pulverized with a mortar and pestle. The powder was vacuum dried under the same conditions as the wood samples and measured on the ATR-FTIR after 30 min over molecular sieves.
ATR-FTIR measurements were performed using a Bruker Tensor 27 FTIR with platinum ATR accessory (Bruker, Billerica, MA, USA). Spectra were obtained for each specimen with a spectral range from 4000 to 600 cm−1 using a resolution of 4 cm−1 and 64 scans (128 scans for background). To view the spectra, they were baseline corrected using the OPUS 7.5 software (Bruker, Billerica, MA, USA). First, junk data between 2500 and 1900 cm−1 was replaced with a straight line. Then concave rubberband correction was performed with 64 baseline points and 10 iterations, excluding CO2 bands. Each baseline-corrected spectra were then normalized to its standard deviation.
Three characteristic absorbance peaks were chosen for peak ratio analysis. The peak at 1508 cm−1 is attributed to aromatic skeletal vibrations in lignin [43,44,45]. The proposed mechanism for polymerisation of sorbitol and citric acid (Figure 1) does not include the formation aromatic structures and the reaction is unlikely to affect the aromaticity of lignin. Thus, this peak was used as a reference to which two other peaks affected by polyesterification were compared—the peak at 1730 cm−1, assigned to C=O stretch in ester groups [43,44,45] and the broad peak from 3400 to 3250 cm−1 assigned to hydroxyl group vibrations [43,44,45]. For peak ratio analysis, unmanipulated spectra (no baseline correction) were imported into R Studio (R Studio, Inc., Boston, MA, USA) and the areas for the three peaks of interest were calculated by trapezoidal integration using an individual linear baseline for each peak.

2.5. Low-Field Nuclear Magnetic Resonance Relaxometry

LFNMR is a rapid, non-destructive technique that can characterise moisture in wood. Hydrogen nuclei in water molecules are excited by a radio frequency pulse and their relaxation time, i.e., the time it takes them to return to their ground state, is measured. In porous media, the relaxation time of water molecules depends on both the size of the pores containing the water and the chemical interaction between the water and the pore wall [46]. In a Carr–Purcell Meiboom–Gill (CPMG) experiment, T2 relaxation time is measured and water saturated wood samples exhibit 3–4 water populations with distinct T2 values [47,48,49,50,51,52]. One population is attributed to water within the cell wall and the 2–3 other populations arise from free water within the wood void structure. When the decay signal from the CPMG experiment is transformed into a continuous distribution of T2 relaxation times, these various water populations are represented as peaks.
The four samples used for leachate analysis were also measured with LFNMR using a Bruker mq20 minispec with 0.47 T permanent magnet (Bruker, Billerica, MA, USA). The water saturated samples were removed from the 12th leachate and dabbed on a dry paper towel to remove surface water. They were then placed in pre-weighed glass NMR tubes and the wet mass of the sample was recorded. A Teflon rod with dimensions that filled the remaining air space in the tube was inserted to reduce evaporation of water from the samples over the course of the measurement. The temperature of the probe region was stabilised at 22 °C using a BVT 3000 nitrogen temperature control unit (Bruker, Billerica, MA, USA). A CPMG pulse sequence [53,54] was used to measure the spin–spin relaxation time (T2) of the samples with a pulse separation (τ) of 0.04 ms, 500 echoes, 32 scans and a recycle delay of 10 s. The gain was tuned individually for each sample. The first 200 echoes were spaced with a separation of 2τ. The last 300 were spaced in a geometric progression with first term 2τ and 1.02 as the common ratio. After the room temperature measurement was finished, the samples were removed from the instrument in their glass tubes and immediately placed in a freezer at −22 °C. The samples were equilibrated at −22 °C for 18 h and then measured again in the LFNMR. The instrument temperature was set to −22 °C and the samples were allowed 5 min to equilibrate in the probe region before starting the measurement. The pulse separation was again 0.04 ms and 32 scans were used. The recycle delay was increased to 30 s and only 200 echoes (2τ separation) were used to minimize heat accumulation over the course of the measurement. However, the measurement still captured the full relaxation of all components due to the freezing of water with longer relaxation times. The gain used for each sample was the same as the gain for the room temperature measurement.
Because of slight misalignment in the 180° pulse [55], the first ten odd-numbered echoes were removed from the decay curve datasets before transforming the data. The curves were then transformed into a continuous distribution of relaxation components by continuous non-negative least squares (NNLS) fitting [56,57] using MATLAB code provided by Prof. P. Callaghan. The minimum and maximum values for the distribution were set to 0.08 and 1500 ms, respectively, and 189 data points were determined. The smoothing parameter, α, was set to 109. Peak area and T2 values corresponding to maximum peak intensity were determined for each peak using R Studio code.
The non-freezing moisture content was calculated using the area of the frozen peak relative to the total area of all the room temperature peaks [48]. At −22 °C, free water in the samples will be frozen and, thus, relaxes too quickly to be detected with the CPMG measurement. Therefore, the −22 °C signal arises only from water which is bound to wood polymers, the modification polymer or is physically constrained in pores small enough to prevent it from freezing. The magnitude of NMR signal intensity is inversely proportional to temperature. Therefore, to compare the room temperature and frozen measurements, the frozen signal was scaled by a factor of Tfz/Trt, where T is the temperature in Kelvin and the indices rt and fz represent room temperature and freezing temperature, respectively [49]. The non-freezing moisture content (MCnf) was then calculated relative to the unreacted wood mass as follows:
M C n f = M C t o t ( S t o t , f z ( T f z T r t ) S t o t , r t )
where MCtot is total moisture content obtained gravimetrically on an unreacted wood mass basis, Stot,fz is the total frozen peak area (au), Tfz/Trt is the temperature scaling factor mentioned previously and Stot,rt is the total peak area measured at room temperature (au).

2.6. Decay Test

A modified EN113 [58] fungal decay test was performed as in Larnøy et al. [14]. The leached samples were exposed to the brown-rot fungus Rhodonia placenta strain FPRL 280 and the white-rot fungus Trametes versicolor strain CTB 863 A. Deviations from the EN113 standard included smaller sample dimensions (Table 1) modelled after the Bravery mini block test [59] and a shorter incubation time of 8 instead of 16 weeks. The samples were autoclaved for 20 min at 121 °C for sterilisation and placed on sterile plastic netting in petri dishes over 4% (w/v) malt agar, two wood specimens of the same treatment per dish. The middle of each dish was inoculated with a malt agar plug of actively growing mycelia. The petri dishes were then incubated in a sterile climate chamber at 70 ± 5% RH and 22 ± 2 °C. In addition to the samples exposed to fungi, four samples of each treatment level were placed in sterile petri dishes over malt agar without fungal inoculum. The mean percentage mass loss of these samples after eight weeks was used as a correction value and subtracted from mass loss of the corresponding treatment level to obtain mass loss due to fungal degradation.

2.7. Preliminary Sorption Experiments

An attempt was made to determine the hydroxyl accessibility of SCA-modified wood by gravimetric deuterium exchange [60,61]. This method involves conditioning a hygroscopic sample in deuterium oxide (D2O). Hydroxyl groups in the sample which interact with the D2O vapour will exchange their hydrogen with heavier deuterium. By determining the difference in dry mass of the sample before and after conditioning, one can calculate the moles of accessible hydroxyl groups in the sample from the difference in the molar mass of hydrogen and deuterium. For untreated, acetylated and furfurylated wood, a 10-hour D2O conditioning period is sufficient for the samples to reach equilibrium [32,35,36,38,62]. However, preliminary trials with SCA-modified wood showed sample mass had not stabilised after 10 h of D2O conditioning. Pure SCA polymer was thus tested to gauge the necessary conditioning period for the polymer itself. Drying and conditioning periods were increased to 48 h for the pure SCA sample, but the powder changed phase from solid to liquid in the 95% RH atmosphere during D2O conditioning. This measurement was performed at 25 °C on a dynamic vapour sorption (DVS) Intrinsic instrument (Surface Measurement Systems Ltd., London, UK). An adsorption isotherm measurement was also performed with the solid SCA powder using four RH steps (0%, 30%, 60%, and 95%) at 25 °C. This measurement was performed on a DVS Advantage (Surface Measurement Systems Ltd., London, UK).

3. Results

3.1. Dimensions Analysis

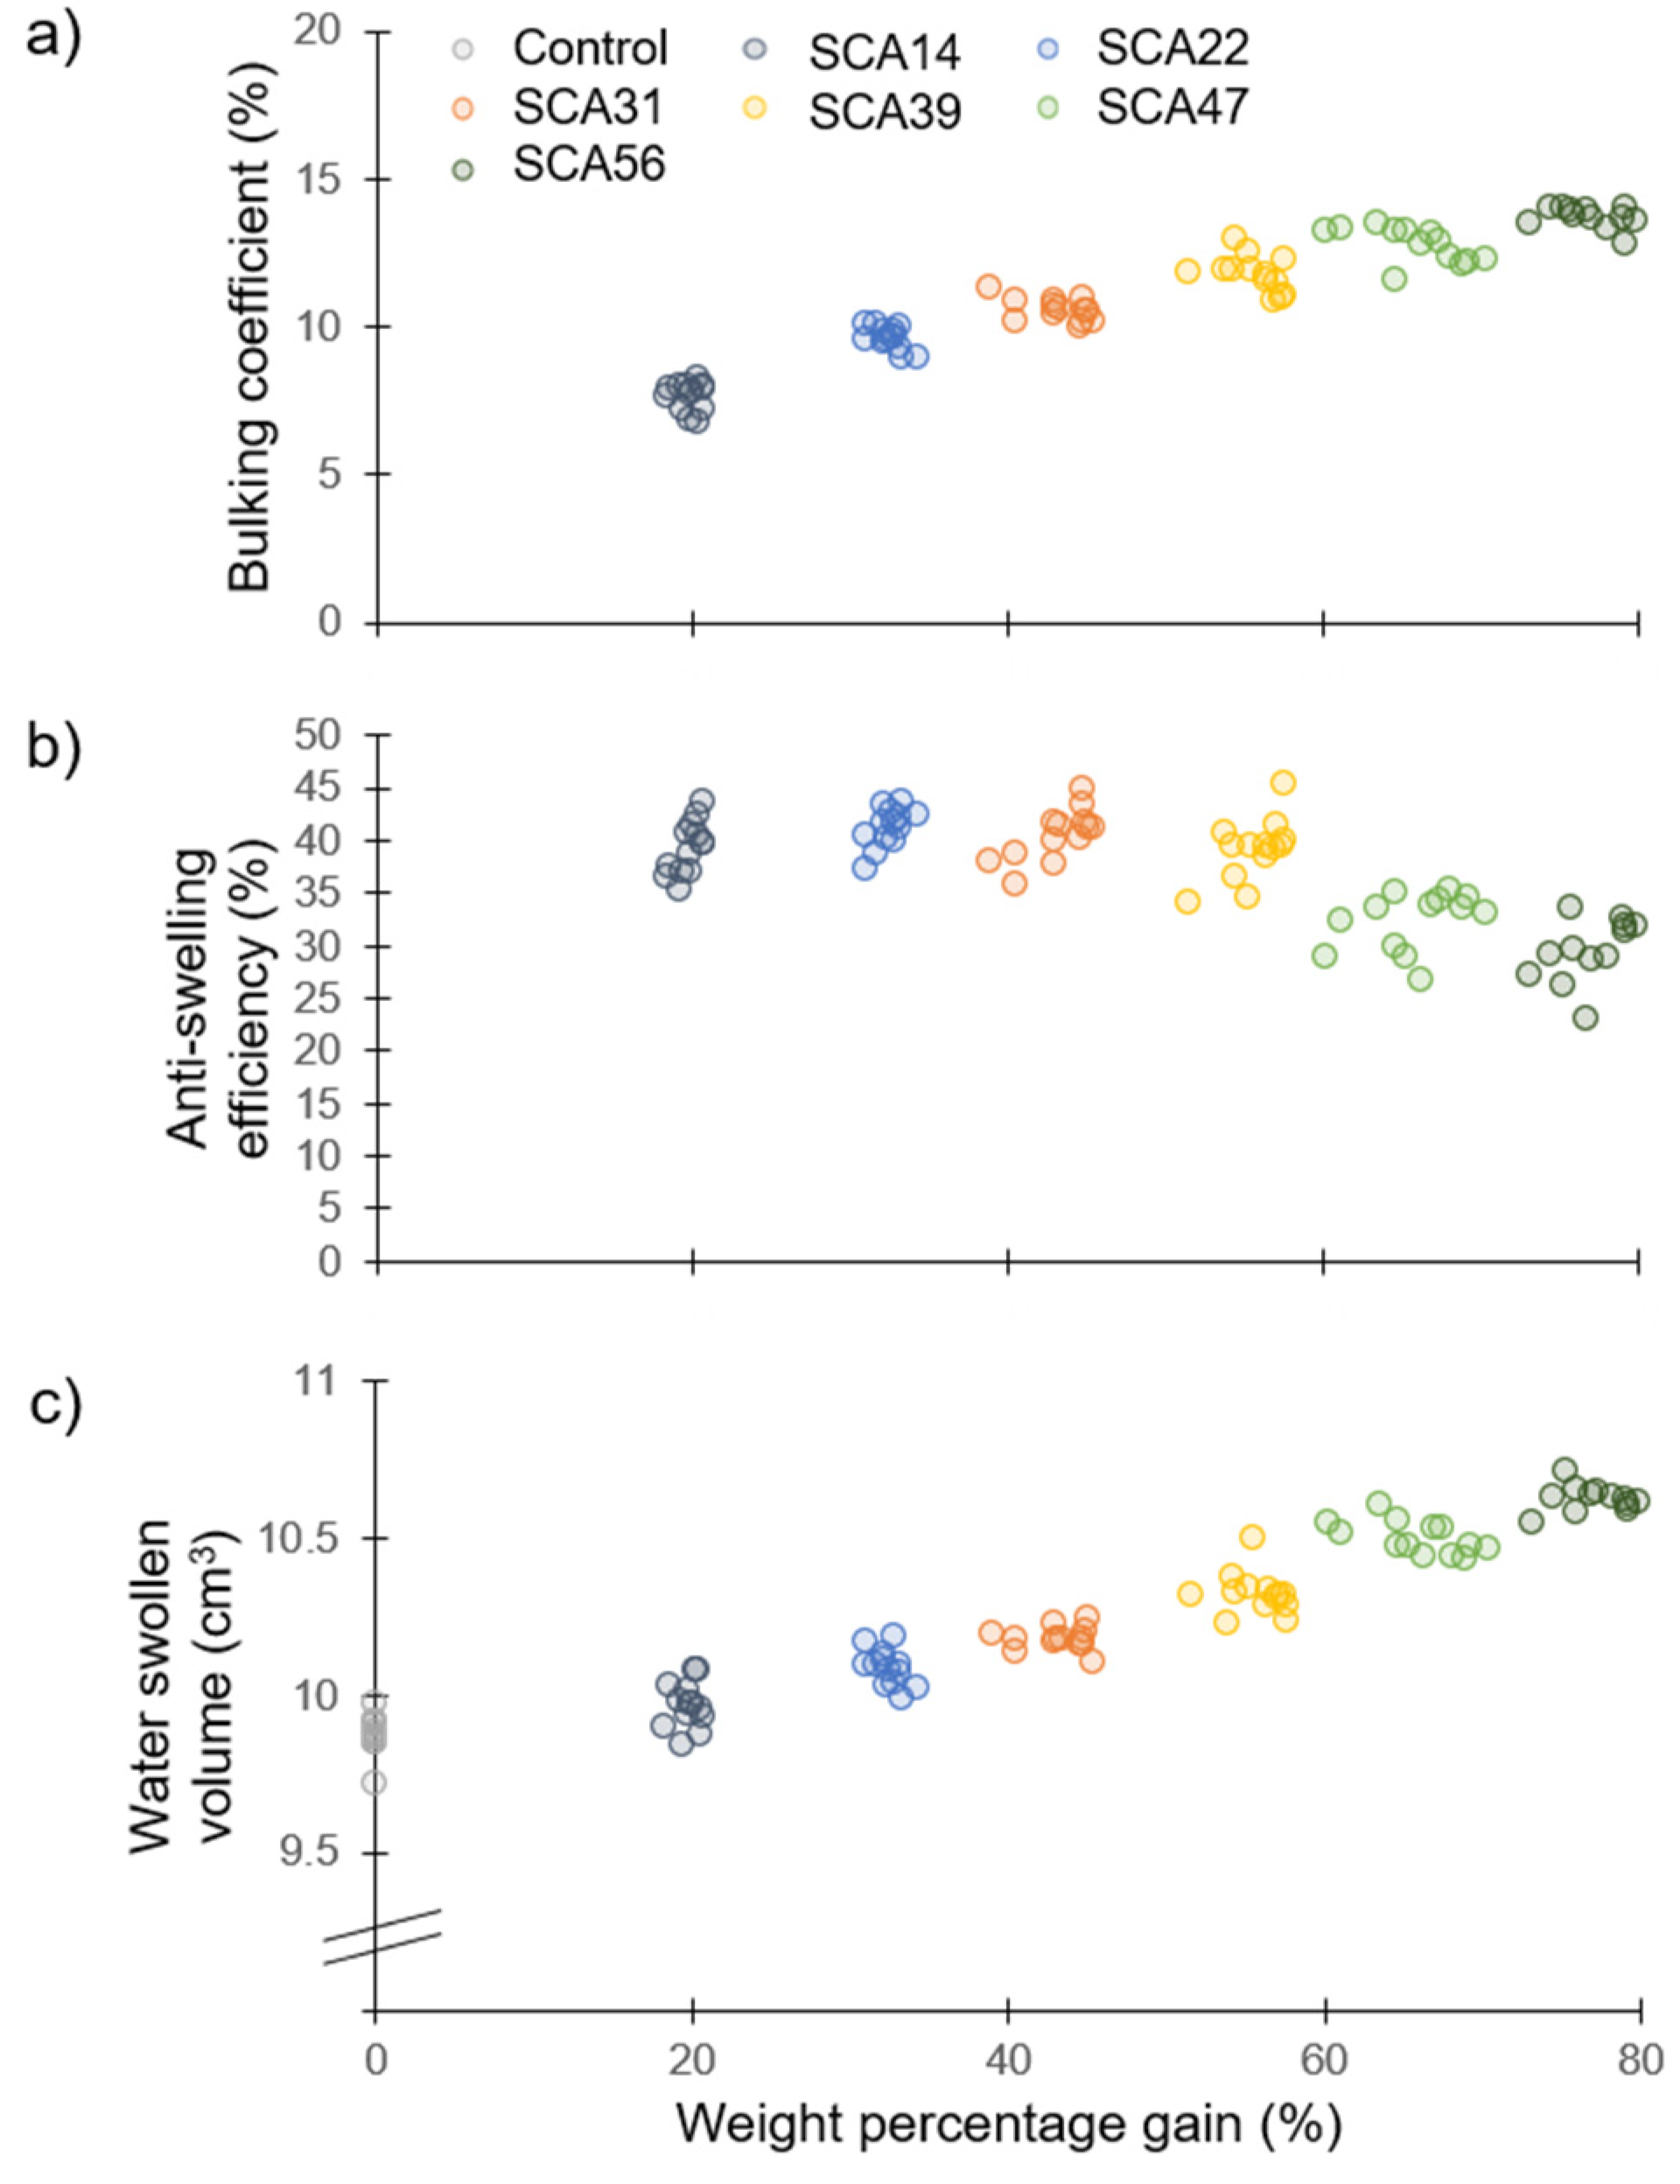
Results from the dimension measurements are presented in Figure 2. The bulking coefficients ranged from 7–14%, showing a positive correlation with WPG (Figure 2a). This suggests higher WPGs lead to greater penetration of the polymerized chemicals within the wood cell wall which restrict the cell wall matrix from shrinking to its original volume in the dry state. ASE ranged from 23–43% and remained stable with increasing WPG until 50% WPG (Figure 2b). WPGs higher than 50% tended to decrease ASE. The ASE is calculated from the ratio of water swollen volume to dry volume (Equation (2)). A comparison of the water swollen volume of the samples (Figure 2c) shows that higher WPGs led to greater water swollen volume. Decreased ASE at higher WPG is the result of this increased water swollen volume.

3.2. Analysis of Leachate

After the EN84 leaching test with additional 11th leachate, the mass loss values for SCA31 and SCA39 were 1.7% ± 0.2 and 1.3% ± 0.3, respectively. After the 12th leachate of 21 days, cumulative mass loss for SCA31 and SCA39 increased to 3.0% ± 0.2 and 2.9% ± 0.1, respectively. No sorbitol or citric acid was found in the leachate of the control samples. The sorbitol and citric acid concentrations for the leachates of the SCA-modified samples are summarised in Table 2. The only samples with detectable amounts of sorbitol were from the 2nd leachate. Thus, all detectable sorbitol was leached from the samples after only two changes of water. Citric acid was present in all the leachates for both modifications and the two modifications showed similar values of citric acid concentration for a given leachate. Higher numbered leachates had lower citric acid concentrations for samples which remained in the leachate for one day. However, with longer periods in the leachate, levels of citric acid continued to increase even after 10 changes of water. The 21 day 12th leachate reached citric acid concentrations similar to those of the 2nd leachate.
Although no sorbitol was detected in leachates after the second water change, the IR chromatograms showed a large peak with a slightly longer retention time than sorbitol. The corresponding retention time in the UV chromatogram also gave a large signal, suggesting the presence of double bonds in the molecule. Thus, this leached molecule may be a product of initial SCA polymerisation reactions, such as the ester formed in Figure 1d. However, additional analyses, such as mass spectrometry, are needed to conclusively identify the molecule.

3.3. Attenuated Total Reflectance Fourier Transform Infrared Spectroscopy

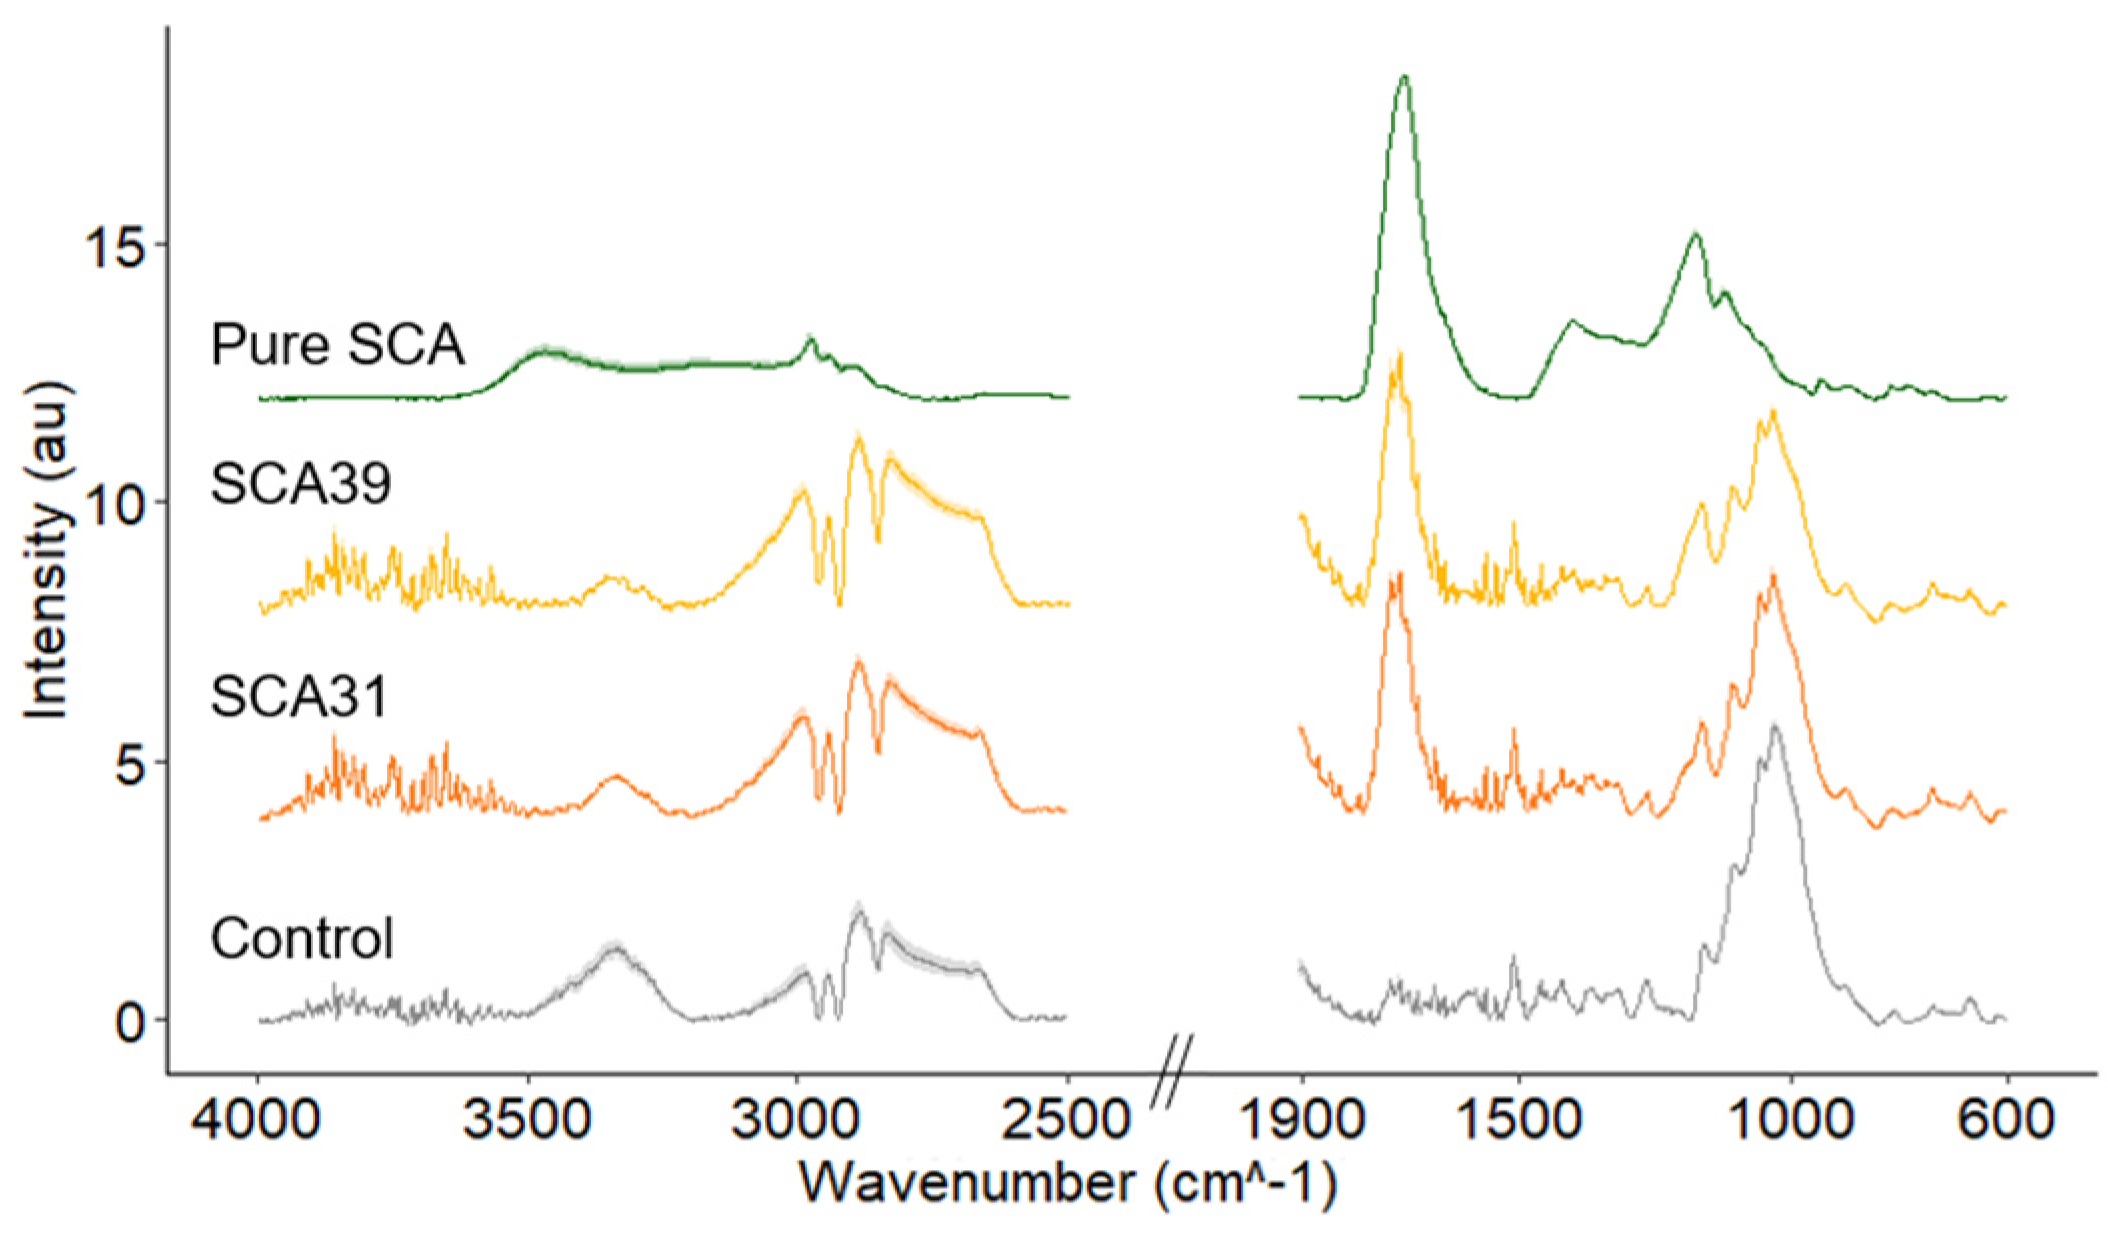
ATR-FTIR spectra prior to leaching are shown in Figure 3. The pure SCA polymer spectra contains a large peak at 1730 cm−1, assigned to C=O stretch in ester groups [43,44,45]. The same peak is visible in the SCA31 and SCA39 spectra, indicating the formation of ester bonds in the SCA-modified wood. The lignin peak at 1508 cm−1 appears to be unchanged by the modification while the broad hydroxyl peak at 3350 cm−1 is reduced in SCA31 and SCA39 compared to the control samples.
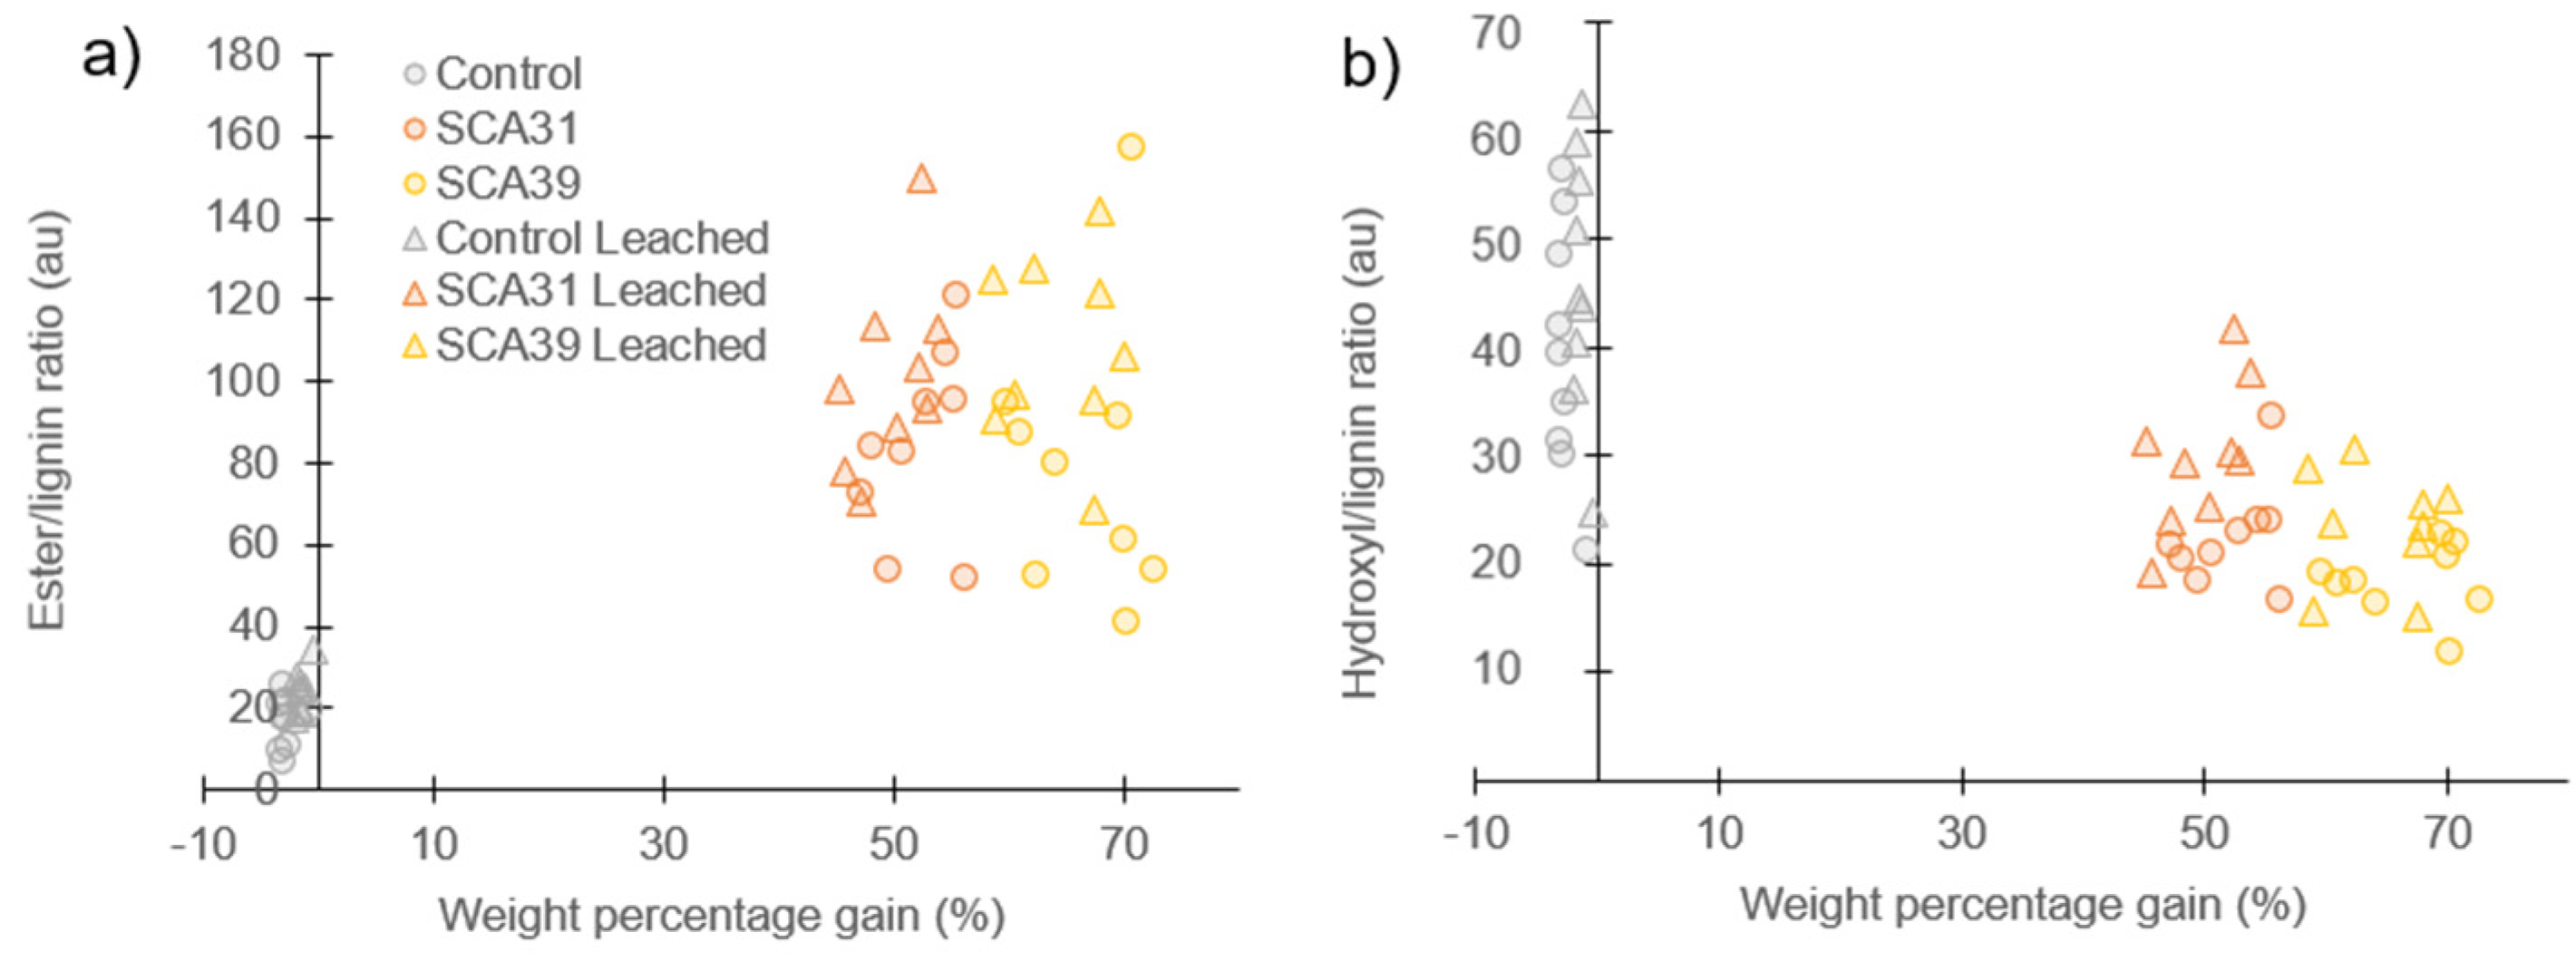
Peak area ratios were used to quantitatively compare the ATR-FTIR results for control and modified samples before and after leaching (Figure 4). The plot of ester/lignin peak ratios (Figure 4a) clearly shows the increase in ester groups in SCA-modified wood compared to controls, both before and after leaching. However, linear regression models gave poor correlations between WPG and ester/lignin ratio (non-leached R2 = 0.60, leached R2 = 0.81). Furthermore, a paired t-test between ester/lignin values before and after leaching for SCA31- and SCA39-modified samples showed an insignificant effect of leaching (p > 0.05). Although leaching led to 1.7% ± 0.2 and 1.3% ± 0.3 mass loss for SCA31 and SCA39, respectively, this does not appear to have affected the intensity of the ester peak in the ATR-FTIR spectrum.
SCA modification reduced the hydroxyl/lignin peak ratio compared to control samples (Figure 4b). Furthermore, the modification reduced the spread in hydroxyl/lignin ratio values. In contrast to the ester/lignin ratio, the effect of leaching on the hydroxyl/lignin ratio in SCA-modified samples was significant, with paired t-tests for SCA31 and SCA39 giving p-values of 0.02 and 0.03, respectively. Leaching significantly increased the hydroxyl content measure by ATR-FTIR peak ratios in modified samples.

3.4. Low-Field Nuclear Magnetic Resonance Relaxometry

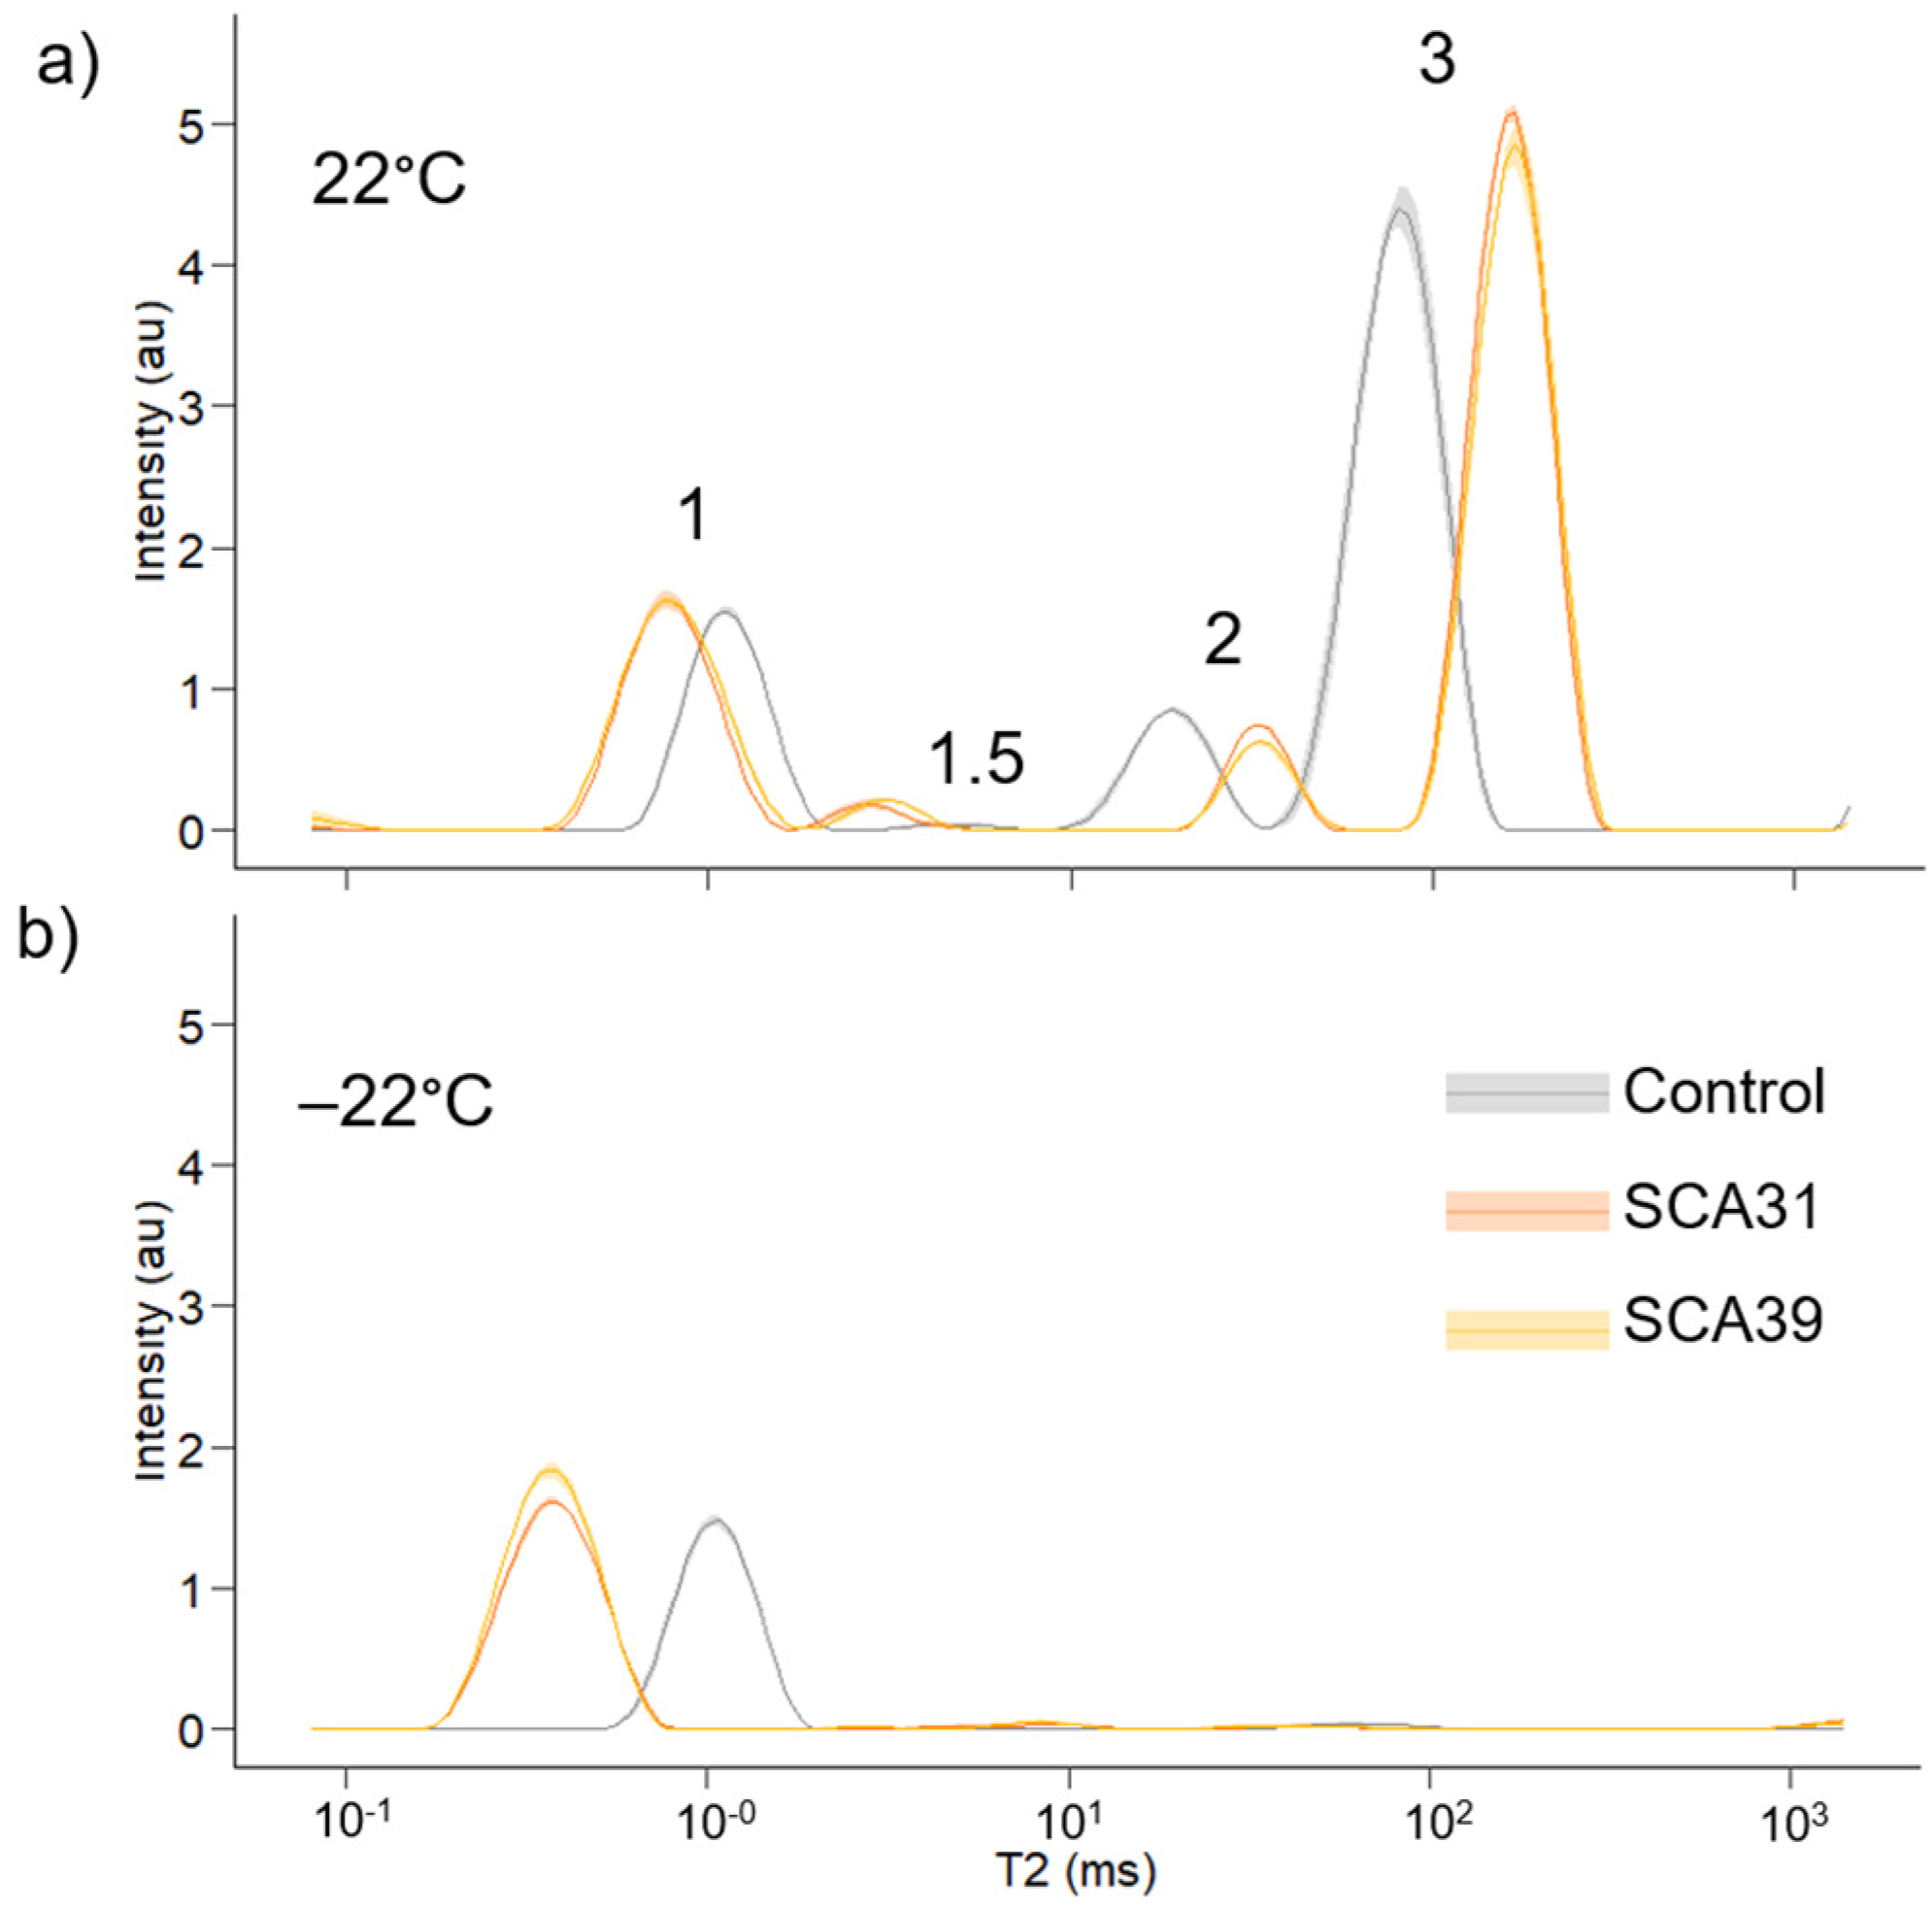
Figure 5 shows LFNMR spectra for control, SCA31 and SCA39 samples measured at 22 °C and −22 °C. Peak maximum T2 values and relative peak areas for samples measured at 22 °C are summarized in Table 3. Table 4 shows the peak maximum T2 values and non-freezing moisture content relative to unreacted wood mass for samples measured at −22 °C.
Three main peaks (peaks 1, 2 and 3, Figure 5a) were determined during the 22 °C LFNMR measurement. A smaller peak (peak 1.5) appeared in all SCA-modified samples and all but one control. SCA modification decreased T2 values for peaks 1 and 1.5 but increased T2 values for peaks 2 and 3 (Table 4, Figure 5a). The modified samples showed higher relative peak areas for peaks 1 and 1.5 and lower relative area for peak 2, while relative peak area for peak 3 was not substantially affected by the modification (Table 4).
At −22 °C peak 1 T2 values for modified samples were reduced more than control samples compared to the 22 °C measurement, resulting in an even greater total difference in T2 values between modified and control samples at −22 °C. Non-freezing moisture content was calculated according to Equation (3) and expresses the mass of non-freezing water relative to the unreacted wood mass. SCA modification increased the non-freezing moisture content compared with control samples.

3.5. Decay Test

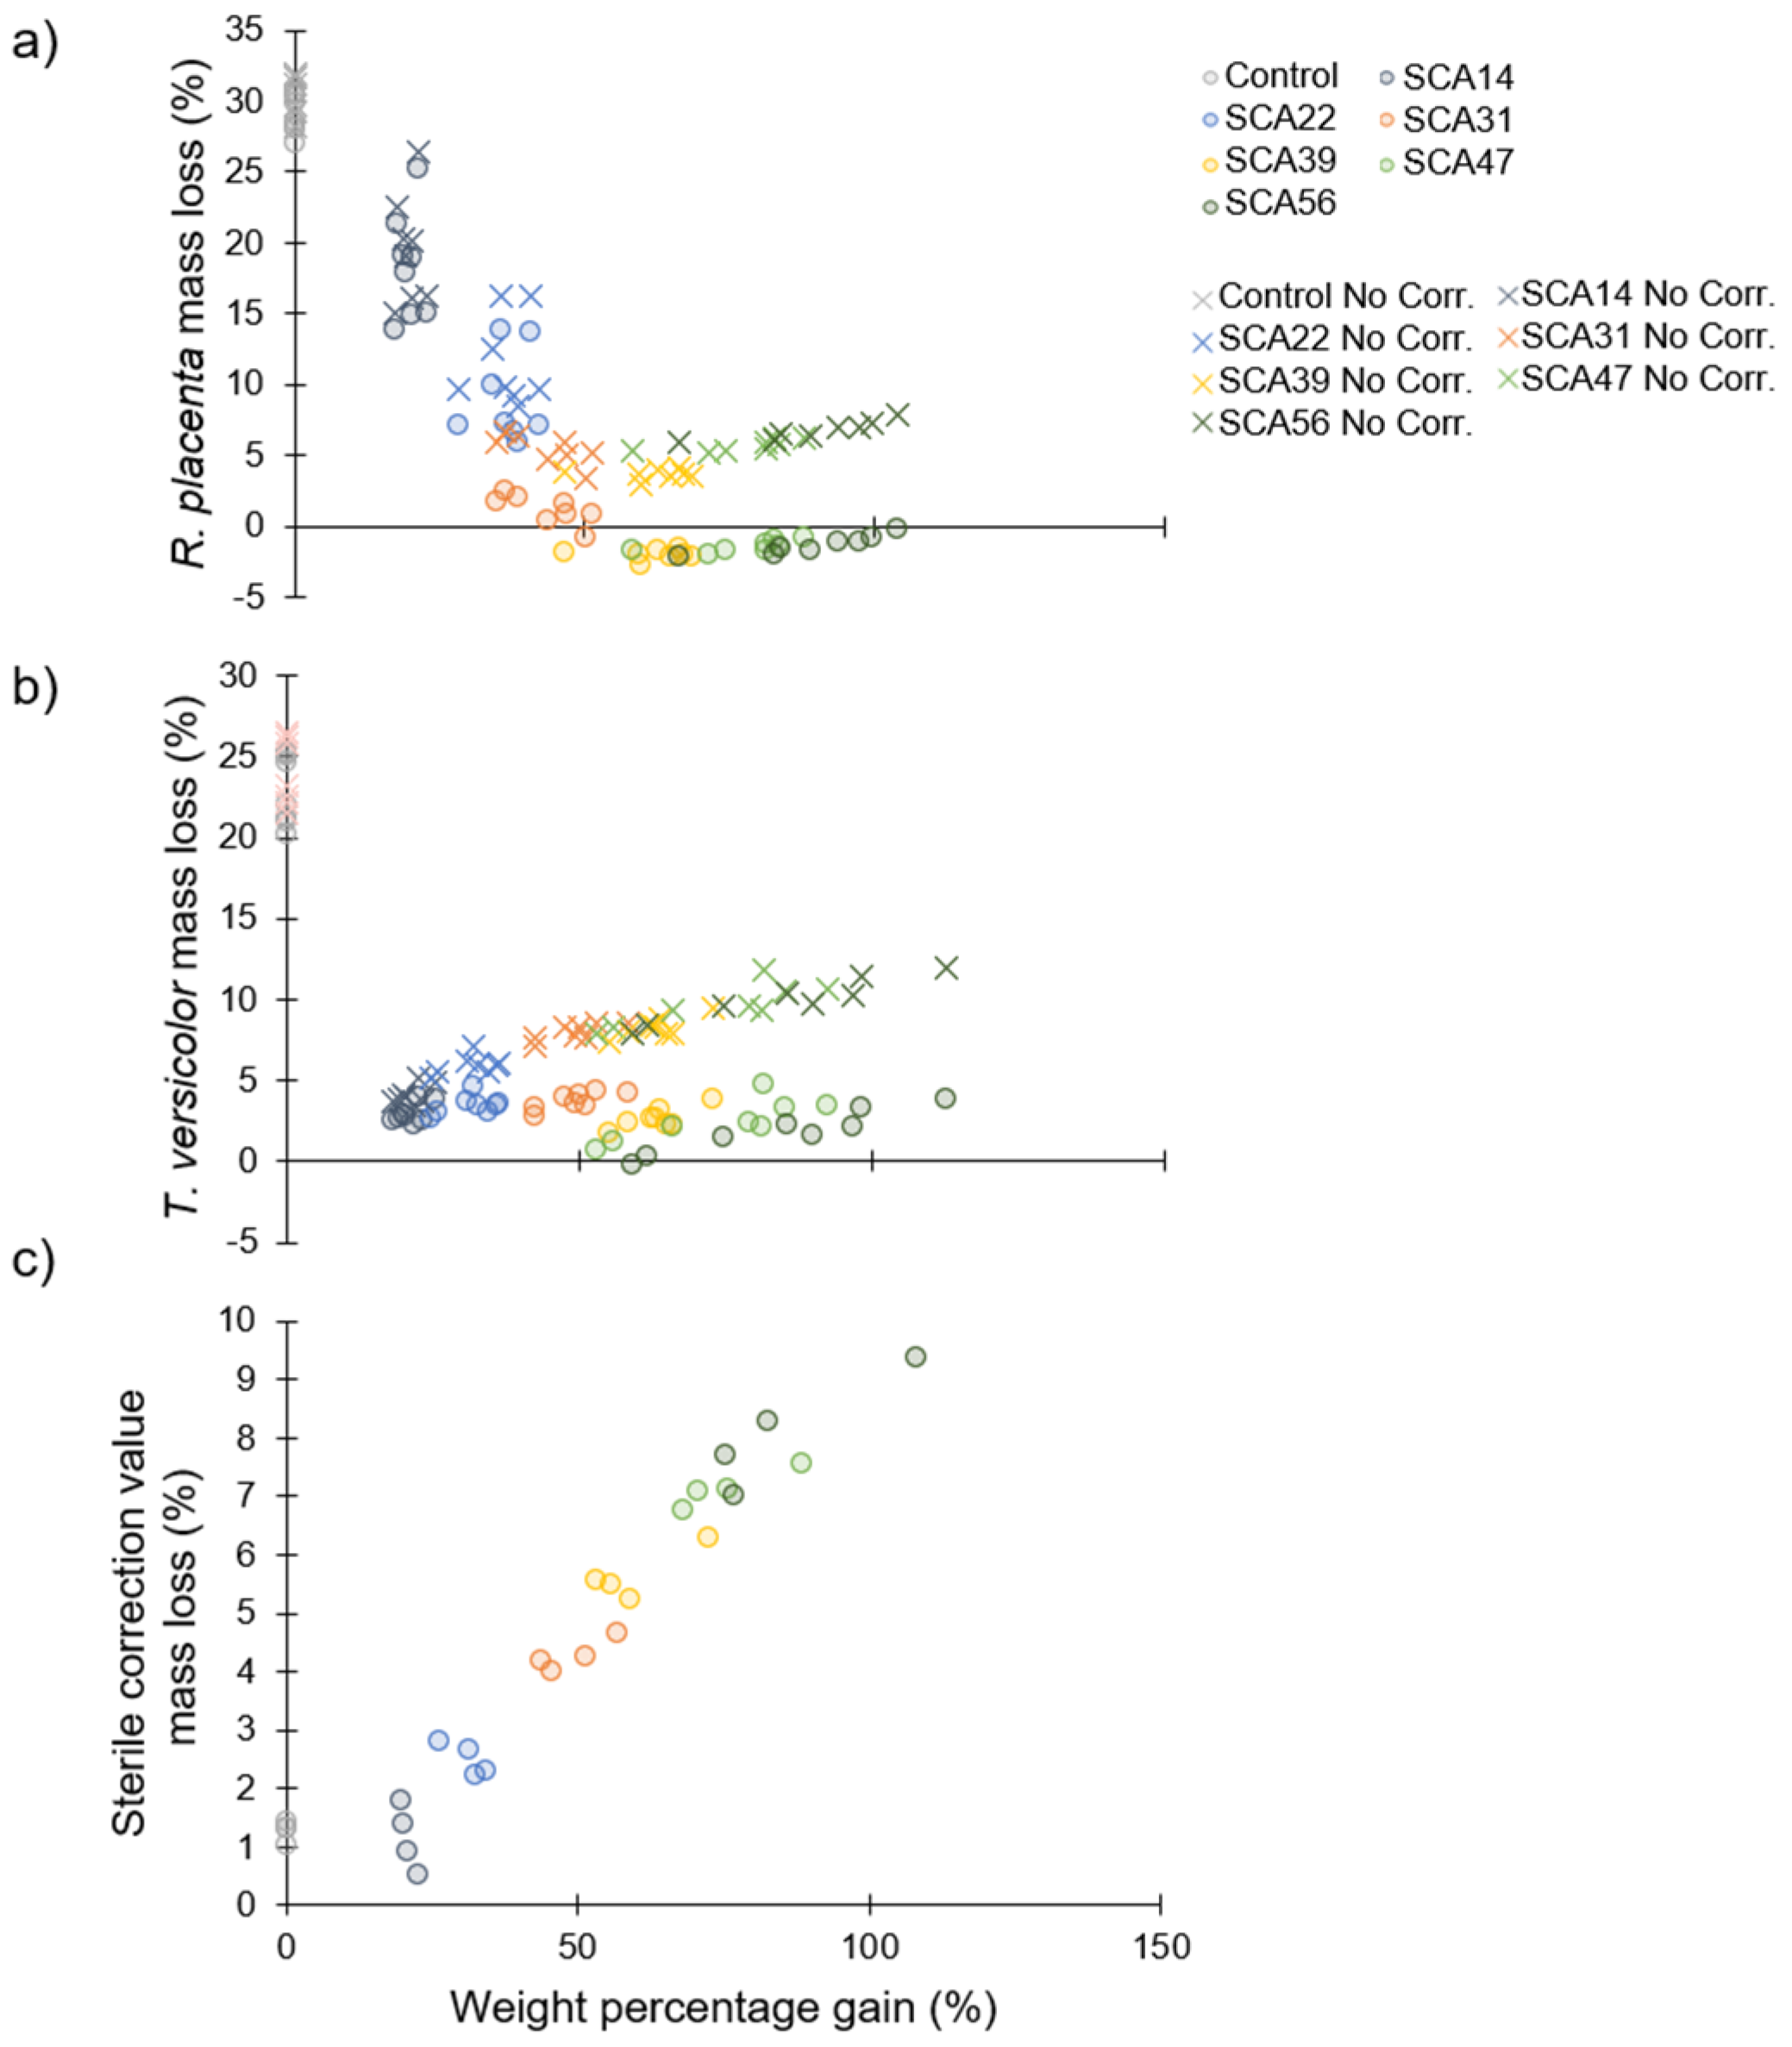
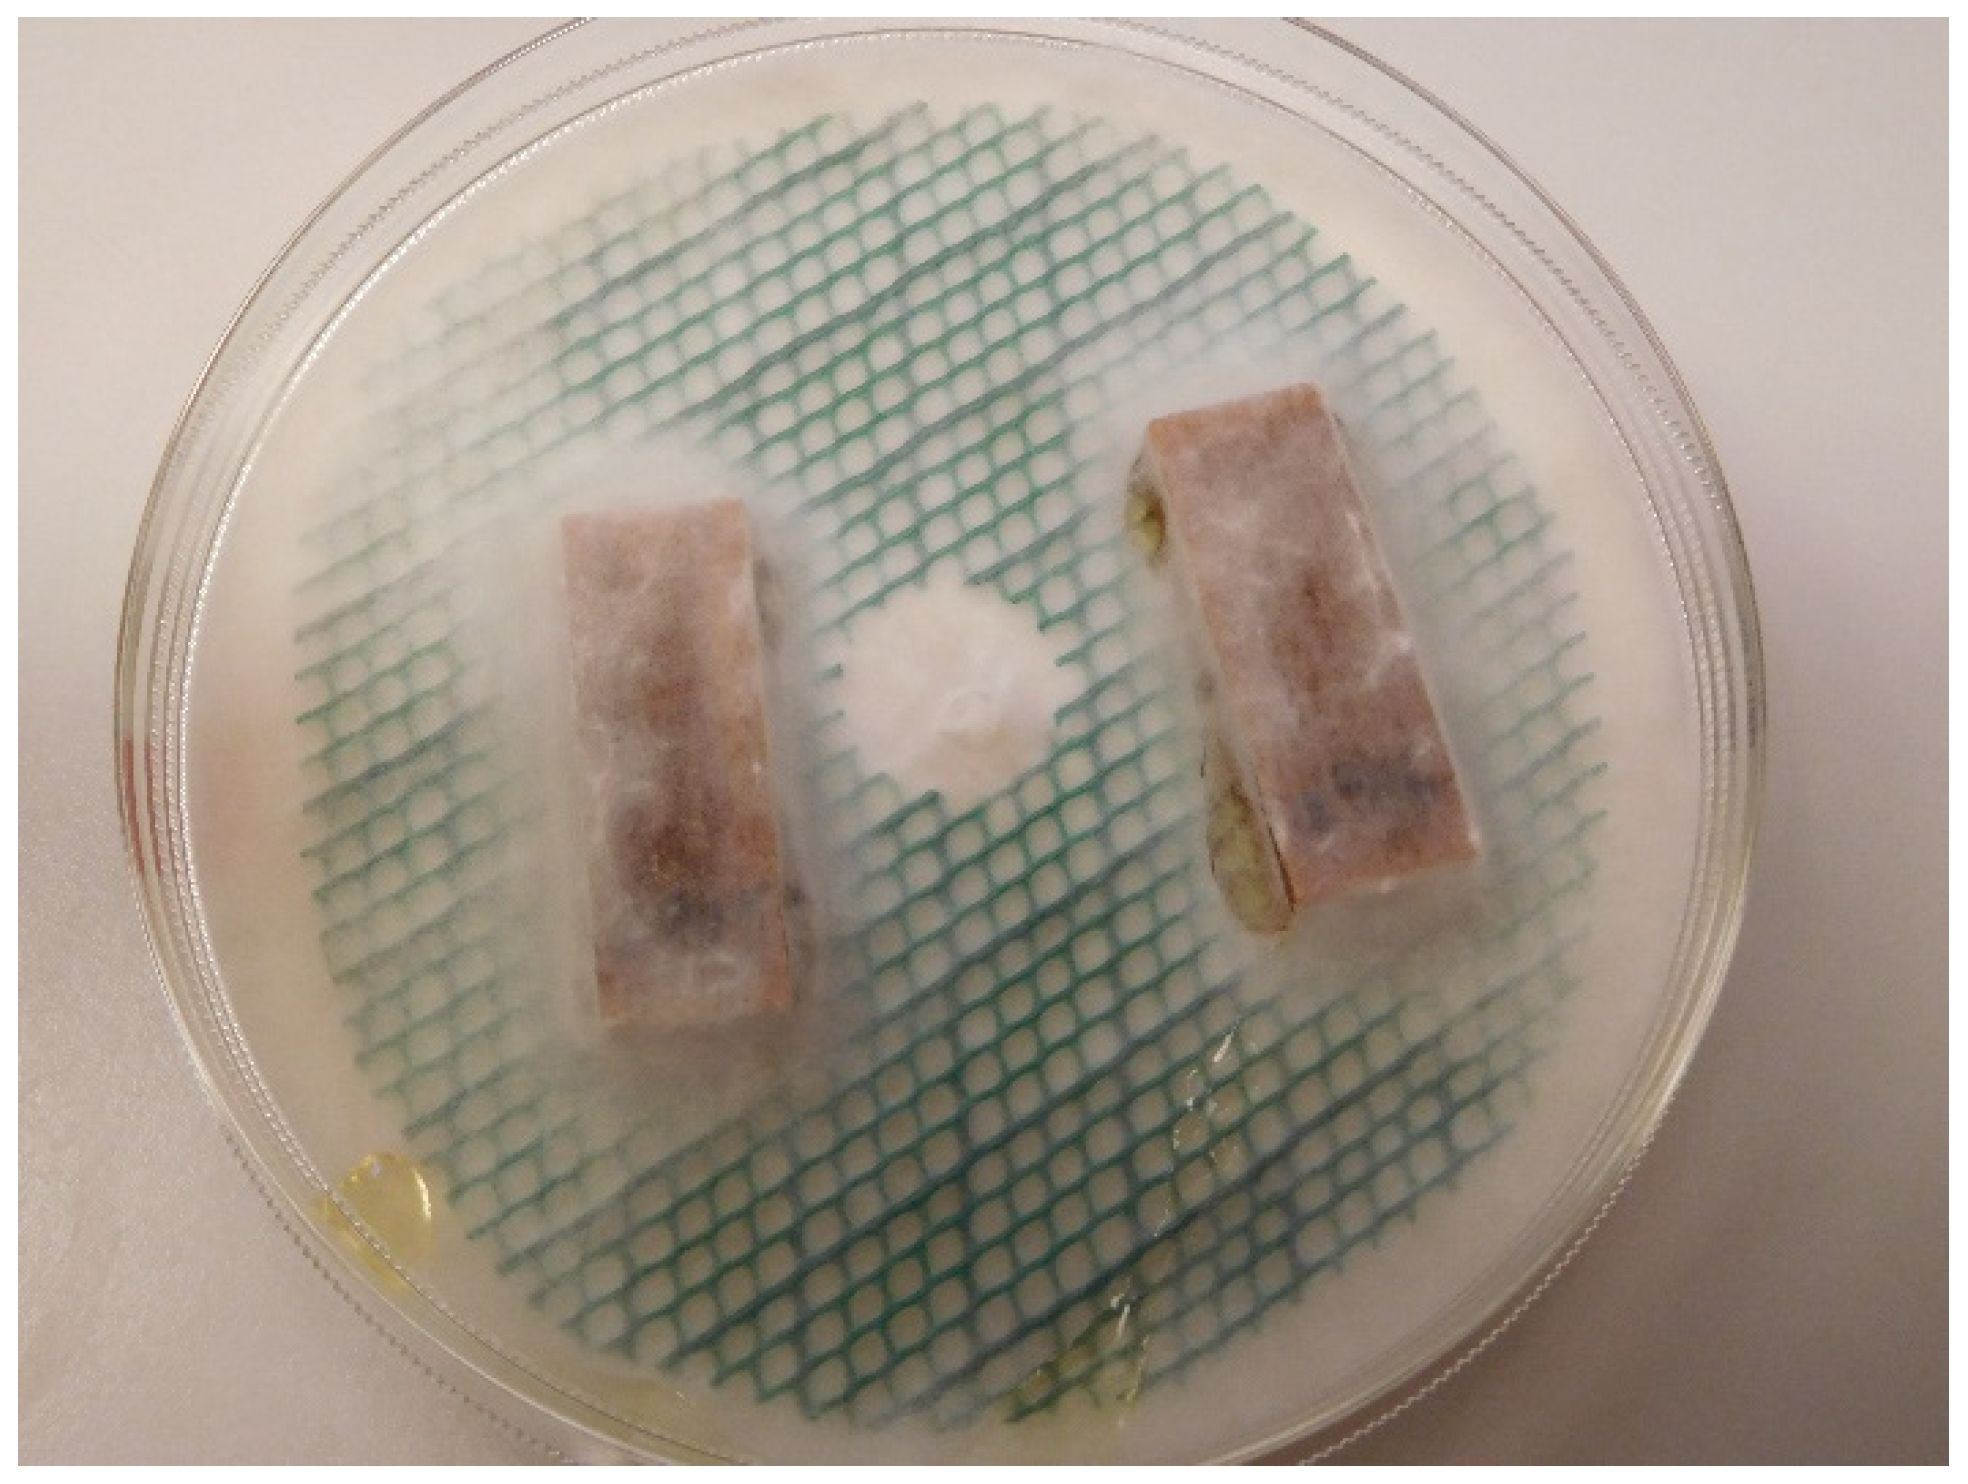
Resistance to fungal decay as a function of modification intensity is shown in Figure 6. Panels (a) and (b) show mass loss due to R. placenta and T. versicolor degradation, respectively. Green circles show values which have been corrected by reducing the mass loss by the average mass loss during sterile incubation without fungi for the corresponding treatment level (Figure 6c) [58]. Red Xs represent mass loss values with no correction. The large difference between the corrected and uncorrected values for higher levels of modification results from the larger correction values for these treatments (Figure 6c). For brown-rot by R. placenta, there appears to be a protection threshold around 50% WPG at which point mass loss due to fungal degradation is reduced to zero. Although no mass loss (accounting for correction values) was observed for the highest treatment levels, droplets of yellow liquid formed in the petri dishes for the R. placenta samples incubated with the SCA47- and SCA56-modified wood (Figure 7). The white-rot T. versicolor seems to be more aggressive towards the SCA-modified wood and even at the highest WPG levels some mass loss is observed, though values are much lower compared to unmodified samples.

3.6. Preliminary Sorption Experiments

The initial trials to determine hydroxyl accessibility of SCA-modified wood with deuterium exchange failed because the SCA-modified samples did not reach equilibrium during the drying and conditioning steps. The sorption behaviour of the pure SCA polymer was also investigated and results are shown in Figure 8. During both experiments the solid powder had changed phase into a viscous liquid during the 95% RH conditioning step. After the second drying period in the deuterium exchange experiment, the sample re-solidified into a sticky plastic material. Hydroxyl accessibility was calculated using the mass change before and after conditioning and the difference in the molar mass of hydrogen and deuterium [63]. This yielded a hydroxyl accessibility of 83.4 mmol/g for the polymer. From the four-step adsorption isotherm, it can be seen that the sample mass increases substantially between the 60% and 95% RH steps (Figure 8b). This suggests that the phase change of the polymer may take place between these humidity levels.

4. Discussion

The dimensions analysis results reported here (Figure 2) are in agreement with previous work on SCA-modified wood. In this study, the average bulking coefficient for SCA56 was 13.6% ± 0.5. With the same treatment concentration and curing temperature, Larnøy et al. [14] and Mubarok et al. [15] reported bulking coefficients of 11% and 15%, respectively. Mubarok et al. [15] modified European beech wood, so slightly higher values in their study may be explained by the difference in wood species. The bulking coefficient values indicate that the SCA polymerisation has occurred within the wood cell wall and the presence of the SCA polymer restricts the cell wall matrix from shrinking to its original volume in the dry state.
The ASE values in this study ranged from 23–43% (Figure 2b) which is much lower than values reported for other chemical wood modifications, such as acetylation and furfurylation, which generally range from 60–80% at effective treatment levels [26]. Mubarok et al. [15] also reported lower ASE values for SCA-modified wood compared to other wood modifications. They suggested a lower reactivity with wood hydroxyl groups for SCA polymerisation compared to acetylation as a possible justification. However, they did not report the water swollen volume of their samples. As shown in Figure 2c, SCA modification causes super swelling and increases total water swollen volume which reduces ASE. This provides an alternate explanation for lower ASE compared to other modifications. Mubarok et al. [15] also showed that, for samples cured at 140 °C, modification with a solution concentration greater than 30% SCA led to a decrease in ASE, similar to the trend reported here. The decrease in ASE at higher WPG can also be explained by the increased effect of super swelling. The reason for the super swelling is likely related to the acidity of the treatment solution, since increased acidity increases swelling in the wood [64]. Because the polymerisation takes place under super-swollen acidic conditions, it is possible that, once cured, the SCA polymer can force the cell wall matrix to expand beyond its original volume again when saturated with water since the SCA polymer itself is hygroscopic (Figure 8). Alternatively, if the polymer is hydrolysed by water and the hydrolysis products increase acidity or if there is unreacted residual citric acid this could be responsible for the super swelling.
HPLC analysis revealed the presence of citric acid in the leachate of SCA-modified samples. This contradicts results reported in Larnøy et al. [14] where EN84 leachates of SCA-modified wood had negligible citric acid concentration. They used the same wood species, curing temperature and curing time but had a higher SCA solution concentration than the concentrations for samples analysed here. Why a higher SCA solution concentration should lead to less leaching of citric acid is not clear. Perhaps smaller sample dimensions in the current study may explain the higher citric acid concentrations in leachates. Mubarok et al. [15] assessed the pH of leachates and found increased acidity in SCA-modified samples compared to controls. They also demonstrated that samples continued to lose mass due to leaching after an EN84 leaching procedure, as shown in the current study with the 11th and 12th leachates. The slow release of citric acid from the samples may indicate that the SCA polymer is susceptible to hydrolysis. As reported here, the presence of an unknown compound with similar retention time in HPLC analysis to that of sorbitol which also gives signal in UV chromatogram further supports this hypothesis since it is a likely hydrolysis product. Additional chemical characterisation analyses, such as mass spectrometry, are needed to identify this and other compounds in the leachates.
The chemical composition of the SCA-modified wood and polymer were assessed with ATR-FTIR spectroscopy. The pure polymer spectra were similar to those reported in Doll et al. [17], showing strong absorbance at 1730 and 1188 cm−1, attributed to C=O stretching [43,44,45] and C-O stretching [65], respectively. Spectra of SCA-modified wood samples resembled those reported in Mubarok et al. [15], showing increased absorbance at 1730 cm−1 and decreased absorbance between 3000–3500 cm−1. The 1730-cm−1 increase is attributed to the formation of ester bonds and the 3000–3500-cm−1 decrease indicates a decrease in the hydroxyl content of the modified wood. Comparing the ratio of absorbance band intensities is a useful way to quantitively characterise FTIR spectra. The technique has been used to assess chemical changes in wood resulting from modifications such as biological degradation and photodegradation [66,67,68,69,70]. The increase in ester content and decrease in hydroxyl content of SCA-modified samples compared to controls were quantitatively confirmed using the respective peak ratios relative to the lignin peak (Figure 4). Although SCA modification increased the ester/lignin peak ratio of modified samples compared to controls, there was a poor correlation between ester/lignin peak ratio and WPG. A possible explanation may be that the ATR-FTIR measurement only analysed the sample surface whereas WPG represents the bulk material. At the levels assessed here, higher WPGs may not affect the degree of modification on the surface of the sample. In future work, alternative FTIR methods could be used which characterise the bulk material. Pulverizing the modified wood and then using ATR-FTIR to measure the resulting power [70] or using the powder to form a KBr pellet [67,68] are two methods which would represent the bulk material. However, ball milling has been shown to affect sample chemistry [45,71] and these methods are destructive so repeated measurements before and after leaching would not be possible.
The effect of leaching on the modified material was also assessed with ATR-FTIR peak ratios. The hydroxyl content of the SCA-modified samples was significantly higher after leaching which may indicate hydrolysis of the SCA polymer. However, there was no significant effect of leaching on ester content. If hydrolysis leads to a breaking of ester bonds to form hydroxyl groups, the significant increase in hydroxyl content should be accompanied by a decrease in ester content. The absence of this corresponding decrease in ester content suggests the hydroxyl increase is caused by something other than hydrolysis of ester bonds. Perhaps the difference in hydroxyl content for leached and non-leached samples is only due to a difference in moisture content at the time of the ATR-FTIR measurement.
The water-saturated samples were characterised with LFNMR and showed four peaks in the T2 relaxation spectrum. For unmodified wood samples, typically only three peaks are determined which arise from water within the wood structure—one peak with the shortest relaxation time attributed to bound water within the cell wall, another smaller peak attributed to free water in small voids of the wood anatomy (e.g., bordered bits and ray lumina) and a large peak for free water in tracheid lumina [50,51,52,70]. The small fourth peak determined for control samples in the current study (peak 1.5, Figure 5a, Table 3) may be due to the 18 h 140 °C thermal treatment that these samples received, since thermal treatment can cause microcracking within the cell wall [72,73]. Peak 1.5 for the SCA-modified samples is much larger than the control samples with a lower relaxation time. For the SCA-modified samples, this peak may be due to the presence of citric acid or other soluble compound in the free water in the sample (Table 2), since peak areas for free water peaks 2 and 3 were slightly reduced in SCA-modified samples compared to controls (Table 3) and soluble chemicals in water, such as monosaccharides, has been shown to decrease T2 values [74]. Furthermore, this peak disappears in the −22 °C measurement (Figure 5b), supporting the theory that peak 1.5 is associated with free water in SCA-modified samples. Alternatively, peak 1.5 could arise from cell wall cracking, similar to the heat-treated control samples. It seems likely that the stress of bulking and super swelling the cell wall could cause crack formation. In future work, it would be interesting to see the how peak 1.5 develops throughout a leaching procedure and to correlate the peak area with solute concentrations in the leachate. A correlation between peak 1.5 area and leachate concentration would suggest the peak arises from the presence of soluble compounds, whereas a lack of correlation would indicate peak 1.5 should be attributed to cell wall cracking.
SCA modification increased the T2 values for free water in peaks 2 and 3. A similar effect is observed in LFNMR analysis of water saturated acetylated wood [50,70,75,76], thermally modified wood [49,77] and furfurylated wood [75]. The effect is thought to be due to the reduced affinity of water for the modified cell wall surface. Since SCA modification appears to reduce hydroxyl content compared to control samples (Figure 4b), a reduced hydrophilicity for the SCA-modified cell wall is also likely. Both the degree of physical confinement and the chemical attraction for the confining surface will affect T2 relaxation [46]. Whereas chemical interactions with the cell wall surface appears to dominate the T2 relaxation mechanism for free water in SCA-modified wood leading to increased T2 values for peaks 2 and 3, physical confinement seems to play a greater role for water within the cell wall (peak 1). SCA modification reduced T2 values for peak 1, indicating greater physical confinement for water within the cell wall. Along with the bulking coefficients (Figure 2a), this is further evidence that the SCA polymer penetrates the cell wall matrix and fills cell wall pores.
SCA modification increased the non-freezing moisture content calculated with Equation (3). Other wood modifications, such as acetylation and thermal modification, have been shown to reduce non-freezing moisture content determined with LFNMR [49,50,78]. Dieste et al. [40] determined the non-freezing moisture content of DMDHEU modified wood and found the non-freezing moisture content was not significantly different from unmodified wood. SCA modification is like DMDHEU in that both treatments introduce new hydroxyl groups into the wood in addition to replacing hydroxyl groups when crosslinking the wood polymers. Overall, hydroxyl content appears to be slightly reduced in SCA-modified wood (Figure 4b), so the increase in non-freezing moisture content seems unusual. It may be related to the super-swelling effect of the modification (Figure 2c). Although the modification polymer fills cell wall pores and reduces peak 1 T2 relaxation time, the total amount of water contained within the cell wall, i.e., non-freezing water, increases. Thus, the super swelling caused by the acidic conditions during the modification must be great enough such that the cell wall volume occupied by the SCA polymer is outweighed by the volume added by the effect of the swelling. On the other hand, it may not be acidic conditions during the polymerisation which are responsible for super swelling, but rather acidic groups on the polymer itself within the SCA-modified cell wall. The presence of unreacted carboxylic acid groups on the SCA polyester may drive additional water into the cell wall, as it has been demonstrated that acid groups led to greater water uptake in lignocellulosic materials [79].
The decay test results determined in this study agree with those reported in the literature. As in Larnøy et al. [14] and Mubarok et al. [15], SCA modification increased resistance to brown-rot and white-rot fungi with slightly higher mass losses observed for white-rot compared to brown-rot (Figure 6a,b). Mubarok et al. [15] found a treatment threshold of 30% SCA solution concentration was sufficient to provide a “very durable” classification based on EN350. This corresponds well with the 50% WPG protection threshold found in the present study. Neither of these studies report correction values determined for sterile references, although Larnøy et al. mention that corrected mass loss values were used. The substantial mass losses shown here for sterile samples incubated without fungi (Figure 6c) indicate that something leaches from the samples that is not the result of fungal decay. The environment in the closed petri dish above malt agar may be above the RH level required to liquify/hydrolyse the SCA polymer (Figure 8). Thus, leached hydrolysis products may account for the mass loss observed for the correction value samples. For R. placenta incubated with SCA-modified wood at the highest treatment levels, yellow droplets formed both on the surface of the wood samples and further away from the wood (Figure 7). This may indicate that the fungus is able to translocate hydrolysis products out of the wood sample. Ostrofsky et al. [80] have demonstrated that R. placenta is able to translocate iron and aluminum cations into wood and synchrotron-based x-ray fluorescence microscopy results from Zelinka et al. [81] suggest R. placenta can translocate copper ions. Perhaps the fungus is also able to move the acidic hydrolysis products out of the wood. The presence of acids in the SCA-modified wood may also play a role in providing decay protection since citric and other organic acids have been shown to hinder fungal growth [82,83,84,85]. However, residual acid in the wood may present a potential hazard of this technology whereby acidity drives cellulose depolymerisation over the long term, destroying the mechanical integrity of the wood [86].

5. Conclusions

SCA modification shows promise as a chemical wood modification technique. However, hydrolysis of the SCA polyester and prolonged leaching of unreacted citric acid and/or hydrolysis products remains an issue. Low levels of citric acid continued to leach from samples after an EN84 leaching procedure. Mubarok et al. [15] demonstrated that increasing the curing temperature from 140 to 160 °C will reduce leaching. However, the use of a higher curing temperature would make commercialisation and industrial application more difficult. The interplay between curing temperature and duration and their effect on leachability could be explored further in future work. Moreover, the use of catalysts (such as sulfuric acid) and other reagents (such as polyols other than sorbitol) could be investigated to increase the stability of the polyester in high humidity. A decay protection threshold is achieved with SCA modification intensity of 50% WPG, accounting for correction values. However, hydrolysis products appear to leach from the highly modified samples resulting in up to 9% mass loss in sterile controls incubated over malt agar. Long-term laboratory decay trials and field tests are necessary to ensure durability performance over an extended time horizon.
SCA modification stands out among other wood modification techniques in that it super swells the wood in the water saturated state. Unlike other modifications, it increases the amount of moisture within the cell wall as determined by LFNMR. Since cell wall moisture content reduction is often cited as the most critical factor for enhancing decay resistance in chemically modified wood [26,27,28], further research into the mechanism of decay protection in SCA-modified wood may shift our understanding of how chemical wood modification inhibits decay more generally. A recent review by Jakes et al. [87] highlights the importance of moisture-induced wood polymer plasticity for diffusion within the cell wall. They propose that water acts a lubricant for the large-scale motion of cell wall polymers which then allows for the diffusion of chemicals within the cell wall, such as fungal degradation agents. In this context, the apparent contradiction between increased cell wall moisture content and enhanced decay resistance in SCA-modified wood may be explained if the combination of the SCA bulking agent and water still limits polymers in the cell wall from engaging in cooperative motion. Thus, it would be interesting in future work to also investigate the plasticity of the wood polymers in SCA-modified wood.

Author Contributions

G.B. conceived and designed the experiments, performed the experiments, analyzed the data and wrote the paper. All authors have read and agreed to the published version of the manuscript.

Funding

This research was funded by Norges Forskningsråd grant number 302072.

Acknowledgments

The author gratefully acknowledges NIBIO researchers Gry Alfredsen, Andreas Treu and Erik Lar nøy for their input in preparing experiments and reviewing the manuscript. NIBIO lab technicians Eva Grodås, Sigrun Kolstad and Monica Fongen are sincerely thanked for their help with dimensional stability measurements, leachate analysis and decay experiments. Lund University Senior Lecturer Maria Fredriksson is also gratefully acknowledged for her help with DVS trials.

Conflicts of Interest

The author declares no conflict of interest. The funders had no role in the design of the study; in the collection, analyses, or interpretation of data; in the writing of the manuscript, or in the decision to publish the results.

References

  1. Regulation (EU) No 528/2012 of the European Parliament and of the Council of 22 May 2012 Concerning the Making Available on the Market and use of Biocidal Products Text with EEA Relevance. 2012, Volume 167. Available online: http://data.europa.eu/eli/reg/2012/528/oj/eng (accessed on 5 May 2020).
  2. Hill, C.A.S. Wood Modification: Chemical, Thermal and Other Processes; John Wiley & Sons: Chichester, UK, 2006; ISBN 978-0-470-02173-6. [Google Scholar]
  3. Sandberg, D.; Kutnar, A.; Mantanis, G. Wood modification technologies—A review. IForest Biogeosci. For. 2017, 10, 895. [Google Scholar] [CrossRef] [Green Version]
  4. Heräjärvi, H.; Kunttu, J.; Hurmekoski, E.; Hujala, T. Outlook for modified wood use and regulations in circular economy. Holzforschung 2020, 74, 334–343. [Google Scholar] [CrossRef]
  5. L’Hostis, C.; Fredon, E.; Thévenon, M.-F.; Santiago-Medina, F.-J.; Gérardin, P. Beech wood treated with polyglycerol succinate: A new effective method for its protection and stabilization. Holzforschung 2020, 74, 351–361. [Google Scholar] [CrossRef] [Green Version]
  6. L’Hostis, C.; Thévenon, M.-F.; Fredon, E.; Gérardin, P. Improvement of beech wood properties by in situ formation of polyesters of citric and tartaric acid in combination with glycerol. Holzforschung 2018, 72, 291–299. [Google Scholar] [CrossRef]
  7. Guo, W.; Xiao, Z.; Wentzel, M.; Emmerich, L.; Xie, Y.; Militz, H. Modification of Scots Pine with Activated Glucose and Citric Acid: Physical and Mechanical Properties. BioResources 2019, 14, 3445–3458. [Google Scholar]
  8. Essoua Essoua, G.G.; Blanchet, P.; Landry, V.; Beauregard, R. Pine wood treated with a citric acid and glycerol mixture: Biomaterial performance improved by a bio-byproduct. BioResources 2016, 11, 3049–3072. [Google Scholar] [CrossRef] [Green Version]
  9. Grosse, C.; Grigsby, W.J.; Noël, M.; Treu, A.; Thévenon, M.-F.; Gérardin, P. Optimizing Chemical Wood Modification with Oligomeric Lactic Acid by Screening of Processing Conditions. J. Wood Chem. Technol. 2019, 39, 385–398. [Google Scholar] [CrossRef]
  10. Mubarok, M.; Hadi, Y.S.; Suryana, J.; Darmawan, W.; Simon, F.; Dumarcay, S.; Gérardin, C.; Gérardin, P. Feasibility study of utilization of commercially available polyurethane resins to develop non-biocidal wood preservation treatments. Eur. J. Wood Wood Prod. 2017, 75, 877–884. [Google Scholar] [CrossRef]
  11. Noël, M.; Grigsby, W.; Vitkeviciute, I.; Volkmer, T. Modifying wood with bio-polyesters: Analysis and performance. Int. Wood Prod. J. 2015, 6, 14–20. [Google Scholar] [CrossRef]
  12. Noël, M.; Grigsby, W.J.; Ormondroyd, G.A.; Spear, M.J. Influence of water and humidity on chemically modifying wood with polybutylene succinate bio-polyester. Int. Wood Prod. J. 2016, 7, 80–88. [Google Scholar] [CrossRef] [Green Version]
  13. Berube, M.-A.; Schorr, D.; Ball, R.J.; Landry, V.; Blanchet, P. Determination of In Situ Esterification Parameters of Citric Acid-Glycerol Based Polymers for Wood Impregnation. J. Polym. Environ. 2018, 26, 970–979. [Google Scholar] [CrossRef]
  14. Larnøy, E.; Karaca, A.; Gobakken, L.R.; Hill, C.A.S. Polyesterification of wood using sorbitol and citric acid under aqueous conditions. Int. Wood Prod. J. 2018, 9, 66–73. [Google Scholar] [CrossRef] [Green Version]
  15. Mubarok, M.; Militz, H.; Dumarçay, S.; Gérardin, P. Beech wood modification based on in situ esterification with sorbitol and citric acid. Wood Sci. Technol. 2020. [Google Scholar] [CrossRef] [Green Version]
  16. Klaushofer, H.; Berghofer, E.; Steyrer, W. Stärkecitrate—Produktion und anwendungs-technische Eigenschaften. Starch Stärke 1978, 30, 47–51. [Google Scholar] [CrossRef]
  17. Doll, K.M.; Shogren, R.L.; Willett, J.L.; Swift, G. Solvent-free polymerization of citric acid and D-sorbitol. J. Polym. Sci. Part Polym. Chem. 2006, 44, 4259–4267. [Google Scholar] [CrossRef]
  18. Centolella, A.P.; Razor, B.G. Polyesters of Citric Acid and Sorbitol. U.S. Patent US3661955A, 9 May 1972. [Google Scholar]
  19. Palencia, M.S.; Mora, M.A.; Palencia, S.L. Biodegradable Polymer Hydrogels Based in Sorbitol and Citric Acid for Controlled Release of Bioactive Substances from Plants (Polyphenols). Available online: https://www.ingentaconnect.com/content/ben/ccb/2017/00000011/00000001/art00008 (accessed on 6 May 2020).
  20. Barrett, D.G.; Yousaf, M.N. Design and Applications of Biodegradable Polyester Tissue Scaffolds Based on Endogenous Monomers Found in Human Metabolism. Molecules 2009, 14, 4022–4050. [Google Scholar] [CrossRef] [Green Version]
  21. Shogren, R.; Gonzalez, S.; Willett, J.L.; Graiver, D.; Swift, G. Preparation of Sorbitol Citrate Polyesters by Reactive Extrusion and Application as Inhibitors of Calcium Carbonate Precipitation. Available online: https://www.ingentaconnect.com/content/asp/jbmb/2007/00000001/00000002/art00007 (accessed on 6 May 2020).
  22. Geeti, D.K.; Niranjan, K. Environmentally benign bio-based waterborne polyesters: Synthesis, thermal- and bio-degradation studies. Prog. Org. Coat. 2019, 127, 419–428. [Google Scholar] [CrossRef]
  23. Kiljunen, S.; Koski, A.; Kunttu, M.; Valkonen, T. Impregnation of Chemicals into Wood. U.S. Patent EP2485880A1, 15 August 2012. [Google Scholar]
  24. Dix, N.J. Fungal Ecology; Springer Science & Business Media: Berlin, Germany, 2012; ISBN 978-94-011-0693-1. [Google Scholar]
  25. Rayner, A.D.M.; Boddy, L. Fungal Decomposition of Wood. Its Biology and Ecology; John Wiley & Sons Ltd.: Hoboken, NJ, USA, 1988. [Google Scholar]
  26. Thybring, E.E. The decay resistance of modified wood influenced by moisture exclusion and swelling reduction. Int. Biodeterior. Biodegrad. 2013, 82, 87–95. [Google Scholar] [CrossRef]
  27. Zelinka, S.L.; Ringman, R.; Pilgård, A.; Thybring, E.E.; Jakes, J.E.; Richter, K. The role of chemical transport in the brown-rot decay resistance of modified wood. Int. Wood Prod. J. 2016, 7, 66–70. [Google Scholar] [CrossRef]
  28. Ringman, R.; Beck, G.; Pilgård, A. The Importance of Moisture for Brown Rot Degradation of Modified Wood: A Critical Discussion. Forests 2019, 10, 522. [Google Scholar] [CrossRef] [Green Version]
  29. Thybring, E.; Kymäläinen, M.; Rautkari, L. Moisture in modified wood and its relevance for fungal decay. IForest Biogeosciences For. 2018, 11, 418–422. [Google Scholar] [CrossRef]
  30. Phuong, L.X.; Takayama, M.; Shida, S.; Matsumoto, Y.; Aoyagi, T. Determination of the accessible hydroxyl groups in heat-treated Styrax tonkinensis (Pierre) Craib ex Hartwich wood by hydrogen-deuterium exchange and 2H NMR spectroscopy. Holzforschung 2007, 61, 488–491. [Google Scholar] [CrossRef]
  31. Altgen, M.; Willems, W.; Hosseinpourpia, R.; Rautkari, L. Hydroxyl accessibility and dimensional changes of Scots pine sapwood affected by alterations in the cell wall ultrastructure during heat-treatment. Polym. Degrad. Stab. 2018, 152, 244–252. [Google Scholar] [CrossRef]
  32. Popescu, C.-M.; Hill, C.A.S.; Curling, S.; Ormondroyd, G.; Xie, Y. The water vapour sorption behaviour of acetylated birch wood: How acetylation affects the sorption isotherm and accessible hydroxyl content. J. Mater. Sci. 2014, 49, 2362–2371. [Google Scholar] [CrossRef]
  33. Popescu, C.-M.; Hill, C.A.S.; Popescu, M.-C. Water adsorption in acetylated birch wood evaluated through near infrared spectroscopy. Int. Wood Prod. J. 2016, 7, 61–65. [Google Scholar] [CrossRef]
  34. Hill, C.; Popescu, C.M.; Rautkari, L.; Curling, S.; Ormondroyd, G.; Xie, Y.; Jalaludin, Z. The role of hydroxyl groups in determining the sorption properties of modified wood. In Proceedings of the 7th European Conference on Wood Modification, Lisbon, Portugal, 1 January 2014. [Google Scholar] [CrossRef]
  35. Beck, G.; Strohbusch, S.; Larnøy, E.; Militz, H.; Hill, C. Accessibility of hydroxyl groups in anhydride modified wood as measured by deuterium exchange and saponification. Holzforschung 2017, 72. [Google Scholar] [CrossRef]
  36. Thybring, E.E.; Piqueras, S.; Tarmian, A.; Burgert, I. Water accessibility to hydroxyls confined in solid wood cell walls. Cellulose 2020. [Google Scholar] [CrossRef]
  37. Epmeier, H.; Westin, M.; Rapp, A. Differently modified wood: Comparison of some selected properties. Scand. J. For. Res. 2004, 19, 31–37. [Google Scholar] [CrossRef]
  38. Beck, G.; Hill, C.; Cocher, P.M.; Alfredsen, G. Accessibility of hydroxyl groups in furfurylated wood at different weight percent gains and during Rhodonia placenta decay. Eur. J. Wood Wood Prod. 2019, 77, 953–955. [Google Scholar] [CrossRef] [Green Version]
  39. Dieste, A.; Krause, A.; Mai, C.; Militz, H. The calculation of EMC for the analysis of wood/water relations in Fagus sylvatica L. modified with 1,3-dimethylol-4,5-dihydroxyethyleneurea. Wood Sci. Technol. 2010, 44, 597–606. [Google Scholar] [CrossRef] [Green Version]
  40. Dieste, A.; Krause, A.; Mai, C.; Sèbe, G.; Grelier, S.; Militz, H. Modification of Fagus sylvatica L. with 1,3-dimethylol-4,5-dihydroxy ethylene urea (DMDHEU). Part 2: Pore size distribution determined by differential scanning calorimetry. Holzforschung 2009, 63, 89–93. [Google Scholar] [CrossRef]
  41. Dieste, A.; Krause, A.; Militz, H. Modification of Fagus sylvatica (L.) with 1,3-dimethylol-4,5-dihydroxyethylene urea (DMDHEU): Part 1. Estimation of heat adsorption by the isosteric method (Hailwood-Horrobin model) and by solution calorimetry. Holzforschung 2008, 62, 577–583. [Google Scholar] [CrossRef]
  42. CEN European Committee for Standardization. Wood Preservatives—Accelerated Ageing of Treated Wood Prior to Biological Testing—Leaching Procedure; CEN (European Committee for Standardization): Brussels, Belgium, 1996. [Google Scholar]
  43. Faix, O. Classification of lignins from different botanical origins by FT-IR spectroscopy. Holzforschung 1991, 45, 21–28. [Google Scholar] [CrossRef]
  44. Fackler, K.; Stevanic, J.S.; Ters, T.; Hinterstoisser, B.; Schwanninger, M.; Salmén, L. Localisation and characterisation of incipient brown-rot decay within spruce wood cell walls using FT-IR imaging microscopy. Enzyme Microb. Technol. 2010, 47, 257–267. [Google Scholar] [CrossRef] [Green Version]
  45. Schwanninger, M.; Rodrigues, J.C.; Pereira, H.; Hinterstoisser, B. Effects of short-time vibratory ball milling on the shape of FT-IR spectra of wood and cellulose. Vib. Spectrosc. 2004, 36, 23–40. [Google Scholar] [CrossRef]
  46. Mitchell, J.; Stark, S.C.; Strange, J.H. Probing surface interactions by combining NMR cryoporometry and NMR relaxometry. J. Phys. Appl. Phys. 2005, 38, 1950–1958. [Google Scholar] [CrossRef]
  47. Araujo, C.D.; MacKay, A.L.; Hailey, J.R.T.; Whittall, K.P.; Le, H. Proton magnetic resonance techniques for characterization of water in wood: Application to white spruce. Wood Sci. Technol. 1992, 26, 101–113. [Google Scholar] [CrossRef]
  48. Telkki, V.-V.; Yliniemi, M.; Jokisaari, J. Moisture in softwoods: Fiber saturation point, hydroxyl site content, and the amount of micropores as determined from NMR relaxation time distributions. Holzforschung 2013, 67, 291–300. [Google Scholar] [CrossRef]
  49. Kekkonen, P.M.; Ylisassi, A.; Telkki, V.-V. Absorption of Water in Thermally Modified Pine Wood As Studied by Nuclear Magnetic Resonance. J. Phys. Chem. C 2014, 118, 2146–2153. [Google Scholar] [CrossRef]
  50. Beck, G.; Thybring, E.E.; Thygesen, L.G.; Hill, C. Characterization of moisture in acetylated and propionylated radiata pine using low-field nuclear magnetic resonance (LFNMR) relaxometry. Holzforschung 2018, 72, 225–233. [Google Scholar] [CrossRef]
  51. Fredriksson, M.; Thygesen, L.G. The states of water in Norway spruce (Picea abies (L.) Karst.) studied by low-field nuclear magnetic resonance (LFNMR) relaxometry: Assignment of free-water populations based on quantitative wood anatomy. Holzforschung 2016, 71, 77–90. [Google Scholar] [CrossRef] [Green Version]
  52. Cai, C.; Javed, M.A.; Komulainen, S.; Telkki, V.-V.; Haapala, A.; Heräjärvi, H. Effect of natural weathering on water absorption and pore size distribution in thermally modified wood determined by nuclear magnetic resonance. Cellulose 2020, 27, 4235–4247. [Google Scholar] [CrossRef] [Green Version]
  53. Carr, H.Y.; Purcell, E.M. Effects of Diffusion on Free Precession in Nuclear Magnetic Resonance Experiments. Phys. Rev. 1954, 94, 630–638. [Google Scholar] [CrossRef]
  54. Meiboom, S.; Gill, D. Modified Spin-Echo Method for Measuring Nuclear Relaxation Times. Rev. Sci. Instrum. 1958, 29, 688–691. [Google Scholar] [CrossRef] [Green Version]
  55. Claridge, T. High-Resolution NMR Techniques in Organic Chemistry; Elsevier: Amsterdam, The Netherlands, 1999; ISBN 978-0-08-042798-0. [Google Scholar]
  56. Whittall, K.P.; Bronskill, M.J.; Henkelman, R.M. Investigation of analysis techniques for complicated NMR relaxation data. J. Magn. Reson. 1991, 95, 221–234. [Google Scholar] [CrossRef]
  57. Lawson, C.L.; Hanson, R.J. Linear Least Squares with Linear Inequality Constraints; Solving Least Squares Problems; Prentice-Hall: Englewood Cliffs, NJ, USA, 1974. [Google Scholar]
  58. CEN European Committee for Standardization. Wood Preservatives—Test Method for Determining the Protective Effectiveness against Wood Destroying Basidiomycetes—Determination of the Toxic Values; CEN (European Committee for Standardization): Brussels, Belgium, 1996. [Google Scholar]
  59. Bravery, A.F. A Miniaturised Wood-Block Test for the Rapid Evaluation of Wood Preservative Fungicides; Swedish Wood Preservation Institute: Stockholm, Sweden, 1979; pp. 58–65. [Google Scholar]
  60. Sepall, O.; Mason, S.G. Hydrogen exchange between cellulose and water: I. measurement of accessibility. Can. J. Chem. 1961, 39, 1934–1943. [Google Scholar] [CrossRef]
  61. Morrison, J. Deuterium-hydrogen exchange between water and macromolecules: Accessibility of cellulose. Nature 1960, 185, 160–161. [Google Scholar] [CrossRef]
  62. Uimonen, T.; Hautamäki, S.; Altgen, M.; Kymäläinen, M.; Rautkari, L. Dynamic vapour sorption protocols for the quantification of accessible hydroxyl groups in wood. Holzforschung 2020, 74, 412–419. [Google Scholar] [CrossRef] [Green Version]
  63. Pönni, R.; Rautkari, L.; Hill, C.A.S.; Vuorinen, T. Accessibility of hydroxyl groups in birch kraft pulps quantified by deuterium exchange in D2O vapor. Cellulose 2014, 21, 1217–1226. [Google Scholar] [CrossRef]
  64. Mantanis, G.; Young, R.A.; Rowell, R. Swelling of Wood. Part II. Swelling in Organic Liquids. Holzforschung 1994, 48. [Google Scholar] [CrossRef]
  65. Sessa, D.J.; Wing, R.E. Thermochemically-modified soybean and corn protein products with enhanced metal-binding properties. Food Nahr. 1998, 42, 266–268. [Google Scholar] [CrossRef]
  66. Chang, T.-C.; Chang, H.-T.; Wu, C.-L.; Chang, S.-T. Influences of extractives on the photodegradation of wood. Polym. Degrad. Stab. 2010, 95, 516–521. [Google Scholar] [CrossRef]
  67. Pandey, K.K.; Pitman, A.J. FTIR studies of the changes in wood chemistry following decay by brown-rot and white-rot fungi. Int. Biodeterior. Biodegrad. 2003, 52, 151–160. [Google Scholar] [CrossRef]
  68. Pandey, K.K.; Nagveni, H.C. Rapid characterisation of brown and white rot degraded chir pine and rubberwood by FTIR spectroscopy. Holz als Roh-und Werkstoff 2007, 65, 477–481. [Google Scholar] [CrossRef]
  69. Pandey, K.K. A note on the influence of extractives on the photo-discoloration and photo-degradation of wood. Polym. Degrad. Stab. 2005, 87, 375–379. [Google Scholar] [CrossRef]
  70. Beck, G.; Thybring, E.E.; Thygesen, L.G. Brown-rot fungal degradation and de-acetylation of acetylated wood. Int. Biodeterior. Biodegrad. 2018, 135, 62–70. [Google Scholar] [CrossRef]
  71. Mao, J.; Holtman, K.M.; Scott, J.T.; Kadla, J.F.; Schmidt-Rohr, K. Differences between Lignin in Unprocessed Wood, Milled Wood, Mutant Wood, and Extracted Lignin Detected by 13C Solid-State NMR. J. Agric. Food Chem. 2006, 54, 9677–9686. [Google Scholar] [CrossRef]
  72. Cai, C.; Antikainen, J.; Luostarinen, K.; Mononen, K.; Heräjärvi, H. Wetting-induced changes on the surface of thermally modified Scots pine and Norway spruce wood. Wood Sci. Technol. 2018, 52, 1181–1193. [Google Scholar] [CrossRef]
  73. Andersson, S.; Serimaa, R.; Väänänen, T.; Paakkari, T.; Jämsä, S.; Viitaniemi, P. X-ray scattering studies of thermally modified Scots pine (Pinus sylvestris L.). Holzforschung 2005, 59, 422–427. [Google Scholar] [CrossRef]
  74. Hsieh, C.C.; Cannella, D.; Jørgensen, H.; Felby, C.; Thygesen, L.G. Cellulase Inhibition by High Concentrations of Monosaccharides. J. Agric. Food Chem. 2014, 62, 3800–3805. [Google Scholar] [CrossRef]
  75. Thygesen, L.G.; Elder, T. Moisture in Untreated, Acetylated, and Furfurylated Norway Spruce Monitored During Drying Below Fiber Saturation Using Time Domain NMR. Wood Fiber Sci. 2009, 41, 194–200. [Google Scholar]
  76. Thybring, E.E.; Kymäläinen, M.; Rautkari, L. Experimental techniques for characterising water in wood covering the range from dry to fully water-saturated. Wood Sci. Technol. 2018, 52, 297–329. [Google Scholar] [CrossRef] [Green Version]
  77. Javed, M.A.; Kekkonen, P.M.; Ahola, S.; Telkki, V.-V. Magnetic resonance imaging study of water absorption in thermally modified pine wood. Holzforschung 2015, 69, 899–907. [Google Scholar] [CrossRef]
  78. Hiltunen, S.; Mankinen, A.; Javed, M.A.; Ahola, S.; Venäläinen, M.; Telkki, V.-V. Characterization of the decay process of Scots pine caused by Coniophora puteana using NMR and MRI. Holzforschung 2020, 1. [Google Scholar] [CrossRef]
  79. Berthold, J.; Rinaudo, M.; Salmeń, L. Association of water to polar groups; estimations by an adsorption model for ligno-cellulosic materials. Colloids Surf. Physicochem. Eng. Asp. 1996, 112, 117–129. [Google Scholar] [CrossRef]
  80. Ostrofsky, A.; Jellison, J.; Smith, K.T.; Shortle, W.C. Changes in cation concentrations in red spruce wood decayed by brown rot and white rot fungi. Can. J. For. Res. 1997, 27, 567–571. [Google Scholar] [CrossRef]
  81. Zelinka, S.L.; Jakes, J.E.; Tang, J.; Ohno, K.; Bishell, A.; Finney, L.; Maxey, E.R.; Vogt, S.; Kirker, G.T. Fungal–copper interactions in wood examined with large field of view synchrotron-based X-ray fluorescence microscopy. Wood Mater. Sci. Eng. 2019, 14, 174–184. [Google Scholar] [CrossRef]
  82. Hassan, R.; El-Kadi, S.; Sand, M. Effect of some organic acids on some fungal growth and their toxins produciton. Int. J. Adv. Biol. 2015, 2, 11. [Google Scholar]
  83. Lawrence, C.L.; Botting, C.H.; Antrobus, R.; Coote, P.J. Evidence of a New Role for the High-Osmolarity Glycerol Mitogen-Activated Protein Kinase Pathway in Yeast: Regulating Adaptation to Citric Acid Stress. Mol. Cell. Biol. 2004, 24, 3307–3323. [Google Scholar] [CrossRef] [Green Version]
  84. Nielsen, M.K.; Arneborg, N. The effect of citric acid and pH on growth and metabolism of anaerobic Saccharomyces cerevisiae and Zygosaccharomyces bailii cultures. Food Microbiol. 2007, 24, 101–105. [Google Scholar] [CrossRef]
  85. Brul, S.; Coote, P. Preservative agents in foods: Mode of action and microbial resistance mechanisms. Int. J. Food Microbiol. 1999, 50, 1–17. [Google Scholar] [CrossRef]
  86. Vom Stein, T.; Grande, P.; Sibilla, F.; Commandeur, U.; Fischer, R.; Leitner, W.; María, P.D. de Salt-assisted organic-acid-catalyzed depolymerization of cellulose. Green Chem. 2010, 12, 1844–1849. [Google Scholar] [CrossRef]
  87. Jakes, J.E.; Hunt, C.G.; Zelinka, S.L.; Ciesielski, P.N.; Plaza, N.Z. Effects of Moisture on Diffusion in Unmodified Wood Cell Walls: A Phenomenological Polymer Science Approach. Forests 2019, 10, 1084. [Google Scholar] [CrossRef] [Green Version]
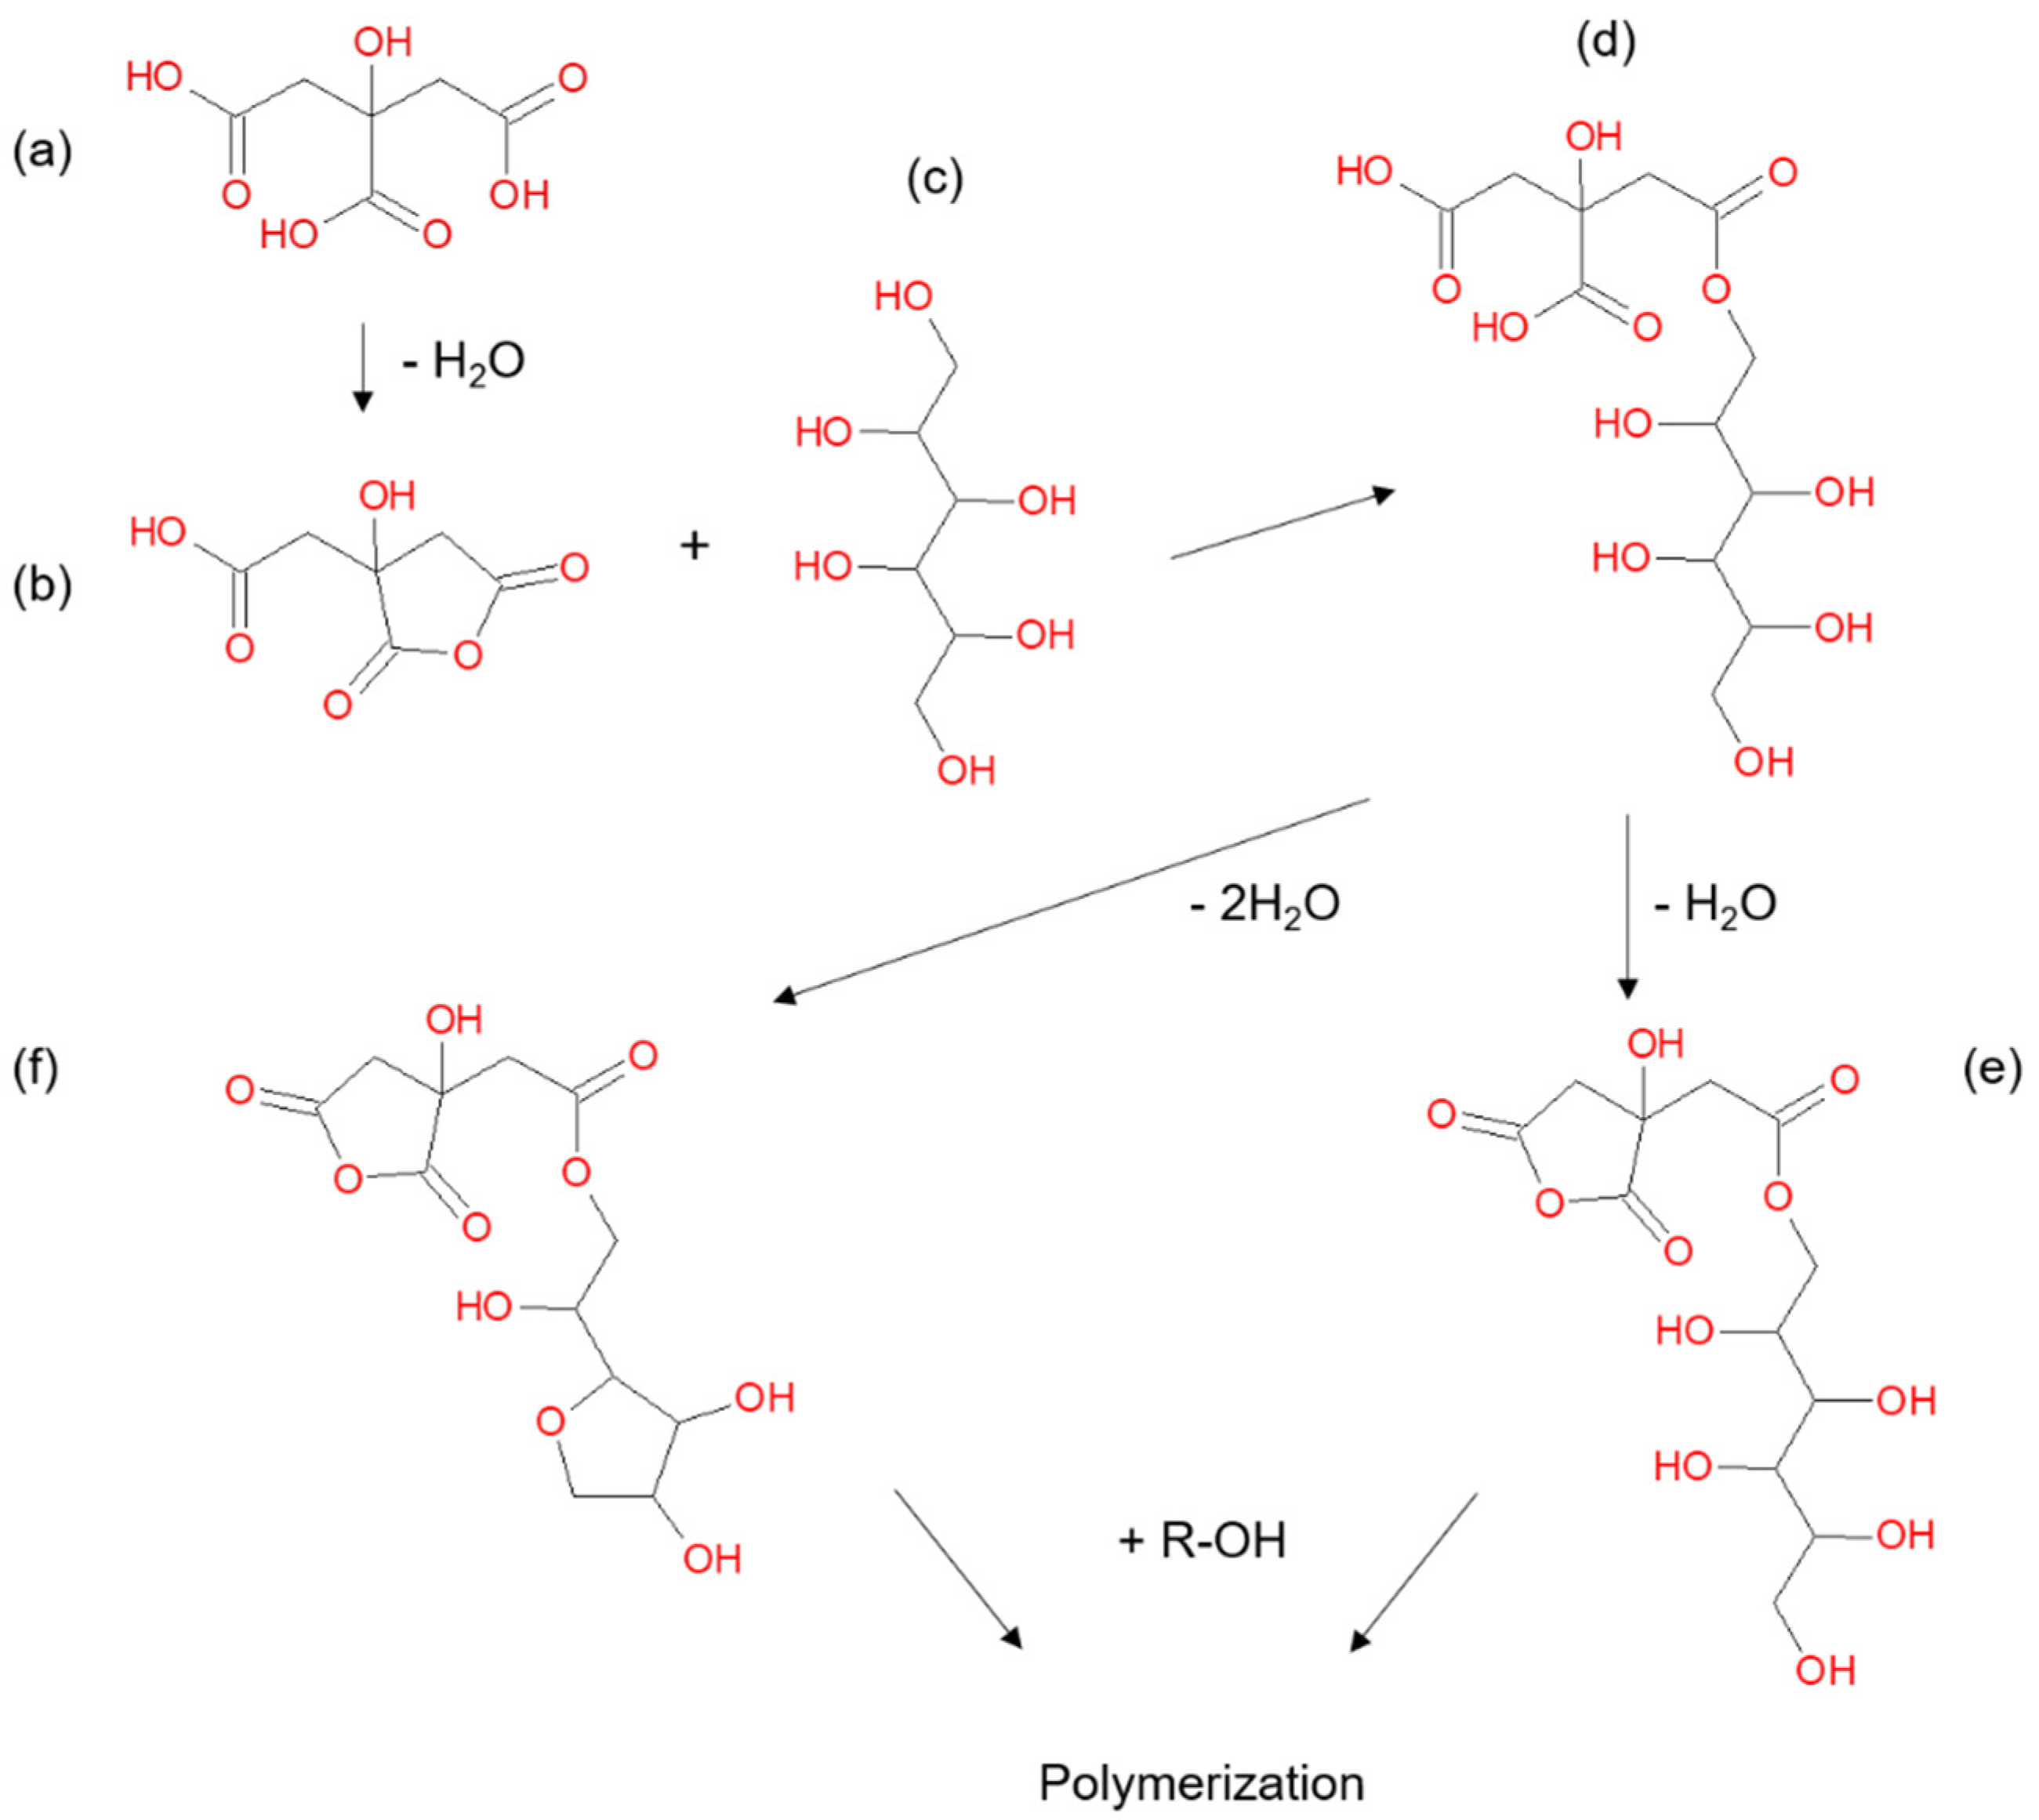
Figure 1. Reaction scheme for polymerisation of citric acid (a) and sorbitol (c) through a cyclic anhydride intermediate (b) to form an ester (d). Further condensation reactions can lead to the formation of another cyclic anhydride (e) and/or anhydrosorbitol ring (f) which undergo further reactions to form a polymerized material. Adapted from Doll et al. [17].
Forests 11 00650 g001
Figure 2. Dimensional changes in sorbitol citric acid modified wood as a function of weight percentage gain. (a) Bulking coefficient; (b) Anti-swelling efficiency; (c) Water swollen volume—note the broken y-axis.
Forests 11 00650 g002
Figure 3. ATR-FTIR spectra of non-leached control wood samples; samples modified with 31% sorbitol citric acid, 39% sorbitol citric acid and pure sorbitol citric acid powder. Solid dark lines represent average spectra for nine replicates for each treatment and lighter shading shows the standard deviation. Note the broken x-axis.
Forests 11 00650 g003
Figure 4. ATR-FTIR peak ratios of leached (triangles) and non-leached (circles) control; 31% sorbitol citric acid and 39% sorbitol citric acid modified samples. (a) Ester peak (1730 cm−1) relative to lignin peak (1508 cm−1); (b) Hydroxyl peak (3325 cm−1) relative to lignin peak (1508 cm−1).
Forests 11 00650 g004
Figure 5. Low-field nuclear magnetic resonance T2 relaxation time distributions of control, 31% sorbitol citric acid and 39% sorbitol citric acid modified samples. Solid dark lines represent average distributions for four replicates for each treatment and lighter shading shows the standard deviation. (a) measurement at 22 °C; (b) measurement at −22 °C.
Forests 11 00650 g005
Figure 6. Mass loss of sorbitol citric acid modified wood as a function of weight percentage gain after eight weeks of exposure in modified EN 113 experiment. (a) Incubation with Rhodonia placenta; (b) Incubation with Trametes versicolor; (c) Sterile samples incubated without fungus used as correction values. Corrected mass loss values in (a,b) are shown with circles while uncorrected values are shown with exes.
Forests 11 00650 g006
Figure 7. SCA56 modified samples incubated with Rhodonia placenta for eight weeks.
Forests 11 00650 g007
Figure 8. Sorption behaviour of pure SCA polymer. (a) Deuterium exchange experiment; (b) adsorption isotherm; Both measurements conducted at 25 °C. The solid green line shows sample mass and the dotted blue line shows relative humidity. Note the secondary y-axis and the broken primary y-axis.
Forests 11 00650 g008
Table 1. Sorbitol citric acid treatment, weight percentage gain, sample dimensions and number of replicates used for the various analyses. Standard deviation in parentheses.
AnalysisConcentration of Treatment Solution (%)Weight Percentage Gain (%) *Dimensions L × T × R (mm)Number of Replicates
Dimensions analysis0−1.0 (0.1)15 × 25 × 2512
Dimensions analysis1416.4 (0.7)15 × 25 × 2512
Dimensions analysis2228.2 (1.0)15 × 25 × 2512
Dimensions analysis3138.7 (1.9)15 × 25 × 2512
Dimensions analysis3950.6 (1.8)15 × 25 × 2512
Dimensions analysis4760.2 (2.9)15 × 25 × 2512
Dimensions analysis5672.0 (2.3)15 × 25 × 2512
ATR-FTIR0−1.49 (0.44)10 × 5 × 59
ATR-FTIR3149.8 (3.2)10 × 5 × 59
ATR-FTIR3964.5 (4.5)10 × 5 × 59
LFNMR/HPLC leachate0−2.6 (0.2)10 × 5 × 54
LFNMR/HPLC leachate3147.6 (3.5)10 × 5 × 54
LFNMR/HPLC leachate3962.5 (4.7)10 × 5 × 54
Decay test00 30 × 5 × 108
Decay test1420.4 (2.2)30 × 5 × 108
Decay test2234.1 (5.0)30 × 5 × 108
Decay test3146.4 (6.3)30 × 5 × 108
Decay test3962.5 (6.0)30 × 5 × 108
Decay test4776.0 (11.9)30 × 5 × 108
Decay test5687.2 (15.4)30 × 5 × 108
* After leaching according to EN 84 for dimensional stability and decay test samples. An 11th leachate was included for ATR-FTIR samples and a 12th for LFNMR/HPLC samples (Table 2). Control decay samples were not heat treated at 140 °C, as were other controls. 8 replicates per fungus.
Table 2. Sorbitol and citric acid concentrations of leachates measured with HPLC. Standard deviation of four replicates in parentheses.
Leachate NumberTime in Leachate (days)Sorbitol Concentration SCA31 (g/L)Sorbitol Concentration SCA39 (g/L)Citric Acid Concentration SCA31 (g/L)Citric Acid Concentration SCA39 (g/L)
210.009 (0.006)0.011 (0.002)0.32 (0.11)0.32 (0.06)
31000.12 (0.05)0.15 (0.01)
41000.07 (0.02)0.08 (0.01)
51000.05 (0.00)0.06 (0.01)
101000.03 (0.00)0.04 (0.00)
117000.12 (0.01)0.15 (0.00)
1221000.27 (0.02)0.28 (0.04)
Table 3. Relative peak areas and peak maximum T2 values for control, 31% sorbitol citric acid and 39% sorbitol citric acid modified samples measured at 22 °C. Standard deviation of four replicates in parentheses.
TreatmentPeak 1Peak 1.5Peak 2Peak 3
Area (%)T2 (ms)Area (%)T2 (ms)Area (%)T2 (ms)Area (%)T2 (ms)
Control21.7 (1.8)1.1 (0.03)0.5 (0.4)5.1 (0.8)11.8 (0.4)19.0 (1.4)66.0 (2.1)82.6 (7.2)
SCA3124.8 (1.6)0.8 (0.02)2.1 (0.6)3.0 (0.6)7.9 (0.4)33.1 (0.9)65.3 (1.5)166.5 (8.4)
SCA3927.2 (0.8)0.8 (0.02)2.4 (0.6)3.2 (0.2)6.9 (0.5)33.7 (3.2)63.4 (1.7)169.0 (10.1)
Table 4. Peak maximum T2 values and non-freezing moisture content for control, 31% sorbitol citric acid and 39% sorbitol citric acid modified samples measured at −22 °C. Standard deviation of four replicates in parentheses.
TreatmentPeak 1 T2 (ms)Non-Freezing Moisture Content (%) *
Control1.05 (0.03)28.0 (0.3)
SCA310.38 (0.02)31.6 (0.8)
SCA390.37 (0.01)35.1 (3.0)
* Mass of non-freezing water relative to unmodified wood mass.